The Real Sector - prod-edxapp.edx-cdn.org to the real sector is the concept of ... generated by a...
25
1 The Real Sector INTRODUCTION INTRODUCTION Real sector refers to real economic transactions of an economy. Main players: • Households • Non-financial corporations • Financial corporations • General government • Rest of the world “This training material is the property of the International Monetary Fund and is intended for use in IMF Institute for Capacity Development courses. Any reuse requires the permission of the IMF. The views expressed in this material are those of the course staff and do not necessarily represent those of the IMF or IMF policy.”
Transcript of The Real Sector - prod-edxapp.edx-cdn.org to the real sector is the concept of ... generated by a...

1
The Real Sector
INTRODUCTIONINTRODUCTION
Real sector refers to real economic transactions of an economy.
Main players:
• Households
• Non-financial corporations
• Financial corporations
• General government
• Rest of the world
“This training material is the property of the International Monetary Fund and is intended for use in IMF Institute for Capacity Development courses. Any reuse requires the permission of the IMF. The views expressed in this material are those of the course staff and do not necessarily represent those of the IMF or IMF policy.”
2
INTRODUCTIONINTRODUCTION
Real Sector Real Sector
VE
S
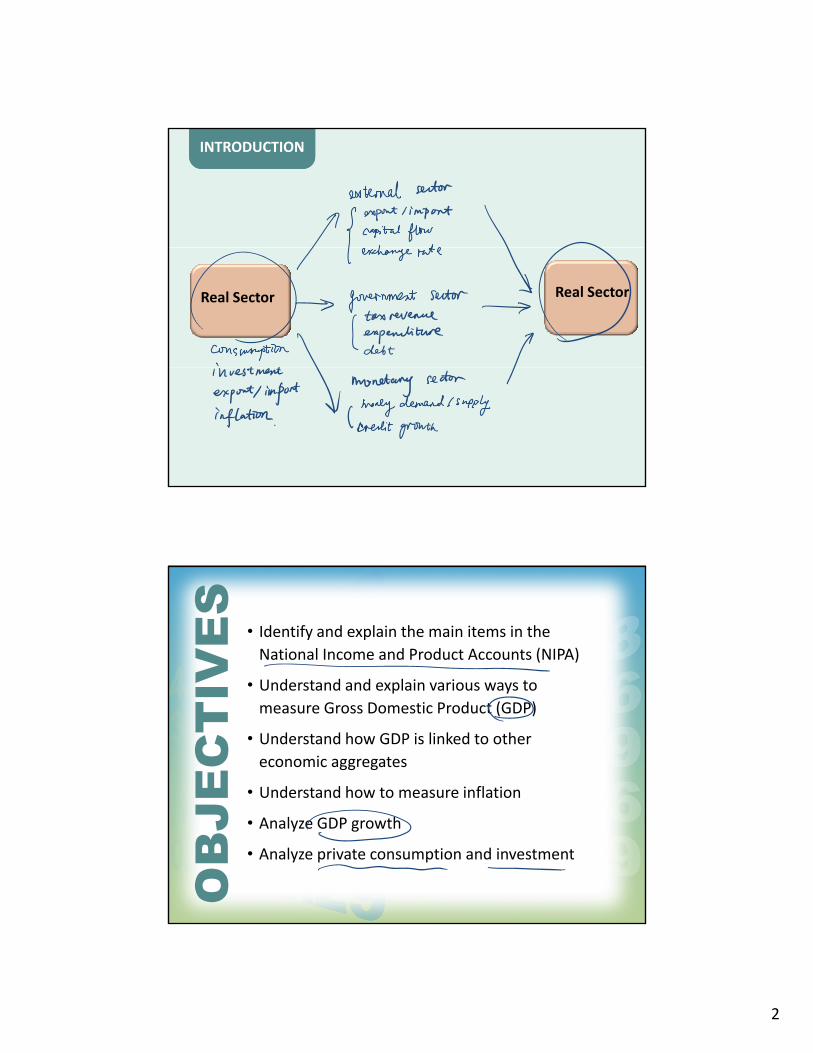
• Identify and explain the main items in the
National Income and Product Accounts (NIPA)
• Understand and explain various ways to
JEC
TI • Understand and explain various ways to
measure Gross Domestic Product (GDP)
• Understand how GDP is linked to other
economic aggregates
• Understand how to measure inflation
OB
J • Analyze GDP growth
• Analyze private consumption and investment
3
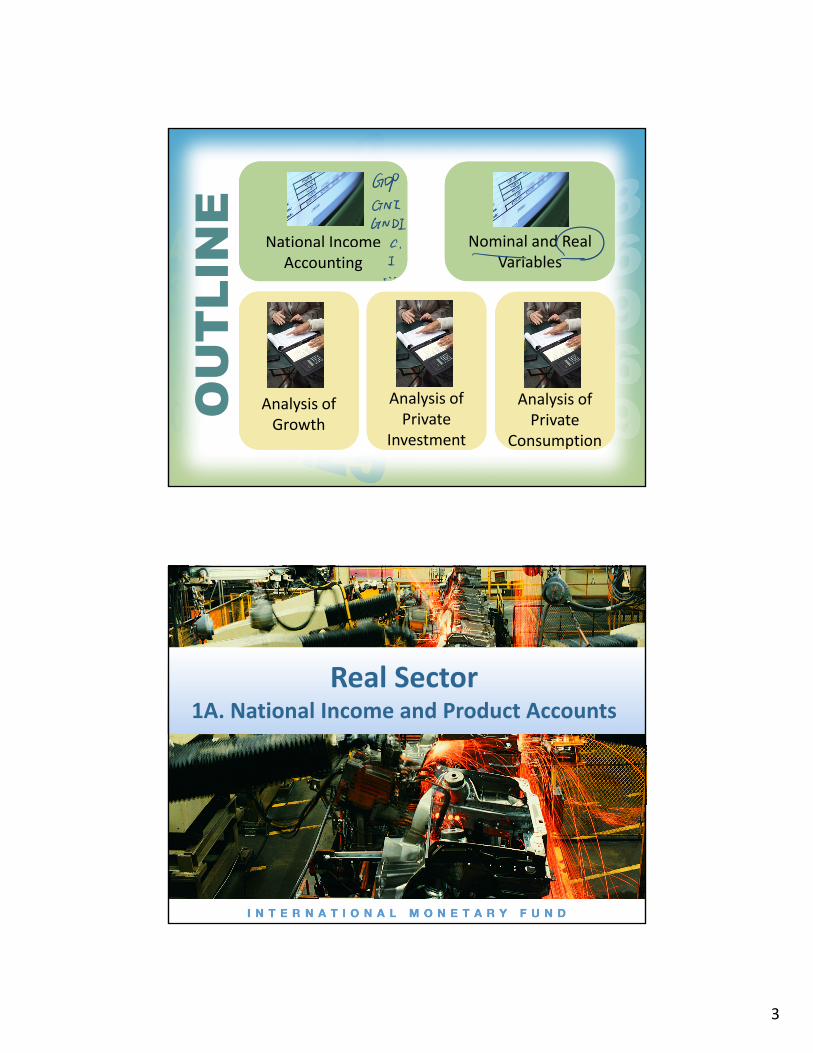
NE
National Income National Income Nominal and Real Nominal and Real U
TLI
N AccountingAccounting VariablesVariables
OU
Analysis of Growth
Analysis of Growth
Analysis of Private
Investment
Analysis of Private
Investment
Analysis of Private
Consumption
Analysis of Private
Consumption
Real SectorReal Sector1A. National Income and Product Accounts
4
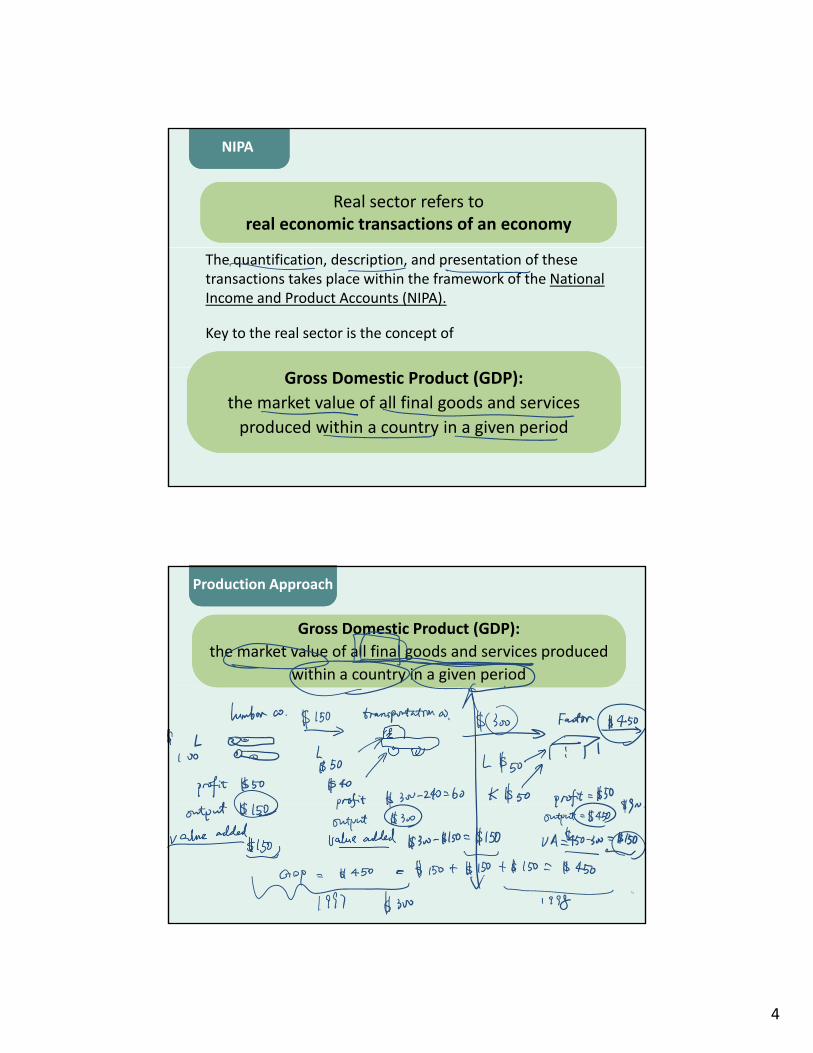
NIPA NIPA
Real sector refers to real economic transactions of an economy
Real sector refers to real economic transactions of an economy
The quantification, description, and presentation of these transactions takes place within the framework of the National Income and Product Accounts (NIPA).
Key to the real sector is the concept of
Gross Domestic Product (GDP):
the market value of all final goods and services
produced within a country in a given period
Gross Domestic Product (GDP):
the market value of all final goods and services
produced within a country in a given period
Production ApproachProduction Approach
Gross Domestic Product (GDP):
the market value of all final goods and services produced
within a country in a given period
Gross Domestic Product (GDP):
the market value of all final goods and services produced
within a country in a given period
5
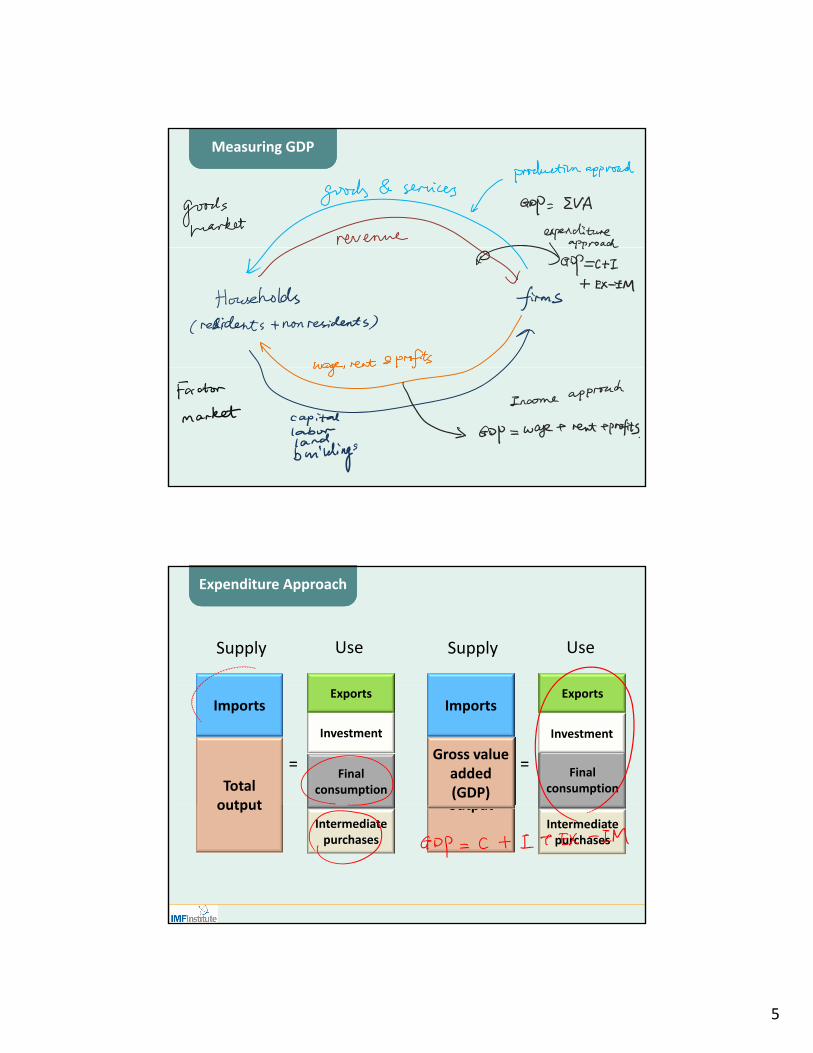
Measuring GDPMeasuring GDP
Supply Use Supply Use
Expenditure ApproachExpenditure Approach
Imports
Total output
Final consumption
Investment
Exports
=
Imports
Total output
Final consumption
Exports
=Gross value
added(GDP)
Investment
outputIntermediate
purchases
outputIntermediate
purchases

6
Income ApproachIncome Approach
The Income Approach adds up the value of all income
generated by a country’s residents:
+ Compensation of employees (W)
+ Gross operating surplus of business (OS) – includes
profits, rent, interest, and so onprofits, rent, interest, and so on
+ Taxes on goods and services less subsidies (TSP)
Measuring GDPMeasuring GDP
GDP=total expenditure = total Production = total income
Product Approach
(seller’s receipts)
sum of value added across sectors (or firms)
Expenditure Approach
(buyer’s payment)
Consumption (C)+ Investment (I)+ Exports (X)
Income Approach
(income generated)
Compensation of employees
+ Gross operating ( )of economy
p ( )– Imports (M) surplus
+ taxes- subsidies

7
Problems Measuring GDPProblems Measuring GDP
1. Some types of output are inaccurately measured, because they are not traded (e.g. public education)
2. Black market economy
3. National accounts do not take externalities into account (e.g. pollution)
4. Some economic activities represent use of resources to offset impact of undesirable activities (e.g. prisons)offset impact of undesirable activities (e.g. prisons)
5. Improvements in quality of goods are not adequately reflected in national accounts (e.g. computer goods)
Real SectorReal Sector1B. Linking GDP to Other Aggregates

8
GNIGNI
• Gross National Income (GNI) measures production or income that is earned using a country’s resources:
GNI = GDP + Factor payments from nonresidents
- Factor payments to nonresidents
GNI = GDP + Factor payments from nonresidents
- Factor payments to nonresidents
• Gross National Disposable Income (GNDI) is the total income available to residents for either final consumption or saving
GNDIGNDI
consumption or saving
GNDI = GNI + Current transfers from nonresidents
- Current transfers to nonresidents
GNDI = GNI + Current transfers from nonresidents
- Current transfers to nonresidents
9
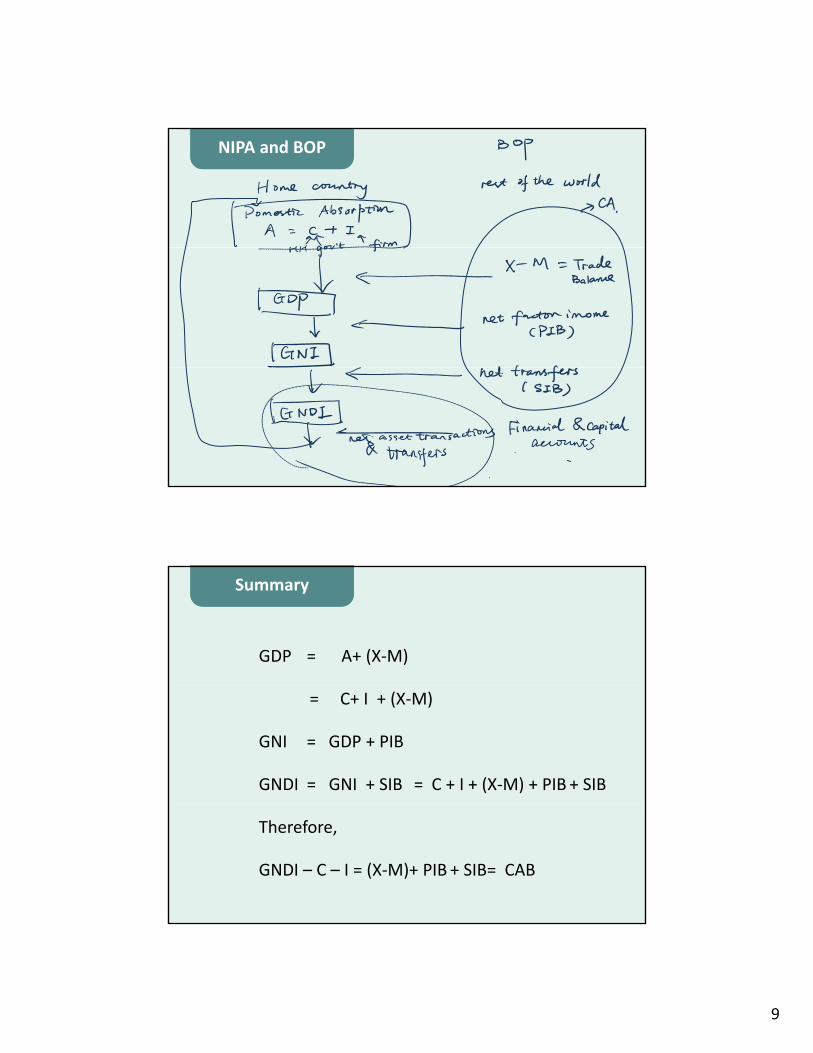
NIPA and BOPNIPA and BOP
GDP = A+ (X-M)
SummarySummary
= C+ I + (X-M)
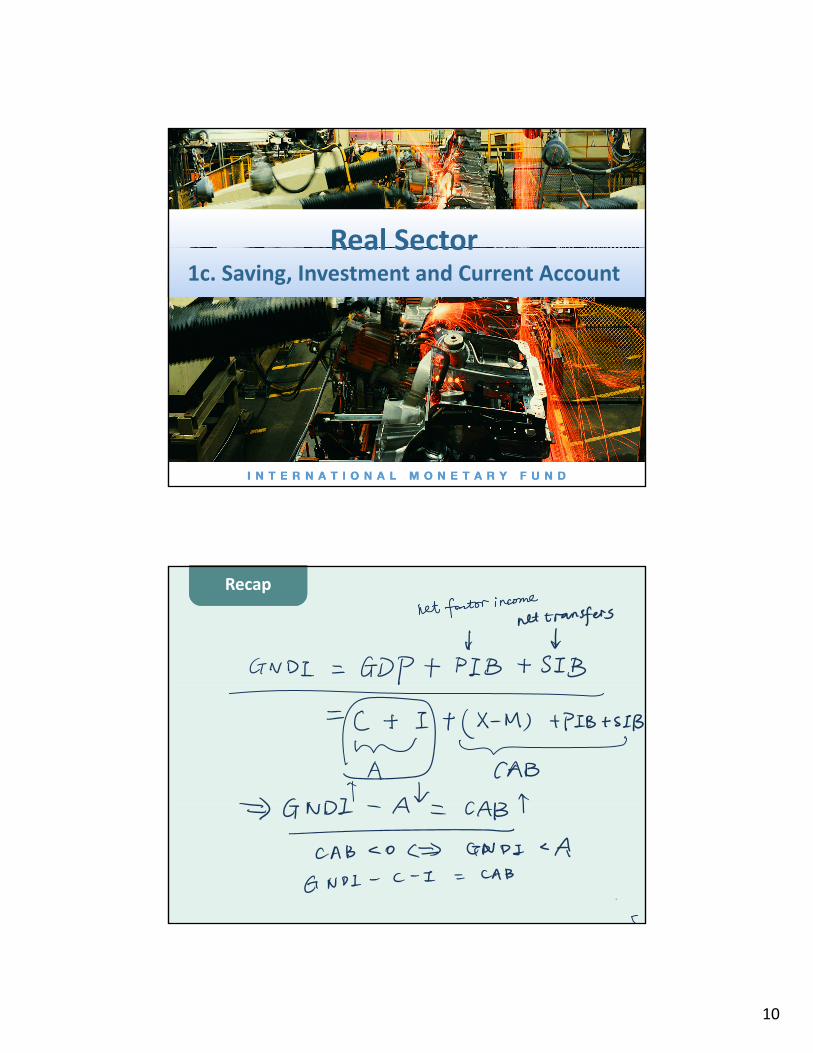
GNI = GDP + PIB
GNDI = GNI + SIB = C + I + (X-M) + PIB + SIB
Therefore,
GNDI – C – I = (X-M)+ PIB + SIB= CAB
10
Real SectorReal Sector1c. Saving, Investment and Current Account
RecapRecap
11
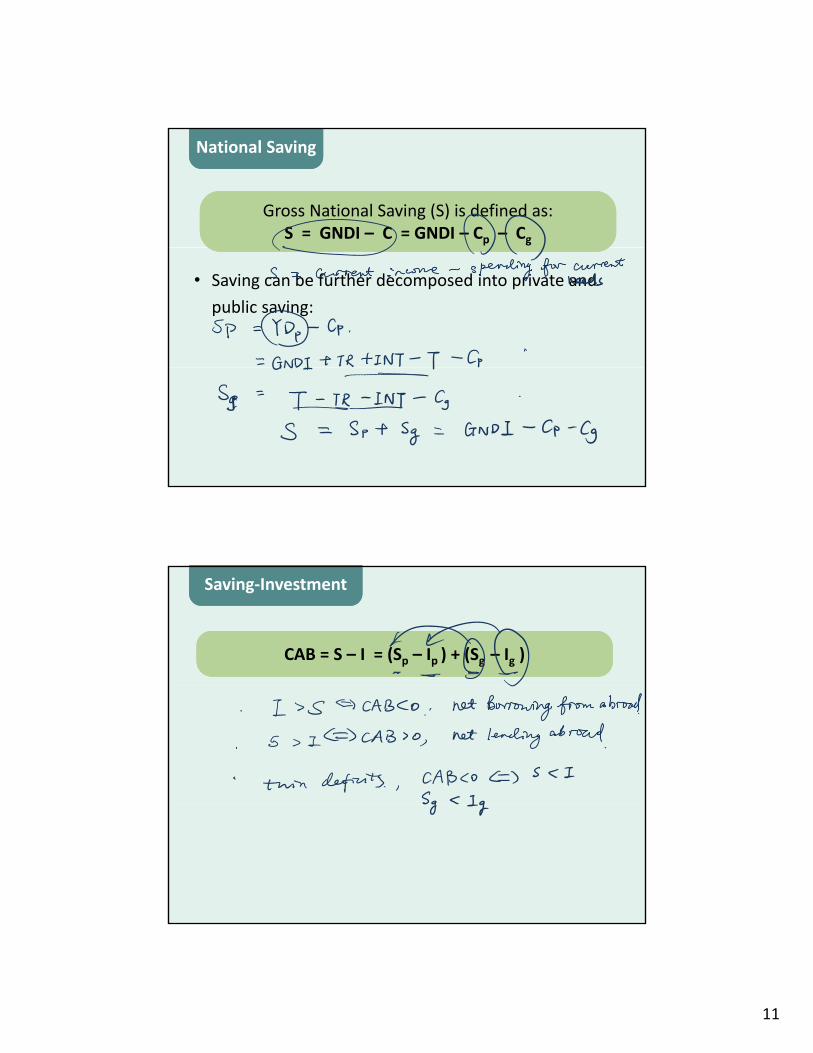
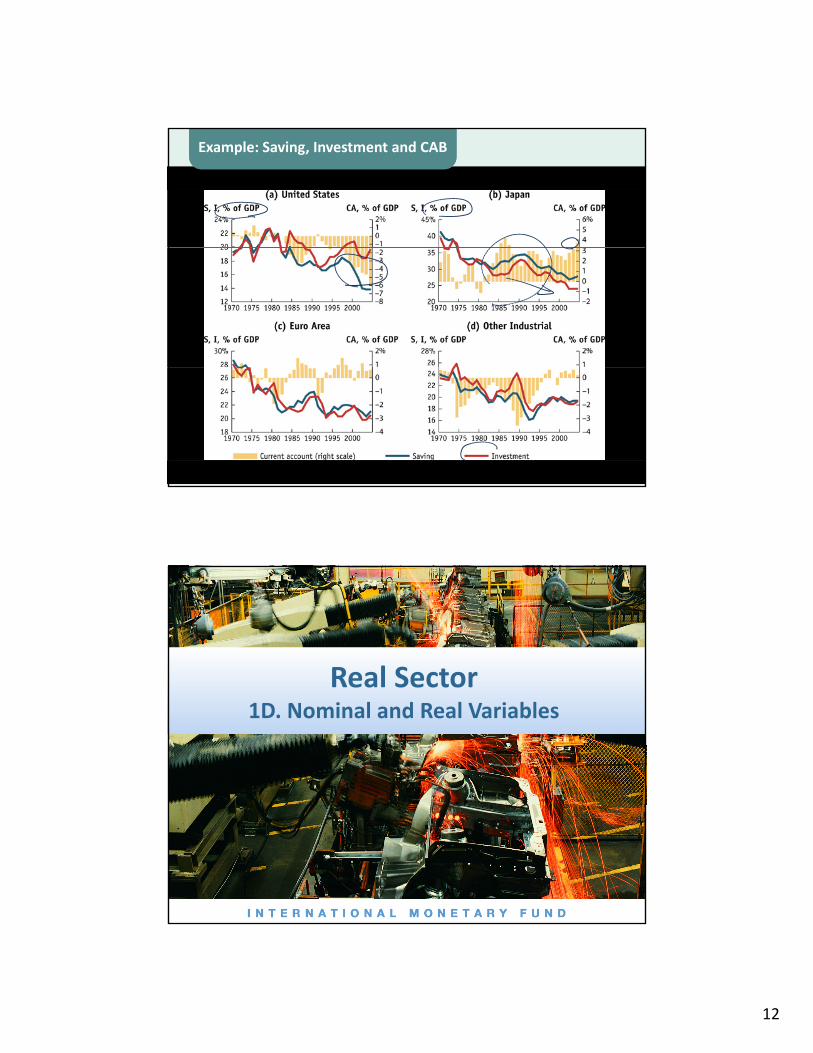
National SavingNational Saving
Gross National Saving (S) is defined as:S = GNDI – C = GNDI – Cp – Cg
Gross National Saving (S) is defined as:S = GNDI – C = GNDI – Cp – Cg
• Saving can be further decomposed into private and
public saving:
Saving-InvestmentSaving-Investment
CAB = S – I = (Sp – Ip ) + (Sg – Ig )CAB = S – I = (Sp – Ip ) + (Sg – Ig )
12
Example: Saving, Investment and CABExample: Saving, Investment and CAB
Real SectorReal Sector1D. Nominal and Real Variables
13
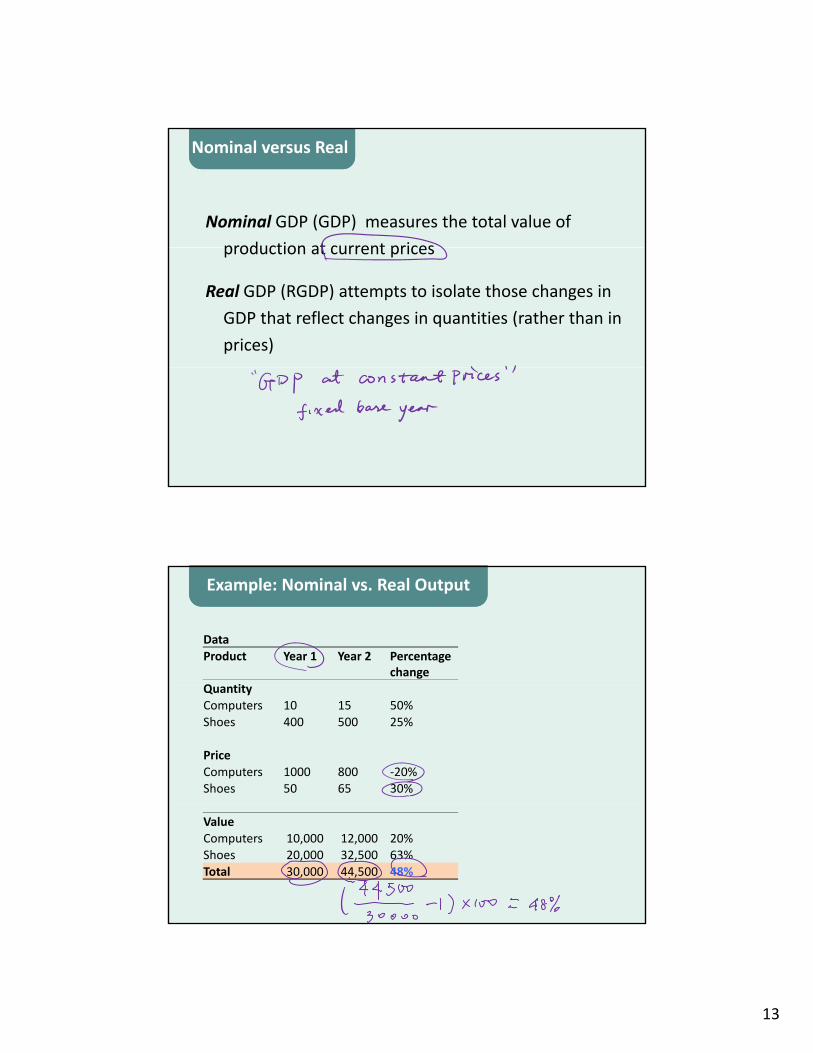
Nominal versus Real Nominal versus Real
Nominal GDP (GDP) measures the total value of
production at current pricesproduction at current prices
Real GDP (RGDP) attempts to isolate those changes in
GDP that reflect changes in quantities (rather than in
prices)
Data
Product Year 1 Year 2 Percentage change
Q tit
Example: Nominal vs. Real OutputExample: Nominal vs. Real Output
QuantityComputers 10 15 50%
Shoes 400 500 25%
Price
Computers 1000 800 -20%Shoes 50 65 30%
ValueComputers 10,000 12,000 20%Shoes 20,000 32,500 63%
Total 30,000 44,500 48%

14
Data
Product Year 1 Year 2 Percentage change
Year 2 Percentage change
Example: Nominal vs. Real OutputExample: Nominal vs. Real Output
QuantityComputers 10 15 50% 15 50%
Shoes 400 500 25% 500 25%
Price
Computers 1000 800 -20% 1000 0%Shoes 50 65 30% 50 0%
ValueComputers 10,000 12,000 20% 15,000 50%Shoes 20,000 32,500 63% 25,000 25%
Total 30,000 44,500 48% 40,000 33%
GDP deflatorGDP deflator
The GDP deflator (PGDP) is an index that measures the average price of goods and services produced
l ti t b
The GDP deflator (PGDP) is an index that measures the average price of goods and services produced
l ti t brelative to a base yearrelative to a base year

15
IllustrationIllustration
Data
Year 1 Year 2 Perc. Year 2 Perc. Year 1 Year 2
Change Change
PriceProduct (quantity)
Price deflator 100
Computers 10 15 50% 15 50%
Shoes 400 500 25% 500 25%
Price
Computers 1000 800 -20% 1000 0%
Shoes 50 65 30% 50 0%
Value
Computers 10,000 12,000 20% 15,000 50%
Shoes 20,000 32,500 63% 25,000 25%
Total 30,000 44,500 48% 40,000 33%
CPICPI
The consumer price index (CPI) measures the cost of a
basket of goods and services purchased by a typical
ho sehold for cons mption in some base period
The consumer price index (CPI) measures the cost of a
basket of goods and services purchased by a typical
ho sehold for cons mption in some base period
01
0 01
= 100
Ni i
ti
Ni i
i
t
p q
CPI
p q
household for consumption in some base period.household for consumption in some base period.
16
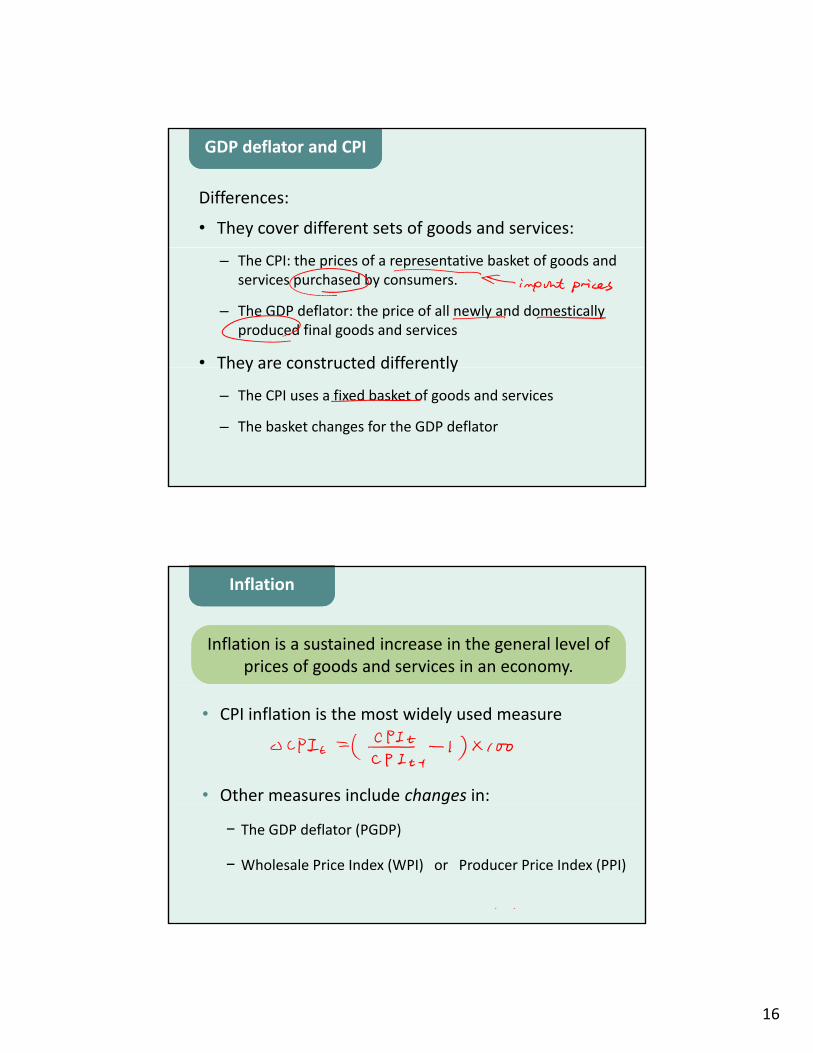
Differences:
• They cover different sets of goods and services:
GDP deflator and CPIGDP deflator and CPI
– The CPI: the prices of a representative basket of goods and services purchased by consumers.
– The GDP deflator: the price of all newly and domestically produced final goods and services
• They are constructed differentlyThey are constructed differently
– The CPI uses a fixed basket of goods and services
– The basket changes for the GDP deflator
InflationInflation
Inflation is a sustained increase in the general level of prices of goods and services in an economy.
Inflation is a sustained increase in the general level of prices of goods and services in an economy.
• CPI inflation is the most widely used measure
• Other measures include changes in:
− The GDP deflator (PGDP)
− Wholesale Price Index (WPI) or Producer Price Index (PPI)
17
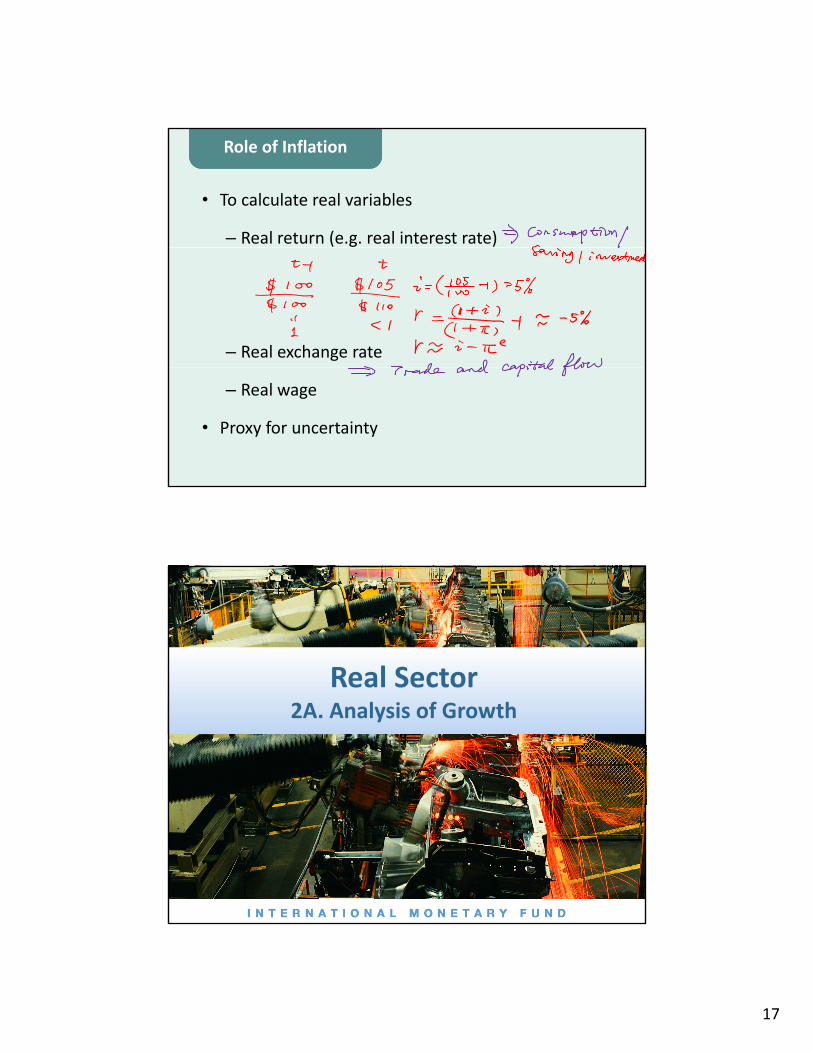
• To calculate real variables
– Real return (e.g. real interest rate)
Role of InflationRole of Inflation
– Real exchange rate
– Real wage
• Proxy for uncertainty
Real SectorReal Sector2A. Analysis of Growth
18
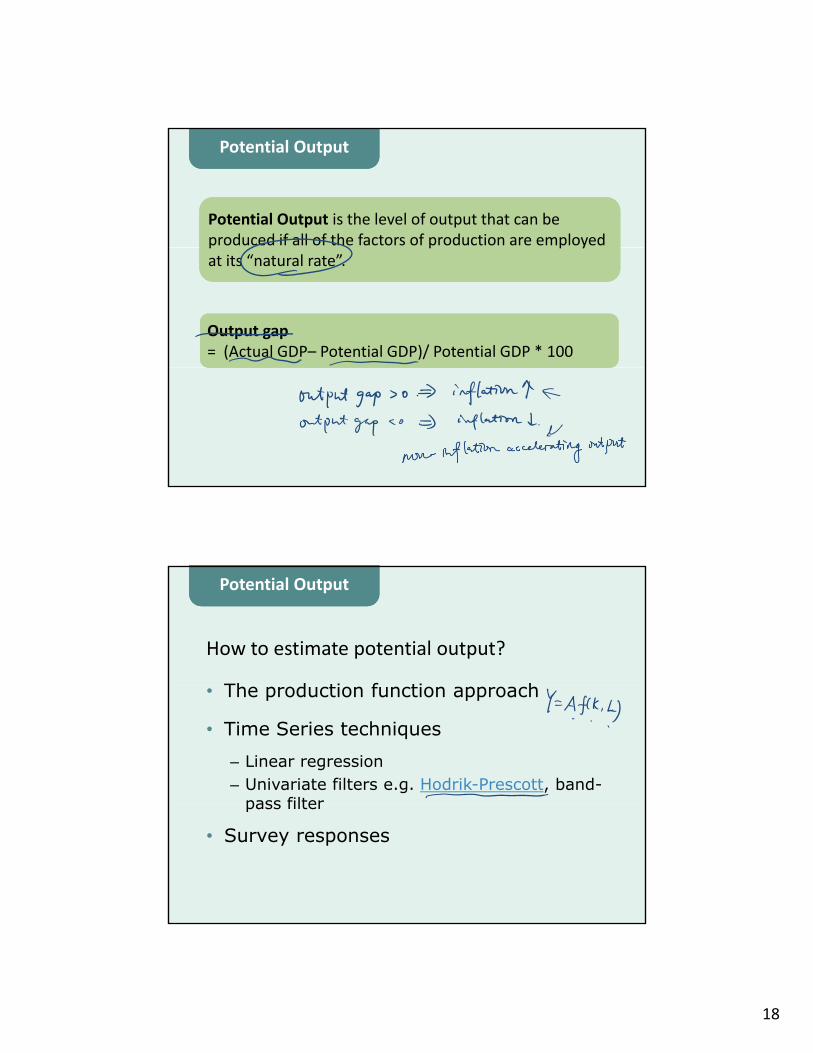
Potential OutputPotential Output
Potential Output is the level of output that can be produced if all of the factors of production are employed Potential Output is the level of output that can be produced if all of the factors of production are employed p p p yat its “natural rate”.p p p yat its “natural rate”.
Output gap = (Actual GDP– Potential GDP)/ Potential GDP * 100Output gap = (Actual GDP– Potential GDP)/ Potential GDP * 100
How to estimate potential output?
Th d ti f ti h
Potential OutputPotential Output
• The production function approach
• Time Series techniques
– Linear regression– Univariate filters e.g. Hodrik-Prescott, band-
pass filterpass filter
• Survey responses
19
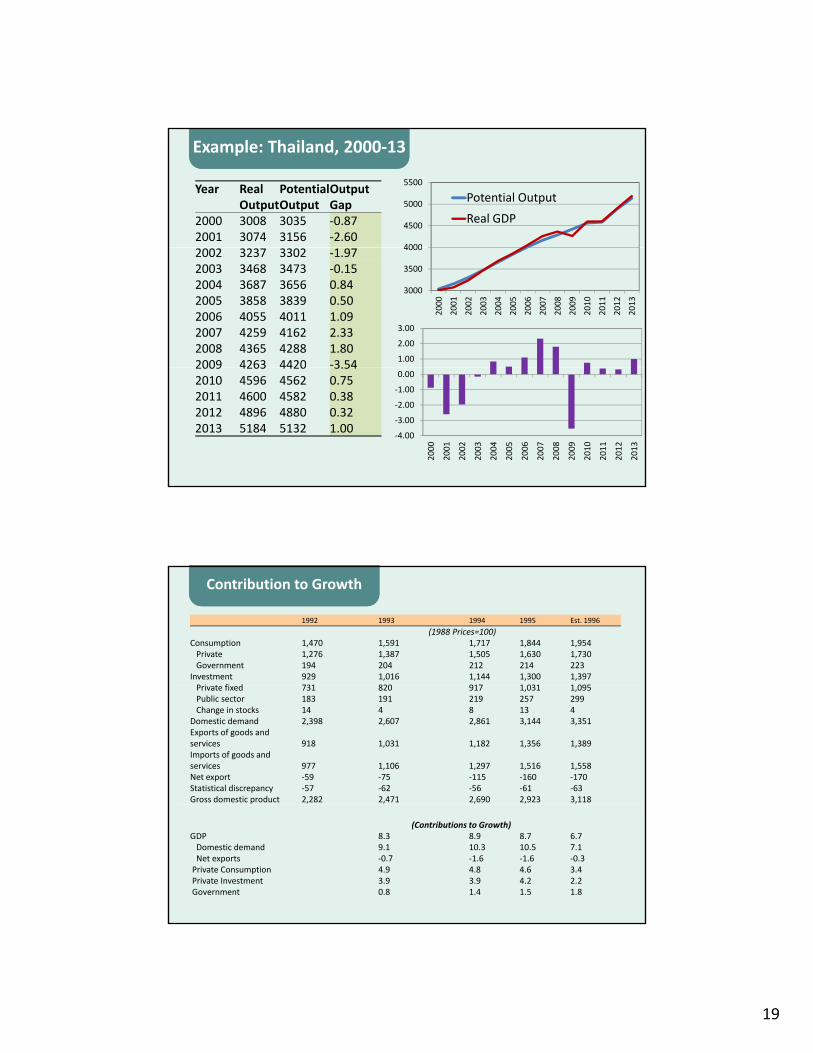
Year Real Potential OutputOutputOutput Gap
2000 3008 3035 -0.872001 3074 3156 -2.60
4000
4500
5000
5500
Potential Output
Real GDP
Example: Thailand, 2000-13Example: Thailand, 2000-13
2002 3237 3302 -1.972003 3468 3473 -0.152004 3687 3656 0.842005 3858 3839 0.502006 4055 4011 1.092007 4259 4162 2.332008 4365 4288 1.802009 4263 4420 -3.54
3000
3500
4000
20
00
20
01
20
02
20
03
20
04
20
05
20
06
20
07
20
08
20
09
20
10
20
11
20
12
20
13
1.00
2.00
3.00
2009 4263 4420 3.542010 4596 4562 0.752011 4600 4582 0.382012 4896 4880 0.322013 5184 5132 1.00
-4.00
-3.00
-2.00
-1.00
0.00
20
00
20
01
20
02
20
03
20
04
20
05
20
06
20
07
20
08
20
09
20
10
20
11
20
12
20
13
Contribution to GrowthContribution to Growth
1992 1993 1994 1995 Est. 1996
(1988 Prices=100)Consumption 1,470 1,591 1,717 1,844 1,954
Private 1,276 1,387 1,505 1,630 1,730Government 194 204 212 214 223
Investment 929 1,016 1,144 1,300 1,397P i t fi d 731 820 917 1 031 1 095Private fixed 731 820 917 1,031 1,095Public sector 183 191 219 257 299Change in stocks 14 4 8 13 4
Domestic demand 2,398 2,607 2,861 3,144 3,351Exports of goods and services 918 1,031 1,182 1,356 1,389Imports of goods and services 977 1,106 1,297 1,516 1,558Net export -59 -75 -115 -160 -170Statistical discrepancy -57 -62 -56 -61 -63Gross domestic product 2,282 2,471 2,690 2,923 3,118
(Contributions to Growth)GDP 8.3 8.9 8.7 6.7
Domestic demand 9.1 10.3 10.5 7.1Net exports -0.7 -1.6 -1.6 -0.3
Private Consumption 4.9 4.8 4.6 3.4Private Investment 3.9 3.9 4.2 2.2Government 0.8 1.4 1.5 1.8
20
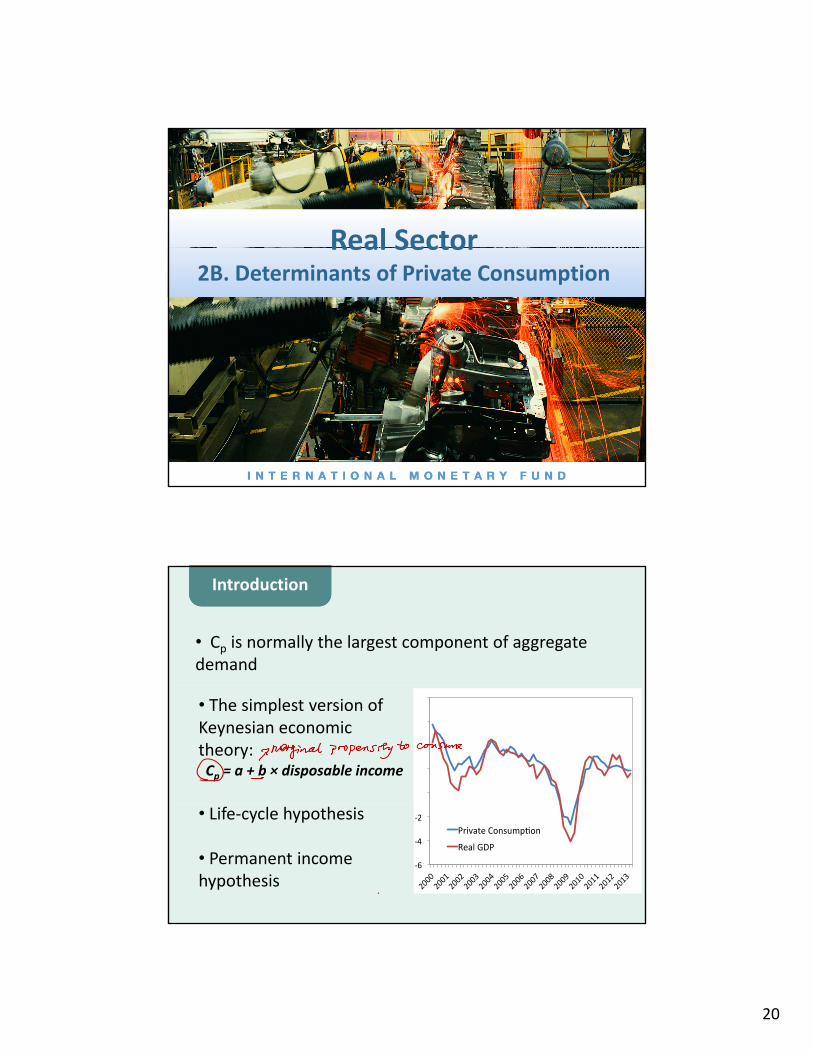
Real SectorReal Sector2B. Determinants of Private Consumption
IntroductionIntroduction
• Cp is normally the largest component of aggregate demand
• The simplest version of Keynesian economic theory:Cp = a + b × disposable income
• Life-cycle hypothesis
• Permanent income hypothesis

21
IntroductionIntroduction
• Cp is normally the largest component of aggregate demand
• The simplest version of Keynesian economic theory:Cp = a + b × disposable income
• Life-cycle hypothesis
• Permanent income hypothesis
Determinants of Private ConsumptionDeterminants of Private Consumption
22
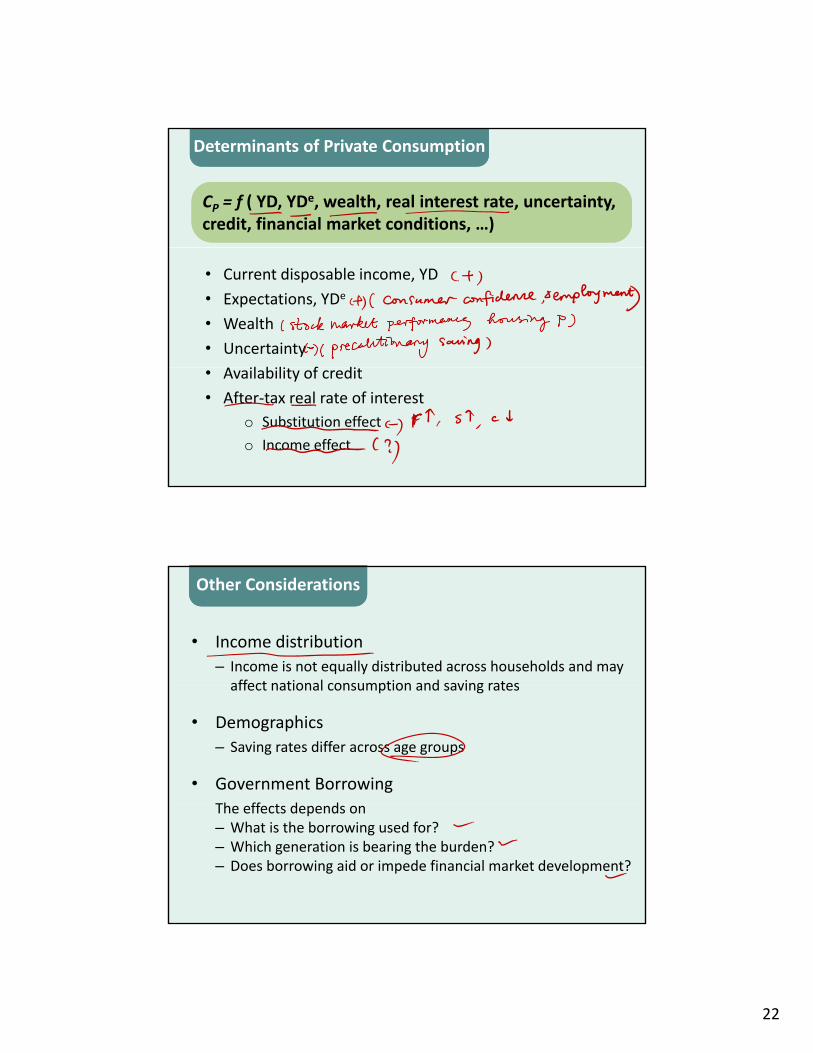
Determinants of Private ConsumptionDeterminants of Private Consumption
CP = f ( YD, YDe, wealth, real interest rate, uncertainty, credit, financial market conditions, …)CP = f ( YD, YDe, wealth, real interest rate, uncertainty, credit, financial market conditions, …)
• Current disposable income, YD
• Expectations, YDe
• Wealth
• Uncertainty
il bili f di• Availability of credit
• After-tax real rate of interest
o Substitution effect
o Income effect
• Income distribution
– Income is not equally distributed across households and may affect national consumption and saving rates
Other ConsiderationsOther Considerations
affect national consumption and saving rates
• Demographics
– Saving rates differ across age groups
• Government Borrowing
Th ff t d dThe effects depends on– What is the borrowing used for? – Which generation is bearing the burden?– Does borrowing aid or impede financial market development?

23
Real SectorReal Sector2C. Determinants of Private Investment
IntroductionIntroduction
Investment: the purchase or construction of capital
goods, including residential and nonresidential
buildings, machines and equipment, and additions to
Investment: the purchase or construction of capital
goods, including residential and nonresidential
buildings, machines and equipment, and additions to
• Investment fluctuates more than the other components of aggregate demand
• Investment plays a crucial role in determining the
inventory stocks. inventory stocks.
long-run productive capacity of the economy
• What determines the amount of investment?
24
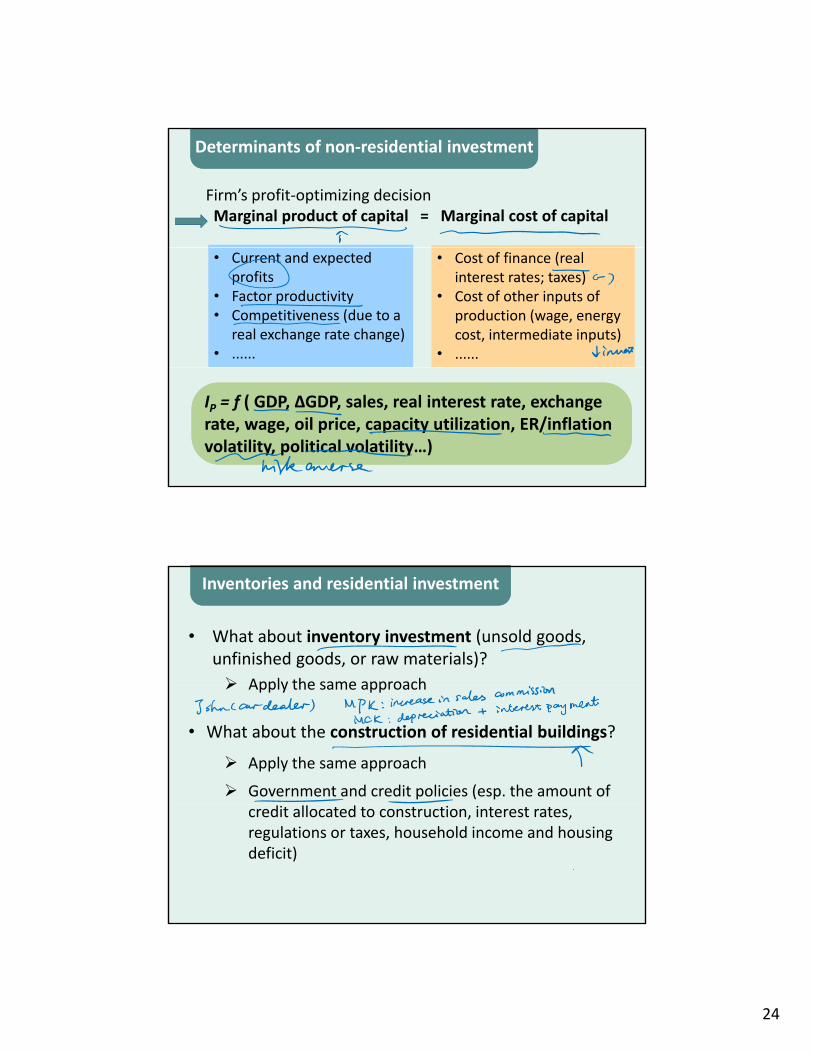
Firm’s profit-optimizing decisionMarginal product of capital = Marginal cost of capital
Determinants of non-residential investmentDeterminants of non-residential investment
• Current and expected profits
• Factor productivity• Competitiveness (due to a
real exchange rate change)• ......
• Cost of finance (real interest rates; taxes)
• Cost of other inputs of production (wage, energy cost, intermediate inputs)
• ......
IP = f ( GDP, ΔGDP, sales, real interest rate, exchange rate, wage, oil price, capacity utilization, ER/inflation volatility, political volatility…)
IP = f ( GDP, ΔGDP, sales, real interest rate, exchange rate, wage, oil price, capacity utilization, ER/inflation volatility, political volatility…)
• What about inventory investment (unsold goods, unfinished goods, or raw materials)?
Apply the same approach
Inventories and residential investmentInventories and residential investment
Apply the same approach
• What about the construction of residential buildings?
Apply the same approach
Government and credit policies (esp. the amount of credit allocated to construction, interest rates, regulations or taxes, household income and housing deficit)

25
• Previously:marginal product of capital = marginal cost of capital
• The standard optimizing investment models are
Investment in Developing CountriesInvestment in Developing Countries
• The standard optimizing investment models are weakened by
• Under-developed financial market• Large role of government in capital formation
(“crowding out” effect)• Distortions created by foreign exchange constraints
• Consider other factors:• Bank credit• Foreign capital inflows• Retained profits


![OBAT POLICY AND - prod-edxapp.edx-cdn.org · [Type text] Page 0 ©2016 Boston Medical Center Updated: December 19, 2016 POLICIES AND PROCEDURE MANUAL OF THE OFFICE BASED ADDICTION](https://static.fdocuments.in/doc/165x107/5d60aa1f88c993d45f8ba389/obat-policy-and-prod-type-text-page-0-2016-boston-medical-center-updated.jpg)