The Public Utility Pyramids
40
The Public Utility Pyramids Paul G. Mahoney University of Virginia School of Law 580 Massie Road Charlottesville, VA 22903 [email protected] Draft of January 2008 Abstract In the 1920s and 1930s, many public utilities in the United States were controlled by holding companies organized in pyramid form. The holding companies’ critics claimed that they extracted wealth from their subsidiaries’ other shareholders. Other commentators argued that holding companies increased the value of subsidiaries by reducing their financing costs. I examine the effects of the Public Utility Holding Company Act of 1935 (HCA), which outlawed pyramid structures. The value of both top holding companies and their subsidiaries fall (rise) around the time of key legislative events suggesting a higher (lower) likelihood that the HCA would be enacted, supporting the hypothesis that holding companies added value. I also find that the valuation effects are most pronounced for financially distressed companies, suggesting that investors expected the HCA to force liquidations that would destroy option value.
Transcript of The Public Utility Pyramids
The Public Utility Pyramids
Paul G. Mahoney
University of Virginia School of Law
580 Massie Road
Charlottesville, VA 22903
Draft of January 2008
Abstract
In the 1920s and 1930s, many public utilities in the United States were controlled by
holding companies organized in pyramid form. The holding companies’ critics claimed
that they extracted wealth from their subsidiaries’ other shareholders. Other
commentators argued that holding companies increased the value of subsidiaries by
reducing their financing costs. I examine the effects of the Public Utility Holding
Company Act of 1935 (HCA), which outlawed pyramid structures. The value of both top
holding companies and their subsidiaries fall (rise) around the time of key legislative
events suggesting a higher (lower) likelihood that the HCA would be enacted, supporting
the hypothesis that holding companies added value. I also find that the valuation effects
are most pronounced for financially distressed companies, suggesting that investors
expected the HCA to force liquidations that would destroy option value.

2
THE PUBLIC UTILITY PYRAMIDS
Paul G. Mahoney
I. INTRODUCTION
The presence of a controlling shareholder can be good or bad news for the
remaining shareholders. Equity ownership aligns the controller’s interests with those of
the other shareholders, leading it to monitor management (Jensen & Meckling 1976).
When the firm is subject to regulatory or political oversight, particularly when that
oversight is corrupt, a politically influential controller can protect the firm from the
“grabbing hand” of the government (Shleifer & Vishny 1998). A controlling shareholder
can also operate an internal capital market among its subsidiaries, which may reduce
financing costs (Gertner et al. 1994). These potential advantages come at a cost,
however. The controller may redistribute wealth from the other shareholders to itself by
diverting corporate assets or cash flows (Shleifer & Vishny 1997).
Not surprisingly, then, empirical evidence on the association between ownership
concentration and firm value is mixed. Some studies find a nonlinear relation between
ownership concentration and corporate valuation or performance, while others find no
connection or one that depends on the type of controlling shareholder (Demsetz & Lehn
1985; Holderness & Sheehan 1988; Morck et al. 1988; McConnell & Servaes 1990).
More recently, Claessens et al. (2002) argue that the positive incentive effects of
concentrated ownership are a function of the controller’s cash-flow rights while the
negative effects are a function of voting rights. Large shareholders sometimes use
devices such as non-voting shares or pyramid ownership structures to amass votes in
excess of cash-flow rights. Claessens et al. (2002) find that increased cash-flow rights
3
are associated with higher valuations in a sample of East Asian companies, while
increased voting rights are associated with lower valuations. Edwards and Weichenrieder
(2004) obtain similar results for a sample of German firms. Faccio et al. (2001) find that
the misappropriation problem is particularly acute for firms in which the ultimate
controller has less than a 20% economic stake. Attig et al. (2004) find that a gap between
control and cash-flow rights is associated with lower liquidity for the remaining shares.
This paper exploits a unique opportunity to observe the effects of separating cash
flow and control rights. During the 1920s and 1930s in the United States, most of the
public utility industry was organized in pyramid form. A small number of top holding
companies, through one or more layers of intermediate holding companies, controlled a
large portion of the nation’s operating electric and gas utilities. In 1935, however,
Congress enacted the Public Utility Holding Company Act (“HCA”), which limited
holding companies to owning a single, geographically contiguous operating system and
prohibited more than a single holding company tier atop any operating company. The
HCA led to a dramatic reorganization of the utility industry, including the elimination of
pyramid structures.
Different observers of the holding company pyramids had widely divergent views
of their purposes and effects. Many argued that top-tier holding companies used their
control rights to sell services to their operating subsidiaries at inflated prices. Others,
however, argued that the holding company structures were an efficient response to the
large fixed capital requirements of an operating utility. By bundling together the
idiosyncratic risks associated with individual utilities, each operating in a limited
geographic area, the holding companies could raise money more cheaply than could those

4
individual operating companies (Hyman 1985). Simply merging many operating
companies into a single diversified corporate entity would have been more costly because
it would have necessitated difficult political negotiations, possibly including bribes, to
transfer existing municipal franchises to the new entity.
I attempt to resolve the debate by studying utility holding company returns around
the time of key events leading up to the passage of the HCA, focusing on the differences
in returns between controlling and controlled companies. If the former indeed extracted
value from the latter, we should observe that the prospect of mandatory dissolution of
holding companies decreased the value of controlling companies but increased the value
of their subsidiaries. By contrast, if pyramid structures economized on financing costs,
then the value of both controlling and controlled companies should fall when
shareholders anticipated enactment of the HCA.
The results support the second hypothesis. The value of both controlling and
controlled companies fall (rise) by statistically and economically significant amounts
around the time of several key votes indicating a higher (lower) likelihood that pyramid
structures would be banned.
I then analyze cross-sectional differences in the abnormal returns among the
sample companies. The controlling companies, on average, lose more value during these
periods than do controlled companies. Nevertheless, the net effect of the HCA on
controlled companies remains negative. It is accordingly possible that being a subsidiary
of a holding company had both costs and benefits (the benefits including cheaper
financing and the costs including some wealth extraction), but the costs were not

5
sufficient to make dissolution of the holding company system a net plus for the subsidiary
companies.
I look for other variables that may explain the cross-sectional variation in the
impact of the HCA. One clear candidate is the financial soundness of the particular
holding company. Some holding company systems were very highly leveraged with
much of the debt concentrated in the top-level or intermediate-level holding companies.
Were these holding companies to be dissolved, they would have to pay off their debts
using the proceeds of sale of the operating companies. The net effect would be that
financially distressed holding companies, like any financially distressed company that is
liquidated, would lose a valuable continuation option. When a company’s assets are
currently worth less than its debts but may in the future be worth more, the ability to
avoid liquidation preserves a valuable real option. Liquidating the utility holding
companies, as the HCA required, would require prematurely selling the subsidiaries and
repaying the holding company’s debts, thereby extinguishing this option value and
ensuring that the holding company would be worth less in liquidation than as a going
concern. The gap between liquidation and going-concern value should be less for a
financially healthy holding company because liquidation would not extinguish a valuable
call option.
In fact, a company’s nearness to financial distress is a strong predictor of its
abnormal returns around the time of key legislative events. On average, utility holding
companies with “A” or higher debt ratings suffer dramatically smaller declines in value
around the passage of the HCA than do holding companies with poorer debt ratings. The

6
result is robust to using a simpler measure of whether the company is part of a financially
distressed holding company system.
The paper seeks to contribute to three different strands of the literature. Several
papers cited above attempt to estimate the effect of controlling shareholders on the value
of the publicly-traded shares. The fact that shareholders choose to seek control of some
firms but not others, however, complicates the analysis because the controller may be
attracted to firms that are undervalued or firms that are particularly susceptible to
misappropriation. The HCA was an exogenous event that affected all multi-layer utility
holding company structures and therefore provides a clean test of the effects of (losing) a
controlling shareholder.
There is also a substantial literature that seeks to explain the structure of the
public utility industry, including a longstanding debate over whether franchise
monopolies combined with state regulation is a natural response to economies of scale or
the consequence of regulatory capture (Demsetz 1968; Jarrell 1978; Priest 1993).
Recently, Hausman and Neufeld (2002) contend that utilities sought state regulation not
to gain the ability to charge a monopoly price, but rather as a way to make earnings
predictable and thereby reduce borrowing costs. The results herein provide indirect
support for Hausman and Neufeld’s view that the industry’s structure was primarily a
response to its large capital needs.
Finally, a recent literature in finance studies how country-level policy and
institutional differences interact with firm-level governance differences to determine the
behavior of managers and controlling shareholders and accordingly firms’ cost of capital
(Durnev & Kim 2005). The results in this paper suggest that, in a generally high-quality

7
institutional environment, firms may be able to reap the benefits of having a controlling
shareholder without suffering from substantial wealth misappropriation. This was
perhaps particularly true for the utility holding companies, which needed almost
continual access to the capital markets and therefore had a strong incentive to maintain a
reputation for not treating investors unfairly.
The remainder of the paper is organized as follows. Section II provides
background on the utility industry, the growth of pyramid structures, and the legislative
battle over holding company regulation. Section III describes the data, hypotheses, and
tests. Section IV describes results, and Section V concludes.
II. UTILITY PYRAMIDS
A. Development
Early utility companies in the U.S. were primarily small, local, stand-alone
entities. From an early stage, however, local utilities began to consolidate. The
geographical scope of consolidation increased as energy demand soared in the early 20th
century. Between 1920 and 1930, a period in which real gross national product increased
by 31%, electricity and natural gas consumption both more than doubled. In 1920, 35%
of all residential units and 1.6% of farms were connected to the electrical grid. By 1930,
these had increased to 68% and 10%, respectively.
These developments required substantial new investment. The generating
capacity of non-government-owned electric plants increased from approximately 12
million to 30 million kilowatts between 1920 and 1930. Utilities consolidated in order to
be able to raise the funds required for new investment, utilities consolidated. Indeed, the
public utility pyramids came about largely through acquisitions.

8
Utilities combined by forming holding companies that purchased the stock of
multiple operating companies. In many instances, the difficulty of transferring franchises
or made it too costly to merge the operating companies into the parent company. These
holding companies, in turn, were often acquired by larger companies. The “super”
holding companies at the top of the pyramids often managed construction and financing
of new plants for their operating properties and provided centralized management. Some
of these holding companies were in turn controlled by construction companies or
investment banks. The resulting consolidation, achieved primarily over a 20-year span,
was dramatic. By 1930, the ten largest holding company systems generated
approximately 75% of the electrical power sold by utilities (Bonbright & Means 1932).
Some commentators saw in the pyramid structures an efficient reaction to the
industry’s massive capital needs. An individual local utility was often not large enough
to attract the attention of financial intermediaries. It was also subject to a variety of
diversifiable risks, including the risk associated with the regional economy and the risk of
local political interference. A large holding company, by contrast, could borrow large
sums at a lower rate than its individual operating companies. [cite Hausman]
Other commentators, by contrast, believed the holding companies were
pernicious. Their primary claim was that holding companies appropriated wealth from
minority shareholders of lower-tier companies by selling those companies construction,
investment banking, managerial, and other services at inflated prices. A second, related
objection was that holding companies made local rate regulation ineffective through their
ability to manipulate the operating companies’ costs.
B. The Public Utility Holding Company Act of 1935
9
Critical commentary on utility holding companies began to appear by the late
1920s. Several articles in the legal literature called for regulation. In 1928, the United
States Senate ordered the Federal Trade Commission to investigate utility holding
companies. The investigation lasted until late 1934 and generated a report of more than
70 volumes.
The scrutiny and criticism became much more intense in the wake of the 1929
market crash, which hit highly leveraged holding companies particularly hard. The Insull
utility group, one of the country’s largest, was unable to meet its obligations. Its creditors
forced it into bankruptcy in 1932. The Insull collapse, which the press called “the biggest
business failure in the history of the world,” triggered a political reaction similar to
Enron’s 70 years later. Samuel Insull himself fled the country facing criminal charges of
embezzlement and larceny, of which he was eventually acquitted.
Franklin Roosevelt cited Insull as a symbol of financial fraud during his 1932
campaign. The Democratic platform called for regulation of holding companies. During
the initial months of his Presidency, however, Roosevelt chose to make the market for
new security issues the focus of financial regulation. The President and his advisers had
already determined the basic thrust of the regulatory regime for new issues—mandatory
disclosure of basic information about the issuer, the promoter, if any, and the
underwriting arrangements—and had a model at hand in the English Companies Act
(Mahoney 1995). After enactment of the Securities Act in mid-1933, Roosevelt turned to
the task of regulating the stock exchanges, which was completed with the enactment of
the Securities Exchange Act of 1934. Then attention shifted to utility holding companies.

10
In July 1934, President Roosevelt established a National Power Policy Committee
to study the public utility industry and propose legislation. Political and market
commentators were unsure whether the legislation would be regulatory or prohibitive.
Based on the experience of the Securities Act and the Securities Exchange Act, there was
ample reason to believe that the legislation would focus principally on disclosure,
requiring holding companies to register with the Securities and Exchange Commission
and provide detailed information about the cost of the services they provided to
subsidiaries. At the same time, some of the President’s advisers advocated that holding
companies be abolished altogether or that structures with more than one layer of holding
companies be prohibited.
This uncertainty persisted up to the introduction of the administration’s bill. On
November 21, 1934, the New York Times reported that according to an “authoritative
source,” the committee would recommend a ban on pyramid structures. However, in a
year-end article on the main issues confronting Congress in the coming year, the Times
spoke merely of the possibility of federal regulation of utility holding companies. The
President’s State of the Union address on January 4, 1935 highlighted the uncertainty.
Roosevelt called for “the abolition of the evil of holding companies” and was asked in a
subsequent press conference whether he had decided to do away with holding companies
altogether. He responded that he had intended to advocate abolition of “the evil features
of holding companies” (as was contained in the printed copy delivered to the press).
According to the New York Times, the speech “led to both favorable and unfavorable
inferences” about the future of holding companies.
11
On January 11, the Speaker of the House of Representatives, Sam Rayburn, gave
a speech on the House floor stating that he wanted to “eliminate rather than regulate”
holding companies. Meanwhile, on January 27, the Federal Trade Commission unveiled
a report and summary of its 6-year investigation. The report provided a long list of
potential reforms and stated that whether to abolish all holding companies or permit a
single tier of holding companies was a “policy decision” for Congress.
On February 6, 1935, Rayburn and Senator Wheeler introduced the
administration’s bill into the House and Senate, respectively. The bill, which most major
newspapers summarized in detail on February 7, required utility holding companies to
register with the SEC and gave the SEC regulatory authority over their financings as well
as acquisitions and dispositions. The bill also, however, contained what was soon
nicknamed the “death sentence” provision, Section 11. This gave the SEC the authority,
beginning in 1938, to require holding companies to divest any securities and property
necessary to reorganize the utility industry into geographically compact systems.
Immediately after January 1, 1940, the SEC was directed to make every registered
holding company engage is such dispositions, reorganizations, or dissolutions as
necessary to make it “cease to be a holding company.” Section 11 was even more severe
than suggested reforms that would have prohibited more than a single layer of holding
companies. Section 11 banned all holding companies.
Both the New York Times and the Washington Post referred to the bill as
“drastic.” It was immediately controversial. Utility managers argued that the bill was
both unconstitutional and potentially disastrous to investors. The fact that the Tennessee
Valley Authority and other publicly-owned utilities were exempt from the statute led

12
promptly to charges that the administration’s real purpose was to nationalize the utility
industry—a charge the chairman of the Federal Power Commission felt compelled to
deny. The press reported investor concerns that the bill, if enacted, would force holding
companies into fire-sale divestitures of operating companies, causing substantial losses to
the holding companies’ public investors. By March 2, the New York Times reported that
the bill had provoked “the greatest volume of criticism and objection evoked by any
proposed legislation in recent years” and stated that although Representative Rayburn
was confident it would pass the House, there was “some doubt that the Senate will accept
the measure in its present form.” President Roosevelt argued that the bill would cause no
investor losses because holding company investors would receive shares in sound
operating companies. He also charged that opposition to the bill did not originate with
investors, but instead with the utility industry’s behind-the-scenes lobbying effort.
In the House, the bill was assigned to a subcommittee of the Interstate Commerce
Committee. Testimony before the subcommittee, including that by a commissioner of the
SEC, was often skeptical of the death sentence provision. On April 23, the New York
Times reported that an “informal” vote of the subcommittee favored removing the death
sentence provision by a 14-11 margin. The subcommittee was ultimately unable to report
either favorably or unfavorably to the full committee.
The Senate Commerce Committee was also closely divided on whether to retain
the death sentence provision. On May 8, the Times reported that an informal poll of the
subcommittee favored removing the death sentence by a 9-6 margin. However, on the
same day an actual vote to delete the provision failed and the committee adopted a

13
compromise amendment that would merely delay the termination date for holding
companies from 1940 to 1942.
In early June, the New York Times reported that “informed” sources
acknowledged that the Roosevelt administration was prepared to compromise on the
death sentence provision in the face of “growing opposition” in Congress. A column by
the Times’ Washington correspondent Arthur Krock opined that it “seems certain that
important modifications” would be made to the bill. Senator Wheeler, however,
continued to insist on the death sentence provision, claiming to have received a letter
from the President urging passage of the bill with Section 11 intact. On June 11, the
Senate passed the amended bill including Section 11 by a 45-44 vote. The next day,
newspapers reported that the Senate action had halted a rally in holding company stocks.
On June 17, the House subcommittee approved the deletion of the death sentence
provision and “knowledgeable sources” told the press that the full Interstate Commerce
Committee would concur. Newspaper reports suggested that only when the bill went to
conference would the issue of the death sentence be resolved. A motion was made on the
House floor to reinstate Section 11. On July 2, the full House voted to reject the motion,
thereby assuring that the bill would pass the House, if at all, without the death sentence.
Arthur Krock called the vote a “major defeat” for the President.
By mid-July, the bill went to a House-Senate conference to reconcile the different
versions. Joseph Kennedy, the chairman of the SEC, urged the Senate Commerce
Committee to accept the House version. The press, meanwhile, reported that investor
fears of declines in utility stock and bond values were behind the House’s unusual
willingness to defy Roosevelt.
14
The Administration, however, took advantage of the lull leading up to the
conference to make its case that opposition to the death sentence provision was actually
the work of utility company lobbying. The House Rules Committee announced that it
would investigate lobbying by the utility industry. In mid-July, its investigation
uncovered evidence that a utility executive in Pennsylvania had sent hundreds of
telegrams to members of Congress ostensibly in the name of Pennsylvania residents.
This over-reaching appeared to change sentiment in Congress. For several days
in late July, the Senate heard testimony from residents of York, Pennsylvania whose
names had appeared on telegrams without their knowledge and from employees of the
local Western Union office who had transmitted the telegrams at the utility executive’s
request. Although the Pennsylvania incident appears to be isolated, it supported the
Administration’s longstanding position that opposition to its bill was contrived. The
Times opined at the end of July that the lobbying inquiry had strengthened the President’s
hand, making passage of the death sentence provision more likely.
On August 1, Representative Rayburn moved to instruct the House conferees to
acquiesce in the death sentence provision of the Senate bill. According to press reports,
the Administration concluded that after the lobbying revelations, the House would change
its stance. Rayburn and the Administration, however, miscalculated; the House voted
against the attempt. By mid-August, with the conference committee deadlocked, both
legislators and commentators suggested that the bill would have to be held over until the
next session.
Finally, in a meeting at the White House on Sunday, August 18, Senator Barkley
suggested the compromise language that ultimately resolved the differences among the

15
House, Senate, and Administration. The compromise provision permitted only one tier of
holding company atop any operating company and required that all of the operating
companies under a given holding company be either physically interconnected or capable
of such interconnection. The provision also gave the SEC the authority to grant
exemptions from this “single integrated system” requirement on a case-by-case basis.
On August 22, the President informed Representative Rayburn of his willingness
to accept the compromise and the House approved it. The text of the revised Section 11
was reprinted in full in the next day’s New York Times. After the close of trading on
August 23, the conference committee approved the compromise, as reported in the next
morning’s newspapers. Passage by the full House and Senate followed on Friday,
August 24, on Monday, August 26 the President signed the HCA into law.
Almost immediately, the electric utility industry’s industry association retained
John W. Davis, one of the country’s most prominent litigators, to bring a test case
challenging the constitutionality of the statute (Seligman 2003). The case, involving the
American States Public Service Company, was filed in federal district court in Baltimore.
On November 7, 1935, the district court found that the statute exceeded Congress’s
powers under the federal constitution and declared it “void in its entirety.” Although I
include the November 7 decision as an event below, there are two factors that likely
muted the market reaction to the decision. First, comments from the bench and rulings
on preliminary motions led observers to conclude that the court would declare the statute
unconstitutional, so the November 7 ruling was not wholly unanticipated. In addition,
lawyers must surely have viewed it as highly likely that the Supreme Court would
ultimately decide the Act’s constitutionality, so the district court ruling was only the first

16
step in a lengthy legal process. 1n 1938, the Supreme Court upheld the Act’s
constitutionality.
As this brief history demonstrates, there are a variety of dates in late 1934 through
late 1935 on which traders would almost certainly have revised up or down their
estimates of the likelihood that holding companies would have to relinquish their control
of their subsidiaries. I observe returns on both controlling and subsidiary companies on
those dates as described in more detail in the next section.
III. STUDY DESIGN
A. Data
I begin by identifying every company in the public utility industry (SIC two-digit
code 49) in the data files of the Center for Research in Security Prices (CRSP) as of
January 1, 1935, a total of 23 companies. One of these is a foreign utility company cross-
listed on the NYSE, which I omit from the sample for two reasons. First, return data are
unavailable for many days. Second, it is unlikely that the expected return model I use for
U.S. utility companies would be valid for a cross-listed foreign company subject to
substantial risks stemming from events in its home country. Bonbright & Means (1932)
identify two other utility holding companies (United Corp. and Stone & Webster) that
have 2-digit SIC codes other than 49, and I add those to the sample, for a total of 24
NYSE-listed companies. To increase the sample size, I also hand-gather return data for
an additional 15 utility companies traded on the New York Curb Exchange. I identify
utility companies traded on the Curb based on company names and check that they are
covered by Moody’s Public Utilities manual. I omit utility companies for which a return

17
cannot be calculated for more than 50 of the 250 days in the estimation period. The final
sample consists of 39 utility companies.
Most of the sample firms are holding companies rather than operating companies.
Very few bottom-tier operating companies had a sufficiently large public float to be listed
on the NYSE or the Curb. Indeed, most of the operating companies were wholly-owned
or nearly wholly-owned by an intermediate-tier holding company. If the higher-tier
holding companies used their control to redistribute wealth from public investors,
therefore, these investors were found primarily in the intermediate-tier holding
companies. As a consequence, intermediate-tier holding companies serve as a convenient
proxy for their wholly-owned operating companies.
I therefore divide the sample into four categories, consisting of potential
“predators,” potential “prey,” companies that are both, and companies that are neither. I
define as predators companies that own a controlling stake, but less than 95%, of the
common stock of one or more subsidiary companies, as described more fully below. The
logic behind the definition is that there is no gain to be had from looting a wholly-owned
or almost wholly-owned subsidiary. In principle, the parent could extract wealth from
bondholders or other contractual creditors, but I assume that this is a less significant
problem because creditors can protect themselves through their contracts. Potential prey
are companies controlled but less than 95% owned by a predator. Some intermediate
holding companies meet both definitions—they have partially-owned subsidiaries and are
themselves partly-owned by a parent holding company. Others, primarily large urban
public utility systems like Brooklyn Union Gas and Southern California Edison, meet
neither definition—they are not controlled by a holding company and their subsidiaries, if
18
any, are wholly-owned. Such companies might be pyramids as a structural matter but
they could not have been designed to appropriate wealth from public shareholders of
subsidiary companies.
Because of the complex nature of some of the holding company pyramids, these
categorizations involve some arbitrary cut-offs. The most obvious is the 95% cut-off
identified above. Many holding company subsidiaries were almost, but not quite, 100%
owned. This was often a consequence of state corporate laws that required directors to
hold a minimum number of “qualifying shares” of the company. In other cases, at the
time of acquisition, the acquirer or target were barred by state law or by bond covenants
from engaging in a merger, with the result that the acquirer could only buy shares from
willing sellers. Thus, I treat ownership of 95% or more of a subsidiary’s common stock
as functionally equivalent to entire ownership. In addition, some holding companies
owned 95% or more of nearly all of their subsidiaries, but had a handful of very small
partly-owned subsidiaries. In many instances, these partly-owned subsidiaries were too
small to be a realistic source of rents for the holding company. To be categorized as a
predator, I therefore require that a holding company have partly-owned subsidiaries that
constitute in the aggregate at least 10%, by book value, of the parent company’s assets.
Finally, I define “control” of a company as (1) ownership of more than 10% of the
company’s common stock and (2) being the single largest shareholder. I use Moody’s
Investors Service (Moody's 1935), supplemented by Bonbright and Means (1932) and the
FTC Utility Report to classify companies. As an additional check, I obtain the names of
the directors of all the sample companies from Moody’s. All of the “predator”
companies in my sample have director overlaps with their “prey.”

19
Finally, it should be noted that a few of the holding companies identified as
having no parent company were more than 10% owned by an investment company. In
the pre-SEC era, investment companies could own a large stake in a portfolio company.
However, judging from the sources cited above, these investment companies were
passive investors and therefore not likely a “predator.” I can identify passive investment
companies because they are listed only in Moody’s Banking and Finance manual and not
the Public Utility manual.
Figure 1 illustrates the categorizations just described by showing the ownership
pattern of one of the important holding company systems, the United Corporation system.
United was formed by J.P. Morgan & Co., its affiliate Drexel & Co., and its ally
Bonbright & Co. in 1929 to acquire control of smaller utility holding company systems.
In the diagram, United Corp. is a predator only. Although Morgan interests organized it
and underwrote all of its securities issues, the investment banks did not own a control
block. One might, however, argue that United Corp. was also Morgan’s “prey” because a
majority of its board of directors consisted of Morgan nominees designed in part to assure
that Morgan would be the lead manager for all of the company’s securities issues
(Commission 1943). As a check, I re-estimate all of the tests below after re-
characterizing United Corp. as both predator and prey. All results remain qualitatively
the same.
United’s partly-owned subsidiaries Columbia Gas & Electric Co., Niagara
Hudson Power Co. and Public Service Corp. of New Jersey are prey only. They are
controlled but less than 95% owned by United (including indirect ownership in the case
of Public Service Corp.). All of their subsidiaries are either 95% owned or too small to

20
constitute a plausible source of rents. United Gas Improvement Corp. (UGI), however, is
both predator and prey. United controls UGI through 26% stock ownership and
interlocking directors. However, UGI itself owns a controlling stake in Public Service
Corp. and Connecticut Electric Service Co. The latter company is not in my sample
because it is not traded on a major exchange and daily prices are therefore unavailable.
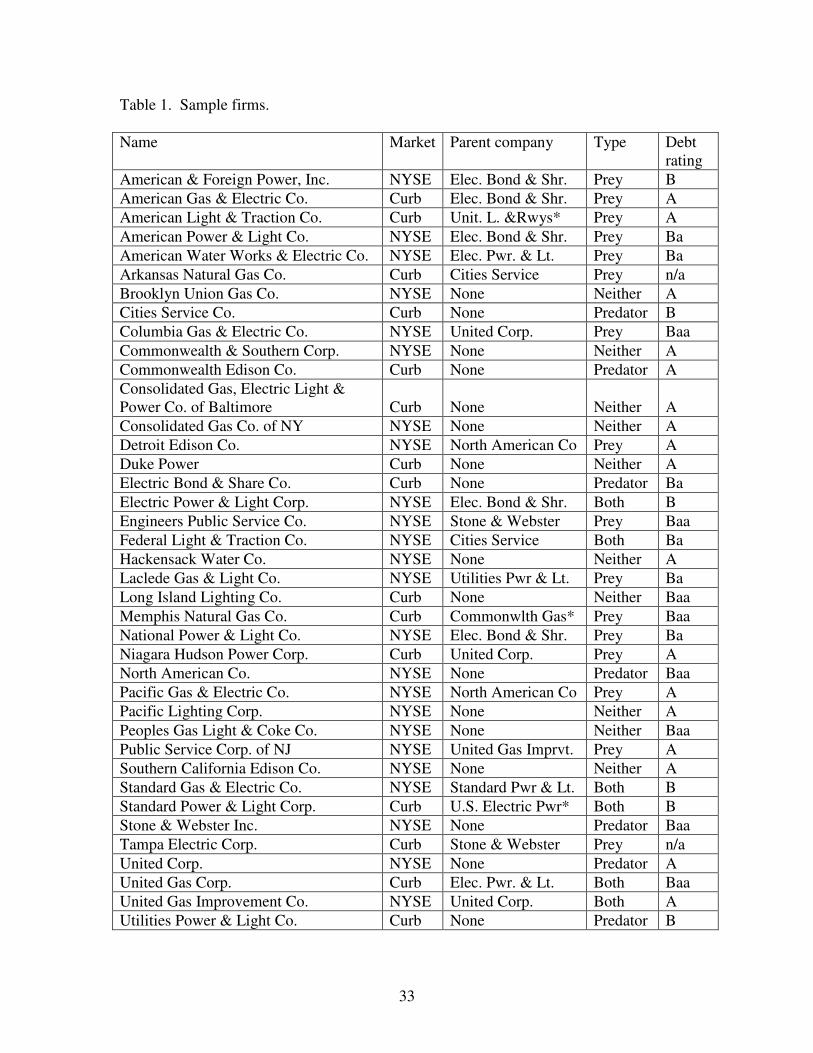
Table 1 lists the sample companies and their categorizations. It also identifies the
principal market on which the sample company’s common stock traded and its parent
company, if any. The table also shows the Moody’s rating for the largest debt issues of
each of the sample companies, which will be relevant to the cross-sectional analysis of
abnormal returns.
Daily returns for the NYSE-listed companies in the sample are taken from the
CRSP data. Daily returns for the Curb companies are calculated using CRSP’s
procedure—based on closing prices when available and on the midpoint of closing bid
and ask quotations when a stock does not trade on the relevant date.
I create four value-weighted portfolios consisting of predators that are not also
prey (n=7), companies that are both predators and prey (n=6), prey that are not also
predators (n=16), and “independent” companies that are neither predator nor prey (n=10).
I then calculate abnormal returns on each portfolio around the time of key legislative
events as described more fully below.
The null hypothesis is that the statute has no valuation effect. This would be so if
the effects of holding companies were small on average and traders did not expect the
costs of liquidating the holding companies to be substantial.

21
B. Test design
Using standard event-study technique (Brown & Warner 1985), I estimate a
market model for each of the four portfolios using 250 days of return data ending on
October 31, 1934. The first legislative event occurs on November 21, 1934. Because the
portfolios are value-weighted, I use the CRSP value-weighted index rather than the
equally-weighted index as the market proxy. I then measure abnormal returns around the
time of each event described in Table 2 except for Events 5 and 6 (May 7 and 8, 1935,
respectively). Because events favorable and unfavorable to the passage of the death
sentence provision occurred on succeeding days it is not possible to disentangle the
responses to the two events.
The presence of confounding events makes it essential to consider narrow event
windows. For example, on February 18, 1935, the Supreme Court decided the so-called
“Gold Clause Cases,” concerning the constitutionality of the government’s abrogation of
clauses in government and private debt requiring payment in gold (for a discussion see
Kroszner (2003)). The cases had dramatic implications for the value of both debt and
equity securities issued by most publicly traded companies—including utilities, which
had issued large amounts of bonds payable in gold. In most cases, therefore, I measure
abnormal returns for days 0 and 1 and also provide a cumulative total for the 2-day event
window. Day 0 is the day a legislative event occurred and day +1 is the day on which the
legislative action was reported in the press. I assess statistical significance using the time
series standard deviation of abnormal returns during the estimation period.
If, as their critics believed, pyramid structures were a means by which holding
companies extracted wealth from minority shareholders of subsidiary companies, the
HCA should have positive effects on prey and negative effects on predators. The “death

22
sentence” provision would damage the predator group by depriving them of the ability to
extract value from their prey. By the same logic, the death sentence provision should
benefit the prey group. Under this “rent extraction” hypothesis, therefore, we would
expect to see positive abnormal returns on the prey portfolio and negative abnormal
returns on the predator portfolio around the time of events favorable to passage of the
death sentence provision.
The prior literature offers an alternative hypothesis under which holding
companies added value to their subsidiaries by reducing financing costs. Presumably,
these cost savings were shared between (the shareholders of) the parent and subsidiary
companies. Dissolution of holding companies would destroy that value to the detriment
of both groups in relative amounts that would depend on how the surplus was split
between the parent and subsidiary companies. Even the independent companies,
although having public shareholders only at the top tier of the structure, were typically
organized in holding company form and faced being broken into smaller pieces. Under
this “efficient financing” hypothesis, then, banning pyramids would be detrimental to all
holding companies in the sample.
Unfortunately, we cannot easily distinguish this efficient financing hypothesis
from a different one sometimes mentioned by holding company critics—that holding
companies served primarily as a means to evade state rate regulation. Critics sometimes
argued that holding companies overcharged their subsidiaries as a means of inflating
costs, which were then passed on to the consumer through the typical rate-of-return style
state utility regulation (Hyman 1985). This hypothesis, although difficult to rule out,
faces at least one hurdle. As the public utility industry consolidated, rates fell

23
substantially (McDonald 1962). Of course, they may have fallen even more in the
absence of pyramid schemes, but at least on the surface there is no association between
pyramids and higher rates.
IV. RESULTS
A. Event study evidence: portfolio level
Table 3 reports abnormal returns for each of the four portfolios around the time of
the legislative events described above. One interesting initial observation is that
abnormal returns are economically and statistically large primarily on days of votes, not
on days on which the bill was introduced or on which key players stated their positions.
This is not very surprising—the administration clearly objected to holding companies and
traders presumably predicted that the bill would be somewhat punitive. However,
because the death sentence was highly controversial, it seems likely that traders could not
always have predicted the outcomes of votes, several of which were very close.
The sign of the abnormal return for the predator portfolio is as expected—
negative around the release of information suggesting a higher probability of the abolition
of some or all holding companies and positive around the release of information
suggesting a lower probability. The magnitudes are frequently large enough to be
statistically different from zero on at least one day around the time of key votes in
Congress.
Most important for current purposes, the predators and prey almost always move
in the same direction. On each of the nine individual days on which the abnormal return
on the predator portfolio is significantly different from zero, the abnormal return on the
prey portfolio has the same sign, and on seven of those it is statistically significant. The

24
“both predator and prey” portfolio also has abnormal returns of the same sign as those of
the predator and prey portfolios for each of those nine trading days, although they are
statistically significant on only five of the nine days. This effect is particularly
noteworthy for the April 23, July 2 and August 1 events, which were votes focused on the
death sentence provision rather than the entire bill. Traders appeared to believe that
passage of the “death sentence” provision would be bad for both predators and prey.
The “independent” portfolio has abnormal returns that are less reliably in line
with those of the other three portfolios. On eight of the nine dates on which the predator
portfolio has a significant nonzero abnormal return, the point estimate for the
independent portfolio has the same sign, but it is not always statistically significant. One
possible reason is that traders expected the independent companies to be able to comply
with the death sentence provision without forgoing the benefits of scale. The
independent companies often controlled fairly compact systems that could be merged or
put under a single holding company as permitted under the final version of the statute.
The evidence from this simple time-series test is more consistent with the efficient
financing hypothesis than the rent extraction hypothesis. It is noteworthy, however, that
the absolute value of the abnormal return is often smaller for the prey portfolio than for
the predator portfolio. This is not inconsistent with the financing hypothesis—it suggests
that the holding companies took a larger share of the surplus generated by their ability to
provide low-cost financing. But we cannot rule out that some rent extraction was
happening as well. It does, however, appear that any rent extraction was on a sufficiently
small scale to make the HCA a bad deal for prey as well as predators.
B. Cross-sectional evidence: firm-level
25
To try to shed more light on the effects of the HCA, I exploit firm-level
differences in abnormal returns. I begin by estimating a market model for each
individual stock in Portfolios A and B using the same methodology as that described
above. I then calculate average abnormal returns for each stock in those portfolios over
each of the event windows ending on April 24, June 12, July 3, August 2, August 27, and
November 8, 1935, constituting the event windows for which at least one of the predator
or prey portfolios experiences nonzero abnormal returns. By focusing only on event
windows on which traders reacted to news, I hope to reduce the amount of noise in the
estimates. I categorize each event as negative or positive from the perspective of
controlling companies, negative events being those that indicated a higher probability that
the death sentence would be enacted.
I then estimate the following regression:
1 2 3 4* *it t i i i t i t it
AAR Neg pred prey pred Neg prey Negα β β β β ε= + + + + + + (1)
where i indexes firms, t indexes dates, AAR is average abnormal return for the days in the
event window, pred and prey are indicator variables for predators and prey, respectively
(independent companies are the omitted class) and Neg indicates a negative event.
Coefficients β1 and β3 accordingly measure the mean difference between predatory firms
and independent firms around the time of positive and negative events, respectively.
Coefficients β2 and β4 measure the same for prey.
Table 4 reports estimated coefficients for the regression. Model 1 provides a
baseline that aggregates all firms together without omits all of the firm dummies. It
shows that the average firm in the sample earns an abnormal positive return of about
1.9% per day during event windows that include news unfavorable to passage of the

26
death sentence provision and about -4.7% on days on which there is news favorable to
passage. In Model 2, the sample is partitioned into predators, prey and independent
companies using the dummy variables. Some firms, as already described, are both
predator and prey. However, partitioning the sample further to distinguish those firms
that are only predators, only prey, or both does not change the results.
Model 2 shows that traders did not expect predators and prey to suffer by identical
amounts from the passage of the HCA. The results imply an average abnormal return of
-6.2% per day for predators and -4.4% per day for prey around the time of events
favorable to passage of the HCA. This is consistent with the evidence from the portfolio-
level analysis suggesting that abnormal returns on the predator portfolio are larger in
absolute value during the key event windows than those on the prey portfolio.
Nevertheless, it remains clear that traders believed that the HCA would destroy value for
both predators and prey.
As a robustness check, I also include fixed effects for holding company systems.
We might be particularly interested in how the returns on the predators and prey within a
particular holding company system compare. The fixed-effects regression (unreported)
produces the same result—predators and prey, on average, earn negative (positive)
abnormal returns around the time of events favorable (unfavorable) to passage of the
HCA, but the absolute values are greater for the predators.
The analysis so far, however, does not control for other relevant differences
among the sample firms. One obvious difference is that some of the sample firms are
healthy while others are in financial distress. This is particularly relevant because the
HCA would force holding companies to divest their utility holdings. For the most part,

27
holding companies owned controlling stakes in multiple subsidiaries and financed them
by borrowing at the holding company level. During the Depression, the value of the
subsidiaries decreased. In effect, then, the holding companies were analogous to the
holder of a call option. At some point in the future, their debts would mature. At that
point they could pay off their debts and retain ownership of the subsidiary companies or,
if the subsidiary companies were worth less than the amount of the debt, the holding
company could default and turn over ownership of the subsidiaries to their creditors.
Even those holding companies that owed more than the current value of their
subsidiaries, then, should have traded at positive prices so long as the holding company
could service its debt in the short run and there was some chance that the subsidiaries
would ultimately be worth more than the money owed.
By forcing prompt divestiture, however, the HCA extinguished this option value.
The holding companies lost the option to retain ownership of their subsidiaries while
waiting to see whether the Depression-related fall in the value of the subsidiaries would
end soon. This suggests that companies that were near financial distress had more to lose
from the HCA than companies on a sounder footing. The closer to bankruptcy a holding
company was, the more of its value would be represented by the call option on its
subsidiaries, and therefore the more value it would lose from divestiture.
To control for this effect, then, I search Moody’s Public Utility manuals to
determine the ratings on the sample companies’ outstanding bonds. I select the largest
publicly-traded debt issue for each holding company that has direct obligations. Some
top-tier holding companies concentrated their borrowings at the intermediate holding
company level. For these, I use the debt ratings on the companies consolidated

28
indebtedness as a proxy for its own debt rating. I treat all ratings of “A” or above as a
single category and all ratings of “B” or below as a single category. The ratings are
shown in Table 1.
Model 1 in Table 5 shows the results of a regression of average abnormal returns
during event windows on the debt rating of the company. Consistent with the prediction,
we see that the expected effects of the HCA are much worse for companies with poor
debt ratings than for those with strong ratings. Consider first the estimated coefficient on
the “negative event” variable. This measures the average abnormal return for negative
events on companies rated “B” or lower, which is the omitted category in the regression.
Compare this to the estimated coefficient on the interaction between “A” or higher rating
and negative event. This tells us that the average abnormal return during a negative event
window is -8.5% for the “B”-rated companies but -2.5% for the “A”-rated companies.
Companies with Baa and Ba ratings fall in the middle.
Model 2 adds in dummy variables for predators and prey. These variables take
some of the load from the debt ratings but the results remain consistent with that of
Model 1—highly-rated companies were expected to suffer relatively little from the HCA,
and controlling for debt rating both predators and prey experience negative abnormal
returns around event favorable to passage.
An alternative, unreported, approach is to ask a simpler question—is the company
part of a holding company system that is in financial distress? I take the top holding
company’s inability to pay preferred stock dividends as a simple proxy for financial
distress. If Moody’s reports that the holding company has missed preferred dividends, I

29
code every company within that holding company system as “distressed.” The results are
consistent with those reported using debt ratings.
C. Implications
Across a wide range of specifications, then, the same picture emerges. Traders
expected the HCA to destroy value for publicly-traded firms at all levels of the pyramid
structures. This is consistent with the view that holding company structures served to
economize on financing and other costs for the lower-tier companies. The lower-tier
companies suffer less than the higher-tier companies, suggesting that the benefits of the
structure were not shared equally at all levels, but instead were greater at the top. This
may reflect wealth extraction of a kind that researchers today call “tunneling” (Johnson et
al. 2000). Alternatively, it may reflect a less malign phenomenon—the top holding
companies may simply have taken a large share of the surplus that their own activities
generated for the lower-tier companies. In either event, however, the evidence from
mandated dissolution of the holding company pyramids suggests that they were
beneficial to the companies in them.
This result is not consistent with all studies of concentrated ownership. Indeed,
several studies find that using devices like pyramids to amass control rights in excess of
cash flow rights is detrimental to the other shareholders of the controlled companies
(Claessens et al. 1999; Faccio et al. 2001). We can reconcile the present results with
those in one of two ways. First, there is a growing recognition that firm-level and
country-level governance are to some extent substitutes. The background governance
rules in the U.S. (even in the 1930s) are generally favorable to shareholders. This may
have created space for firms to benefit from structures that, in a different institutional

30
environment, would have created an excessive risk of agency losses. A second factor that
may have limited the top tier companies’ ability to appropriate wealth from their
subsidiaries is the fact that the utility industry was hugely capital intensive. Because the
holding company systems had to go back to the capital markets on a frequent basis to
raise capital for companies at all levels of the pyramid, they could not afford a reputation
for being excessively rapacious.
V. CONCLUSION
The evidence from abnormal returns suggests that traders viewed the “death
sentence” provision of the HCA, which outlawed pyramid structures, as detrimental to
both the controlling companies at the top of the utility pyramids and to the controlled
companies in the lower tiers of the pyramids. The effects are most severe for holding
companies that were financially distressed. For these companies, liquidation would mean
loss of a continuation option and the consequent destruction of value. In all
specifications, lower-tier companies lose less from passage of the HCA, suggesting that
the top-tier companies benefited more from pyramiding than did the lower-tier
companies.

31
Attig, N., Fong, W.-M., Gadhoum, Y., Lang, L.H.P., 2004. Effects of Large Shareholding
on Information Asymmetry and Stock Liquidity.
Bonbright, J.C., Means, G.C., 1932. The Holding Company: Its Public Significance and
its Regulation. McGraw-Hill Book Company, New York.
Brown, S.J., Warner, J.B., 1985. Using daily stock returns : The case of event studies.
Journal of Financial Economics 14, 3
Claessens, S., Djankov, S., Fan, J., Lang, L.H.P., 1999. Expropriation of Minority
Shareholders in East Asia.
Claessens, S., Djankov, S., Fan, J., Lang, L.H.P., 2002. Disentangling the Incentive and
Entrenchment Effects of Large Shareholdings. Journal of Finance 57, 2741-2771
Commission, S.a.E., 1943. In the Matter of The United Corporation. In: SEC, p. 854.
Securities and Exchange Commission
Demsetz, H., 1968. Why Regulate Utilities? Journal of Law and Economics 11, 55-65
Demsetz, H., Lehn, K., 1985. The structure of corporate ownership: Causes and
consequences. Journal of Political Economy 93, 1155-1177
Durnev, A.R.T., Kim, E.H., 2005. To Steal or Not to Steal: Firm Attributes, Legal
Environment, and Valuation. The Journal of Finance 60, 1461-1493
Edwards, J.S.S., Weichenrieder, A.J., 2004. Ownership concentration and share
valuation. German Economic Review 5, 143-171
Faccio, M., Lang, L.H.P., Young, L., 2001. Dividends and Expropriation. American
Economic Review 91, 54-78
Gertner, R.H., Scharfstein, D.S., Stein, J.C., 1994. Internal Versus External Capital
Markets. The Quarterly Journal of Economics 109, 1211-1230
Hausman, W.J., Neufeld, J.L., 2002. The Market for Capital and the Origins of State
Regulation of Electric Utilities in the United States. Journal of Economic History
62, 1050-1073
Holderness, C.G., Sheehan, D.P., 1988. The role of majority shareholders in publicly held
corporations : An exploratory analysis. Journal of Financial Economics 20, 317-
346
Hyman, L., 1985. America's electric utilities: past, present and future. Public Utilities
Reports, Inc., Arlington, VA.
Jarrell, G.A., 1978. Demand for State Regulation of the Electric Utility Industry. Journal
of Law and Economics 21, 269-295
Jensen, M., Meckling, W., 1976. Theory of the firm: Managerial behavior, agency costs,
and ownership structure. Journal of Financial Economics 11, 5-50
Johnson, S., La Porta, R., Lopez-De-Silanes, F., Shleifer, A., 2000. Tunneling. American
Economic Review 90, 22-27
Kroszner, R.S., 2003. Is it Better to Forgive than to Receive? An Empirical Analysis of
the Impact of Debt Repudiation. NBER
McConnell, J.J., Servaes, H., 1990. Additional evidence on equity ownership and
corporate value. Journal of Financial Economics 27, 595-612
McDonald, F., 1962. Insull. The University of Chicago Press, Chicago, IL.
Moody's, 1935. Moody's Manual of Investments: Public Utility Securities. Moody's
Investors Service, Ltd., London.

32
Morck, R., Shleifer, A., Vishny, R.W., 1988. Management ownership and market
valuation : An empirical analysis. Journal of Financial Economics 20, 293-315
Priest, G.L., 1993. The Origins of Utility Regulation and the "Theories of Regulation"
Debate. Journal of Law and Economics 36, 289-323
Seligman, J., 2003. The transformation of Wall Street : a history of the Securities and
Exchange Commission and modern corporate finance. Aspen Publishers, New
York.
Shleifer, A., Vishny, R., 1997. A survey of corporate governance. Journal of Finance 52,
737-783
Shleifer, A., Vishny, R., 1998. The Grabbing Hand: Government Pathologies and Their
Cures. Harvard University Press, Cambridge, MA.
33
Table 1. Sample firms.
Name Market Parent company Type Debt
rating
American & Foreign Power, Inc. NYSE Elec. Bond & Shr. Prey B
American Gas & Electric Co. Curb Elec. Bond & Shr. Prey A
American Light & Traction Co. Curb Unit. L. &Rwys* Prey A
American Power & Light Co. NYSE Elec. Bond & Shr. Prey Ba
American Water Works & Electric Co. NYSE Elec. Pwr. & Lt. Prey Ba
Arkansas Natural Gas Co. Curb Cities Service Prey n/a
Brooklyn Union Gas Co. NYSE None Neither A
Cities Service Co. Curb None Predator B
Columbia Gas & Electric Co. NYSE United Corp. Prey Baa
Commonwealth & Southern Corp. NYSE None Neither A
Commonwealth Edison Co. Curb None Predator A
Consolidated Gas, Electric Light &
Power Co. of Baltimore Curb None Neither A
Consolidated Gas Co. of NY NYSE None Neither A
Detroit Edison Co. NYSE North American Co Prey A
Duke Power Curb None Neither A
Electric Bond & Share Co. Curb None Predator Ba
Electric Power & Light Corp. NYSE Elec. Bond & Shr. Both B
Engineers Public Service Co. NYSE Stone & Webster Prey Baa
Federal Light & Traction Co. NYSE Cities Service Both Ba
Hackensack Water Co. NYSE None Neither A
Laclede Gas & Light Co. NYSE Utilities Pwr & Lt. Prey Ba
Long Island Lighting Co. Curb None Neither Baa
Memphis Natural Gas Co. Curb Commonwlth Gas* Prey Baa
National Power & Light Co. NYSE Elec. Bond & Shr. Prey Ba
Niagara Hudson Power Corp. Curb United Corp. Prey A
North American Co. NYSE None Predator Baa
Pacific Gas & Electric Co. NYSE North American Co Prey A
Pacific Lighting Corp. NYSE None Neither A
Peoples Gas Light & Coke Co. NYSE None Neither Baa
Public Service Corp. of NJ NYSE United Gas Imprvt. Prey A
Southern California Edison Co. NYSE None Neither A
Standard Gas & Electric Co. NYSE Standard Pwr & Lt. Both B
Standard Power & Light Corp. Curb U.S. Electric Pwr* Both B
Stone & Webster Inc. NYSE None Predator Baa
Tampa Electric Corp. Curb Stone & Webster Prey n/a
United Corp. NYSE None Predator A
United Gas Corp. Curb Elec. Pwr. & Lt. Both Baa
United Gas Improvement Co. NYSE United Corp. Both A
Utilities Power & Light Co. Curb None Predator B

34
Parent companies marked with an asterisk are not traded on the NYSE or Curb and
therefore not part of the sample.

35
Table 2. Description of legislative events
Event # Date Description Effect
1 11/21/1934 Rumor that Admin. bill will ban holding companies ↑ 2 1/11/1935 Rayburn speaks in favor of abolishing holding companies ↑ 3 2/6/1935 Rayburn-Wheeler bill introduced ↑ 4 4/23/1935 Informal House subcommittee vote against §11 ↓ 5 5/7/1935 Informal Senate committee vote against §11 ↓ 6 5/8/1935 Senate committee approves “death penalty” delay until
1942 ↑
7 6/11/1935 Senate passes bill with amended §11 ↑ 8 6/17/1935 House subcommittee votes to remove §11 ↓ 9 7/2/1935 House votes to remove §11 ↓ 10 8/1/1935 House rejects motion to reinstate §11 following lobbying
relevations ↓
11 8/22/1935* House approves Barkley compromise ↑ 12 8/23/1935* Conference committee approves Barkley compromise ↑ 13 8/24/1935 House and Senate pass HCA ↑ 14 8/26/1935 President signs HCA ↑ 15 11/7/1935 District court declares HCA unconstitutional in entirety ↓
* denotes an event known to have occurred after the close of trading
The column headed “effect” indicates by an up or down arrow whether the event
would have increased or decreased assessments of the probability of a partial or total
ban on utility holding companies.

36
Table 3. Abnormal returns around legislative events
Abnormal return in percent; t-statistics in parentheses
Date Predators Both predator
and prey
Prey Independent
0.93 2.33 1.41 1.07 Nov. 21, 1934
(0.62) (1.83) (1.34) (0.93)
-2.08 1.37 0.16 0.45 Nov. 21, 1934
(-1.39) (1.07) (0.15) (0.39)
-1.15 3.70* 1.57 1.51 2-day window
(-0.54) (2.05) (1.06) (0.93)
-0.50 -0.55 0.90 -0.34 Jan. 11, 1935
(-0.33) (-0.43) (0.85) (-0.30)
-1.66 -0.23 -1.57 0.45 Jan 12, 1935
(-1.11) (-0.18) (-1.49) (0.39)
-2.15 -0.78 -0.68 0.10 2-day window
(-1.02) (-0.43) (-0.45) (0.06)
0.28 -1.12 -0.54 -0.04 Feb. 6, 1935
(0.19) (-0.88) (-0.52) (-0.04)
-1.81 -0.92 -1.41 0.55 Feb 7, 1935
(-1.21) (-0.72) (-1.34) (0.48)
-1.53 -2.04 -1.95 0.50 2-day window
(-0.72) (-1.13) (-1.31) (0.31)
3.59* 4.01** 2.68* 2.09 April 23, 1935
(2.41) (3.14) (2.55) (1.83)
1.54 -1.51 1.68 2.81* April 24, 1935
(1.03) (-1.18) (1.59) (2.46)
5.13* 2.51 4.36* 4.90* 2-day window
(2.43) (1.39) (2.93) (3.03)
-0.99 -3.16* -0.34 3.19* June 11, 1935
(-0.66) (-2.47) (-0.32) (2.79)
-4.90** -5.28** -2.98** -3.05** June 12, 1935
(-3.28) (-4.13) (-2.83) (-2.66)
-5.88** -8.44** -3.32* 0.14 2-day window
(-2.79) (-4.67) (-2.23) 0.09
1.96 -0.40 2.79** 2.61* June 17, 1935
(1.32) (-0.31) (2.64) (2.28)
0.51 -0.36 0.37 -0.81 June 18, 1935
(0.34) (-0.28) (0.35) (-0.71)
2.47 -0.76 3.16* 1.80 2-day window
(1.17) (-0.42) (2.12) (1.11)
7.10** 1.96 2.45* 1.54 July 2, 1935
(4.75) (1.53) (2.32) (1.34)
July 3, 1935 1.85 2.41 0.87 0.96

37
(1.24) (1.88) (0.82) (0.84)
8.95** 4.36* 3.31* 2.50 2-day window
(4.24) (2.41) (2.22) (1.54)
0.33 -0.62 -0.78 -0.75 Aug. 1, 1935
(0.22) (-0.49) (-0.74) (-0.66)
4.47** 1.44 2.31* 1.32 Aug. 2, 1935
(3.00) (1.13) (2.19) (1.15)
4.80* 0.82 1.53 0.56 2-day window
(2.27) (0.45) (1.03) (0.35)
-0.08 2.01 -1.06 0.51 Aug. 22, 1935
(-0.05) (1.58) (-1.01) (0.44)
-7.45** -6.47** -2.99** -3.26** Aug. 23, 1935
(-4.99) (-5.06) (-2.84) (-2.85)
-8.41** -7.71** -3.84** -1.49 Aug 24, 1935
(-5.63) (-6.04) (-3.64) (-1.30)
6.60** -0.22 1.48 -0.12 Aug 26. 1935
(4.42) (-0.18) (1.41) (-0.10)
-4.55** -0.95 -3.30** -3.80** Aug. 27, 1935
(-3.05) (-0.74) (-3.13) (-3.32)
-13.88** -13.34** -9.71** -8.17** 5-day window
(-9.27) (-7.62) (-4.57) (-4.18)
-0.07 -0.95 0.11 -0.08 Nov. 7, 1935
(-0.05) (-0.74) (0.10) (-0.07)
5.82** 4.13** 2.04 4.19** Nov. 8, 1935
(3.90) (3.23) (1.94) (3.66)
5.74** 3.18 2.15 4.11* 2-day window
(2.72) (1.76) (1.44) (2.54)

38
Table 4
Model 1 Model 2
Constant 1.86**
(0.25)
1.18*
(0.49)
Negative event -4.71**
(0.27)
-1.67**
(0.50)
Predator 1.25
(0.96)
Prey -0.47*
(0.24)
Predator * negative event -4.52**
(1.04)
Prey * negative event -2.72**
(0.26)
Adjusted r-squared 0.31 0.39
n 234 234
** denotes significance at the 1% level. Standard errors (in parentheses) are clustered on
firms.

39
Table 5
Model 1 Model 2
Constant 2.69
(1.49)
1.99*
(1.22)
Negative event -8.51**
(1.49)
-4.84**
(1.29)
A or higher rating -1.44
(1.55)
-0.93
(1.28)
A or higher rating * negative event 6.00**
(1.56)
3.59**
(1.30)
Baa rating -0.87
(1.73)
-0.51
(1.57)
Baa rating * negative event 3.54*
(1.74)
1.88
(1.62)
Ba rating 0.10
(1.64)
1.31
(1.43)
Ba rating * negative event 0.70
(1.65)
-0.48
(1.51)
Predator 0.71
(0.52)
Predator * negative event -2.96**
(0.72)
Prey 0.16
(0.20)
Prey * negative event -1.81**
(2.16)
Adjusted r-squared 0.42 0.43
n 222 222

Figure 1.
Structure of the United Corporation utility holding company system. Companies described in the shaded boxes are not contained in
the sample. The principal trading market for the common stock of companies in the sample is also shown.
United Corp.
(NYSE)
United Gas
Improvement
Co.
(NYSE)
Columbia
Gas &
Electric Corp.
(NYSE)
41
subsidiaries
>95% owned;
3 small
subsidiaries
>70% owned
20.7% 26.1%
Connecticut
Electric
Service Co.
(OTC)
61.1%
13
subsidiaries
>95% owned;
5 small
subsidiaries
>50% owned
Public Service
Corp. of NJ
(NYSE)
17.9%
36.7%
15
subsidiaries
>95% owned;
Niagara
Hudson
Power Corp.
(Curb)
21.9%
14
subsidiaries
>95% owned;