Public Power Utility Value
53
Public Power Utility Value from Outsider and Insider Perspectives PFM Charlotte, NC pfm.com Michael Mace, Managing Director Chris Lover, Managing Director September 17, 2018
Transcript of Public Power Utility Value

© PFM 1
Public Power Utility Valuefrom
Outsider and Insider Perspectives
PFM Charlotte, NC pfm.com
Michael Mace, Managing DirectorChris Lover, Managing DirectorSeptember 17, 2018

© PFM 2
TopicsRecent Public Power Headlines
The Utility Landscape
IOU Merger Activity and Drivers
The Merger Math
The Local Impacts and Considerations

© PFM 3
Recent Public Power Headlines
© PFM 4
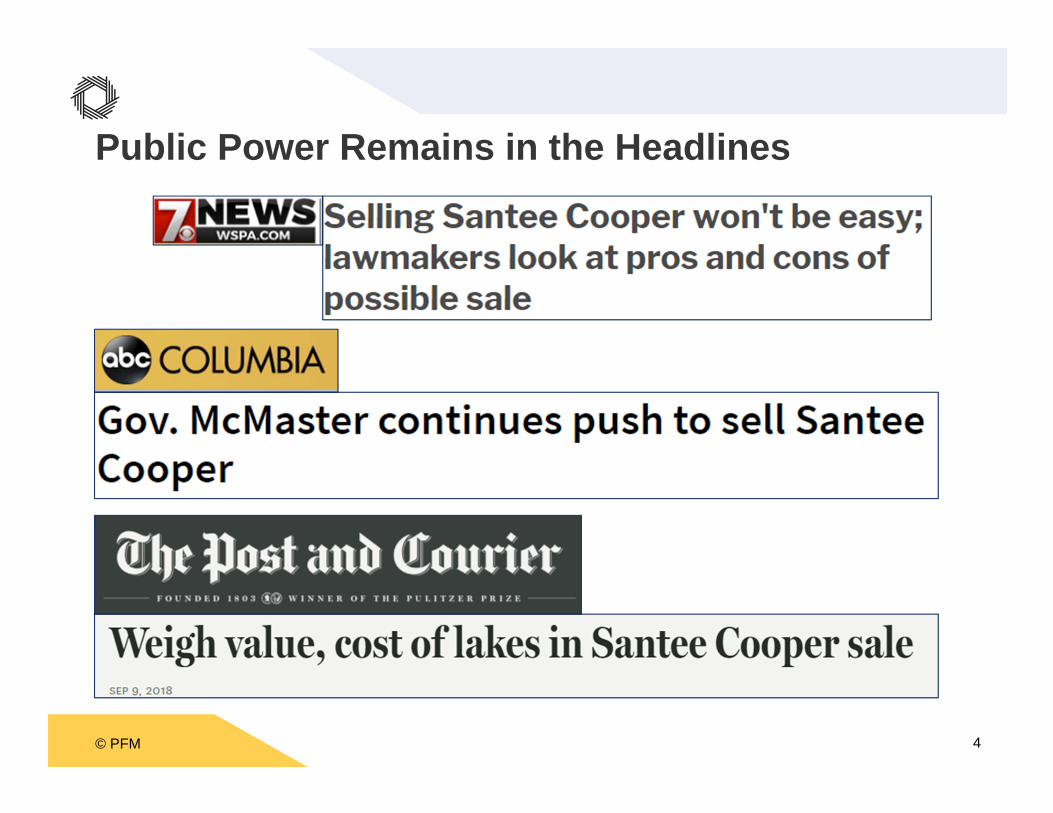
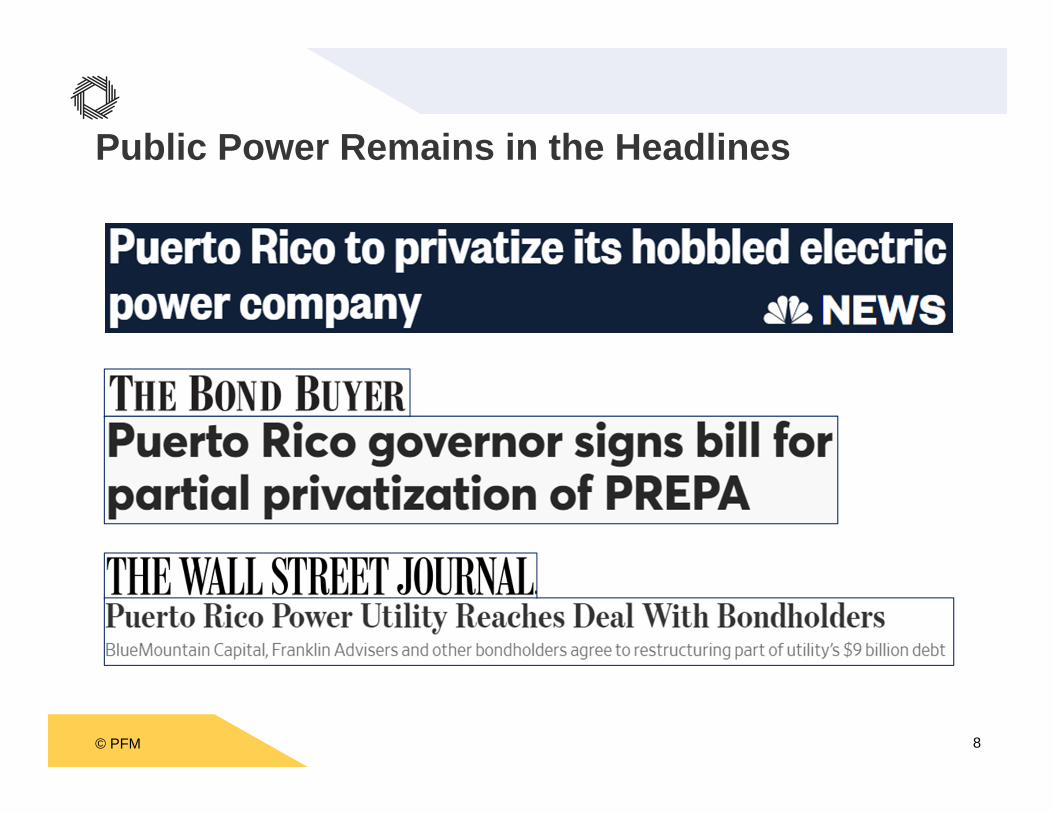
Public Power Remains in the Headlines
© PFM 5
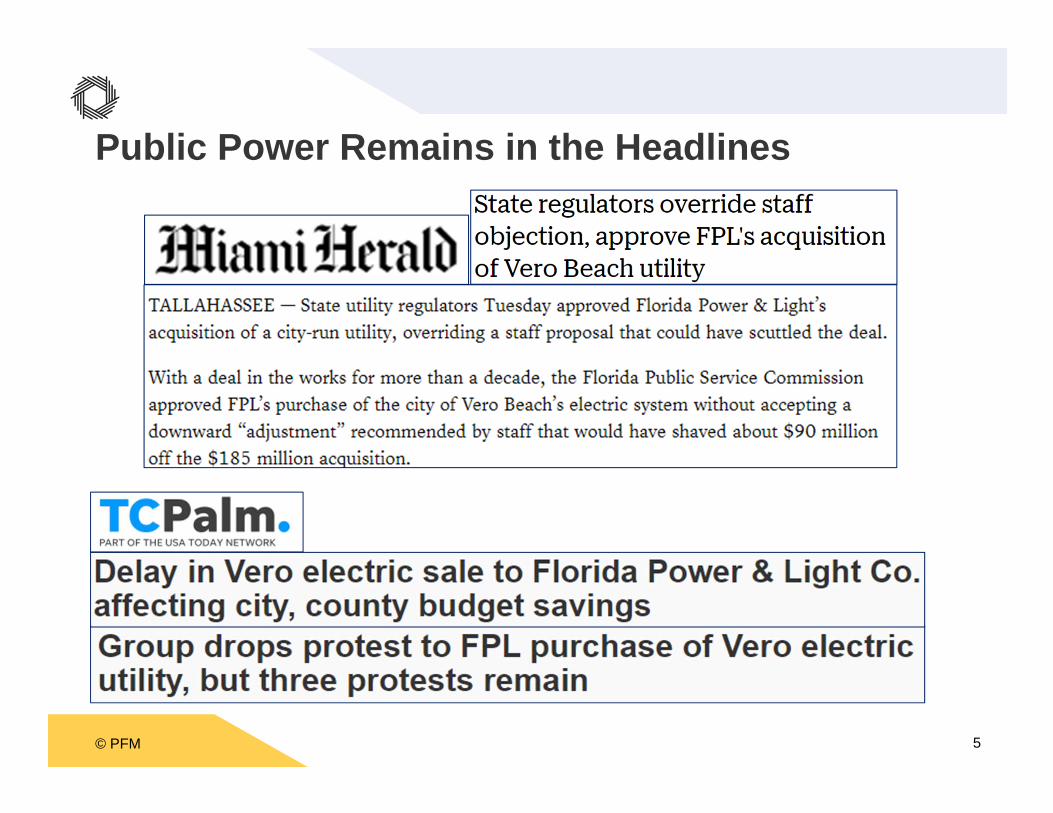
Public Power Remains in the Headlines
© PFM 6
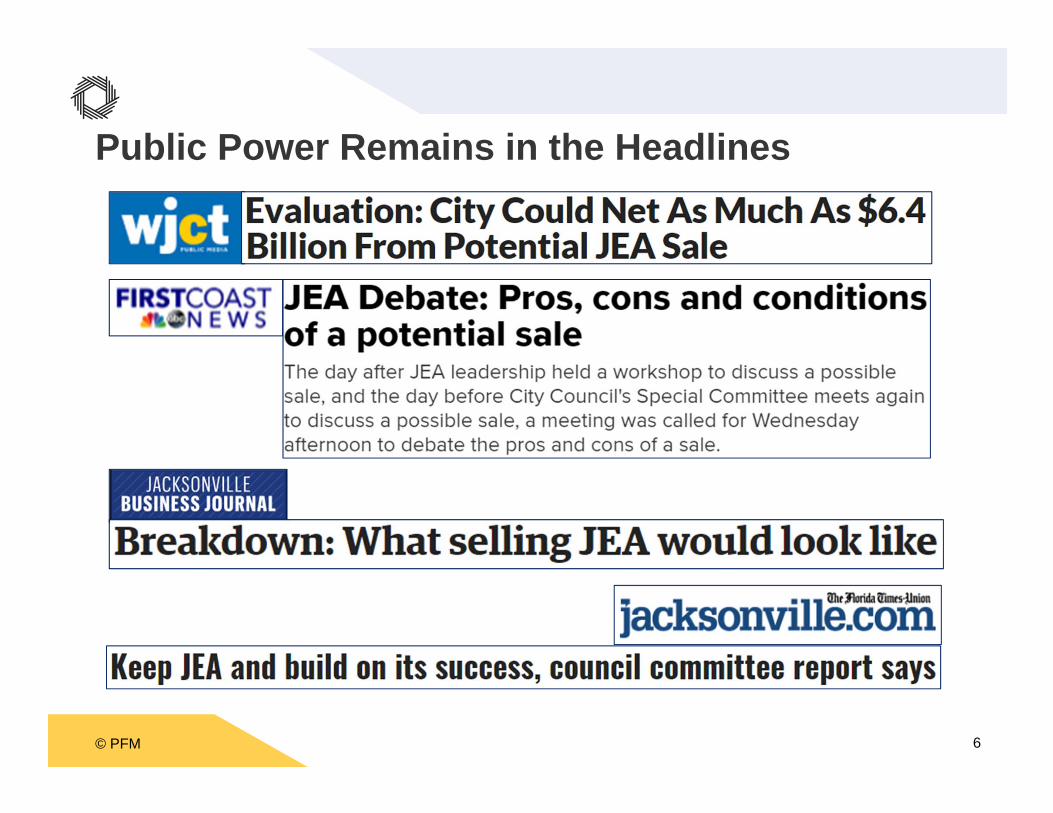
Public Power Remains in the Headlines
© PFM 7
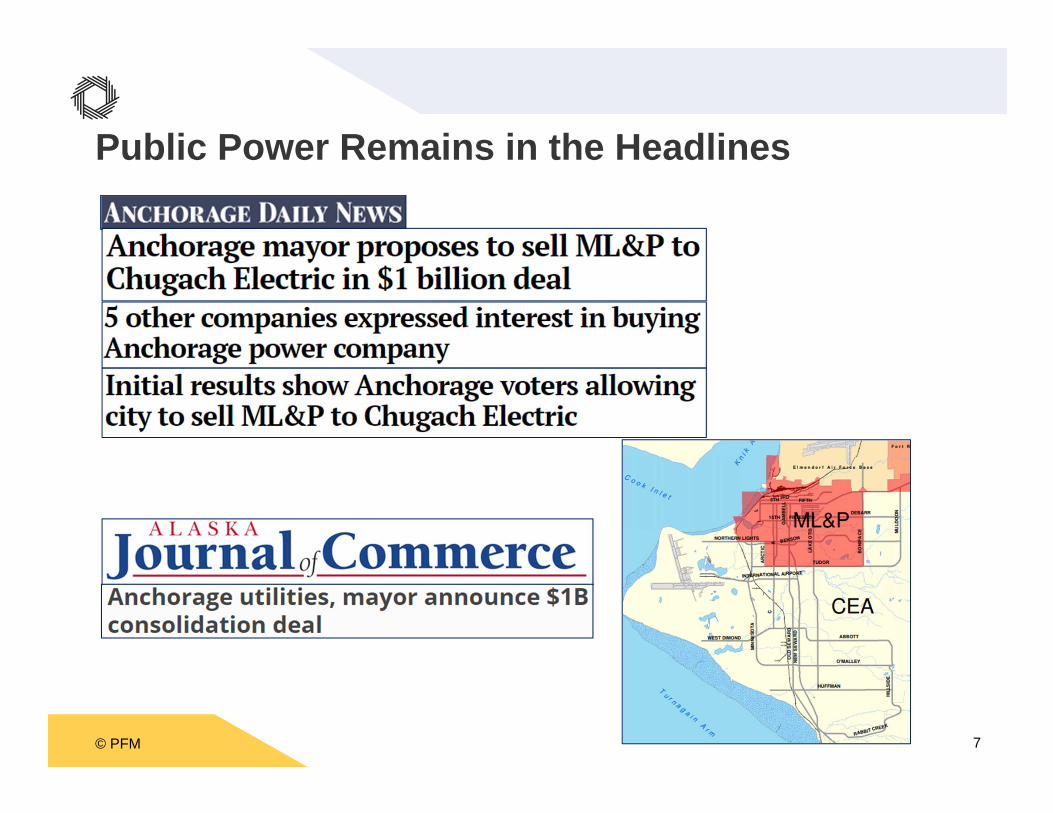
Public Power Remains in the Headlines
© PFM 8
Public Power Remains in the Headlines
© PFM 9
Is Public Power for Sale?
Is this an Industry Wide Trend?
Likely Not• Each of the examples display unique circumstances
• And there is no common thread that is systemic to public power

© PFM 10
The Utility Landscape
© PFM 11
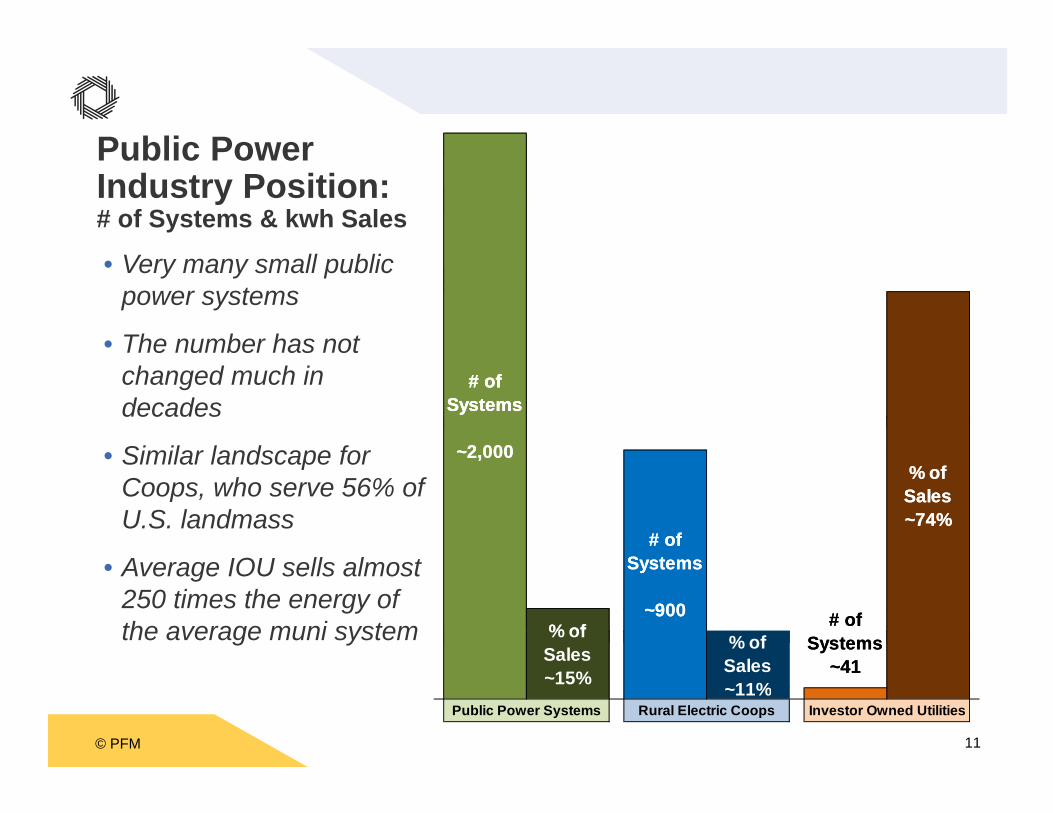
Public Power Industry Position:# of Systems & kwh Sales
• Very many small public power systems
• The number has not changed much in decades
• Similar landscape for Coops, who serve 56% of U.S. landmass
• Average IOU sells almost 250 times the energy of the average muni system
# of Systems
~2,000
# of Systems
~2,000
# of Systems
~2,000
# of Systems
~2,000
# of Systems
~2,000
# of Systems
~2,000% of
Sales~74%
# of Systems
~2,000
% of Sales~15%
% of Sales~74%
% of Sales~11%
# of Systems
~41
# of Systems
~2,000
# of Systems
~900% of
Sales~15%
% of Sales~74%
% of Sales~11%
# of Systems
~41
Public Power Systems Rural Electric Coops Investor Owned Utilities
# of Systems
~2,000
# of Systems
~900
© PFM 12
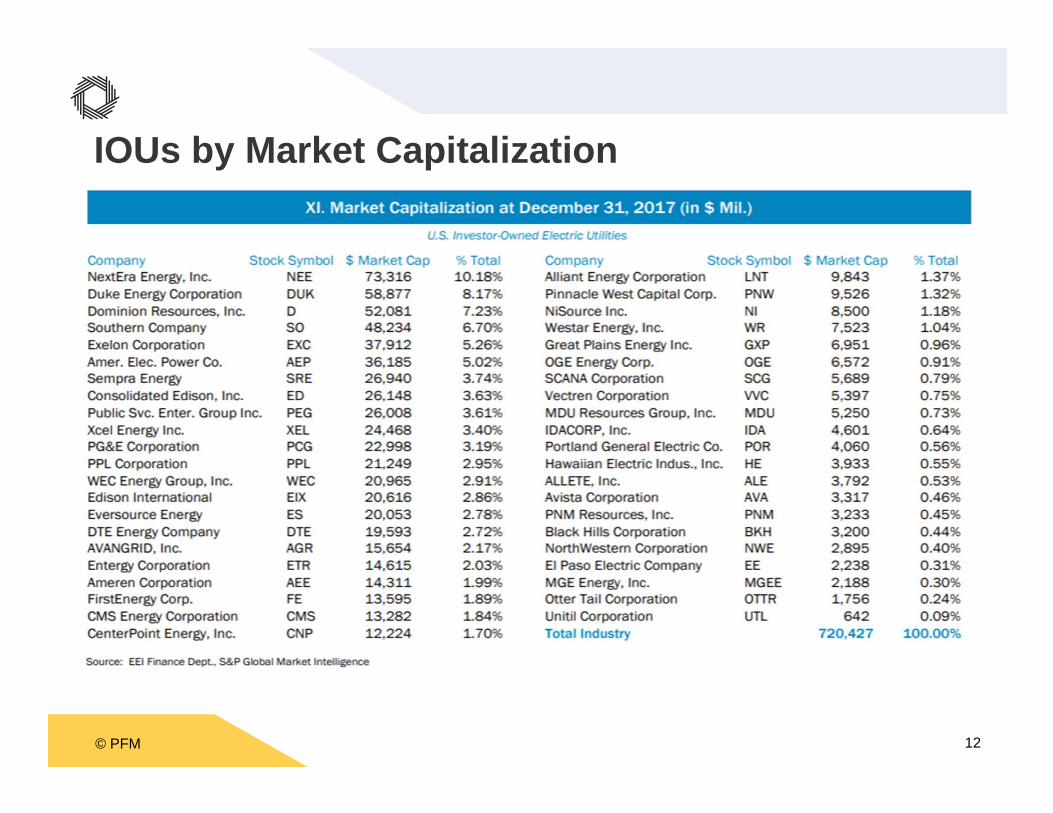
IOUs by Market Capitalization
© PFM 13
0 10 20 30 40 50 60 70 80
Xcel
PSEG
Con Ed
Sempra
Amer Elec
Exelon
Southern
Dominion
Duke
Nextera
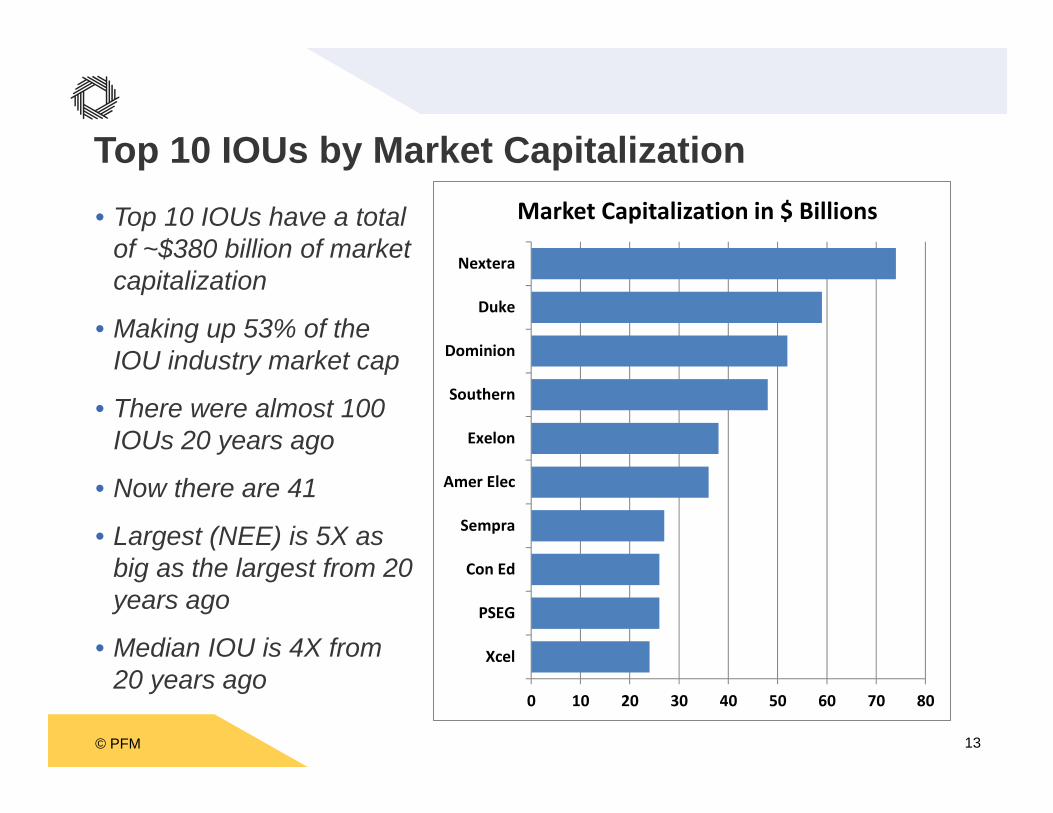
Market Capitalization in $ Billions
Top 10 IOUs by Market Capitalization• Top 10 IOUs have a total
of ~$380 billion of market capitalization
• Making up 53% of the IOU industry market cap
• There were almost 100 IOUs 20 years ago
• Now there are 41
• Largest (NEE) is 5X as big as the largest from 20 years ago
• Median IOU is 4X from 20 years ago
© PFM 14
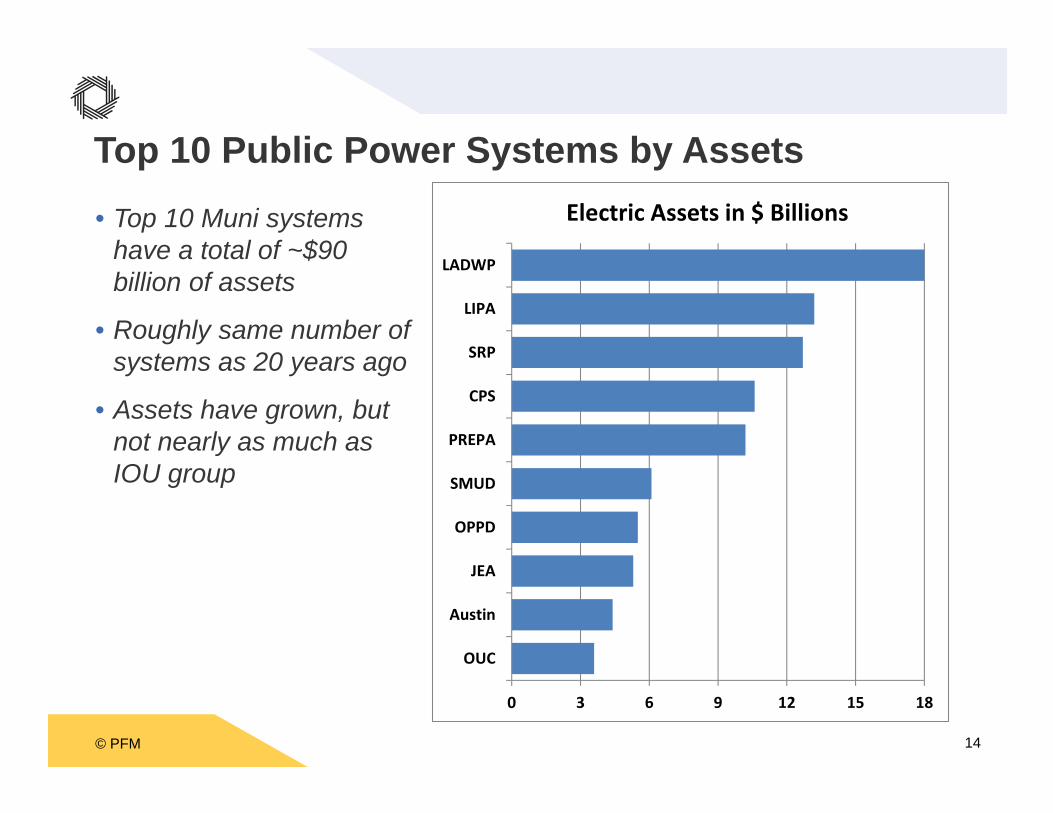
Top 10 Public Power Systems by Assets• Top 10 Muni systems
have a total of ~$90 billion of assets
• Roughly same number of systems as 20 years ago
• Assets have grown, but not nearly as much as IOU group
0 3 6 9 12 15 18
OUC
Austin
JEA
OPPD
SMUD
PREPA
CPS
SRP
LIPA
LADWP
Electric Assets in $ Billions
© PFM 15
0 10 20 30 40 50 60 70 80
XcelPSEG
Con EdSempra
Amer ElecExelon
SouthernDominion
DukeNextera
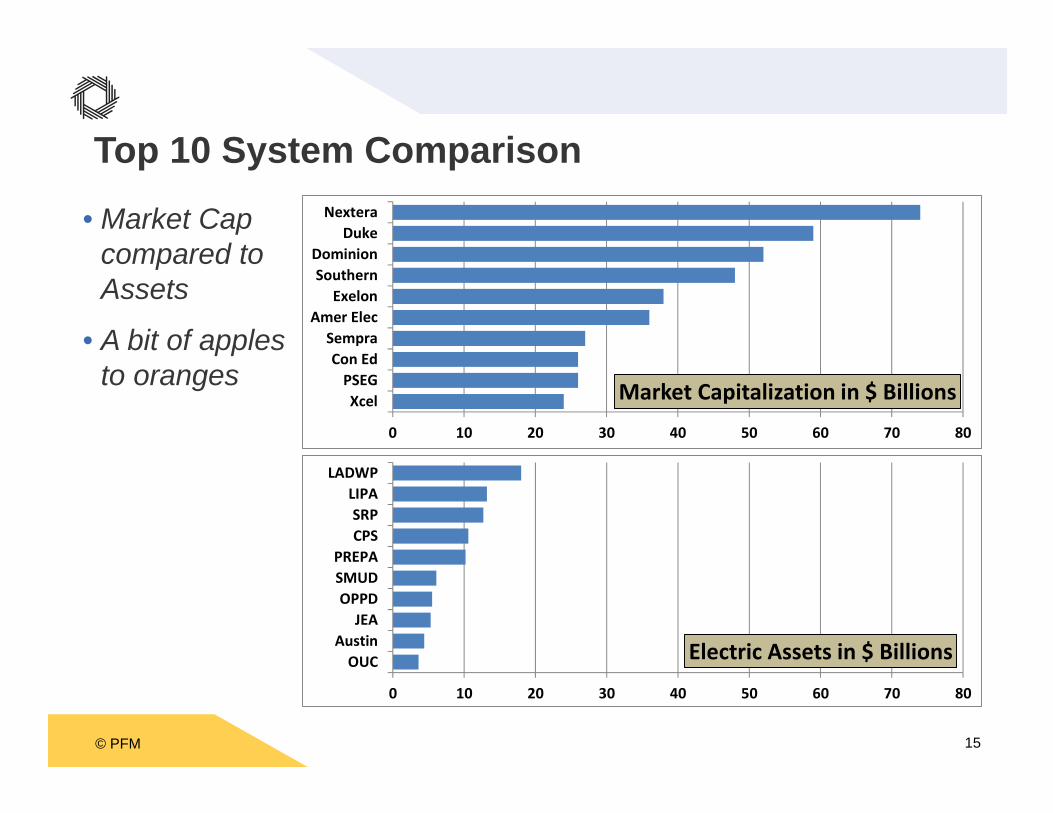
Market Capitalization in $ Billions
Top 10 System Comparison
• Market Cap compared to Assets
• A bit of apples to oranges
0 10 20 30 40 50 60 70 80
OUCAustin
JEAOPPDSMUDPREPA
CPSSRPLIPA
LADWP
Electric Assets in $ Billions

© PFM 16
IOU Merger Activity and Drivers
© PFM 17
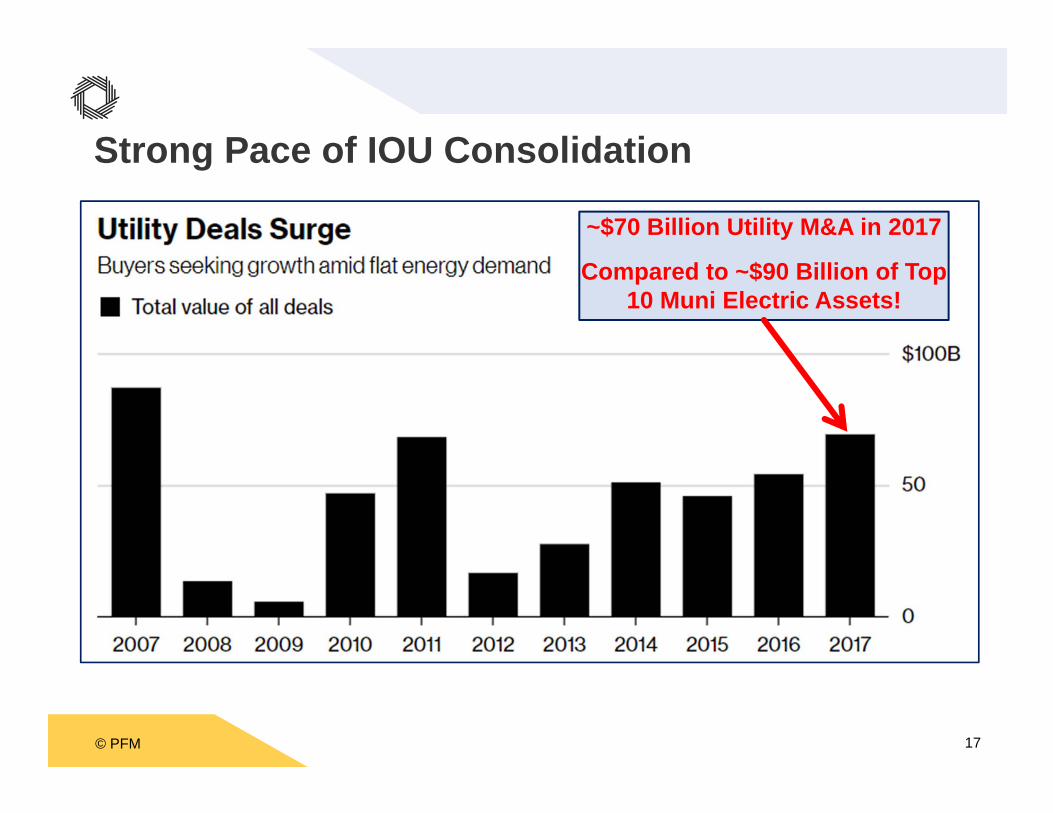
Strong Pace of IOU Consolidation
~$70 Billion Utility M&A in 2017
Compared to ~$90 Billion of Top 10 Muni Electric Assets!
© PFM 18
Strong Pace of IOU ConsolidationStrong Overall M&A Market Conditions
• Cash on balance sheets• Low interest rates and high equity prices• Investors are supportive of M&A – vast capital access• Large base of strategic and financial buyers of all assets• Demand both internationally and domestic • Lower corporate tax rates
© PFM 19
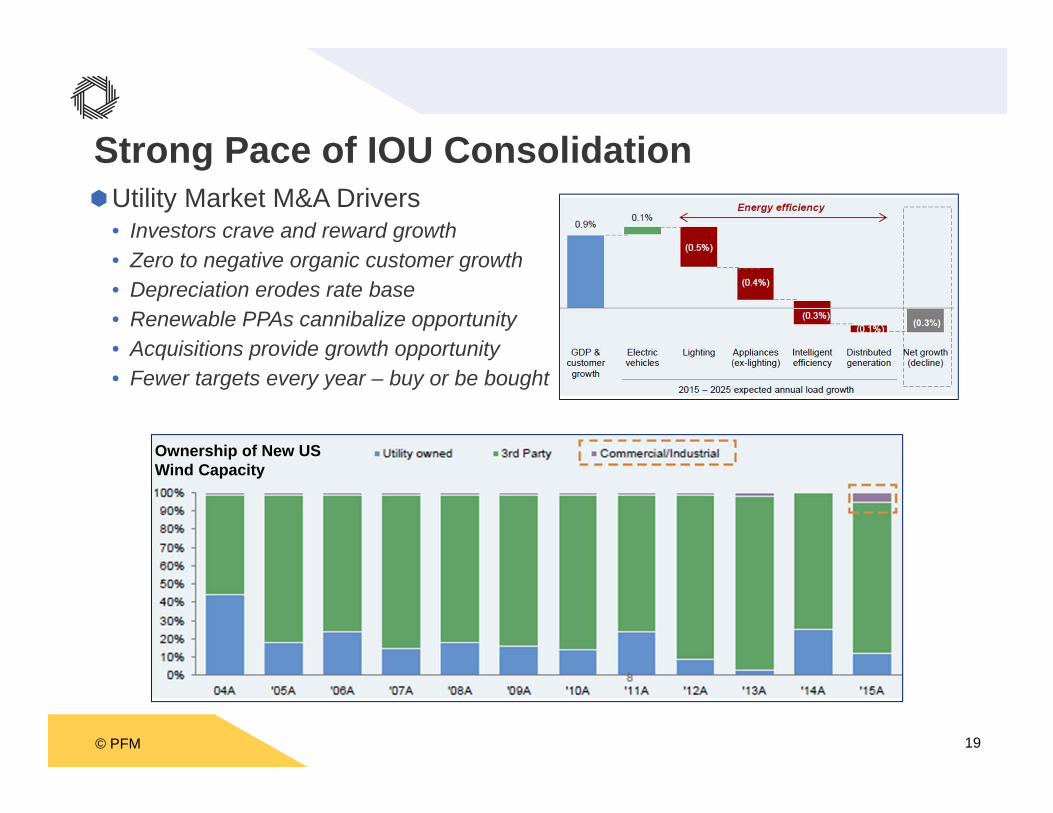
Strong Pace of IOU ConsolidationUtility Market M&A Drivers
• Investors crave and reward growth• Zero to negative organic customer growth• Depreciation erodes rate base• Renewable PPAs cannibalize opportunity • Acquisitions provide growth opportunity• Fewer targets every year – buy or be bought
Ownership of New US Wind Capacity
© PFM 20
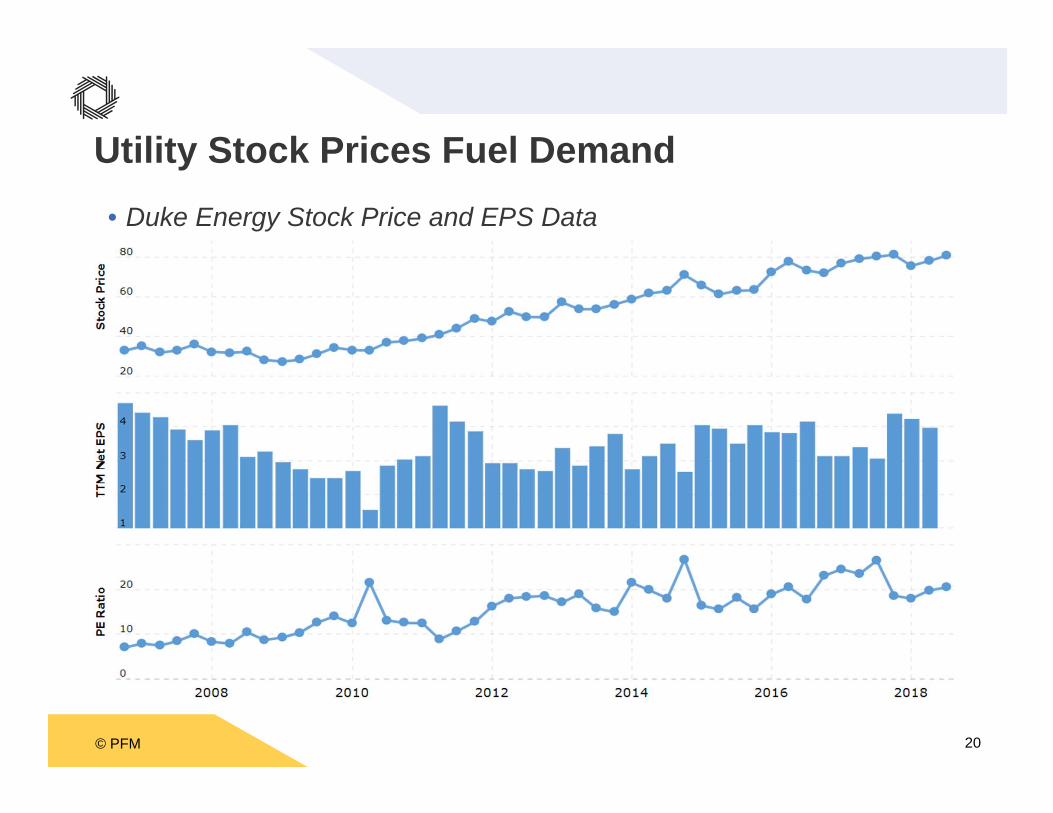
• Duke Energy Stock Price and EPS Data
Utility Stock Prices Fuel Demand
© PFM 21
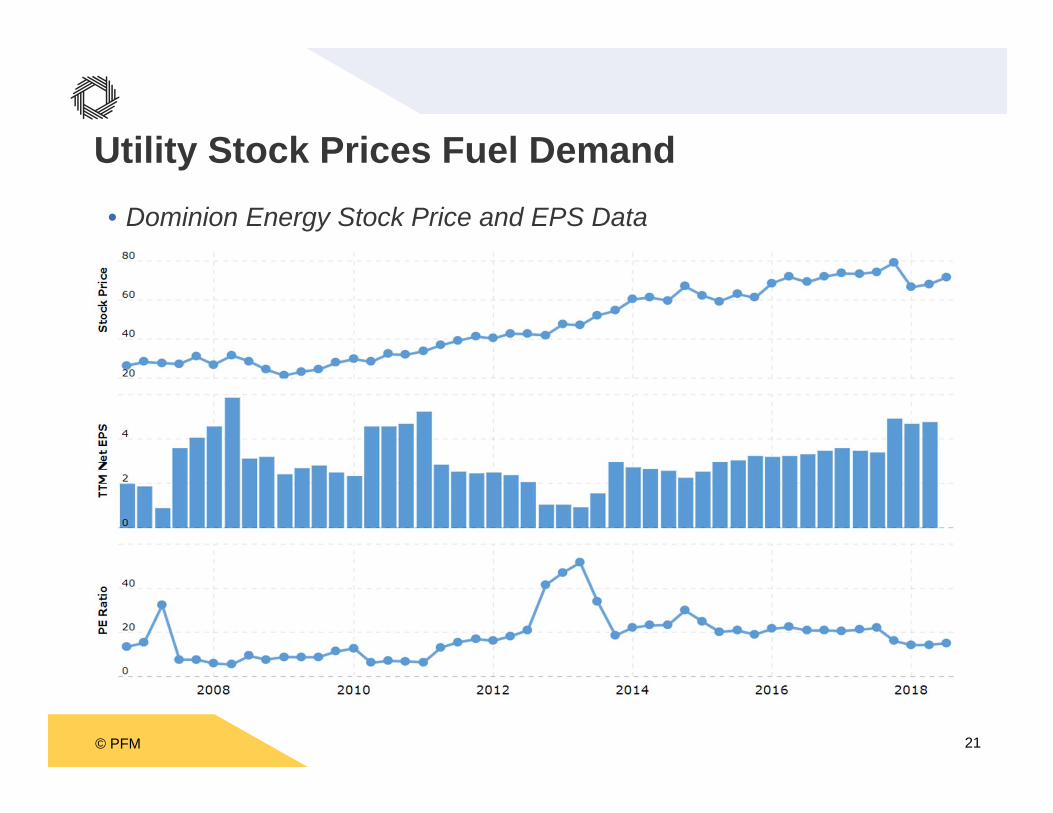
• Dominion Energy Stock Price and EPS Data
Utility Stock Prices Fuel Demand
© PFM 22
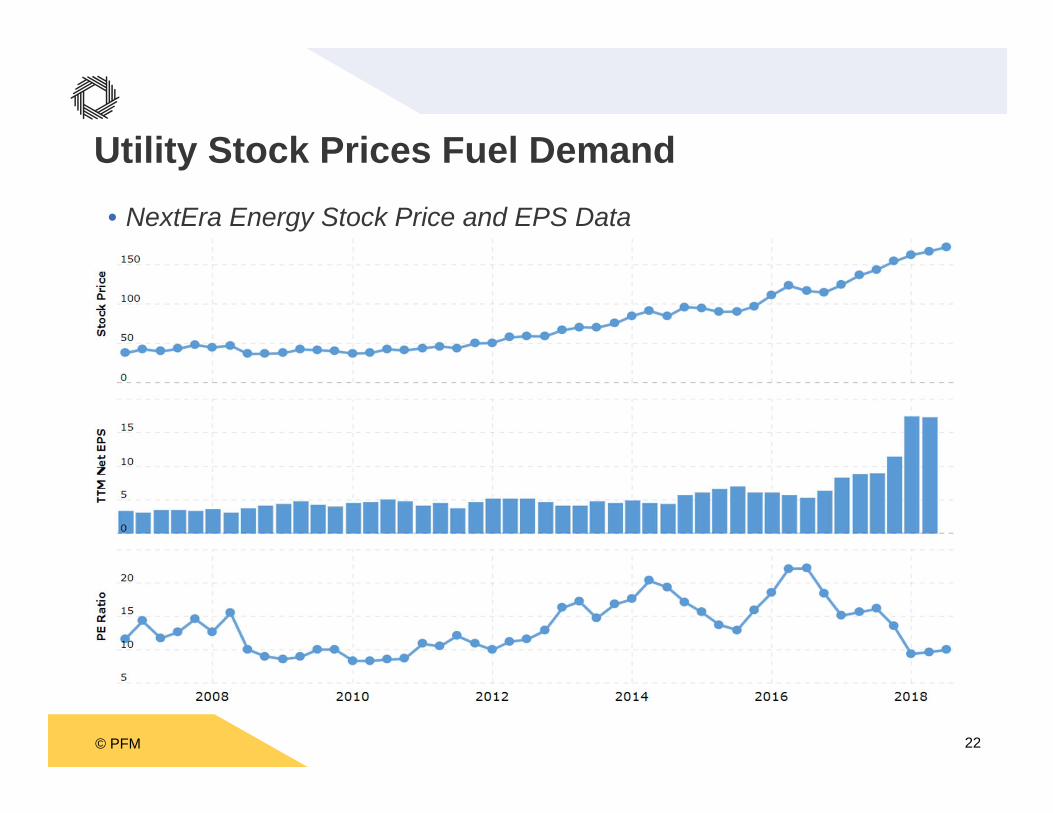
• NextEra Energy Stock Price and EPS Data
Utility Stock Prices Fuel Demand
© PFM 23
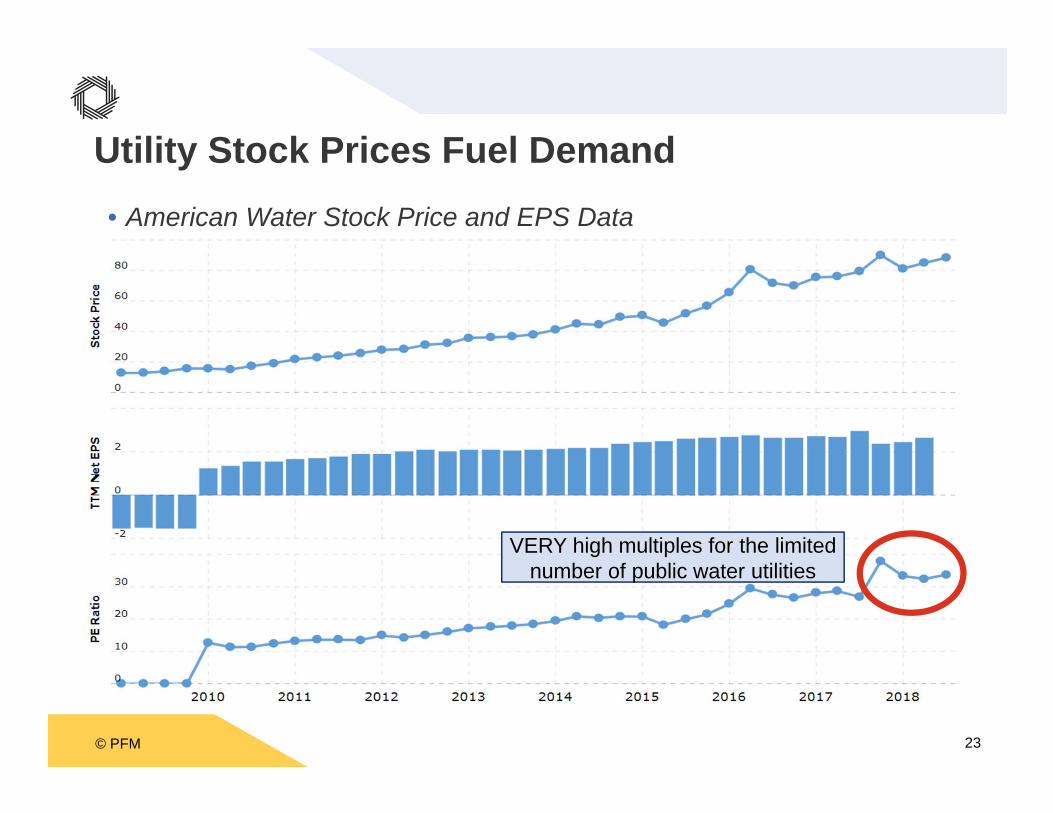
• American Water Stock Price and EPS Data
Utility Stock Prices Fuel Demand
VERY high multiples for the limited number of public water utilities
© PFM 24
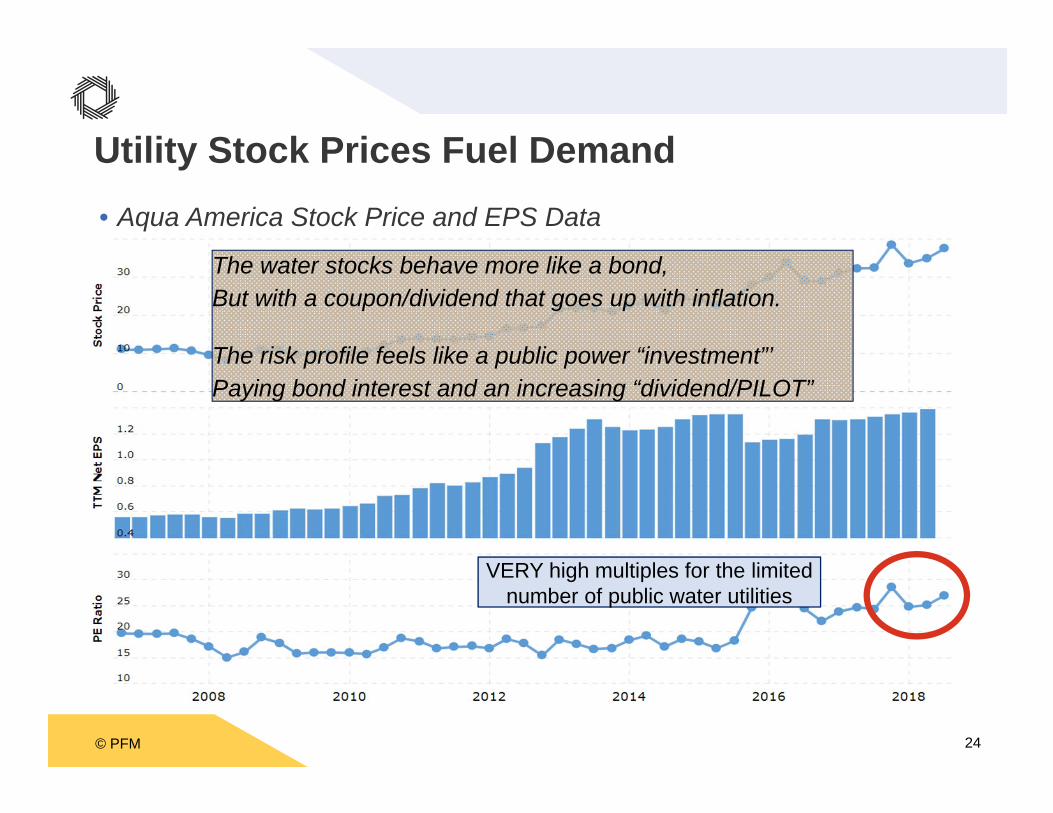
• Aqua America Stock Price and EPS Data
Utility Stock Prices Fuel Demand
VERY high multiples for the limited number of public water utilities
The water stocks behave more like a bond,But with a coupon/dividend that goes up with inflation.
The risk profile feels like a public power “investment”’Paying bond interest and an increasing “dividend/PILOT”
© PFM 25
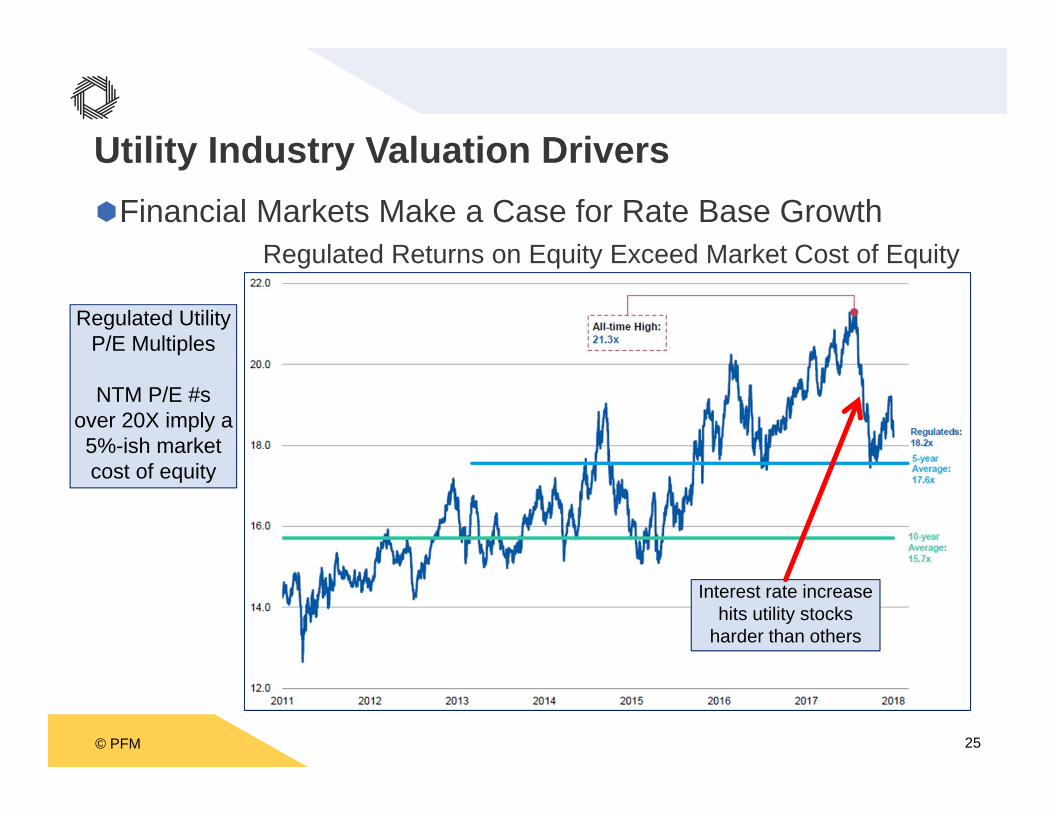
Utility Industry Valuation DriversFinancial Markets Make a Case for Rate Base Growth
Regulated Returns on Equity Exceed Market Cost of Equity
Regulated Utility P/E Multiples
NTM P/E #sover 20X imply a 5%-ish market cost of equity
Interest rate increase hits utility stocks
harder than others
© PFM 26
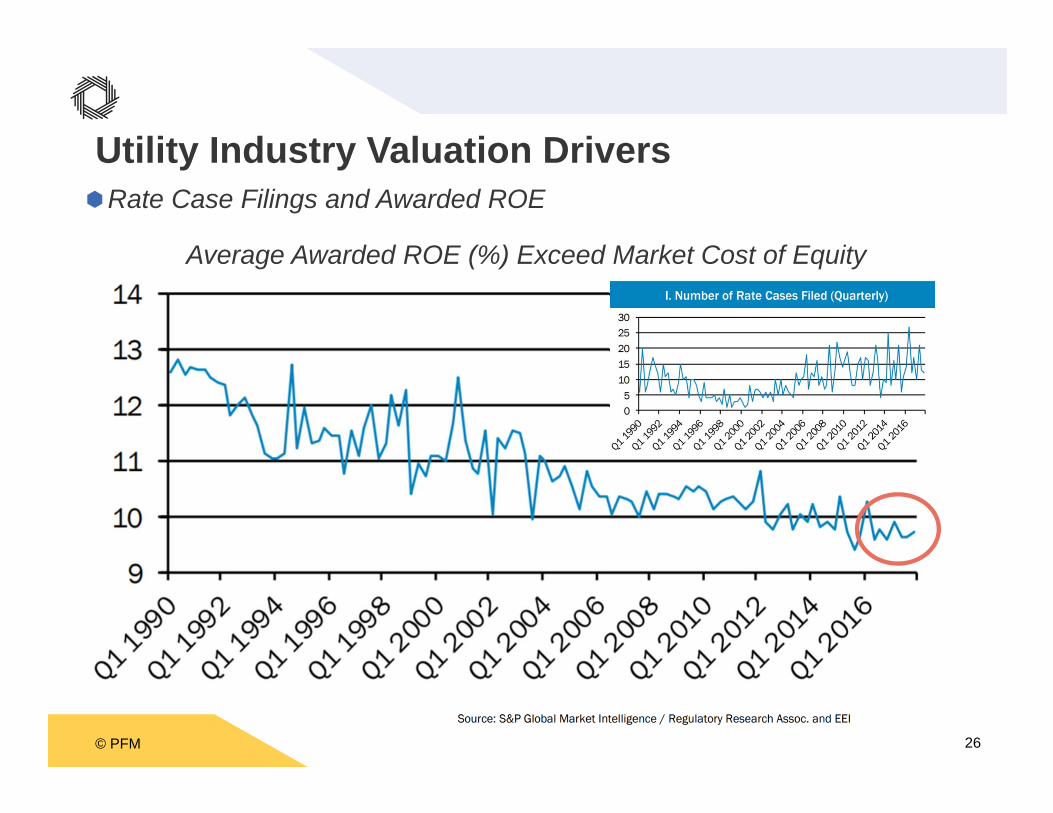
Utility Industry Valuation DriversRate Case Filings and Awarded ROE
Average Awarded ROE (%) Exceed Market Cost of Equity
© PFM 27
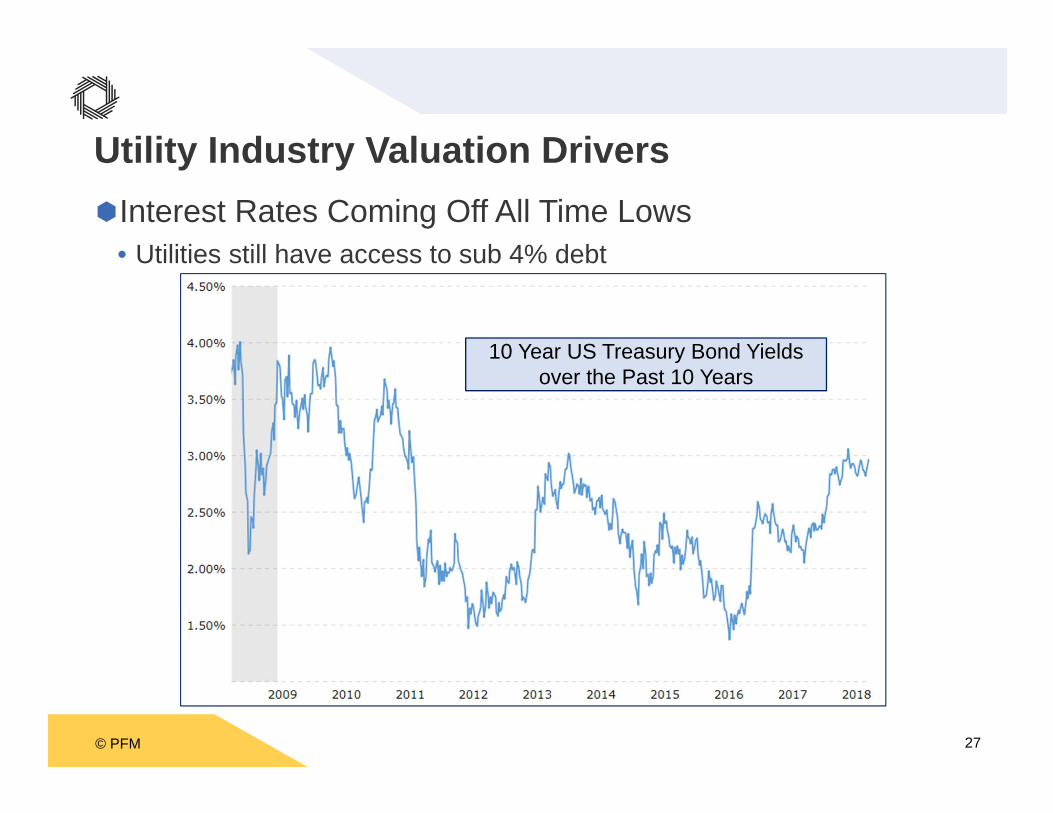
Utility Industry Valuation DriversInterest Rates Coming Off All Time Lows
• Utilities still have access to sub 4% debt
10 Year US Treasury Bond Yields over the Past 10 Years
© PFM 28
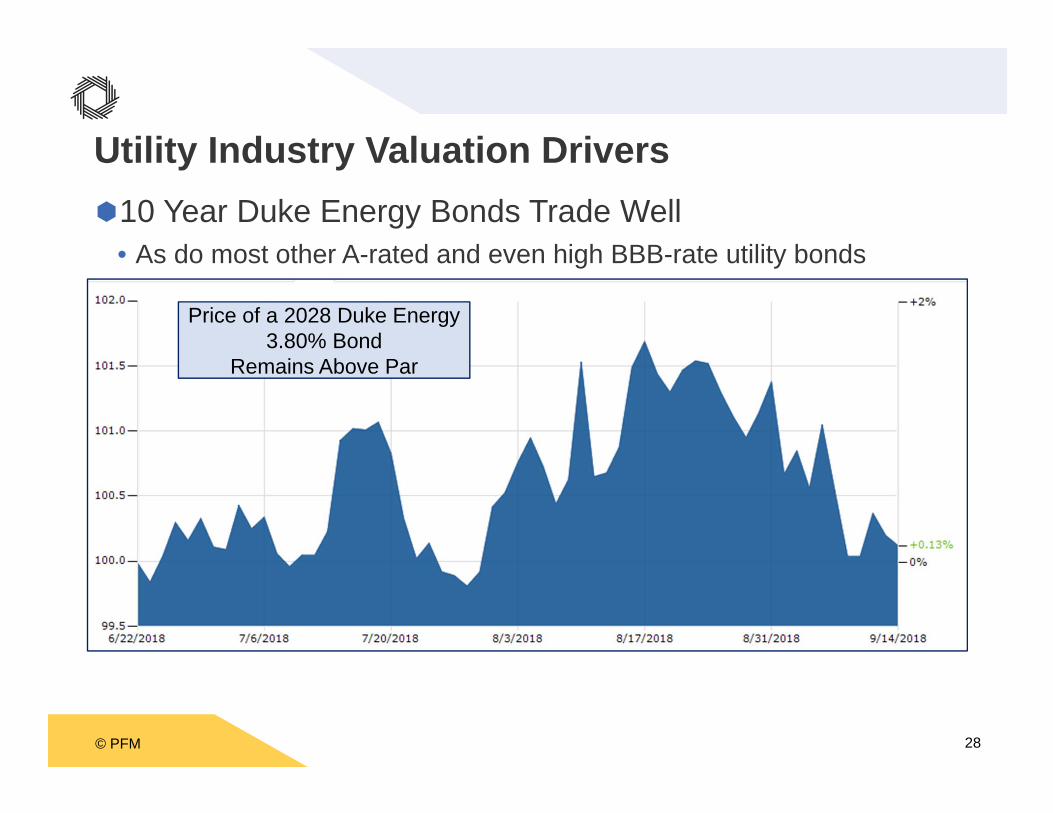
Utility Industry Valuation Drivers10 Year Duke Energy Bonds Trade Well
• As do most other A-rated and even high BBB-rate utility bonds
Price of a 2028 Duke Energy3.80% Bond
Remains Above Par
© PFM 29
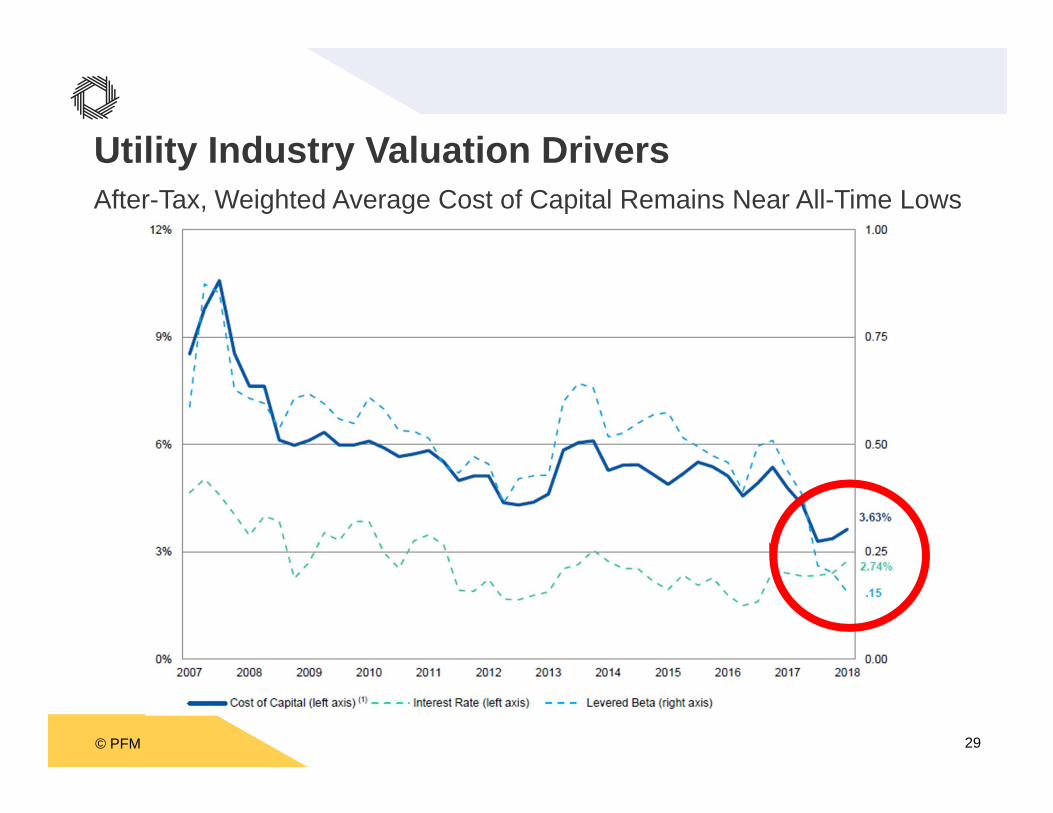
Utility Industry Valuation DriversAfter-Tax, Weighted Average Cost of Capital Remains Near All-Time Lows
Price of a 2028 Duke Energy 3.80% Bond Remains Above Par
© PFM 30
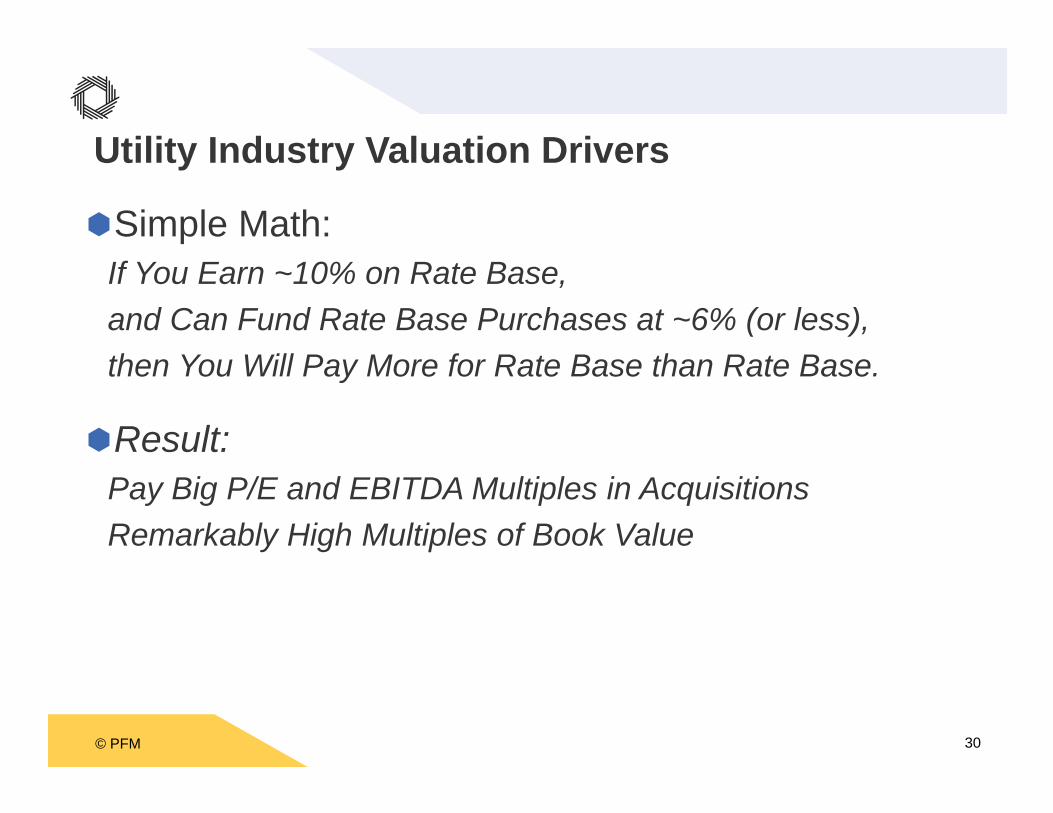
Simple Math:If You Earn ~10% on Rate Base,and Can Fund Rate Base Purchases at ~6% (or less),then You Will Pay More for Rate Base than Rate Base.
Result:Pay Big P/E and EBITDA Multiples in AcquisitionsRemarkably High Multiples of Book Value
Utility Industry Valuation Drivers
© PFM 31
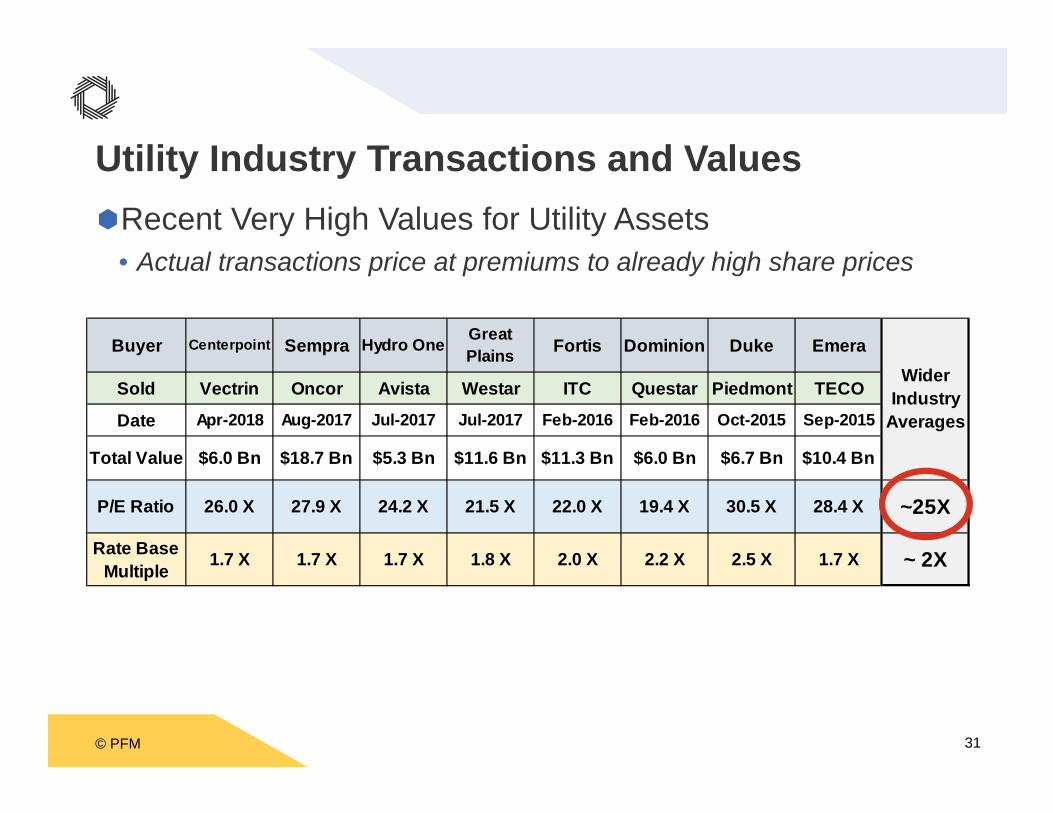
Buyer Centerpoint Sempra Hydro One Great Plains Fortis Dominion Duke Emera
Sold Vectrin Oncor Avista Westar ITC Questar Piedmont TECO
Date Apr-2018 Aug-2017 Jul-2017 Jul-2017 Feb-2016 Feb-2016 Oct-2015 Sep-2015
Total Value $6.0 Bn $18.7 Bn $5.3 Bn $11.6 Bn $11.3 Bn $6.0 Bn $6.7 Bn $10.4 Bn
P/E Ratio 26.0 X 27.9 X 24.2 X 21.5 X 22.0 X 19.4 X 30.5 X 28.4 X ~25X
Rate Base Multiple 1.7 X 1.7 X 1.7 X 1.8 X 2.0 X 2.2 X 2.5 X 1.7 X ~ 2X
Wider Industry
Averages
Utility Industry Transactions and ValuesRecent Very High Values for Utility Assets
• Actual transactions price at premiums to already high share prices
© PFM 32
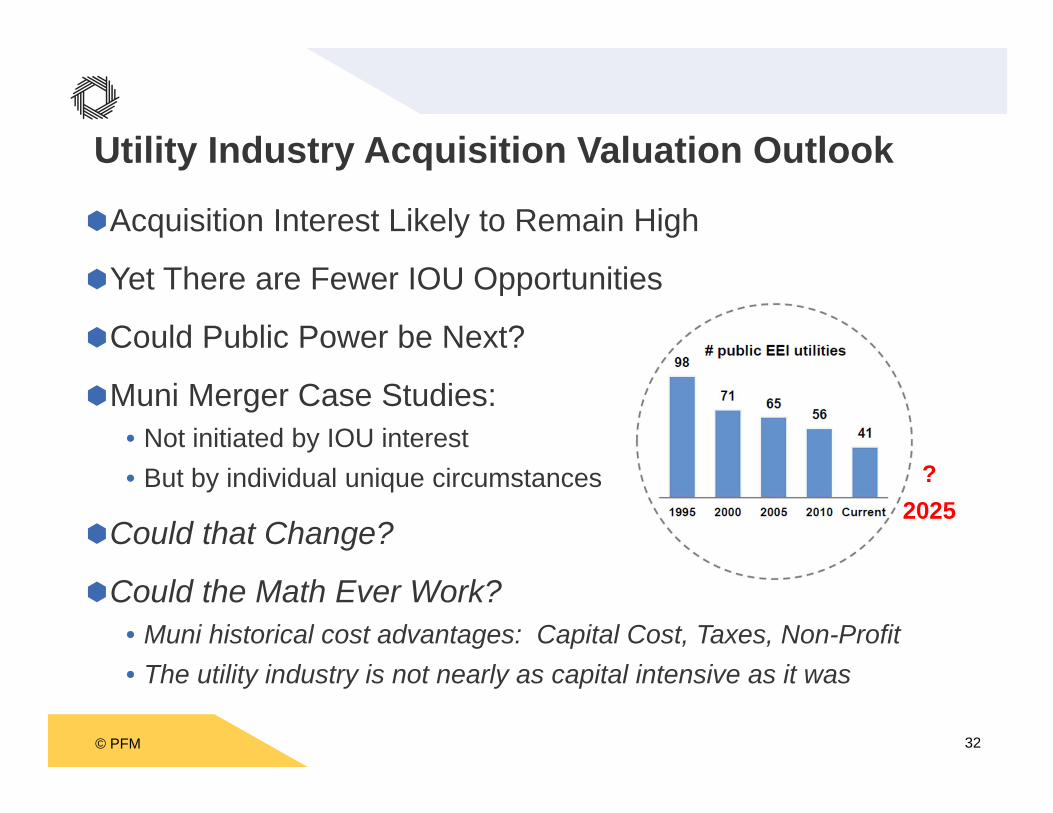
Acquisition Interest Likely to Remain High
Yet There are Fewer IOU Opportunities
Could Public Power be Next?
Muni Merger Case Studies:• Not initiated by IOU interest• But by individual unique circumstances
Could that Change?
Could the Math Ever Work?• Muni historical cost advantages: Capital Cost, Taxes, Non-Profit• The utility industry is not nearly as capital intensive as it was
Utility Industry Acquisition Valuation Outlook
?2025

© PFM 33
Merger Math
© PFM 34
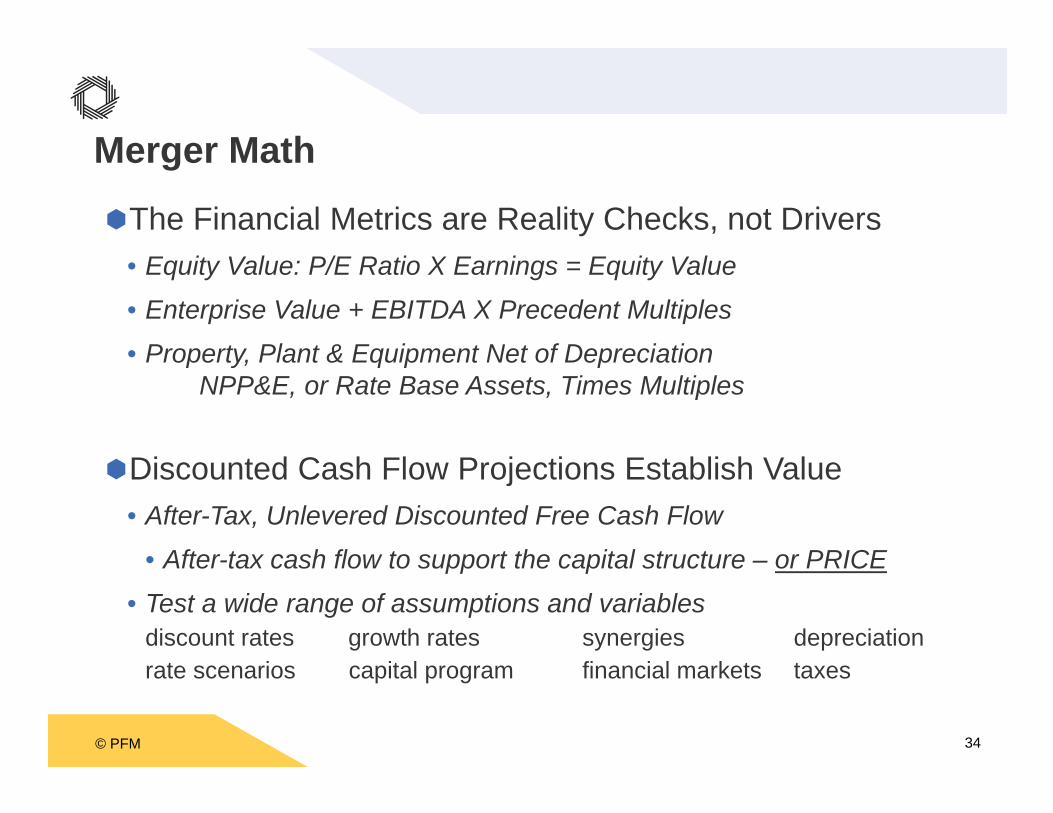
Merger Math
The Financial Metrics are Reality Checks, not Drivers• Equity Value: P/E Ratio X Earnings = Equity Value• Enterprise Value + EBITDA X Precedent Multiples• Property, Plant & Equipment Net of Depreciation
NPP&E, or Rate Base Assets, Times Multiples
Discounted Cash Flow Projections Establish Value• After-Tax, Unlevered Discounted Free Cash Flow
• After-tax cash flow to support the capital structure – or PRICE• Test a wide range of assumptions and variables
discount rates growth rates synergies depreciationrate scenarios capital program financial markets taxes
© PFM 35
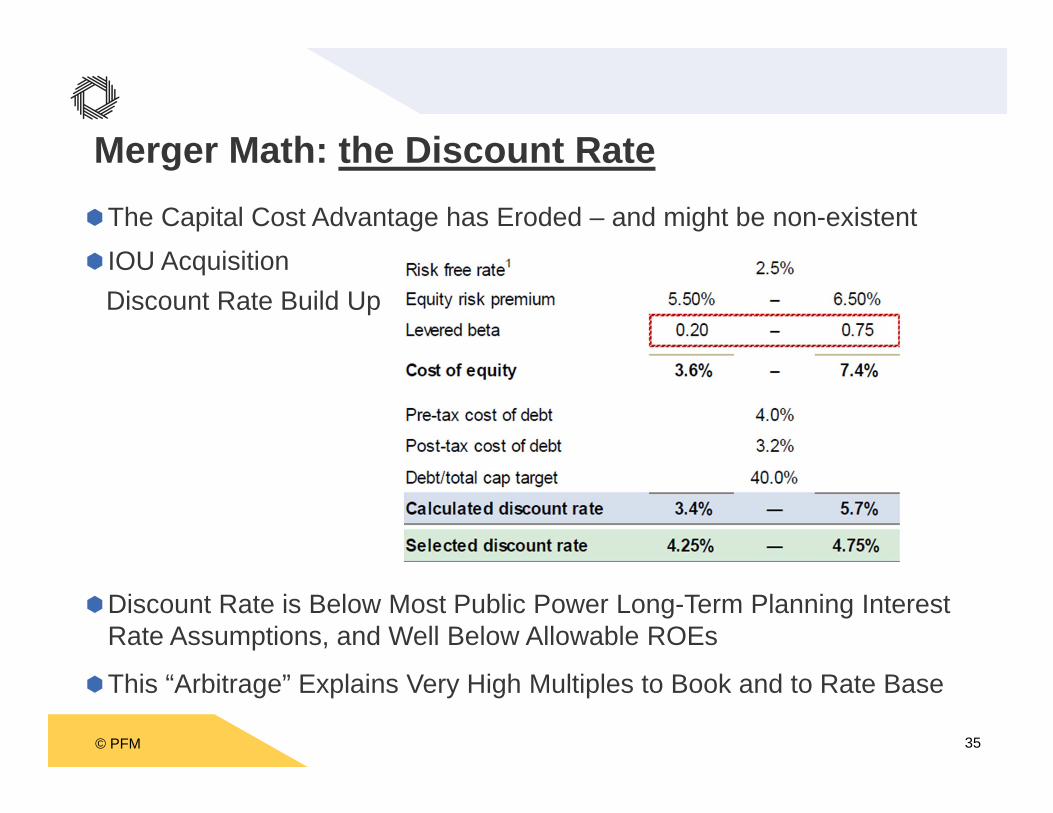
The Capital Cost Advantage has Eroded – and might be non-existent IOU Acquisition
Discount Rate Build Up
Discount Rate is Below Most Public Power Long-Term Planning Interest Rate Assumptions, and Well Below Allowable ROEs
This “Arbitrage” Explains Very High Multiples to Book and to Rate Base
Merger Math: the Discount Rate
© PFM 36
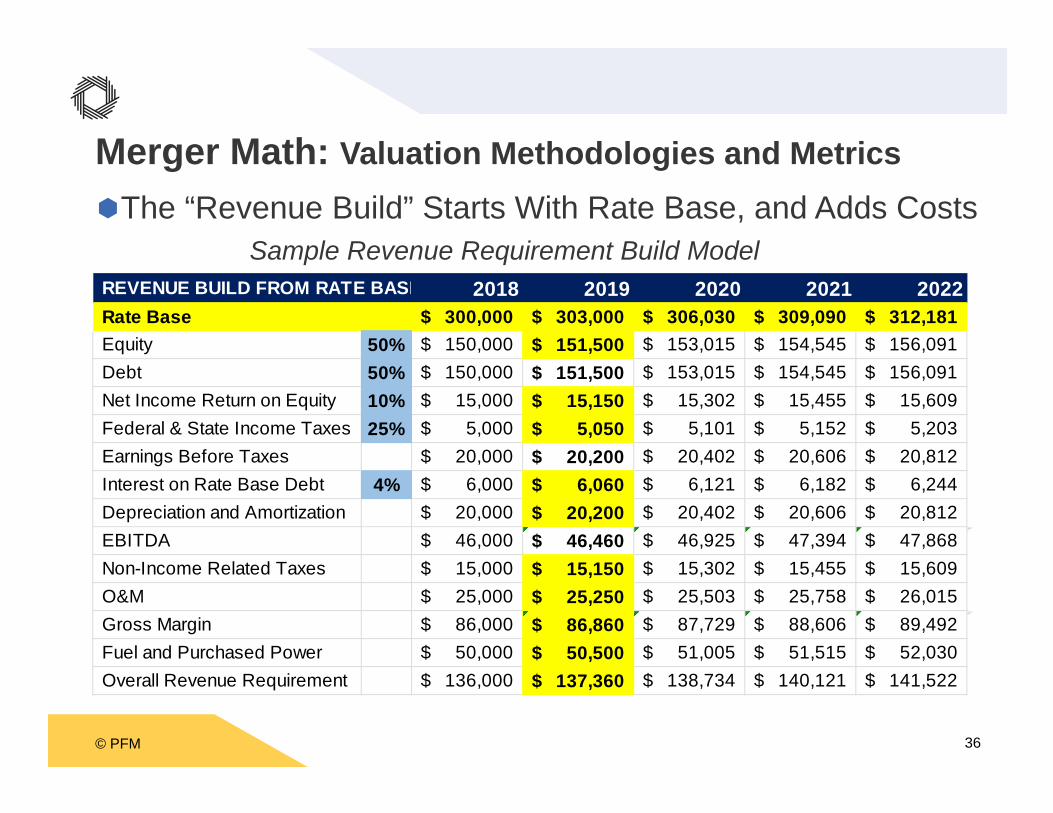
Merger Math: Valuation Methodologies and MetricsThe “Revenue Build” Starts With Rate Base, and Adds Costs
Sample Revenue Requirement Build ModelREVENUE BUILD FROM RATE BASE 2018 2019 2020 2021 2022Rate Base 300,000$ 303,000$ 306,030$ 309,090$ 312,181$ Equity 50% 150,000$ 151,500$ 153,015$ 154,545$ 156,091$ Debt 50% 150,000$ 151,500$ 153,015$ 154,545$ 156,091$ Net Income Return on Equity 10% 15,000$ 15,150$ 15,302$ 15,455$ 15,609$ Federal & State Income Taxes 25% 5,000$ 5,050$ 5,101$ 5,152$ 5,203$ Earnings Before Taxes 20,000$ 20,200$ 20,402$ 20,606$ 20,812$ Interest on Rate Base Debt 4% 6,000$ 6,060$ 6,121$ 6,182$ 6,244$ Depreciation and Amortization 20,000$ 20,200$ 20,402$ 20,606$ 20,812$ EBITDA 46,000$ 46,460$ 46,925$ 47,394$ 47,868$ Non-Income Related Taxes 15,000$ 15,150$ 15,302$ 15,455$ 15,609$ O&M 25,000$ 25,250$ 25,503$ 25,758$ 26,015$ Gross Margin 86,000$ 86,860$ 87,729$ 88,606$ 89,492$ Fuel and Purchased Power 50,000$ 50,500$ 51,005$ 51,515$ 52,030$ Overall Revenue Requirement 136,000$ 137,360$ 138,734$ 140,121$ 141,522$
© PFM 37
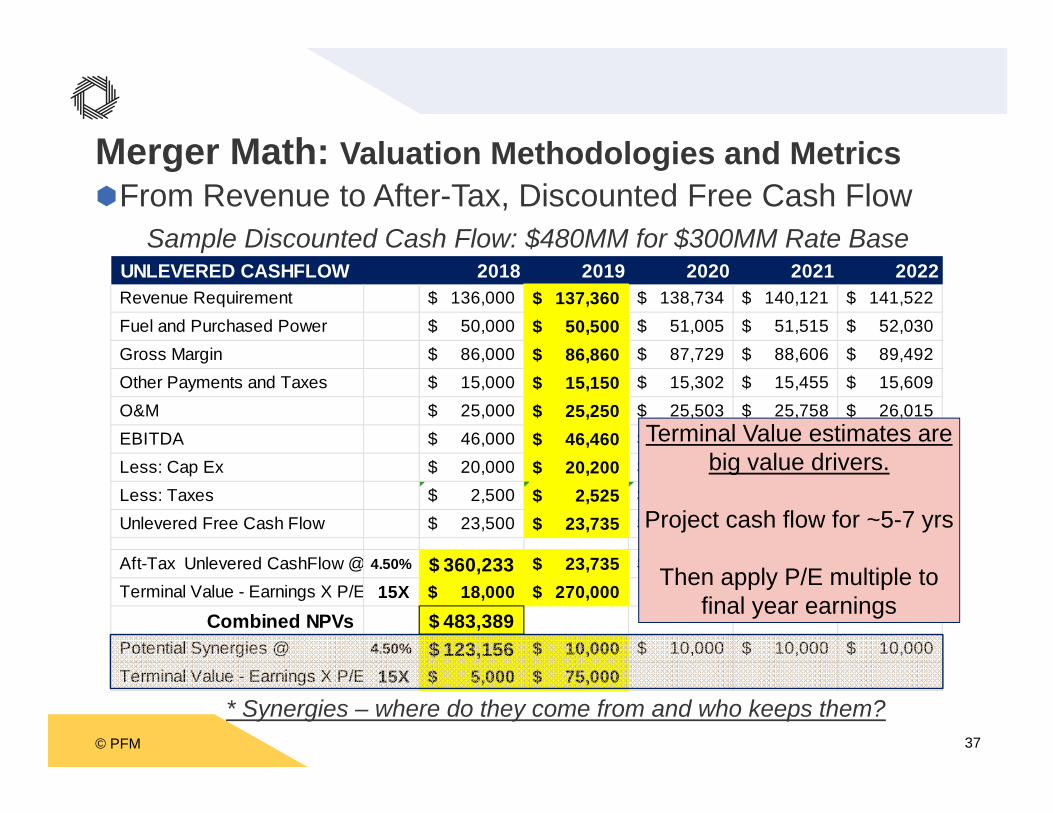
Merger Math: Valuation Methodologies and MetricsFrom Revenue to After-Tax, Discounted Free Cash Flow
Sample Discounted Cash Flow: $480MM for $300MM Rate Base
* Synergies – where do they come from and who keeps them?
UNLEVERED CASHFLOW 2018 2019 2020 2021 2022Revenue Requirement 136,000$ 137,360$ 138,734$ 140,121$ 141,522$ Fuel and Purchased Power 50,000$ 50,500$ 51,005$ 51,515$ 52,030$ Gross Margin 86,000$ 86,860$ 87,729$ 88,606$ 89,492$ Other Payments and Taxes 15,000$ 15,150$ 15,302$ 15,455$ 15,609$ O&M 25,000$ 25,250$ 25,503$ 25,758$ 26,015$ EBITDA 46,000$ 46,460$ 46,925$ 47,394$ 47,868$ Less: Cap Ex 20,000$ 20,200$ 20,402$ 20,606$ 20,812$ Less: Taxes 2,500$ 2,525$ 2,550$ 2,576$ 2,602$ Unlevered Free Cash Flow 23,500$ 23,735$ 23,972$ 24,212$ 24,454$
Aft-Tax Unlevered CashFlow @ 4.50% 360,233$ 23,735$ 23,972$ 24,212$ 24,454$ Terminal Value - Earnings X P/E 15X 18,000$ 270,000$
Combined NPVs 483,389$ Potential Synergies @ 4.50% 123,156$ 10,000$ 10,000$ 10,000$ 10,000$ Terminal Value - Earnings X P/E 15X 5,000$ 75,000$
Terminal Value estimates are big value drivers.
Project cash flow for ~5-7 yrs
Then apply P/E multiple to final year earnings
© PFM 38
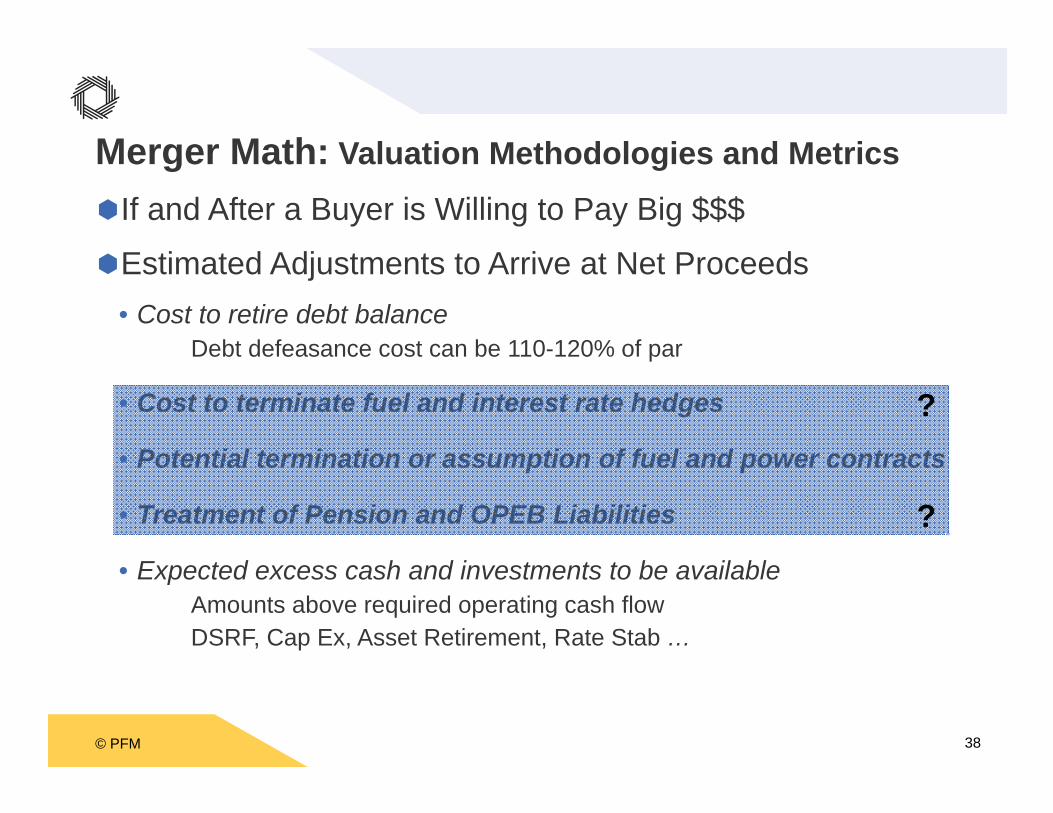
If and After a Buyer is Willing to Pay Big $$$
Estimated Adjustments to Arrive at Net Proceeds• Cost to retire debt balance
Debt defeasance cost can be 110-120% of par
• Cost to terminate fuel and interest rate hedges
• Potential termination or assumption of fuel and power contracts
• Treatment of Pension and OPEB Liabilities
• Expected excess cash and investments to be availableAmounts above required operating cash flowDSRF, Cap Ex, Asset Retirement, Rate Stab …
Merger Math: Valuation Methodologies and Metrics
?
?
© PFM 39
In Some Cases, There Could be a Lot of $$$ Left Over
But this is Only Half the Story – What About Rates?
What About the “Owner” – Who Exactly is the Owner?
In Public Power, We Talk About “Ratepayer Owners”• Ownership/Control Structures Vary in Public Power• City, District, Authority, Board
Owners Could Chose to Reduce Rates With Excess $$
Or Use Funds for Other Purposes
Ratemaking Will be Much Different Under Regulation
Merger Math: Valuation Methodologies and Metrics
© PFM 40
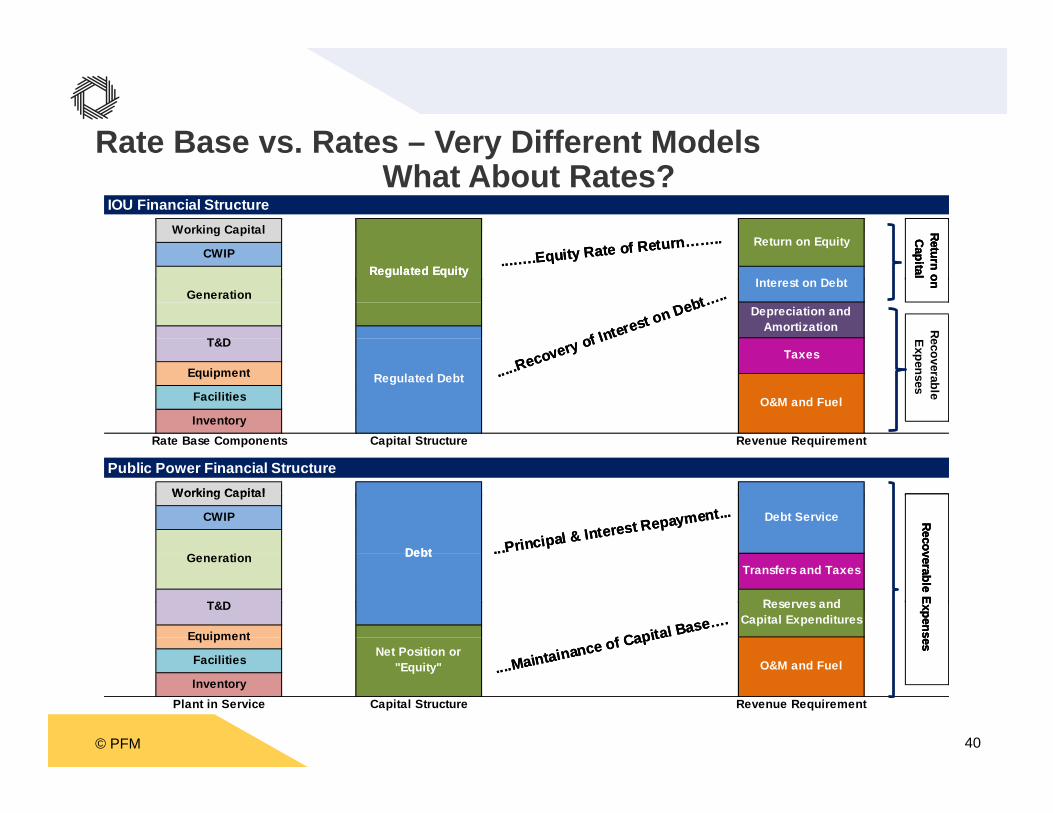
Rate Base vs. Rates – Very Different ModelsWhat About Rates?
IOU Financial Structure
...…..Equity Rate of Return……..
Return on CapitalRegulated Equity
Return on EquityWorking Capital
.....Recovery of Interest on Debt…..
...…..Equity Rate of Return……..
Return on CapitalRegulated Equity
Return on Equity
Interest on Debt
Working Capital
CWIP
Generation
Rate Base Components Capital Structure Revenue Requirement
Public Power Financial Structure
Recoverable Expenses
.....Recovery of Interest on Debt…..
...Principal & Interest Repayment...
Recoverable Expenses
Return on Capital
Debt
Debt Service
Working Capital
Inventory
Regulated Equity
Regulated Debt
Interest on Debt
O&M and Fuel
Depreciation and Amortization
Taxes
Generation
T&D
Equipment
Facilities
....Maintainance of Capital Base….Reserves and
Capital Expenditures
Recoverable Expenses
...Principal & Interest Repayment...
Debt
Debt Service
Transfers and Taxes
Working Capital
CWIP
Generation
T&D
Plant in Service Capital Structure Revenue Requirement
....Maintainance of Capital Base….Reserves and
Capital Expenditures
Recoverable Expenses
Inventory
Debt
Net Position or "Equity" O&M and Fuel
T&D
Equipment
Facilities
© PFM 41
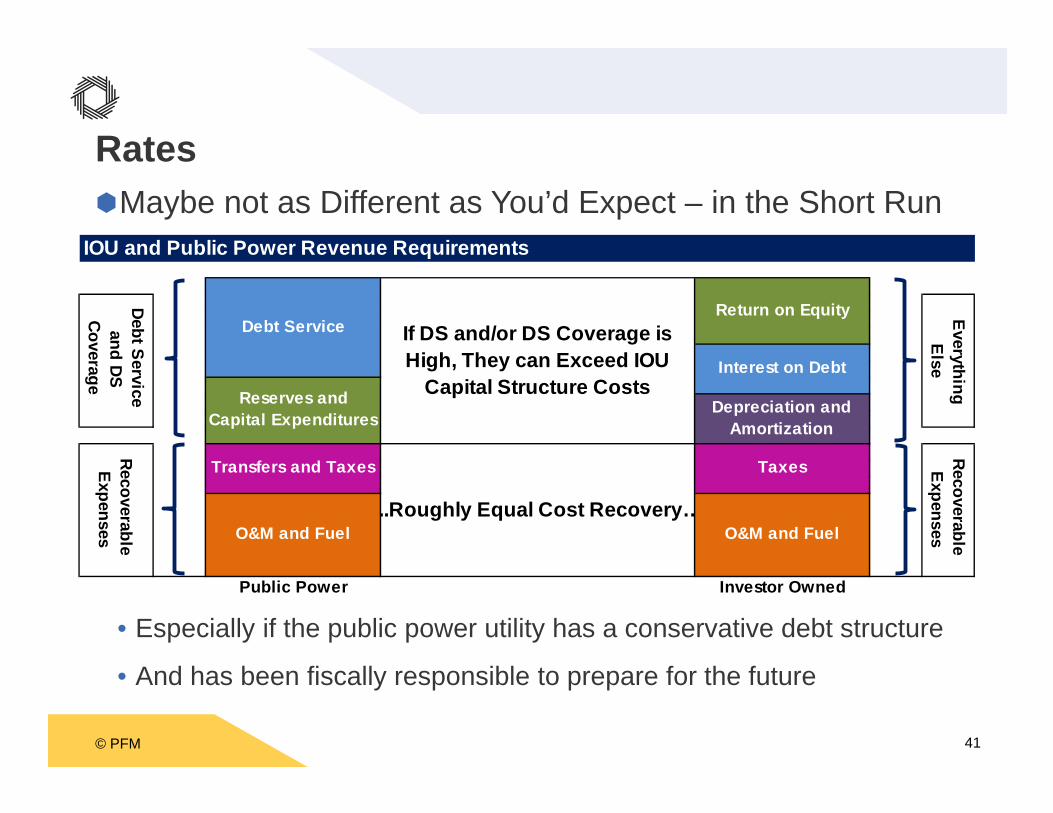
RatesMaybe not as Different as You’d Expect – in the Short Run
• Especially if the public power utility has a conservative debt structure
• And has been fiscally responsible to prepare for the future
IOU and Public Power Revenue Requirements
Public Power Investor Owned
..Roughly Equal Cost Recovery…
Debt Service and DS
Coverage
Everything Else
If DS and/or DS Coverage is High, They can Exceed IOU
Capital Structure CostsReserves and Capital Expenditures
O&M and Fuel
Transfers and Taxes Taxes
Debt ServiceReturn on Equity
Recoverable Expenses
Depreciation and Amortization
O&M and Fuel
Recoverable Expenses
Interest on Debt
© PFM 42
Differing Approach to Rates and the BusinessMajor Difference Between IOUs and Public Power
• IOU faith in the regulatory rate recovery system• Public Power concern for rate competiveness and demand
Much of Public Power Wants to Shrink the Balance Sheet, While IOUs Seek Ways to Grow It
It Leads to Very Different Approaches to the Business• “Why are we in this business?” vs “We love this business”• Sometimes like the difference between Defense and Offense
And Could Lead to Big Changes in the Future
© PFM 43
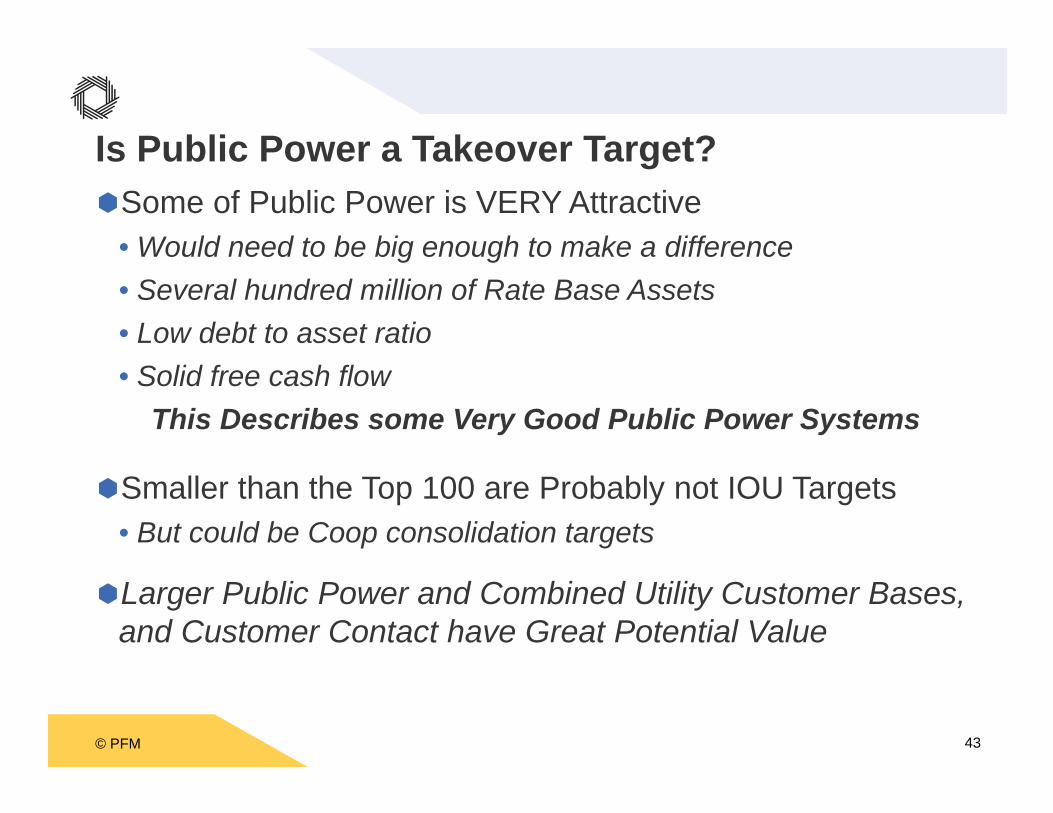
Is Public Power a Takeover Target?Some of Public Power is VERY Attractive
• Would need to be big enough to make a difference• Several hundred million of Rate Base Assets• Low debt to asset ratio• Solid free cash flow
This Describes some Very Good Public Power Systems
Smaller than the Top 100 are Probably not IOU Targets• But could be Coop consolidation targets
Larger Public Power and Combined Utility Customer Bases, and Customer Contact have Great Potential Value
© PFM 44
Local Impacts and Considerations
Back to Reality
© PFM 45
Important Considerations - RealityFuture Utility Rates – Moving to a Regulated EnvironmentEmployment and WorkforcePension and BenefitsFuture Financial Flexibility (aka – eating the Golden Goose)
Transfer Payments vs. Private Owner TaxesLocal Economic Impacts, Efficiencies and Econ DevelopmentService, Responsiveness and PerformancePolicy and PrioritiesFEMA Aid EligibilityExecution Complexity and Challenges
© PFM 46
Important ConsiderationsFuture Utility Rates – Moving to a Regulated Environment
• State Utility Commission Regulation – Loss of Local Control
• Regulated ROEs often exceed 10%
• Big CIP programs are attractive to buyers
• Regulated Rate freezes can be imposed as a sale condition
• Examine projected long-term, rate differential
• Win-Win sounds good in theory, but tough for shareholders and ratepayers to both be better off over the long run
Employment and Workforce• Most buyer assumptions would include eventual reductions
• Labor can be an active advocate for public power
• Workforce guarantees are a negotiated condition in most asset sales
© PFM 47
Important ConsiderationsPension and Benefits
• Unfunded liabilities may require funding• Unclear definition of funding – current liability or future obligations• Whose obligation is it? Current/Future utility “owner” or ratepayers
Future Financial Flexibility• Utility ownership creates options for local gov’t owners• Not always an “easy” flexibility, or a credit positive feature• Ability to balance constituent needs expires with an asset sale
© PFM 48
Important ConsiderationsUtility Transfer Payments vs. Private Owner Taxes
• There are multiple forms of public power paymentsPILOTs/Transfers Franchise Fee Public Service Tax Dividends
• Private utilities have a different tax structureProperty Taxes Franchise Fee Public Service Tax
• Sale conditions can be imposed to “hold harmless” the local gov’t- Generally for a limited number of years
• Additional taxes likely paid to other jurisdictions under private owner- Federal, State, County, School
© PFM 49
Important ConsiderationsEconomic Impacts, Efficiencies, and Econ Development
• Utilities are large employers and economic contributors
• Local gov’t partnerships and synergies achieve efficiencies, cost savings, policy priorities
• Utilities are often a key component of economic development efforts
• Sale conditions could include commitments to maintain a presence, and encourage similar level of local economic activity
- But difficult to document and measure over the long run
© PFM 50
Important ConsiderationsService, Responsiveness and Performance
• Historical public power vs. IOU comparisons favor public power
• Local priorities and accountability
• Responsiveness to weather events and emergencies
• Performance-based IOU returns are possible
- But difficult to document and measure over the long run
© PFM 51
Important ConsiderationsPolicy and Priorities will be Different
• Environmental objectives
• Low Income assistance
IOUs Generally Not Eligible for FEMA Disaster Aid• IOUs storm/flood costs are recovered from ratepayers
• Public power utilities have received Billion$ from FEMA
© PFM 52
Important ConsiderationsExecution Complexity and Challenges
• Existing contractual arrangements- Combined real estate and right-of-way agreements- Long-term business contracts
• Combined utilities – electric, water, sewer, district energy
At the End of Day – More Questions than Answers
And Numbers are Only Part of the Story
The Reality of “Privatization” Can be Daunting, and Maybe Impossible in Many Cases

© PFM 53
Comments and Questions