The possible disappearance of a massive star in the low ...
8
MNRAS 000, 1–8 (2020) Preprint 9 June 2020 Compiled using MNRAS L A T E X style file v3.0 The possible disappearance of a massive star in the low metallicity galaxy PHL 293B ¢ Andrew P. Allan, 1 Jose H. Groh, 1 Andrea Mehner, 2 Nathan Smith, 3 Ioana Boian, 1 Eoin J. Farrell 1 and Jennifer E. Andrews 3 1 School of Physics, Trinity College Dublin, the University of Dublin, College Green, Dublin-2, Ireland; email: [email protected] 2 ESO – European Organisation for Astronomical Research in the Southern Hemisphere, Alonso de Córdova 3107, Vitacura, Santiago de Chile, Chile 3 Steward Observatory, University of Arizona, 933 N. Cherry Ave., Tucson, AZ 85721, USA Accepted XXX. Received YYY; in original form ZZZ ABSTRACT We investigate a suspected very massive star in one of the most metal-poor dwarf galaxies, PHL 293B. Excitingly, we find the sudden disappearance of the stellar signatures from our 2019 spectra, in particular the broad H lines with P Cygni profiles that have been associated with a massive luminous blue variable (LBV) star. Such features are absent from our spectra obtained in 2019 with the ESPRESSO and X-shooter instruments of the ESO’s VLT. We compute radiative transfer models using CMFGEN that fit the observed spectrum of the LBV and are consistent with ground-based and archival Hubble Space Telescope photometry. Our models show that during 2001–2011 the LBV had a luminosity ! * = 2.5 - 3.5 × 10 6 ! ,a mass-loss rate / " = 0.005 - 0.020 " yr -1 , a wind velocity of 1000 km s -1 , and effective and stellar temperatures of ) eff = 6000 - 6800 K and ) * = 9500 - 15000 K. These stellar properties indicate an eruptive state. We consider two main hypotheses for the absence of the broad emission components from the spectra obtained since 2011. One possibility is that we are seeing the end of an LBV eruption of a surviving star, with a mild drop in luminosity, a shift to hotter effective temperatures, and some dust obscuration. Alternatively, the LBV could have collapsed to a massive black hole without the production of a bright supernova. Key words: stars: massive – stars: peculiar – stars: supernovae – stars: black holes – stars: winds, outflows – stars: late-type 1 INTRODUCTION Massive stars are among the most important sources of ionising photons and chemical elements, producing a significant proportion of the elements currently present in the Universe. They are instru- mental to the understanding of a variety of astrophysical topics, including the link between supernovae (SNe) and gamma-ray bursts to the nature of their respective progenitors (e.g., Schulze et al. 2015), as well as the early evolution of the Universe. Our current understanding of massive stars and their fates is quite incomplete in environments with metallicity ( / ) lower than the Small Magellanic Cloud ( / ’ 0.2/ Hunter et al. 2007). This is owed mainly to a scarcity of observations of massive stars at very low / , especially in late evolutionary stages. Wolf-Rayet (WR) stars are generally rare in very metal-poor regions (Crowther & Hadfield 2006), with surveys detecting evolved WR stars in the SMC (Massey et al. 2003, 2014; Neugent et al. 2018; Shenar et al. 2020) and I Zw 18 galaxy (Izotov et al. 1997; Legrand et al. 1997; Brown et al. ¢ Based on observations collected at the European Southern Observatory under programmes 70.B-0717, 60.A-9442, 60.A-9502, 2104.D-5015. 2002). A handful of luminous blue variables have been found in the SMC including HD5980 (Drissen et al. 2001; Barba et al. 1995) and other low-metallicity galaxies (Izotov & Thuan 2009; Izotov et al. 2011). Red supergiants are also thought to be rare at very low / (e.g. Eldridge et al. 2017). Efforts to advance our understanding are being made, with recent numerical stellar evolution models of low-metallicity stars revealing a surprising prediction. They indicate that some of the most massive stars may end their lives as unstable LBV stars (Groh et al. 2019b), as they fail to shed mass and become H-poor WR stars. The LBV phase is thought to occur late in the evolution of massive stars (e.g., Humphreys & Davidson 1994; Maeder & Meynet 2000; Groh et al. 2014). LBVs show re-occurring eruptive events generating considerable mass loss (Smith & Owocki 2006), in addition to irregular photometric and spectroscopic variations of the S-Doradus type (van Genderen 2001). LBVs play a key role in the mass budget of very massive stars (Smith 2014) and regulate their final compact remnant masses, which in some cases can be a massive black hole (Groh et al. 2019a). LBVs are also thought to be immediate progenitors of some SN explosions (e.g. Kotak & © 2020 The Authors
Transcript of The possible disappearance of a massive star in the low ...

MNRAS 000, 1–8 (2020) Preprint 9 June 2020 Compiled using MNRAS LATEX style file v3.0
The possible disappearance of a massive star in the low metallicitygalaxy PHL 293B★
Andrew P. Allan,1Jose H. Groh,1 Andrea Mehner,2 Nathan Smith,3 Ioana Boian,1
Eoin J. Farrell1 and Jennifer E. Andrews31School of Physics, Trinity College Dublin, the University of Dublin, College Green, Dublin-2, Ireland; email: [email protected] – European Organisation for Astronomical Research in the Southern Hemisphere, Alonso de Córdova 3107, Vitacura, Santiago de Chile, Chile3Steward Observatory, University of Arizona, 933 N. Cherry Ave., Tucson, AZ 85721, USA
Accepted XXX. Received YYY; in original form ZZZ
ABSTRACTWe investigate a suspected very massive star in one of the most metal-poor dwarf galaxies,PHL 293B. Excitingly, we find the sudden disappearance of the stellar signatures from our2019 spectra, in particular the broad H lines with P Cygni profiles that have been associatedwith a massive luminous blue variable (LBV) star. Such features are absent from our spectraobtained in 2019 with the ESPRESSO and X-shooter instruments of the ESO’s VLT. Wecompute radiative transfer models using CMFGEN that fit the observed spectrum of the LBVand are consistent with ground-based and archival Hubble Space Telescope photometry. Ourmodels show that during 2001–2011 the LBV had a luminosity !∗ = 2.5 − 3.5 × 10⁶ !�, amass-loss rate ¤" = 0.005 − 0.020 "� yr−1, a wind velocity of 1000 km s−1, and effectiveand stellar temperatures of )eff = 6000 − 6800 K and )∗ = 9500 − 15000 K. These stellarproperties indicate an eruptive state. We consider two main hypotheses for the absence of thebroad emission components from the spectra obtained since 2011. One possibility is that weare seeing the end of an LBV eruption of a surviving star, with a mild drop in luminosity, ashift to hotter effective temperatures, and some dust obscuration. Alternatively, the LBV couldhave collapsed to a massive black hole without the production of a bright supernova.
Key words: stars: massive – stars: peculiar – stars: supernovae – stars: black holes – stars:winds, outflows – stars: late-type
1 INTRODUCTION
Massive stars are among the most important sources of ionisingphotons and chemical elements, producing a significant proportionof the elements currently present in the Universe. They are instru-mental to the understanding of a variety of astrophysical topics,including the link between supernovae (SNe) and gamma-ray burststo the nature of their respective progenitors (e.g., Schulze et al.2015), as well as the early evolution of the Universe.
Our current understanding of massive stars and their fates isquite incomplete in environments with metallicity (/) lower thanthe Small Magellanic Cloud (/ ' 0.2/� Hunter et al. 2007). Thisis owed mainly to a scarcity of observations of massive stars at verylow / , especially in late evolutionary stages. Wolf-Rayet (WR) starsare generally rare in very metal-poor regions (Crowther & Hadfield2006), with surveys detecting evolvedWR stars in the SMC (Masseyet al. 2003, 2014; Neugent et al. 2018; Shenar et al. 2020) andI Zw 18 galaxy (Izotov et al. 1997; Legrand et al. 1997; Brown et al.
★ Based on observations collected at the European Southern Observatoryunder programmes 70.B-0717, 60.A-9442, 60.A-9502, 2104.D-5015.
2002). A handful of luminous blue variables have been found in theSMC including HD5980 (Drissen et al. 2001; Barba et al. 1995)and other low-metallicity galaxies (Izotov & Thuan 2009; Izotovet al. 2011). Red supergiants are also thought to be rare at very low/ (e.g. Eldridge et al. 2017).
Efforts to advance our understanding are being made, withrecent numerical stellar evolution models of low-metallicity starsrevealing a surprising prediction. They indicate that some of themost massive stars may end their lives as unstable LBV stars (Grohet al. 2019b), as they fail to shed mass and become H-poor WRstars. The LBV phase is thought to occur late in the evolutionof massive stars (e.g., Humphreys & Davidson 1994; Maeder &Meynet 2000; Groh et al. 2014). LBVs show re-occurring eruptiveevents generating considerable mass loss (Smith & Owocki 2006),in addition to irregular photometric and spectroscopic variations ofthe S-Doradus type (van Genderen 2001). LBVs play a key role inthe mass budget of very massive stars (Smith 2014) and regulatetheir final compact remnant masses, which in some cases can bea massive black hole (Groh et al. 2019a). LBVs are also thoughtto be immediate progenitors of some SN explosions (e.g. Kotak &
© 2020 The Authors

2 A. P. Allan et al.
6540 6550 6560 6570 6580 6590
100
101
102
103
104
105
106
107
108108
Nor
mal
ised
flux
4840 4850 4860 4870 4880
Dec 2019Aug 2019
July 2016Nov 2011Aug 2009Nov 2002Aug 2001
H-a H-b
Wavelength (Å)
Figure 1. Spectroscopic evolution of PHL 293B between 2001 (lowestspectrum) and 2019 (highest). The 2009 X-shooter spectrum (dashed grey)is overplotted to all spectra, which are also shifted for clarity.
Vink 2006; Gal-Yam& Leonard 2009; Smith et al. 2011; Groh et al.2013; Boian & Groh 2018).
In an effort to improve our understanding of very massive starsat low / , we have monitored the blue compact dwarf (BCD) galaxyPHL 293B. This galaxy lies at a distance of 23.1 Mpc (Mouldet al. 2000), and has a metallicity of / ' 0.1/� (Izotov et al.2007). Spectroscopic observations of the compact galaxy obtainedbetween 2001–2011 consistently featured broad, strong emissioncomponents in the hydrogen Balmer lines. These spectral featureshave been interpreted to originate in the LBV outflow (Izotov &Thuan 2009; Izotov et al. 2011), since together with the presence ofFe ii and weak He i lines, only LBVs show these types of signatures(see discussion in Sects. 2.4 and 3 of Groh et al. 2014). These earlierspectra were remarkably similar, differing mainly in the strength ofthe narrow components, likely due to the different aperture sizesused. Photometric analysis of PHL 293B revealed no optical pho-tometric variability at the level of 0.1 mag between 1988 and 2013(Terlevich et al. 2014). Based on this, Terlevich et al. (2014) sug-gested that the blueshifted absorptions of H I and Fe II were notcaused by an LBV, but instead by an expanding supershell generatedby the cluster wind of PHL 293B. The substantial spectral variationwe report disfavours such a hypothesis. Burke et al. (2020) alsoreport the weakening of the hydrogen broad components based on2019 Gemini data. In addition, they report photometric variabilityof 0.12 mag in 6 band between 1998 and 2018, using images fromthe Sloan Digital Sky Survey (SDSS) and the Dark Energy Survey(DES). They suggest a SN IIn or an unusual outburst as the sourceof the broad components in the 2001–2011 spectra.
Here, we report new observations of PHL 293B obtainedin 2019 with the European Southern Observatory’s Very LargeTelescope (ESO/VLT) instruments X-shooter and Echelle Spectro-graph for Rocky Exoplanet- and Stable Spectroscopic Observation(ESPRESSO). We also discuss unpublished, optical archival imag-
6540 6560 6580 66000
1
2
3
Flux
(10-
16 e
rg c
m-
2 Å-
1 s-
1 )
4840 4850 4860 4870 4880
5120 5160 52000.2
0.4
0.6
0.8
1.0
5120 5160 5200 5880 59205860 5880 5900 5920
Nov 2002CMFGEN models with fit error £25%
Wavelength (Å)
Figure 2. Comparison of the 2002 UVES spectrum of PHL 293B (black) toour best-fitting CMFGENmodels. Blue region corresponds to models with afit error ≤ 25%.White regions show the wavelength ranges considered in thefit. The upper left and right panels display the H-U and H-V emission linesrespectively. The lower left panel includes the tested Fe ii 5169 Å emissionline in addition to weaker Fe ii 5159 Å and N i 5198 Å emission and Fe iii5156 Å absorption. Some best fit models also feature weak Mg i 5173 Å and5184 Å and Tk ii 5186 Å and 5189 Å. The lower right panel includes theHe i 5786 Å line as well as Na i 5890 Å and 5896 Å emission.
ing obtained with the Hubble Space Telescope (HST). We computeradiative transfer models of stellar winds to interpret the spectro-scopic observations and the existing photometric data. As we elab-orate below, we find that the LBV was in an eruptive state at leastbetween 2001–2011, which then ended, andmay have been followedby a collapse into a massive black hole (BH) without the productionof a SN. This scenario is consistent with the available HST andground-based photometry.
2 OBSERVATIONS AND MODELLING OF THE LBV
We present new spectra of PHL 293B obtained in 2019 usingthe ESO/VLT instruments X-shooter and ESPRESSO and com-pare these to archival spectra obtained between 2001 and 2016 (seeTable 1). ESPRESSO was used in the four-Unit Telescope mode,combining the light from four 8m telescopes. The datawere reducedwith the ESO pipeline version espdr/1.3.0. The X-shooter data werereduced with the ESO pipeline version xshoo/3.3.5. The archivalINT/IDS, WHT/ISIS, and 2009 X-shooter spectra were obtainedwithout flux standards and flat fields. Therefore, we re-scaled theflux as to best match the equivalent width of the narrow componentof the H-U line of a spectrum with a similar aperture size (UVES).
MNRAS 000, 1–8 (2020)

The disappearing massive LBV star in PHL 293B 3
Table 1. Summary of the spectroscopic observations of PHL 293B from 2001 to 2019.
Instrument Date Wavelength range (Å) Setup Resolving powerVLT/X-shooter 2019-12-17 3000–23000 UVB, VIS, NIR (1.0”, 0.9”, 0.9”) 5400, 8900, 5600VLT/ESPRESSO 2019-08-28 3800–7800 MR42 (4x1”) 72 000HST/COS 2018-04-30 1027–2337 G140L (2.5”) 2000INT/IDS 2016-07-02 5890–7230 H1800V (1”) 7000WHT/ISIS 2011-11-30 3805–8095 R300B/7500 (1”) 1000WHT/ISIS 2011-09-24 2630–6230 R300B/5700 (1”) 1000VLT/X-shooter 2009-09-28 3000–23000 UVB, VIS, NIR (1.0”, 0.9”, 0.9”) 5100, 8800, 5600VLT/X-shooter 2009-08-16 3000–23000 UVB, VIS, NIR (1.0”, 0.9”, 0.9”) 5100, 8800, 5600VLT/UVES 2002-11-08 3100–6800 DICHR#1 (1”) 40 000SDSS 2001-02-22 3810–9200 3” fiber 2000
Figure 1 highlights the absence of the inferred LBV signaturefrom the spectra of PHL 293B in 2016 to 2019. Other signaturesthat were interpreted as being due to the LBV, such as from Fe ii andHe i (Izotov & Thuan 2009; Izotov et al. 2011), are also not detectedin our 2019 data. We interpret the lack of spectral variability in the2001, 2002, 2009 and 2011 spectra (also noted by Terlevich et al.2014) as confirmation of the LBV’s presence, with the inferred LBVsignatures disappearing sometime between 2011 and 2016.
We also obtained archival HST imaging of the PHL 293Bgalaxy, which was observed on 2010 October 31 with HST/WFC3with filters F336W, F438W, F606W, and F814W (GO-12018; PIPrestwich). We performed photometry of the brightest region ofthe galaxy, where the LBV is thought to reside since this is whereprevious spectroscopic observations centred their slit on. We useDolphot (Dolphin 2000, 2016) on the standard STScI pipeline pre-processed, charge-transfer efficiency corrected images. These ob-servations were obtained before the inferred LBV signature withinthe spectra disappeared, and obtain <F336W,pre = 19.70 ± 0.01,<F438W,pre = 20.82 ± 0.01, <F606W,pre = 20.31 ± 0.01, and<F814W,pre = 20.03 ± 0.01 mag in the F336W, F438W, F606W,and F814W filters, respectively.
To constrain the parameters of the LBV in PHL 293B dur-ing outburst, we compute new radiative transfer models and fit thehigh-resolution 2002UVES spectrum.We use the line-blanketed at-mospheric/wind radiative transfer code CMFGEN (Hillier &Miller1998) to compute continuum and line formation in non-local ther-modynamic equilibrium (NLTE) and spherical symmetry. Our newmodels use similar physical assumptions to those of the LBV pro-genitor of the SN candidate SN 2015bh (Boian & Groh 2018).CMFGEN takes as input the stellar luminosity !∗, stellar radiusR★, mass-loss rate ¤" , wind terminal speed E∞, and the abundancesof the included species. Table 2 shows the atomic model used inthis paper, which makes use of ‘super’ levels to reduce the numberof levels whose atomic populations must be solved for (Anderson1989; Hillier & Miller 1998). We assume a Fe mass fraction of 1.7×10⁻⁴, i.e., ∼ 0.1 of the solar value as expected for PHL 293B. Wealso assume a He mass fraction of 0.5 (∼ 1.8 of the solar value),which is typical of LBVs (e.g. Groh et al. 2009). Since only a hand-ful of diagnostic lines are present, both the He and Fe abundancesare assumed rather than derived values. In this temperature regime,the He and Fe lines are affected by a small change in stellar and/orwind parameters (Boian &Groh 2018). This is specially relevant forFe, since we assume a solar-scaled Fe/O ratio, and this may not holddepending on the chemical evolution history of the galaxy. Sincethe derived metallicity of PHL 293B is based on nebular O lines(Izotov & Thuan 2009), for instance a change in Fe abundance by afactor of 2 would be still consistent with our models.
For simplicity our models are unclumped, and indeed they
Table 2. CMFGEN atomic model used in the analysis of PHL 293B.
Species No. of super-levels No. of atomic levelsH i 20 30He i 40 45He ii 22 30C i 38 80C ii 39 88C iii 32 59N i 44 104N ii 157 442N iii 42 158O i 69 161O ii 26 80O iii 33 92Na i 18 44Mg i 37 57Mg ii 18 45Al ii 38 58Al iii 17 45Si ii 22 43Si iii 20 34Si iv 22 33Ca i 23 39Ca ii 17 46Ti ii 33 314Ti iii 33 380Fe i 69 214Fe ii 67 403Fe iii 48 346Ni ii 29 204Ni iii 28 220
match the strength of the observed electron-scattering wings ofthe H lines, which are a key clumping diagnostic (Hillier 1991).We degraded the CMFGEN high-resolution synthetic spectra byconvolving with a Gaussian function to match the UVES spectralresolution. Because of the high wind density, we compute both aflux temperature )∗ at high optical depths (at Rosseland opticaldepth gRoss=10), as well )eff at the photosphere (where gRoss=2/3).
Due to its distance of 23.1 Mpc, the LBV is spatially un-resolved from the underlying stellar population of PHL 293B inseeing-limited ground-based data. Therefore, we created a grid ofmodels with varying contribution from the LBV and (flat) back-ground galaxy to the total flux. To determine the best-fit parame-ters, we match simultaneously the continuum and H-U, H-V, andFe ii 5169 Å lines. We also ensure that He i 5876 Å matches theobserved level (Fig. 2). A simultaneous match is needed because allthe diagnostics above depend on multiple model parameters, suchas the luminosity, mass-loss rate, and effective temperature. We de-
MNRAS 000, 1–8 (2020)

4 A. P. Allan et al.
Figure 3. Grid of best-fitting CMFGENmodels of varying stellar mass-lossrates and luminosities. The colour denotes the fit error of the models.
scribe below our method to simultaneously determine the stellarand wind parameters of massive stars with cool, dense winds.
For fitting the absolute level of the continuum, we use a conser-vative criterion and compare the mean absolute flux of our modelsin the region 6470 − 6520 Å to the observations, and only retainmodels that are within ±5% of the observed value.
We then compare the equivalent width of the H-U, H-V, andFe ii 5169 Å emission lines to the 2002 spectrum, giving equalweights to each line when computing the fit error. We chose theselines as they are the only ones where the broad component is visiblewith enough signal-to-noise ratio. The white regions in Figure 2show the wavelength range considered in this calculation for theH-U, H-V (upper panels) and Fe ii 5169 Å lines (lower left panel).We neglect the narrow component of the Balmer lines as this isstrongly affected by the background galaxy. We define our best fitmodels as those which produce a fit error of < 25%. These modelsproduce a good fit to the observations, producing similar P Cygniemission and absorption components (Figure 2). Figure 3 showsthe luminosity and mass-loss rate of our CMFGEN models, withthe colour indicating the percentage error for the fit. Based on thebest fit models, we estimate that the LBV contributes 20 − 47%of the total flux collected in the 1′′ aperture used in the ground-based spectroscopic observations, with the rest coming from theunderlying stellar population. Note that the contribution of the LBVto the total flux would be much smaller for larger apertures, e.g.those used in the ground-based photometry of Burke et al. (2020).
Our best fitting CMFGEN models indicate that before its dis-appearance, the LBV had !∗ = 2.5 − 3.5 × 10⁶ !� , ¤" = 0.005 −0.020 "� yr−1, an effective temperature )eff = 6000−6800 K, and)∗ = 9500− 15000 K. While models with !∗ = 3.5− 5.0× 10⁶ !�are consistent with the ground-based data (Fig. 3), they are toobright compared to the HST observations, as will be discussed. Astellar wind velocity of 1000 km s−1 is required by our models toreproduce the broad emission and P-Cygni absorption componentof the hydrogen and iron lines. This velocity is much faster thanthe 40 km s−1 outflow observed for the extreme Red Supergiant(RSG) VY CMa (Smith et al. 2009) or the typical velocities of50 − 300 km s−1 observed in S Doradus outbursts of LBVs (vanGenderen 2001). The stellar and wind parameters strongly suggestthat the LBV was in an eruptive state.
6540 6560 6580 66000.0
0.5
1.0
1.5
2.0
2.5
3.0
6540 6560 6580 66000.0
0.5
1.0
1.5
2.0
2.5
3.0
4840 4850 4860 4870 48804840 4850 4860 4870 4880
5100 5120 5140 5160 5180 5200 52200.2
0.4
0.6
0.8
1.0
5100 5120 5140 5160 5180 5200 52200.2
0.4
0.6
0.8
1.0
5860 5880 5900 59205860 5880 5900 5920
6540 6560 6580 66000.0
0.5
1.0
1.5
2.0
2.5
3.0
4840 4850 4860 4870 4880
5100 5120 5140 5160 5180 5200 52200.2
0.4
0.6
0.8
1.0
5860 5880 5900 5920
6540 6560 6580 66000.0
0.5
1.0
1.5
2.0
2.5
3.0
Flux
(10-
16 e
rg c
m-
2 Å-1 s-
1 )
4840 4850 4860 4870 4880
5100 5120 5140 5160 5180 5200 52200.2
0.4
0.6
0.8
1.0
5860 5880 5900 5920
10 Rô T*=1.92E+04 K Teff=6498 K100 Rô T*=1.28E+04 K Teff=6038 K200 Rô T*=1.02E+04 K Teff=6601 K
Wavelength (Å)Wavelength (Å)
Figure 4. CMFGEN radiative transfer models for different stellar radii. Thesolid-blue spectrum belongs to one of our best fit models with the followingparameters; R★=100'� , !∗ = 2.52 × 10⁶ !� and ¤" = 0.008 "� yr−1.We compare this to two otherwise identical models but with R★ = 10 R�(dashed red line) and R★ = 200 R� (dotted green line).
As the outflow of the LBV is very dense, its hydrostatic radius'★ is difficult to constrain. Figure 4 shows that over a large rangeof radii, the spectral morphology shows little variation. This issimilar to what has been found for Eta Car, which also possessesa high-density wind (Hillier et al. 2001, 2006; Groh et al. 2012a).Hillier et al. (2001) finds that the dense wind of Eta Car preventsthe temperature of the underlying star from being well determined.Minor variations in line strength due to largely differing choices ofhydrostatic radius and consequently temperature could instead becaused by a relatively small change (30-50%) in the mass-loss rateor luminosity. A different He fraction could also alter emission linestrengths in this manner. In the case of PHL 293B, large changesfrom our reference value of 100 '� would require greater mass-loss rates to fit the observations, as shown by Figure 4. In this sense,our quoted values of ¤"are lower limits. We also omit the narrowregion of the Balmer lines in our analysis due to its galactic origin inthe observations. This further softens the importance of the chosenradius as themajority of variation resulting from changing the radiusis within this component. In summary, our conclusion that the LBVpossessed an extremely dense wind is not affected by the choice ofR★.
To investigate the photometric changes that would be expectedin the scenario of a disappearing star, we compute synthetic pho-tometry of our best-fitting CMFGEN LBV models in the SDSS andHST filters. We find that our LBVmodels have apparent magnitudesof<LBV,g = 20.20−21.05 mag and<LBV,r = 19.79−20.56 mag inthe SDSS 6 and A filters, respectively. In the HST F336W, F438W,F606W, and F814W filters, we obtain <LBV,F336W = 19.52−20.20mag, <LBV,F438W = 20.27 − 21.13 mag, <LBV,F606W = 19.92 −20.72 mag, and <LBV,F814W = 19.79 − 20.72 mag, respectively.
MNRAS 000, 1–8 (2020)

The disappearing massive LBV star in PHL 293B 5
N
E5″1″
N
E
Figure 5. Left: High-spatial resolution colour-composite image of PHL obtained with HST WFC3 on 2010-10-31 (GO-12018; PI Prestwich). Right: SDSS6-band image of PHL 293B taken on 2003-10-24. The spatial scales are indicated by the horizontal bar.
We determine the following relation for the expected changein apparent magnitude taken pre- and post-LBV disappearance,
Δ< = <post − <pre = −2.5 log(1 − 10
<pre−<LBV2.5
), (1)
where <pre and <post are the apparent magnitudes of the galaxyin a given filter before and after the LBV disappeared, respectively,and <LBV is the apparent magnitude of the LBV.
We use the photometry from Burke et al. (2020) to estimate<pre for both the SDSS 6 and A bands. We interpolate the SDSS2005 and 2013 observations and find <pre,g ' <pre,r ' 17.83 mag.Using Equation 1, we obtain Δ< of about 0.06 − 0.13 mag and0.09 − 0.19 mag in the 6 and A bands, respectively, if the LBV wasto completely disappear. These variations are broadly consistentwith the light curve of Burke et al. (2020). This SDSS and DESground-based photometry uses a large aperture of 5′′ diameter anda large fraction of the underlying galaxy flux is thus included in theaperture (see Fig. 1 of Burke et al. 2020). The galactic componentalso captured within the aperture will have the effect of diluting thevariation in the measured apparent magnitude if the LBV was todisappear.
Figure 5 shows a high-spatial resolution image of PHL 293Bobtained with HST (left panel) compared to an SDSS image oflower spatial resolution (right panel). Because of the high spatialresolution of the HST observations, we were able to extract pho-tometry using a much smaller aperture than those of SDSS andDES. For that reason, the LBV contributes to a much higher frac-tion of the flux in the HST observations. Some of our best-fittingCMFGEN models are consistent with the magnitude and coloursobserved with HST, implying that the object for which we extracted2010 HST photometry may actually be the LBV itself. Fainter LBVmodels are also consistent with the data. Because of the smalleraperture, if the LBV disappeared we predict much higher magni-tude changes in future HST data, even for the faint models. We findlower limits for the Δ< in each filter, obtaining Δ<F336W = 1.07,Δ<F438W = 1.54, Δ<F606W = 1.26, Δ<F814W = 0.81 mags. Highresolution spatial observations are therefore warranted to constrain
the photometric variability of the LBV and potentially verify itscomplete disappearance.
We also investigate the maximum values of the luminosity(!surv) and mass-loss rate ( ¤"surv) that a surviving star concealedwithin the noise of the 2019 X-shooter spectrum could have. As-suming no dust formation and no change in temperature, we find!surv = 3.8 × 10⁵ !� and ¤"surv = 2.8 × 10⁻³ "� yr−1 (Figure 6).This would require minimum reductions in !∗ and ¤" of 85–92%and 44–86%, respectively. However, the underlying star could bemuch more luminous when taking circumstellar dust into account.With the end of the eruption, the star could have become hotter andwith a lower mass-loss rate. In this case, the upper limit on !survwould be higher than what we quote above.
3 THE FATE OF THE MASSIVE STAR IN PHL 293B
Based on our observations and models, we suggest that PHL 293Bhosted an LBV with an eruption that ended sometime after 2011.This could have been followed by 1) a surviving star or 2) a collapseof the LBV to a BH without the production of a bright SN, butpossibly with a weak transient.
One possibility is that we are seeing the end of an LBV erup-tion of a surviving star, with a mild drop in luminosity, a shift tohigher effective temperatures, and some dust obscuration. The lackof variation of broad emission in the H-U and H-V in all spectrafrom 2001 to 2011 would require such an eruption to have persistedfor a minimum of 8.5 years. Considering the high mass-loss rateand relatively low temperatures for the outer wind from our modelpredictions, the dust obscuration scenario does also not necessarilyrequire a sudden end of the eruption between the 2011 and 2016observations. A combination of a slightly reduced luminosity anda thick dusty shell could result in the star being obscured. Whilethe lack of variability between the 2009 and 2019 near-infraredcontinuum from our X-shooter spectra eliminates the possibility of
MNRAS 000, 1–8 (2020)
6 A. P. Allan et al.
Figure 6. CMFGEN models compared to the 2019 X-shooter spectrum(blue). The models correspond to upper limits of !surv and ¤"surv with 1(dashed green), 2 (solid pink), 3 (dotted black) f confidence. The 2002UVES spectrum (yellow) is included to highlight the significant reductionin the broad H-U emission.
5.0 4.5 4.0 3.54.5
5.0
5.5
6.0
6.5
5.0 4.5 4.0 3.5Log Temperature [K]
4.5
5.0
5.5
6.0
6.5
Log
Lum
inos
ity [L
sun]
20
25
32
40
60
85
120
SN2015bh
SN2009ip
SN2010jl
Gaia16cfr
Gaia16cfr (Av=1)UGC2773-OT
Eta Car (current)
PHL293B LBV
15 129
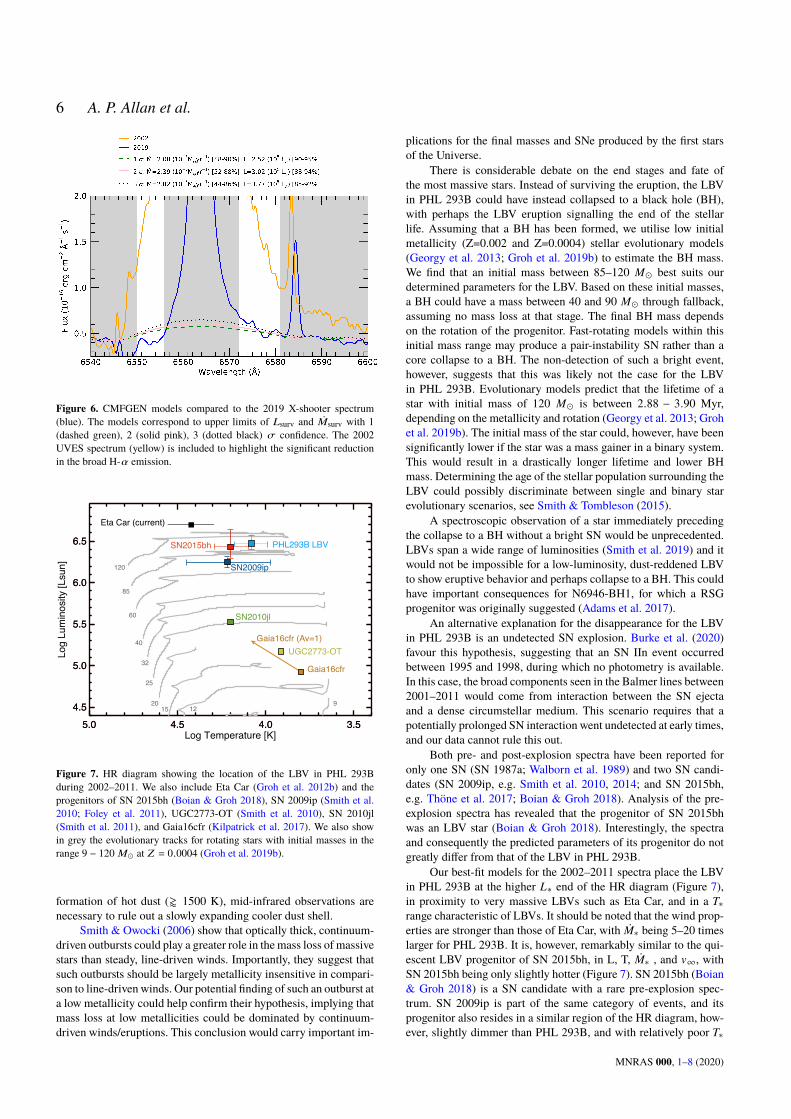
Figure 7. HR diagram showing the location of the LBV in PHL 293Bduring 2002–2011. We also include Eta Car (Groh et al. 2012b) and theprogenitors of SN 2015bh (Boian & Groh 2018), SN 2009ip (Smith et al.2010; Foley et al. 2011), UGC2773-OT (Smith et al. 2010), SN 2010jl(Smith et al. 2011), and Gaia16cfr (Kilpatrick et al. 2017). We also showin grey the evolutionary tracks for rotating stars with initial masses in therange 9 − 120 "� at / = 0.0004 (Groh et al. 2019b).
formation of hot dust (' 1500 K), mid-infrared observations arenecessary to rule out a slowly expanding cooler dust shell.
Smith & Owocki (2006) show that optically thick, continuum-driven outbursts could play a greater role in the mass loss of massivestars than steady, line-driven winds. Importantly, they suggest thatsuch outbursts should be largely metallicity insensitive in compari-son to line-driven winds. Our potential finding of such an outburst ata low metallicity could help confirm their hypothesis, implying thatmass loss at low metallicities could be dominated by continuum-driven winds/eruptions. This conclusion would carry important im-
plications for the final masses and SNe produced by the first starsof the Universe.
There is considerable debate on the end stages and fate ofthe most massive stars. Instead of surviving the eruption, the LBVin PHL 293B could have instead collapsed to a black hole (BH),with perhaps the LBV eruption signalling the end of the stellarlife. Assuming that a BH has been formed, we utilise low initialmetallicity (Z=0.002 and Z=0.0004) stellar evolutionary models(Georgy et al. 2013; Groh et al. 2019b) to estimate the BH mass.We find that an initial mass between 85–120 "� best suits ourdetermined parameters for the LBV. Based on these initial masses,a BH could have a mass between 40 and 90 "� through fallback,assuming no mass loss at that stage. The final BH mass dependson the rotation of the progenitor. Fast-rotating models within thisinitial mass range may produce a pair-instability SN rather than acore collapse to a BH. The non-detection of such a bright event,however, suggests that this was likely not the case for the LBVin PHL 293B. Evolutionary models predict that the lifetime of astar with initial mass of 120 "� is between 2.88 − 3.90 Myr,depending on the metallicity and rotation (Georgy et al. 2013; Grohet al. 2019b). The initial mass of the star could, however, have beensignificantly lower if the star was a mass gainer in a binary system.This would result in a drastically longer lifetime and lower BHmass. Determining the age of the stellar population surrounding theLBV could possibly discriminate between single and binary starevolutionary scenarios, see Smith & Tombleson (2015).
A spectroscopic observation of a star immediately precedingthe collapse to a BH without a bright SN would be unprecedented.LBVs span a wide range of luminosities (Smith et al. 2019) and itwould not be impossible for a low-luminosity, dust-reddened LBVto show eruptive behavior and perhaps collapse to a BH. This couldhave important consequences for N6946-BH1, for which a RSGprogenitor was originally suggested (Adams et al. 2017).
An alternative explanation for the disappearance for the LBVin PHL 293B is an undetected SN explosion. Burke et al. (2020)favour this hypothesis, suggesting that an SN IIn event occurredbetween 1995 and 1998, during which no photometry is available.In this case, the broad components seen in the Balmer lines between2001–2011 would come from interaction between the SN ejectaand a dense circumstellar medium. This scenario requires that apotentially prolonged SN interaction went undetected at early times,and our data cannot rule this out.
Both pre- and post-explosion spectra have been reported foronly one SN (SN 1987a; Walborn et al. 1989) and two SN candi-dates (SN 2009ip, e.g. Smith et al. 2010, 2014; and SN 2015bh,e.g. Thöne et al. 2017; Boian & Groh 2018). Analysis of the pre-explosion spectra has revealed that the progenitor of SN 2015bhwas an LBV star (Boian & Groh 2018). Interestingly, the spectraand consequently the predicted parameters of its progenitor do notgreatly differ from that of the LBV in PHL 293B.
Our best-fit models for the 2002–2011 spectra place the LBVin PHL 293B at the higher !∗ end of the HR diagram (Figure 7),in proximity to very massive LBVs such as Eta Car, and in a )∗range characteristic of LBVs. It should be noted that the wind prop-erties are stronger than those of Eta Car, with ¤"∗ being 5–20 timeslarger for PHL 293B. It is, however, remarkably similar to the qui-escent LBV progenitor of SN 2015bh, in L, T, ¤"∗ , and E∞, withSN 2015bh being only slightly hotter (Figure 7). SN 2015bh (Boian& Groh 2018) is a SN candidate with a rare pre-explosion spec-trum. SN 2009ip is part of the same category of events, and itsprogenitor also resides in a similar region of the HR diagram, how-ever, slightly dimmer than PHL 293B, and with relatively poor )∗
MNRAS 000, 1–8 (2020)

The disappearing massive LBV star in PHL 293B 7
constraints. Other LBV progenitors of luminous transients, such asSN 2010jl (Stoll et al. 2011) and Gaia16cfr (Kilpatrick et al. 2018),which have been identified in pre-explosion photometry, showmuchlower luminosities but consistent temperatures. An obvious differ-ence between all mentioned transients and the PHL 293B case isthe detection of a SN explosion rather than simply the fading of thestar.
The case of PHL 293B is unique in the sense that severalspectra were obtained shortly before its disappearance, which showspectral features that are consistent with stellar properties of an LBVin eruption. The low metallicity (∼ 0.1 solar) of PHL 293B furtheramplifies its importance. Deep high-spatial resolution imaging isneeded to further discriminate between the different scenarios thathave been proposed. It will be highly beneficial to search for similarevents in large scale surveys such as the Zwicky Transient Factory(ZTF; Bellm et al. 2019) and the Large Synoptic Survey Telescope(LSST; Ivezic et al. 2008). Given that the majority of such eventsin deep surveys will be much fainter than PHL 293B and locatedmuch farther, a detailed analysis of this object in the local Universeprovides an important benchmark for understanding the late-timeevolution of massive stars in low metallicity environments and theirremnants.
ACKNOWLEDGEMENTS
We thank the anonymous referee for their constructive comments.AA acknowledges funding from the Provost’s PhD Project Awardsat Trinity College Dublin. JHG acknowledges support from the IrishResearch Council New Foundations Award 206086.14414 “Physicsof Supernovae and Star". IB is supported by a Trinity CollegeDublinPostgraduate Award. EF acknowledges funding from IRC Project208026, Award 15330.
Based on observations made with the NASA/ESA HubbleSpace Telescope, obtained from the Data Archive at the SpaceTelescope Science Institute, which is operated by the Associationof Universities for Research in Astronomy, Inc., under NASA con-tract NAS5-26555. These observations are associated with program#12018.
Funding for SDSS-III has been provided by the Alfred P.Sloan Foundation, the Participating Institutions, the National Sci-ence Foundation, and the U.S. Department of Energy Office ofScience. The SDSS-III web site is http://www.sdss3.org/.
SDSS-III is managed by the Astrophysical Research Consor-tium for the Participating Institutions of the SDSS-III Collabora-tion including the University of Arizona, the Brazilian ParticipationGroup, Brookhaven National Laboratory, Carnegie Mellon Uni-versity, University of Florida, the French Participation Group, theGerman Participation Group, Harvard University, the Instituto deAstrofísica de Canarias, the Michigan State/Notre Dame/JINA Par-ticipation Group, Johns Hopkins University, Lawrence BerkeleyNational Laboratory, Max Planck Institute for Astrophysics, MaxPlanck Institute for Extraterrestrial Physics, NewMexico State Uni-versity, New York University, Ohio State University, PennsylvaniaState University, University of Portsmouth, Princeton University,the Spanish Participation Group, University of Tokyo, University ofUtah, Vanderbilt University, University of Virginia, University ofWashington, and Yale University.
REFERENCES
Adams S. M., Kochanek C. S., Gerke J. R., Stanek K. Z., Dai X., 2017,MNRAS, 468, 4968
Anderson L. S., 1989, ApJ, 339, 558Barba R. H., Niemela V. S., Baume G., Vazquez R. A., 1995, ApJ, 446, L23Bellm E. C., et al., 2019, PASP, 131, 018002Boian I., Groh J. H., 2018, A&A, 617, A115Brown T. M., Heap S. R., Hubeny I., Lanz T., Lindler D., 2002, ApJ, 579,
L75Burke C. J., et al., 2020, arXiv e-prints, p. arXiv:2002.12369Crowther P. A., Hadfield L. J., 2006, A&A, 449, 711Dolphin A. E., 2000, PASP, 112, 1383Dolphin A., 2016, DOLPHOT: Stellar photometry (ascl:1608.013)Drissen L., Crowther P. A., Smith L. J., Robert C., Roy J.-R., Hillier D. J.,
2001, ApJ, 546, 484Eldridge J. J., Stanway E. R., Xiao L., McClelland L. A. S., Taylor G., Ng
M., Greis S. M. L., Bray J. C., 2017, Publ. Astron. Soc. Australia, 34,e058
Foley R. J., Berger E., Fox O., Levesque E. M., Challis P. J., Ivans I. I.,Rhoads J. E., Soderberg A. M., 2011, ApJ, 732, 32
Gal-Yam A., Leonard D. C., 2009, Nature, 458, 865Georgy C., et al., 2013, A&A, 558, A103Groh J. H., Hillier D. J., Damineli A., Whitelock P. A., Marang F., Rossi C.,
2009, ApJ, 698, 1698Groh J. H., Hillier D. J., Madura T. I., Weigelt G., 2012a, MNRAS, 423,
1623Groh J. H., Hillier D. J., Madura T. I., Weigelt G., 2012b, MNRAS, 423,
1623Groh J. H., Meynet G., Ekström S., 2013, A&A, 550, L7Groh J. H., Meynet G., Ekström S., Georgy C., 2014, A&A, 564, A30Groh J. H., Farrell E., Meynet G., Smith N., Murphy L., Allan A., 2019a,
arXiv e-prints, p. arXiv:1912.00994Groh J. H., et al., 2019b, A&A, 627, A24Hillier D. J., 1991, A&A, 247, 455Hillier D. J., Miller D. L., 1998, ApJ, 496, 407Hillier D. J., Davidson K., Ishibashi K., Gull T., 2001, ApJ, 553, 837Hillier D. J., et al., 2006, ApJ, 642, 1098Humphreys R. M., Davidson K., 1994, PASP, 106, 1025Hunter I., et al., 2007, A&A, 466, 277Ivezic Z., et al., 2008, Serbian Astronomical Journal, 176, 1Izotov Y. I., Thuan T. X., 2009, ApJ, 690, 1797Izotov Y. I., Foltz C. B., Green R. F., Guseva N. G., Thuan T. X., 1997, ApJ,
487, L37Izotov Y. I., Thuan T. X., Stasińska G., 2007, ApJ, 662, 15Izotov Y. I., Guseva N. G., Fricke K. J., Henkel C., 2011, A&A, 533, A25Kilpatrick C. D., et al., 2017, preprint, (arXiv:1706.09962)Kilpatrick C. D., et al., 2018, MNRAS, 473, 4805Kotak R., Vink J. S., 2006, A&A, 460, L5Legrand F., Kunth D., Roy J. R., Mas-Hesse J. M., Walsh J. R., 1997, A&A,
326, L17Maeder A., Meynet G., 2000, ARA&A, 38, 143Massey P., Olsen K. A. G., Parker J. W., 2003, PASP, 115, 1265Massey P., Neugent K. F., Morrell N., Hillier D. J., 2014, ApJ, 788, 83Mould J. R., et al., 2000, ApJ, 529, 786Neugent K. F., Massey P., Morrell N., 2018, ApJ, 863, 181Schulze S., et al., 2015, ApJ, 808, 73Shenar T., Gilkis A., Vink J. S., Sana H., Sand er A. A. C., 2020, A&A, 634,
A79Smith N., 2014, ARA&A, 52, 487Smith N., Owocki S. P., 2006, ApJ, 645, L45Smith N., Tombleson R., 2015, MNRAS, 447, 598Smith N., Hinkle K. H., Ryde N., 2009, AJ, 137, 3558Smith N., et al., 2010, AJ, 139, 1451Smith N., et al., 2011, ApJ, 732, 63Smith N., Mauerhan J. C., Prieto J. L., 2014, MNRAS, 438, 1191Smith N., AghakhanlooM., Murphy J. W., Drout M. R., Stassun K. G., Groh
J. H., 2019, MNRAS, 488, 1760
MNRAS 000, 1–8 (2020)

8 A. P. Allan et al.
Stoll R., Prieto J. L., Stanek K. Z., Pogge R. W., Szczygieł D. M., PojmańskiG., Antognini J., Yan H., 2011, ApJ, 730, 34
Terlevich R., Terlevich E., Bosch G., Díaz Á., Hägele G., Cardaci M., FirpoV., 2014, MNRAS, 445, 1449
Thöne C. C., et al., 2017, A&A, 599, A129Walborn N. R., Prevot M. L., Prevot L., Wamsteker W., Gonzalez R.,
Gilmozzi R., Fitzpatrick E. L., 1989, A&A, 219, 229van Genderen A. M., 2001, A&A, 366, 508
This paper has been typeset from a TEX/LATEX file prepared by the author.
MNRAS 000, 1–8 (2020)