THE PLAUSABILITY OF ECONOMICS SCENARIO OF WORLD WARS I AND II: AN EXPERIENTIAL STUDY OF UK, GERMANY...
36
THE PLAUSABILITY OF ECONOMICS SCENARIO OF WORLD WARS I AND II: AN EXPERIENTIAL STUDY OF UK, GERMANY AND FRANCE .
-
Upload
laureen-thompson -
Category
Documents
-
view
217 -
download
4
Transcript of THE PLAUSABILITY OF ECONOMICS SCENARIO OF WORLD WARS I AND II: AN EXPERIENTIAL STUDY OF UK, GERMANY...

THE PLAUSABILITY OF ECONOMICS SCENARIO OF WORLD WARS I AND II: AN EXPERIENTIAL STUDY OF UK, GERMANY AND FRANCE .
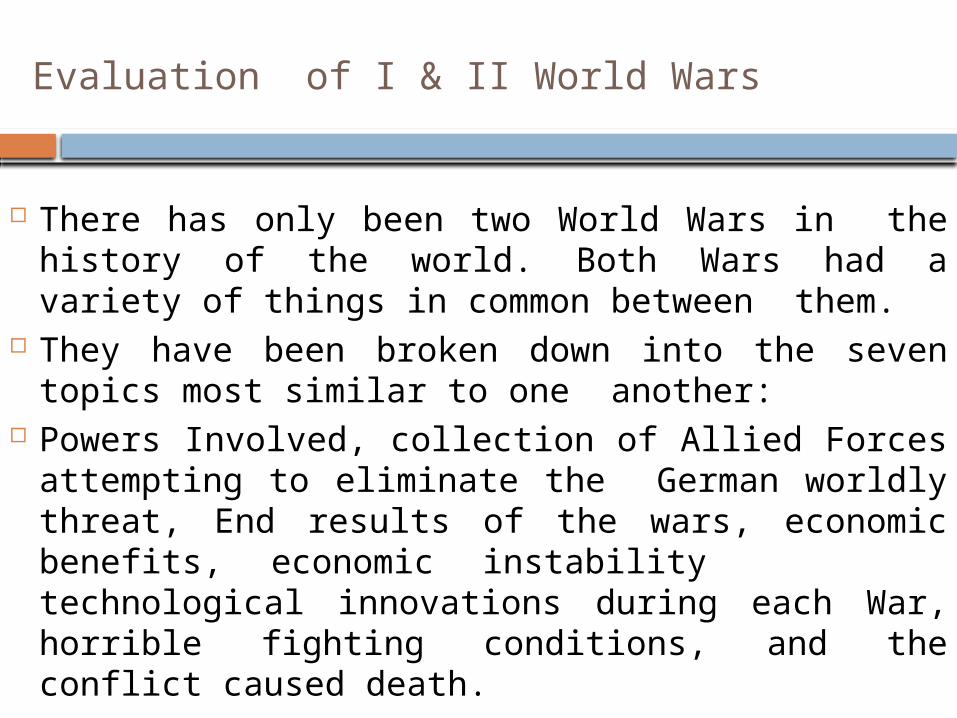
Evaluation of I & II World Wars
There has only been two World Wars in the history of the world. Both Wars had a variety of things in common between them.
They have been broken down into the seven topics most similar to one another:
Powers Involved, collection of Allied Forces attempting to eliminate the German worldly threat, End results of the wars, economic benefits, economic instability technological innovations during each War, horrible fighting conditions, and the conflict caused death.

Causes of World War I:
• Strife between Serbia and the Austro-Hungarian Empire. Serbia, a province of the Empire, wanted to become its own independent nation. The Empire would lose its reign of dominance if this happened.
• Russia backed Serbia. • Germany backed the Empire. • Franz Ferdinand assassinated by Black Hand officials in
1914. • Russia mobilizes army, and Germans ask to stop. • Russia: “No.” • Germany declares war. • Allied Powers side with Russia. • Central Powers side with Germany.
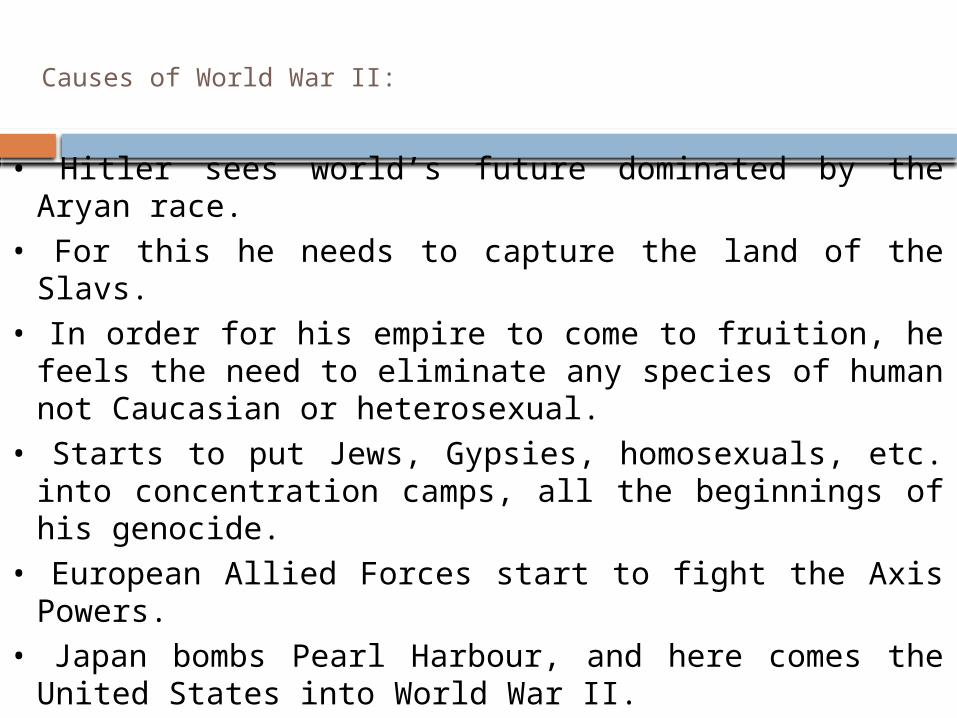
Causes of World War II:
• Hitler sees world’s future dominated by the Aryan race.
• For this he needs to capture the land of the Slavs. • In order for his empire to come to fruition, he feels
the need to eliminate any species of human not Caucasian or heterosexual.
• Starts to put Jews, Gypsies, homosexuals, etc. into concentration camps, all the beginnings of his genocide.
• European Allied Forces start to fight the Axis Powers.
• Japan bombs Pearl Harbour, and here comes the United States into World War II.
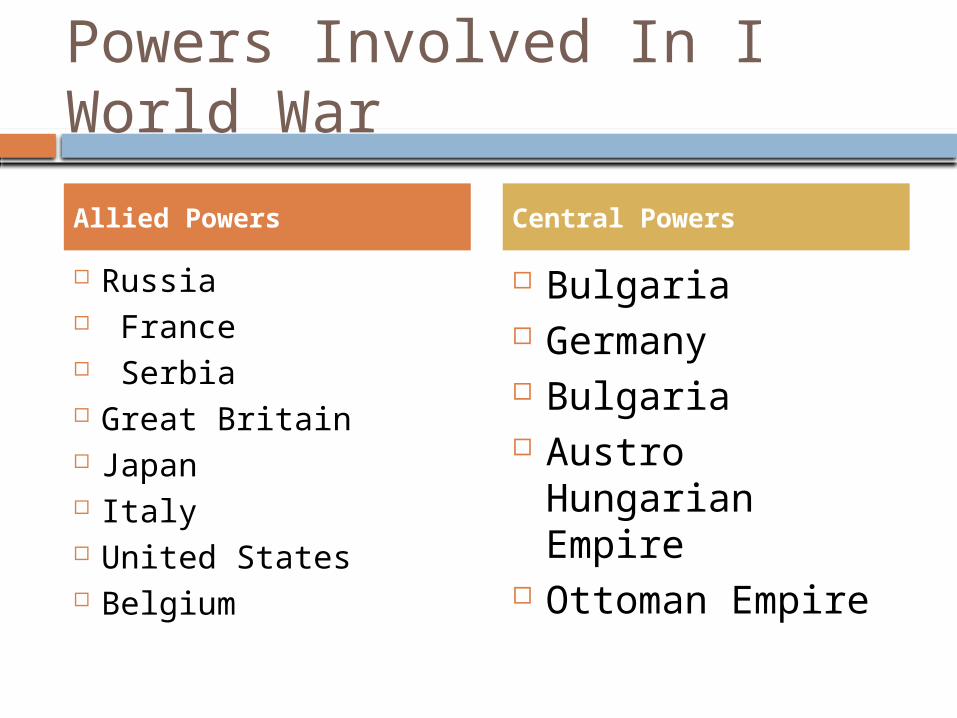
Powers Involved In I World War
Russia France Serbia Great Britain Japan Italy United States Belgium
Bulgaria Germany Bulgaria Austro Hungarian
Empire Ottoman Empire
Allied Powers Central Powers
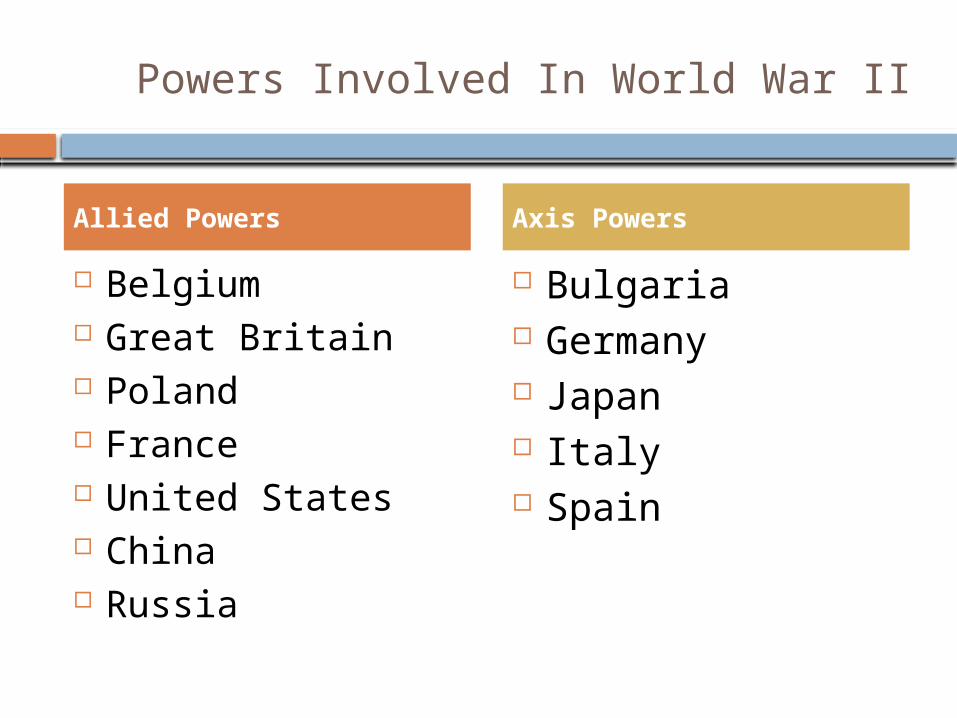
Powers Involved In World War II
Belgium Great Britain Poland France United States China Russia
Bulgaria Germany Japan Italy Spain
Allied Powers Axis Powers

Most of the countries that fought in World War I also fought in World War II. Each side (Allied Powers/Central/Axis Powers) were comprised of mostly the same countries in both wars, although several nations such as Japan and Italy changed sides in between the conflicts.
The Importance Of The War
The outburst of war that broke out in 1914 was more of a break in world history than even the Second World War with its unprecedented mass annihilation. The First World War marked the dramatic beginning of the end of European predominance over the globe, which had lasted for five centuries.

ECONOMIC IMPACT OF WORLD WAR I
In £m 1913/14 1914/15 1915/16 1916/17 1917/18 1918/19
Expe. 197 561 1559 2198 2696 2579
Rev. 198 227 337 573 707 889
Surplus/Deficit 1 -334 -1222 -1625 -1989 -1690
Fighting Services 41.4 64.5 47.4 37.1 35.3 45
Other Exp. 40.7 29.2 32 24.1 24.4 24.9
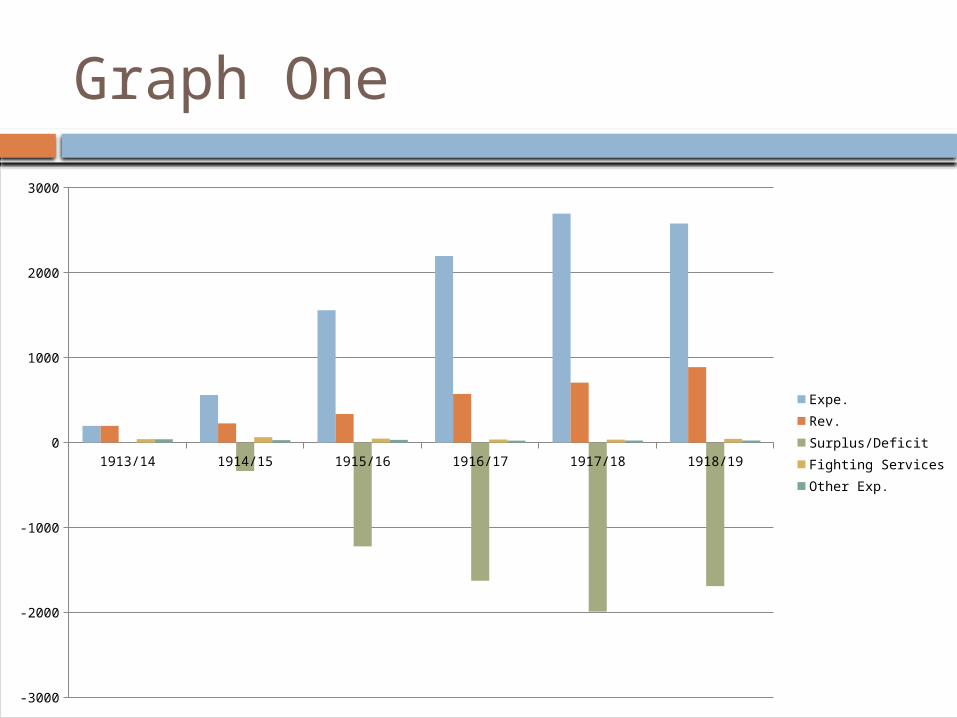
Graph One
1913/14 1914/15 1915/16 1916/17 1917/18 1918/19
-3000
-2000
-1000
0
1000
2000
3000
Expe.Rev.Surplus/DeficitFighting ServicesOther Exp.

In £m
1919-1920
1920-1921
1921-1922
1922-1923
1923-1924
1924-1925
1925-1926
1926-1927
1927-1928
1928-1929
Expe. 1671 1622.3 1282.9 1187.8 1224.6 1300.1 1359.3 1341.6 1324.4 1356.1
Rev. 1124.4 1350.7 1124.4 1035.1 996.8 1019.6 1026.3 1074.5 1079.4 1049.5
Surplus/Deficit -546.6 -271.6 -158.7 -151.9 -224.8 -560.9 -333 -267.1 -245 -306.6
Fighting Services 297.2 222 123.3 123.9 119.5 127.1 124.1 125.2 119.1 118.6
Other Exp. 434.5 457.2 172.1 231 247.2 300.5 326.2 309.7 302.1 312.8
ECONOMIC IMPACT OF POST WORLD WAR I

In £m
1929-1930
1930-1931
1931-1932
1932-1933
1933-1934
1934-1935
1935-1936
1936-1937
Expe. 7401.3 1397.1 1372.3 1319.6 1348 1428.6 1526.3 1588.5
Rev. 1089.1 1081.6 1053.5 1049.8 1072.1 1094.9 1162.4 1222.5
Surplus/Deficit -6312.2 315.5 318.8 -269.8 -275.9 -333.7 -363.9 -366.6
Fighting Services 116.9 112.9 110.9 116.3 121.9 145.5 195.2 205.9
Other Exp. 315.8 324.6 310.4 317.5 330.1 350.5 381.1 415.7

World War I
The close Scrutiny of the tabular representation and graphical analysis of graph one exhibits the economic impact of the World War I
The economic position was decelerating with expenditure increasing more than proportionately relative to revenue, there by depicting deficit in the balance of payments. The expenditure outweighted that recorded from 1671 million pounds to 1588.5 million pounds during the period of 1919 -20 to 1936-37, in comparison with revenue that stood at 1124.4 million pounds to 1222.5 million pounds during the same period.
The defence expenditure a major chunk out of the total expenditure and constituted an enormous set back to the economic stability.
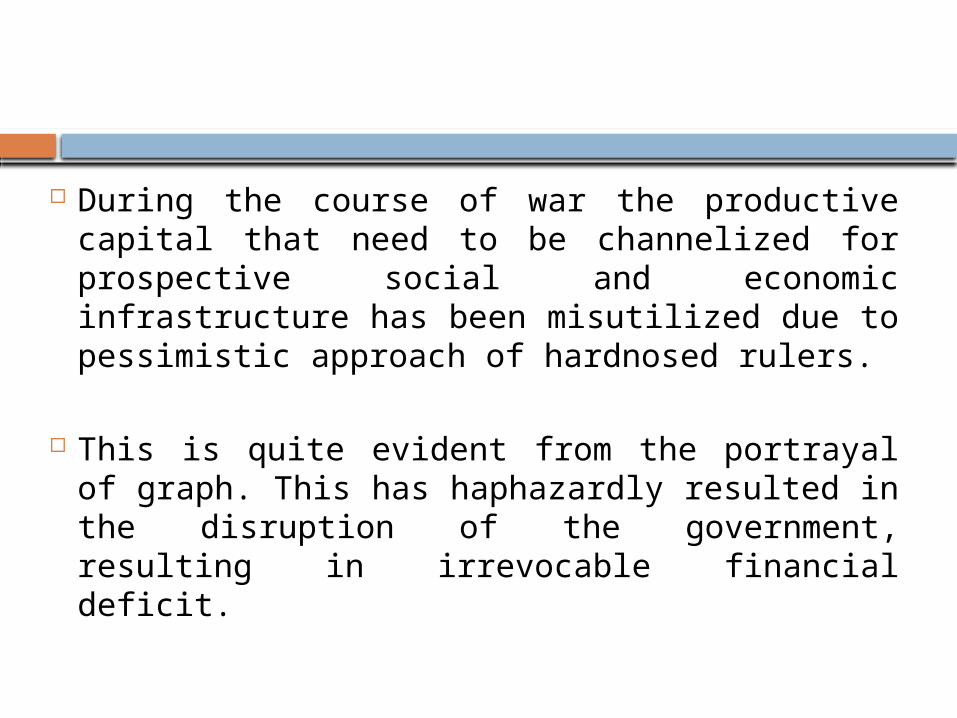
During the course of war the productive capital that need to be channelized for prospective social and economic infrastructure has been misutilized due to pessimistic approach of hardnosed rulers.
This is quite evident from the portrayal of graph. This has haphazardly resulted in the disruption of the government, resulting in irrevocable financial deficit.

An interesting finding of the whole crux of the story, reveals that during post World war I, i.e. for the reference period of 1919 to 1929-1930, the performance of the economy accounted for more economic deficits due to excess of expenditure relative to revenue.
The effect of 1929 is enormous due to Great Economic Depression, that recorded a level of bleak performance in terms of deficit i.e. 6312.2 million pounds. (Tabular and Graphical Representation)

World War II
The open hostility and simmering feelings of revenge in German soldiers after the treaty foreshadowed the start of World War II.
Second World War – often called a continuation of First World War, started in 1939 with Germany’s invasion of Poland. Italy, Germany and Japan formed an alliance called “Axis” against the allied forces of Britain, France and Russia.

After Germany’s invasion of Russia and Japan’s bombing of Pearl Harbor, United States joined the allied forces.
Second World War ended with Germany’s defeat in Russia and Japan’s surrender after America dropped two Atomic bombs in Hiroshima and Nagasaki

In £m 1938/39 1939/40 1940/41 1941/42 1942/43 1943/44 1944/45
Expe. 1724.7 2133.9 4679.7 5670.1 6496.5 6662.9 6969.3
Rev. 1286.4 1434.8 1806.3 2493.9 3250 3483.5 3698.8
Surplus/Deficit -438.3 -699.1 -2873.4 -3176.2 -3246.5 -3179.4 -3270.5
Fighting Services 266.2 643.8 3232.9 4096.8 4863.1 4964.9 5153.3
Other Exp. 438 417.6 394.3 439.6 423.8 414.1 445.2
ECONOMIC IMPACT OF WORLD WAR II

The Great Depression was a world wide castastrophe whose repercussions alike were global in character. The primary cause of the Great Depression reads the first sentence of President Herbert Hoover’s memoirs was the war of 1914-1918. This has in turn aggravated the even greater castastrophe of World War II. Both the World wars have inflicted immensive economic and human toll on the important societies of advanced industrialized world including Britain, France and Germany. The long term impact of the distortions in trade, capital inflows and exchange rates as quoted by John Maynard Keynes have perpetuated the economic instability.

Graph Two
1938/39 1939/40 1940/41 1941/42 1942/43 1943/44 1944/45
-4000
-2000
0
2000
4000
6000
8000
Expe.Rev.Surplus/DeficitFighting ServicesOther Exp.

The economy has not even slowly revived from the phase of recession to recovery where in during 1930-1931 onwards to 1944-45 , their exhibited a momentous negative trend. There was not complete over hauling of the economic position where in, the trend of revenue exhibited dismal performance resulting in huge deficits. (Tabular and Graphical RepresentationTwo)
In £m 1945/46 1946/47 1947/48 1948/49 1949/50
Expe. 6969.3 6460 5284.4 4695.2 4580.8
Rev. 3698.8 3769.6 3771 4056 5012
Surplus/Deficit -3270.5 -2690.4 -1513.4 -639.2 431.2
Fighting Services 5153.3 4446.4 1746 913 820.5
Other Exp. 445.2 504.8 1603.5 1373.2 1209
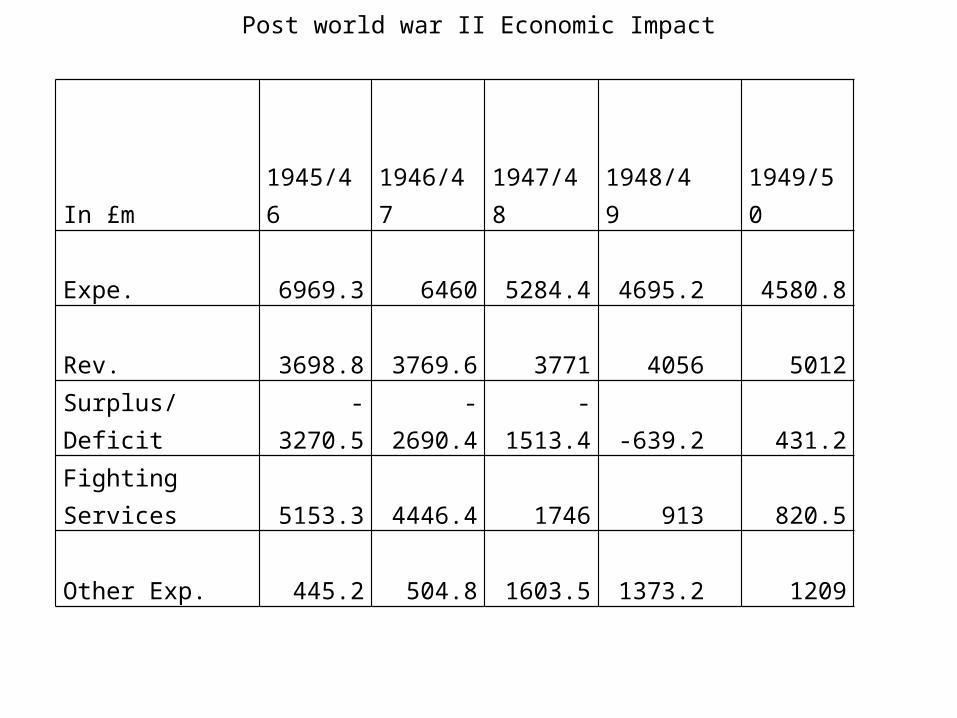
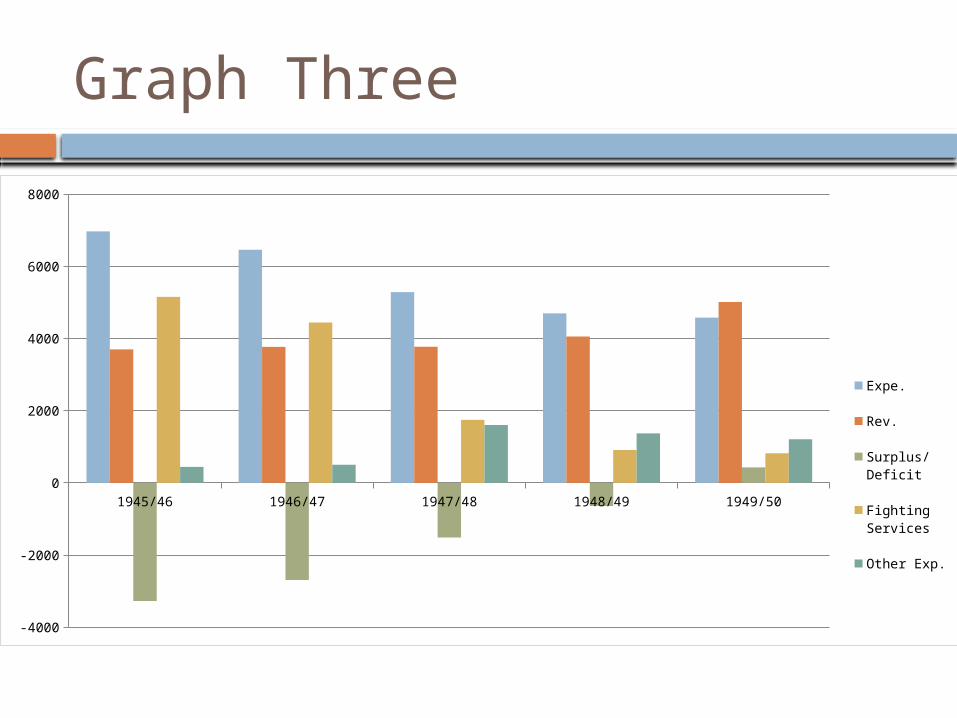
Post world war II Economic Impact

The trend of deficit occurrence still prevailed after the post world war II during the time period of 1945-46 to 1948-49, due to extravagant expenditure on fighting services, with the exception of the year 1949-50. (Graphical Representation 3)
Graph Three
1945/46 1946/47 1947/48 1948/49 1949/50
-4000
-2000
0
2000
4000
6000
8000
Expe.
Rev.
Surplus/Deficit
Fighting Services
Other Exp.

The photographs of the artillery used during the World War, clearly displays the diversification of machinery and equipment that has been propelled. The arms and ammunitions that has been utilized during the time of wars depicts the technological breakthroughs that has been imparted for massive destruction of the social, economic infrastructure and manpower loss.
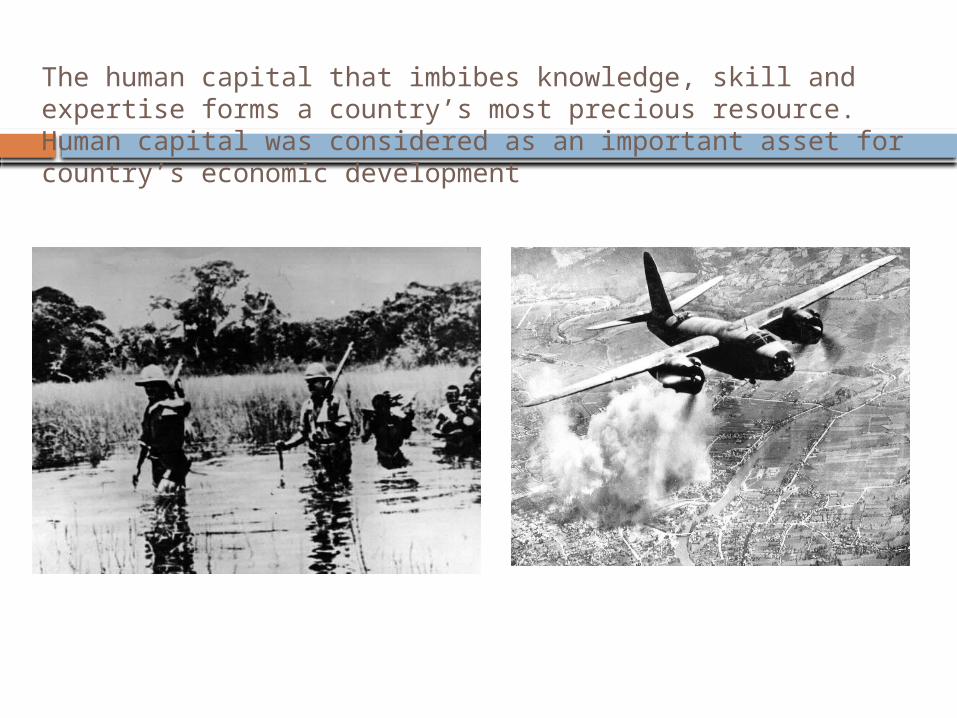
The human capital that imbibes knowledge, skill and expertise forms a country’s most precious resource. Human capital was considered as an important asset for country’s economic development

The military personnel involved during the World Wars as a case study of United Kingdom reveals the devastating human loss that puts a lot of human capital toll in terms of Marginal Physical Productivity of labour or worker. Usually the war expenditure in strict economic sense doesn’t have any economic value, but is exclusively used as a mere proxy for defense purpose
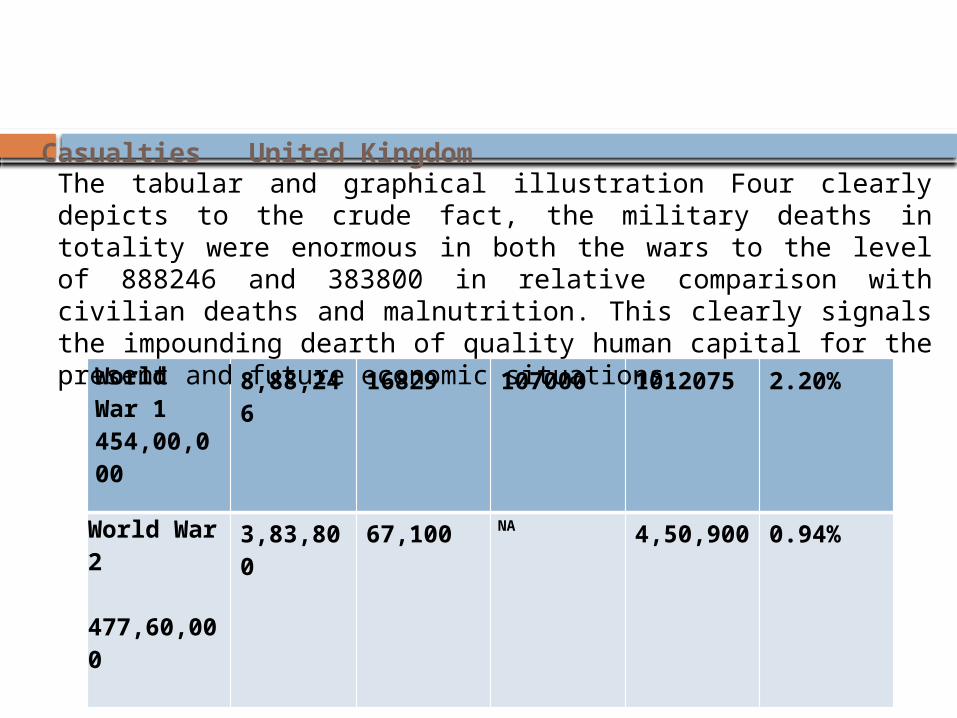
Casualties United Kingdom
World War 1454,00,000
8,88,246
16829 107000 1012075
2.20%
World War 2
477,60,000
3,83,800
67,100 NA 4,50,900
0.94%
The tabular and graphical illustration Four clearly depicts to the crude fact, the military deaths in totality were enormous in both the wars to the level of 888246 and 383800 in relative comparison with civilian deaths and malnutrition. This clearly signals the impounding dearth of quality human capital for the present and future economic situations.

Graph Four
1 20
200,000
400,000
600,000
800,000
1,000,000
1,200,000
Military DeathsCivilian Deaths(Due To Mil. Action)Civilian Deaths(Malnutrition)Total Deaths(Human Capital)

IMPACT OF FIGHTING SERVICES ON ECONOMY
The civil and military conflicts impacts socio economic performance from macro economic perspective.
The war impact resulted in the destruction of physical capital i.e. Social and economic infrastructure that has persistent impact on poverty rates, consumption levels, population density and over all economic performance, public buildings .
The largest number of destroyed buildings were apartment, houses, schools, hospitals, churches, museums, public buildings, recreational and health facilities after air raids have been confisticated for their own use by allied forces.
WAR TIME GDP : A COMPARATIVE ANALYSIS OF CROSS COUNTRIES
The conventional measure of Gross Domestic Product was considered as proxy for economic growth. This was considered as an well established forecaster of military victory . The era of GDP has been characterized by a huge global rise in living standards in wealth
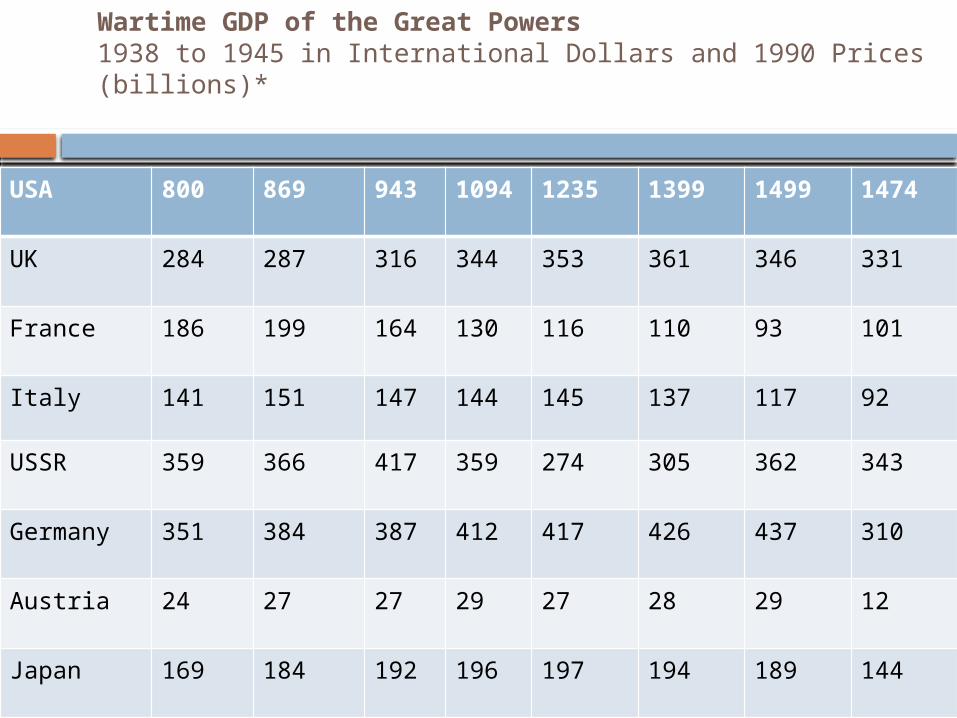
Wartime GDP of the Great Powers1938 to 1945 in International Dollars and 1990 Prices (billions)*
USA 800 869 943 1094 1235 1399 1499 1474
UK 284 287 316 344 353 361 346 331
France 186 199 164 130 116 110 93 101
Italy 141 151 147 144 145 137 117 92
USSR 359 366 417 359 274 305 362 343
Germany 351 384 387 412 417 426 437 310
Austria 24 27 27 29 27 28 29 12
Japan 169 184 192 196 197 194 189 144

Count
ryUSA UK
Fran
ceIta
lyUSS
R
Germ
any
Austri
a
Japa
n
Allied
/Axi
s GDP
0
200
400
600
800
1000
1200
1400
1600
1800
2000
1938
1940
1942
1944
19381939194019411942194319441945

OVERVIEW OF ALLIED TO AXIS GDP
The annual ratios of allied to axis GDP can be represented with the following equations. In 1938-39, the Allied GDP consists of USA + UK + France + USSR; Axis GDP consists of Germany + Austria + Italy + Japan.
In 1940, half of the French GDP is allotted to the Allies and half is given to the Axis. In 1941-43, Allied GDP consists of USA + UK + USSR; Axis GDP consists of Germany + France + Austria + Italy + Japan. For 1944, Italian GDP is allotted to the Allies. In 1945, the GDP of Italy and France are added to the Allied total.
The ratio of Allied to Axis GDP presented in the following table clearly depicts that for the year 1939 France and UK faced Germany over Poland. The table clearly depicts that the USA exhibited its growing credibility in GDP from 1938 to 1945 i.e. 800 to 1474 US dollars as first ranking order of preference.
The second order of preference in GDP has been taken over by Germany followed by USSR. The fourth , fifth, sixth and seventh Preference encompassed with UK,JapanFrance and Austria.

CONCLUSION
At the end it can be concluded that during pre world war period of II, there was remarkable Allied economic predominance measured in GDP, where in the same has not been exhibited at the beginning of the war in 1939.
For a period of time the Axis has greater GDP than Allies. It is also worth mentioning that from a substantial position of 1.25 in 1939, the Allies were pathetically reduced to bleak performance level of 0.38by 1941.

THANK YOU