The Petrochemical Industry in Taiwan, ROC - · PDF fileThe Petrochemical Industry in Taiwan,...
27
1 The Petrochemical Industry in Taiwan, ROC 2015 Global Economy Outlook Global economic growth declined in the first half of 2015, reflecting a further slowdown in emerging markets and a weaker recovery in advanced economies. It’s now projected at 3.1% for 2015 as a whole. Slightly lower than 2014 and 0.2% below than last forecast. Though, IMF has forecasted a better global economy in 2016 (except China) than 2015, most countries’ GDP growths were revised down in January this year for 2016/2017, as illustrated in Table 1. Commodity prices have declined sharply during the past two years and output growth has slowed considerably among those emerging markets and developing economies that are net exporters of commodities. Table 1. Economic Growth Rate (%) in Selected Regions & Countries 2013 2014 2015(EST) 2016(EST) 2017(EST) World 3.28 3.4 3.1 3.2 3.5 USA 2.22 2.4 2.5 2.4 2.5 Euro Area -0.43 0.9 1.5 1.7 1.7 Japan 1.52 0.0 0.6 0.5 0.1 China 7.70 7.3 6.9 6.5 6.2 Taiwan 2.09 3.8 0.7 1.5 2.2 India 5.02 7.3 7.3 7.5 7.5 Thailand 2.89 0.9 2.8 3.0 3.2 Indonesia 5.78 5.0 4.8 4.9 5.3 Source: IMF Jan./Apr., 2016 The 2015 Petrochemical Industry Situation in Taiwan- Overview The production of six raw materials and twenty-four major petrochemical intermediates totaled 29,438,437 MT, an increase of 2.3% over the previous year, according to PIAT statistics, as indicated in Table 2. The total import was down by 4.5% whereas the total demand was up by1.0% in 2015, compared with 2014. Table 2 also indicates supply & demand of the 24 petrochemical intermediates in 2014/2015. Production & export all increased to certain extent in 2015.
Transcript of The Petrochemical Industry in Taiwan, ROC - · PDF fileThe Petrochemical Industry in Taiwan,...

1
The Petrochemical Industry in Taiwan, ROC
2015 Global Economy Outlook
Global economic growth declined in the first half of 2015, reflecting a further
slowdown in emerging markets and a weaker recovery in advanced economies. It’s
now projected at 3.1% for 2015 as a whole. Slightly lower than 2014 and 0.2% below
than last forecast. Though, IMF has forecasted a better global economy in 2016
(except China) than 2015, most countries’ GDP growths were revised down in
January this year for 2016/2017, as illustrated in Table 1. Commodity prices have
declined sharply during the past two years and output growth has slowed considerably
among those emerging markets and developing economies that are net exporters of
commodities.
Table 1. Economic Growth Rate (%) in Selected Regions & Countries
2013 2014 2015(EST) 2016(EST) 2017(EST)
World 3.28 3.4 3.1 3.2 3.5
USA 2.22 2.4 2.5 2.4 2.5
Euro Area -0.43 0.9 1.5 1.7 1.7
Japan 1.52 0.0 0.6 0.5 0.1
China 7.70 7.3 6.9 6.5 6.2
Taiwan 2.09 3.8 0.7 1.5 2.2
India 5.02 7.3 7.3 7.5 7.5
Thailand 2.89 0.9 2.8 3.0 3.2
Indonesia 5.78 5.0 4.8 4.9 5.3
Source: IMF Jan./Apr., 2016
The 2015 Petrochemical Industry Situation in Taiwan- Overview
The production of six raw materials and twenty-four major petrochemical intermediates
totaled 29,438,437 MT, an increase of 2.3% over the previous year, according to PIAT
statistics, as indicated in Table 2. The total import was down by 4.5% whereas the total
demand was up by1.0% in 2015, compared with 2014.
Table 2 also indicates supply & demand of the 24 petrochemical intermediates in
2014/2015. Production & export all increased to certain extent in 2015.
2
Table 2. Supply and Demand for Major Petrochemicals in Taiwan
Unit: Metric Ton
2014 2015 Growth (%)
Raw Materials
Production 12,198,930 12,323,315 1.0
Import 2,531,824 2,451,774 -3.2
Export 2,976,383 2,898,470 -2.6
Demand 11,754,371 11,876,619 1.0
Intermediates
Production 16,551,267 17,115,122 3.4
Import 3,470,466 3,280,005 -5.5
Export 7,769,443 8,030,165 3.4
Demand 12,252,290 12,364,962 0.9
Total
Production 28,750,197 29,438,437 2.4
Import 6,002,290 5,731,779 -4.5
Export 10,745,826 10,928,635 1.7
Demand 24,006,661 24,241,581 1.0
Demand (Apparent) = Production + Import – Export
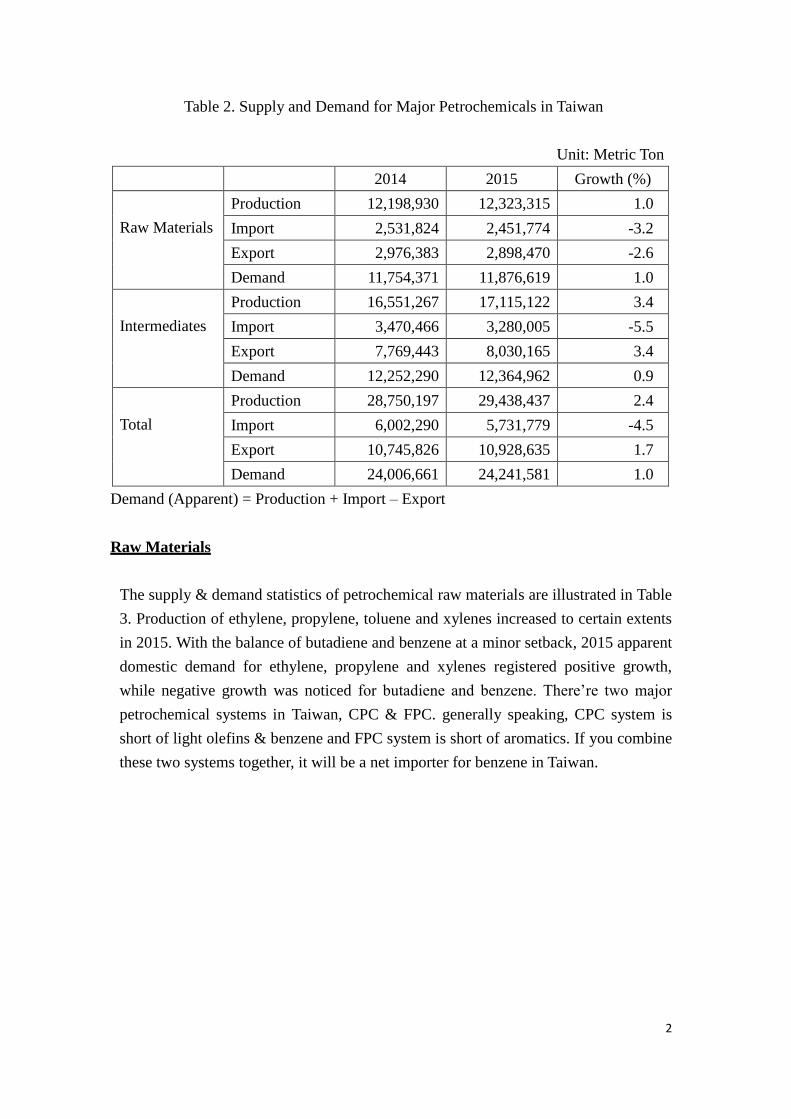
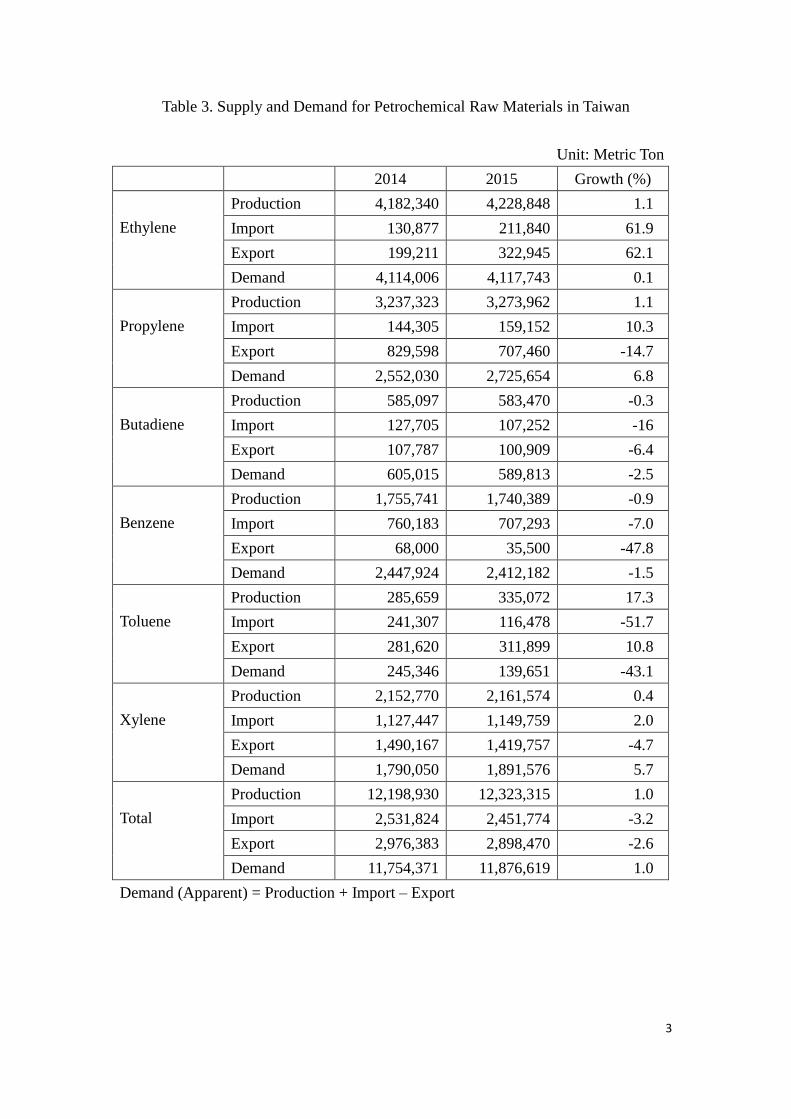
Raw Materials
The supply & demand statistics of petrochemical raw materials are illustrated in Table
3. Production of ethylene, propylene, toluene and xylenes increased to certain extents
in 2015. With the balance of butadiene and benzene at a minor setback, 2015 apparent
domestic demand for ethylene, propylene and xylenes registered positive growth,
while negative growth was noticed for butadiene and benzene. There’re two major
petrochemical systems in Taiwan, CPC & FPC. generally speaking, CPC system is
short of light olefins & benzene and FPC system is short of aromatics. If you combine
these two systems together, it will be a net importer for benzene in Taiwan.
3
Table 3. Supply and Demand for Petrochemical Raw Materials in Taiwan
Unit: Metric Ton
2014 2015 Growth (%)
Ethylene
Production 4,182,340 4,228,848 1.1
Import 130,877 211,840 61.9
Export 199,211 322,945 62.1
Demand 4,114,006 4,117,743 0.1
Propylene
Production 3,237,323 3,273,962 1.1
Import 144,305 159,152 10.3
Export 829,598 707,460 -14.7
Demand 2,552,030 2,725,654 6.8
Butadiene
Production 585,097 583,470 -0.3
Import 127,705 107,252 -16
Export 107,787 100,909 -6.4
Demand 605,015 589,813 -2.5
Benzene
Production 1,755,741 1,740,389 -0.9
Import 760,183 707,293 -7.0
Export 68,000 35,500 -47.8
Demand 2,447,924 2,412,182 -1.5
Toluene
Production 285,659 335,072 17.3
Import 241,307 116,478 -51.7
Export 281,620 311,899 10.8
Demand 245,346 139,651 -43.1
Xylene
Production 2,152,770 2,161,574 0.4
Import 1,127,447 1,149,759 2.0
Export 1,490,167 1,419,757 -4.7
Demand 1,790,050 1,891,576 5.7
Total
Production 12,198,930 12,323,315 1.0
Import 2,531,824 2,451,774 -3.2
Export 2,976,383 2,898,470 -2.6
Demand 11,754,371 11,876,619 1.0
Demand (Apparent) = Production + Import – Export

4
Petrochemical Intermediates
Thermoplastic Resins
Supply & demand statistics for 5 major thermoplastic resins are summarized in Table
4. Production of the six commodity plastics all showed positive growth in 2015 over
the previous year.
Table 4. Supply and Demand for Plastics in Taiwan
Unit: Metric Ton
2014 2015 Growth (%)
LDPE/LLDPE
/EVA
Production 576,430 610,608 5.9
Import 290,637 291,565 0.3
Export 416,823 475,131 14.0
Demand 450,244 427,042 -5.2
HDPE
Production 524,555 585,977 11.7
Import 78,261 68,946 -11.9
Export 303,446 331,083 9.1
Demand 299,370 323,840 8.2
PVC
Production 1,514,893 1,608,264 6.2
Import 26,643 27,265 2.3
Export 975,206 1,115,057 14.3
Demand 566,330 520,472 -8.1
PP
Production 1,042,198 1,127,891 8.2
Import 175,081 207,035 18.3
Export 660,063 697,391 5.7
Demand 557,216 637,535 14.4
PS
Production 775,105 797,198 2.9
Import 7,743 4,084 -47.3
Export 723,916 764,784 5.6
Demand 58,932 36,498 -38.1
ABS
Production 1,201,685 1,225,677 2
Import 13,167 12,408 -5.8
Export 1,046,874 1,060,626 1.3
Demand 167,978 177,459 5.6
Demand (Apparent) = Production + Import – Export

5
Fiber Intermediates
Supply & demand balance of fiber intermediates is depicted in Table 5. Intermediates
AN/MEG showed positive sign in production / export of 2015. CPL continued to be in
far short supply in 2014/2015 and relied heavily on import. Due to PTA substantial
expansion projects in China within past three years and import tax difference between
Taiwan & ASEAN, Taiwan PTA producers slashed export volume in 2014/ 2015.
Table 5. Supply and Demand for Synthetic Fibers in Taiwan
Unit: Metric Ton
2014 2015 Growth (%)
CPL
Production 227,200 233,100 2.6
Import 442,950 404,649 -8.6
Export 0 0 0
Demand 670,150 637,749 -4.8
AN
Production 464,511 469,794 1.1
Import 110,181 97,440 -11.6
Export 184,852 192,307 4.0
Demand 389,840 374,927 -3.8
PTA
Production 2,596,260 2,626,500 1.2
Import 0 0 0
Export 208,724 154,498 -26.0
Demand 2,387,536 2,472,002 3.5
EG
Production 2,298,600 2,348,696 2.2
Import 204,556 168,349 -17.7
Export 1,482,794 1,413,509 -4.7
Demand 1,020,362 1,103,536 8.2
Demand (Apparent) = Production + Import – Export
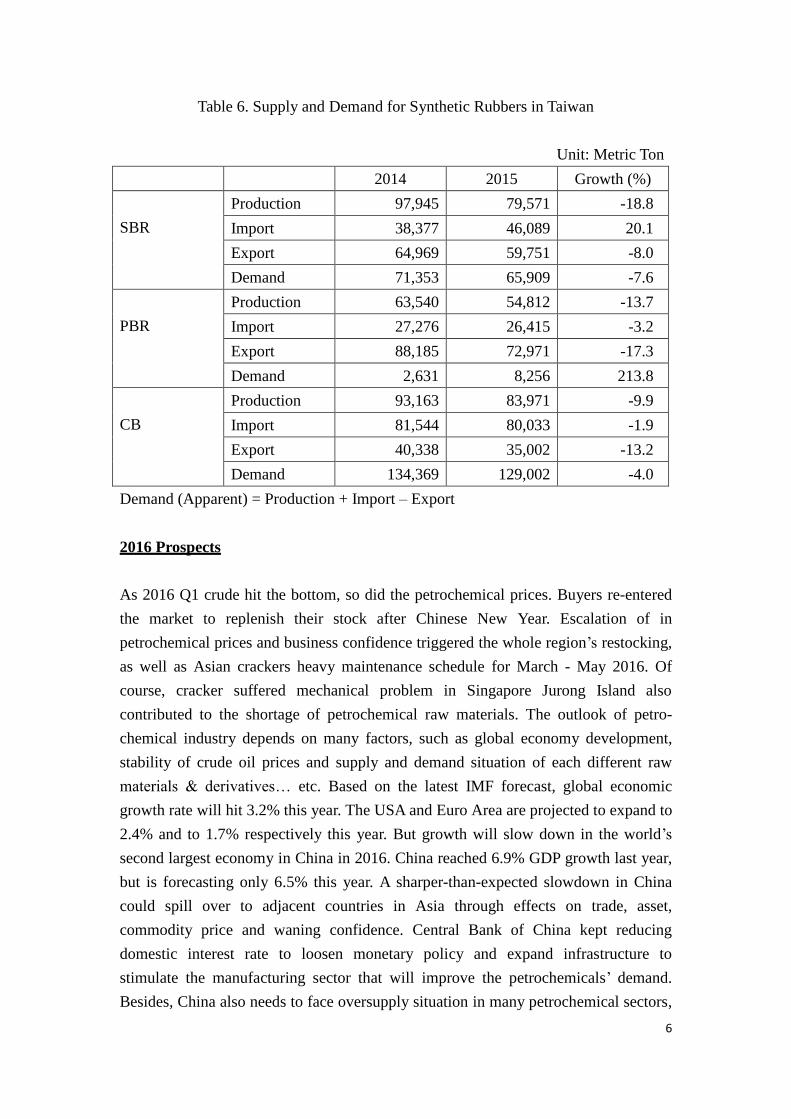
Synthetic Rubbers
Table 6 summarized supply & demand for synthetic rubbers in 2014/2015. In 2015,
production of the SBR amounted to 79,571 MT, down by 18.8% over the previous
year and production of the PBR decreased by 13.7% to 54,812 MT. Domestic demand
of SBR decreased by 7.6% and that of PBR expanded to a heavily extent of 213.8%
6
Table 6. Supply and Demand for Synthetic Rubbers in Taiwan
Unit: Metric Ton
2014 2015 Growth (%)
SBR
Production 97,945 79,571 -18.8
Import 38,377 46,089 20.1
Export 64,969 59,751 -8.0
Demand 71,353 65,909 -7.6
PBR
Production 63,540 54,812 -13.7
Import 27,276 26,415 -3.2
Export 88,185 72,971 -17.3
Demand 2,631 8,256 213.8
CB
Production 93,163 83,971 -9.9
Import 81,544 80,033 -1.9
Export 40,338 35,002 -13.2
Demand 134,369 129,002 -4.0
Demand (Apparent) = Production + Import – Export
2016 Prospects
As 2016 Q1 crude hit the bottom, so did the petrochemical prices. Buyers re-entered
the market to replenish their stock after Chinese New Year. Escalation of in
petrochemical prices and business confidence triggered the whole region’s restocking,
as well as Asian crackers heavy maintenance schedule for March - May 2016. Of
course, cracker suffered mechanical problem in Singapore Jurong Island also
contributed to the shortage of petrochemical raw materials. The outlook of petro-
chemical industry depends on many factors, such as global economy development,
stability of crude oil prices and supply and demand situation of each different raw
materials & derivatives… etc. Based on the latest IMF forecast, global economic
growth rate will hit 3.2% this year. The USA and Euro Area are projected to expand to
2.4% and to 1.7% respectively this year. But growth will slow down in the world’s
second largest economy in China in 2016. China reached 6.9% GDP growth last year,
but is forecasting only 6.5% this year. A sharper-than-expected slowdown in China
could spill over to adjacent countries in Asia through effects on trade, asset,
commodity price and waning confidence. Central Bank of China kept reducing
domestic interest rate to loosen monetary policy and expand infrastructure to
stimulate the manufacturing sector that will improve the petrochemicals’ demand.
Besides, China also needs to face oversupply situation in many petrochemical sectors,
7
after over build-up facilities in past few years. Thanks to low oil prices, Asian
petrochemical producers can enjoy feedstocks (naphtha & LPG) on the cheap and
diminish production cost, comparing with ME producers. However, we should keep
an eye on US shale gas development, as it will affect Asian petrochemical market in
the next two years. The US competitors will take advantage of their low cost ethane
feedstock and export ethylene derivatives to every corner of the world.
Conclusion
Emerging market and developing economies are now confronting a new reality of
lower growth, with cyclical and structural forces undermining the traditional growth
paradigm. India and parts of emerging Asia are bright spots, projected to grow at a
robust pace. However, crashing commodity price and waning confidence made
China’s government cut supply side from the 13th
five year plan and develop “One
belt, one Road“ strategy in order to export China’s production’s capacity from areas of
overproduction such as steel manufacturing.
2016 should be a better year for the petrochemical industry worldwide as a whole, as
oil price decreased and seemed to hit the bottom in Q1 this year. All petrochemical
producers in Asia will make profit due to low cost feedstock. Demand will grow in
line with a recovery in global GDP, especially in India. However, with China’s
setbacks in GDP growth this year, there’s no powerful engine to support a strong
upturn in Asia, therefore the pace of improvement might be moderate. With more &
more new derivatives capacity coming on stream, China will change its character
from a net petrochemicals importer to a net exporter in many different derivatives
( PTA、SBR、CPL…etc.).
The renaissance of the USA petrochemical industry (thanks to the shale gas) will
certainly globally reform this industry’s landscape. The competition of Asian
petrochemical producers in two years will be fierce under a surplus scenario
(especially PE). Diversified feedstock slates、 upgraded production facilities、integrated local utilities / logistics to minimize production cost and innovate high
performance / high value- added products, will be major factors to survive in the
next decade .

1
Taiwan, Republic of China
General Matters & Raw Materials Committee
1. Olefins (Ethylene, Propylene, Butadiene)
Ethylene
Unit: MT
Year 2012 2013 2014 2015 2016 (Est)
Supply
Production 3,478,448 3,925,325 4,182,340 4,228,848 4,200,000
Import 348,415 254,440 130,877 211,840 200,000
Total 3,826,863 4,179,765 4,313,217 4,440,688 4,400,000
Demand
Domestic 3,703,734 3,986,122 4,114,006 4,117,743 4,100,000
Export 123,129 193,643 199,211 322,945 300,000
Total 3,826,863 4,179,765 4,313,217 4,440,688 4,400,000
Year End
Capacity 3,820,000 4,420,000 4,005,000 4,005,000 4,005,000
2015 Review
International crude oil price declined gradually after reaching highs in June 2014,
while upstream petrochemical feedstock price decreased at the same time. It affected
buyers’ sentiment and the demand shrunk for intermediate materials and final
products. Year 2015 Taiwan’s petrochemicals output slid, due primarily to falling raw
material prices, although earnings performance was better than year 2014. The main
importing country, China, is currently carrying out industrial restructuring which
upgrades petrochemical industry supply chain and will threaten our domestic
petrochemical industry. But upstream feedstock naphtha and product pricing spreads
have widened improving petrochemical industry profits significantly.
Total production of ethylene last year in Taiwan was 4,228,848 MT, a growth of 1.1%
over the previous year. The slight increase was attributed to CPC and FPCC crackers
were running on high operational rate except turnaround schedule. The domestic
demand was 4,117,743 MT, almost the same as the previous year; But, export of
322,945 MT was a record historical high.
2016 Prospect
Asian crackers turnaround schedule has been heavier than last year and began in
March. Moreover Japan has closed a cracker in February. We can expect the supply to
be much tighter than last year and predict price increases. They also provide incentive
for crackers to maintain high operation rate and maximize the profits due to low
2
naphtha cost.
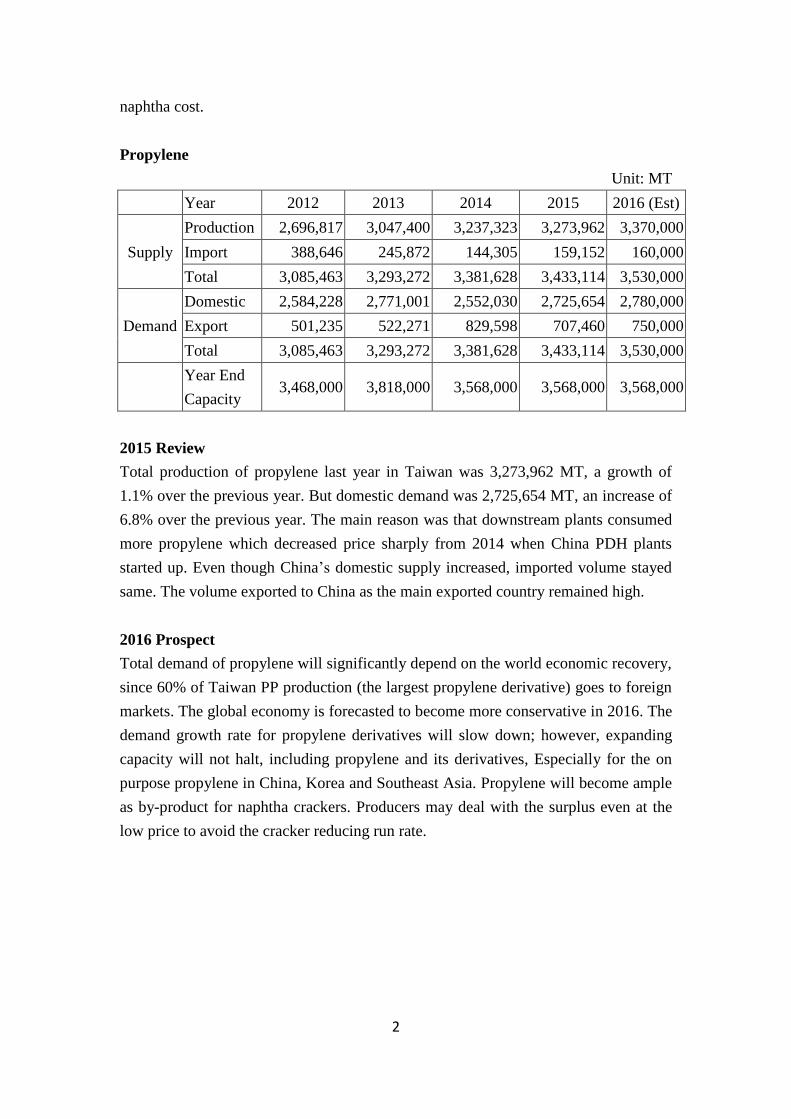
Propylene
Unit: MT
Year 2012 2013 2014 2015 2016 (Est)
Supply
Production 2,696,817 3,047,400 3,237,323 3,273,962 3,370,000
Import 388,646 245,872 144,305 159,152 160,000
Total 3,085,463 3,293,272 3,381,628 3,433,114 3,530,000
Demand
Domestic 2,584,228 2,771,001 2,552,030 2,725,654 2,780,000
Export 501,235 522,271 829,598 707,460 750,000
Total 3,085,463 3,293,272 3,381,628 3,433,114 3,530,000
Year End
Capacity 3,468,000 3,818,000 3,568,000 3,568,000 3,568,000
2015 Review
Total production of propylene last year in Taiwan was 3,273,962 MT, a growth of
1.1% over the previous year. But domestic demand was 2,725,654 MT, an increase of
6.8% over the previous year. The main reason was that downstream plants consumed
more propylene which decreased price sharply from 2014 when China PDH plants
started up. Even though China’s domestic supply increased, imported volume stayed
same. The volume exported to China as the main exported country remained high.
2016 Prospect
Total demand of propylene will significantly depend on the world economic recovery,
since 60% of Taiwan PP production (the largest propylene derivative) goes to foreign
markets. The global economy is forecasted to become more conservative in 2016. The
demand growth rate for propylene derivatives will slow down; however, expanding
capacity will not halt, including propylene and its derivatives, Especially for the on
purpose propylene in China, Korea and Southeast Asia. Propylene will become ample
as by-product for naphtha crackers. Producers may deal with the surplus even at the
low price to avoid the cracker reducing run rate.

3
Butadiene
Unit: MT
Year 2012 2013 2014 2015 2016 (Est)
Supply
Production 481,880 545,953 585,097 583,470 569,000
Import 165,642 128,426 127,705 107,252 120,000
Total 647,522 674,379 712,802 690,722 689,000
Demand
Domestic 561,139 582,154 605,015 589,813 584,000
Export 86,383 92,225 107,787 100,909 105,000
Total 647,522 674,379 712,802 690,722 689,000
Year End
Capacity 580,000 670,000 600,000 600,000 600,000
2015 Review
In recent years, butadiene price has changed drastically, leading to very poor supply
and demand balance in 2015, domestic demand was 589,813 MT decreased 2.5% over
the previous year. The stagnant butadiene consumption reflected from the negative
growth rate of major butadiene derivatives, such as SBR and BR. Major Taiwanese
butadiene derivatives producers have relocated their plants to China. This will cause
an impact to Taiwan butadiene producers.
4
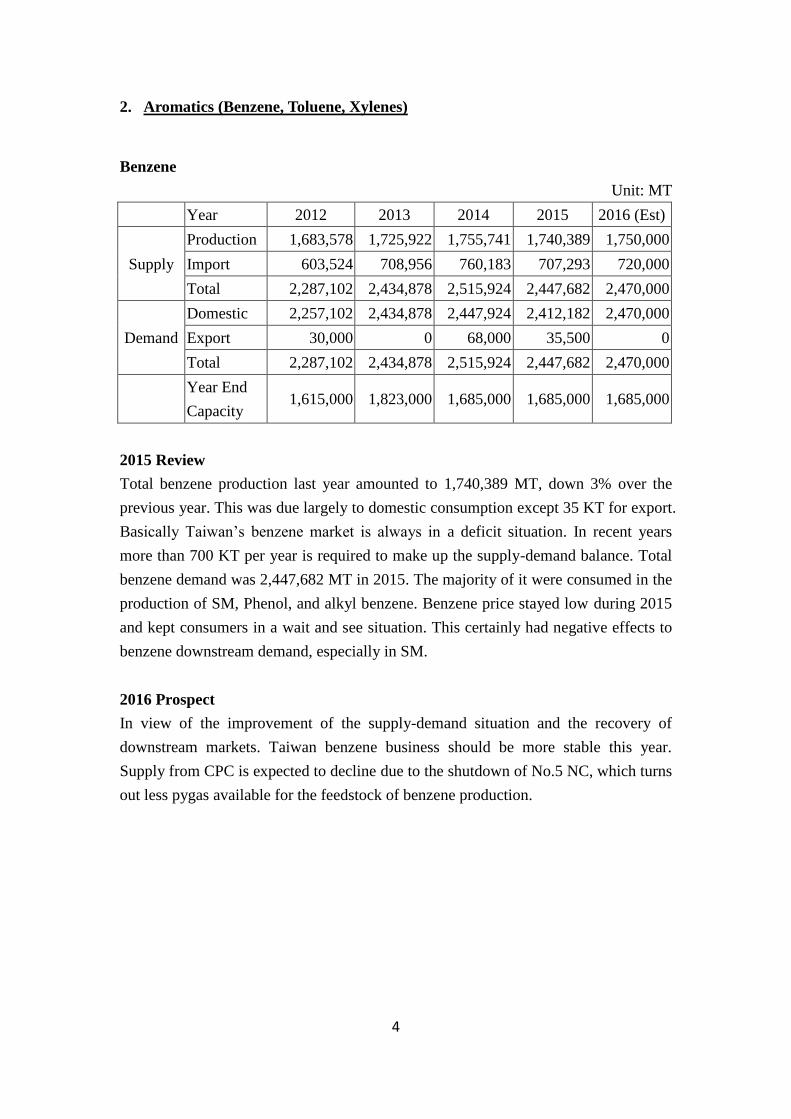
2. Aromatics (Benzene, Toluene, Xylenes)
Benzene
Unit: MT
Year 2012 2013 2014 2015 2016 (Est)
Supply
Production 1,683,578 1,725,922 1,755,741 1,740,389 1,750,000
Import 603,524 708,956 760,183 707,293 720,000
Total 2,287,102 2,434,878 2,515,924 2,447,682 2,470,000
Demand
Domestic 2,257,102 2,434,878 2,447,924 2,412,182 2,470,000
Export 30,000 0 68,000 35,500 0
Total 2,287,102 2,434,878 2,515,924 2,447,682 2,470,000
Year End
Capacity 1,615,000 1,823,000 1,685,000 1,685,000 1,685,000
2015 Review
Total benzene production last year amounted to 1,740,389 MT, down 3% over the
previous year. This was due largely to domestic consumption except 35 KT for export.
Basically Taiwan’s benzene market is always in a deficit situation. In recent years
more than 700 KT per year is required to make up the supply-demand balance. Total
benzene demand was 2,447,682 MT in 2015. The majority of it were consumed in the
production of SM, Phenol, and alkyl benzene. Benzene price stayed low during 2015
and kept consumers in a wait and see situation. This certainly had negative effects to
benzene downstream demand, especially in SM.
2016 Prospect
In view of the improvement of the supply-demand situation and the recovery of
downstream markets. Taiwan benzene business should be more stable this year.
Supply from CPC is expected to decline due to the shutdown of No.5 NC, which turns
out less pygas available for the feedstock of benzene production.
5
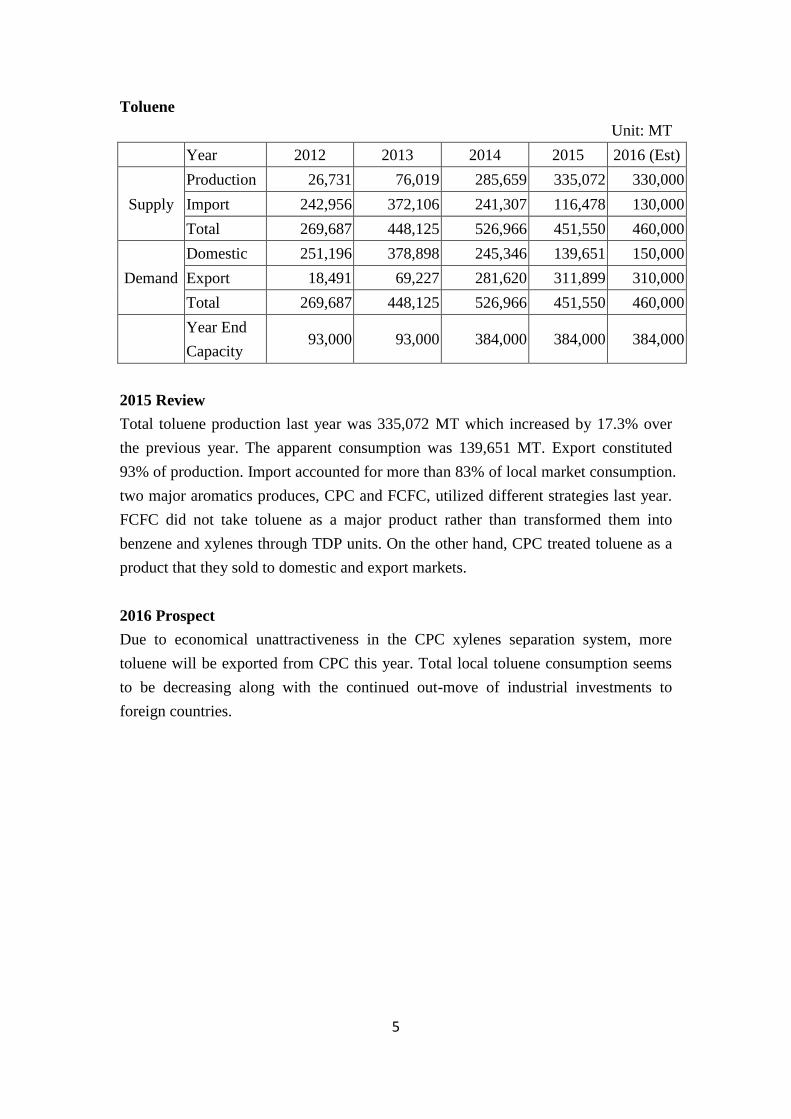
Toluene
Unit: MT
Year 2012 2013 2014 2015 2016 (Est)
Supply
Production 26,731 76,019 285,659 335,072 330,000
Import 242,956 372,106 241,307 116,478 130,000
Total 269,687 448,125 526,966 451,550 460,000
Demand
Domestic 251,196 378,898 245,346 139,651 150,000
Export 18,491 69,227 281,620 311,899 310,000
Total 269,687 448,125 526,966 451,550 460,000
Year End
Capacity 93,000 93,000 384,000 384,000 384,000
2015 Review
Total toluene production last year was 335,072 MT which increased by 17.3% over
the previous year. The apparent consumption was 139,651 MT. Export constituted
93% of production. Import accounted for more than 83% of local market consumption.
two major aromatics produces, CPC and FCFC, utilized different strategies last year.
FCFC did not take toluene as a major product rather than transformed them into
benzene and xylenes through TDP units. On the other hand, CPC treated toluene as a
product that they sold to domestic and export markets.
2016 Prospect
Due to economical unattractiveness in the CPC xylenes separation system, more
toluene will be exported from CPC this year. Total local toluene consumption seems
to be decreasing along with the continued out-move of industrial investments to
foreign countries.

6
Xylenes
Unit: MT
Year 2012 2013 2014 2015 2016 (Est)
Supply
Production 2,594,550 2,477,974 2,152,770 2,161,574 2,520,000
Import 1,357,938 1,329,369 1,127,447 1,149,759 1,200,000
Total 3,952,488 3,807,343 3,280,217 3,311,333 3,720,000
Demand
Domestic 3,113,525 2,063,643 1,790,050 1,891,576 2,270,000
Export 838,963 1,743,700 1,490,167 1,419,757 1,450,000
Total 3,952,488 3,807,343 3,280,217 3,311,333 3,720,000
Year End
Capacity 3,002,000 3,180,000 3,180,000 3,180,000 3,180,000
2015 Review
Total Xylenes production last year was 2,161,574 MT which improved from the low
of 2014. Total domestic consumption was 1,891,576MT which also bottomed from
2014. Para-xylene accounted for the vast majority of xylenes output. However;
booming new PTA capacities in China plus differential import tax to China from
ASEAN countries made Taiwan PTA producers to slash PTA units’ utilization.
2016 Prospect
Taiwan PTA industry has been in a difficult situation due to overcapacity. Profits
have been eroded seriously and some producers have idled their facilities indefinitely.
Under such circumstance, xylenes price will keep up with oil and gasoline seasonal
demands.

Taiwan, Republic of China
Polyolefin Committee
LD/LLD/EVA
Unit: 1,000MT
LDPE/LLDPE/EVA 2013 2014 2015 Change 2016 (Est.) Change
Production 588 576 611 6.1% 662 8.3%
Imports 271 291 292 0.3% 294 0.7%
Exports 464 416 475 14.2% 516 8.6%
Demand 395 450 428 - 4.9% 440 2.8%
Capacity 794 794 794 - 884 -
Operating Rate 74.1% 72.5% 77.0% - 74.9% -
2015 Review
1. Three producers in Taiwan
Formosa Plastics Corp. LLDPE 264kt
EVA/LDPE 240kt
USI Corp. LLDPE 40kt
EVA/LDPE 140kt
Asia Polymer Corp. EVA/LDPE 110kt
Total capacity 794kt
2. In 2015, total production was 611kt which increased by 6.1% over 2014. The operating rate was
77%, which was better than in 2014.
3. Exports was 475kt, which increased by 14.2% over 2014¸ but domestic demand decreased by 4.9%.
4. Due to the oil fell to a very low level, the margins of LD/LL were better than in 2014. Taiwan’s
producers raised operating rate in 2015.
2016 Outlook
1. Two new production lines are scheduled to be start-up in Q2, each with the capacity of
45,000MT/year in terms of EVA products.
2. The demand of EVA for photovoltaic will be increasing in Taiwan, due to the government’s new
solar power project. The production and export expect to increase, due to additional capacity of EVA,
but the operating rate may be reduced.

HDPE
Unit: 1,000MT
HDPE 2013 2014 2015 Change 2016 (Est.) Change
Production 560.0 524.6 586.0 11.7% 594 1.4%
Imports 76.9 78.3 68.9 -12.0% 70 1.6%
Exports 329.0 303.4 331.1 9.1% 339 2.4%
Demand 307.9 299.5 323.8 8.1% 325 0.4%
Capacity 630.0 630.0 630.0 - 630 -
Operating Rate 88.9% 83.3 93.0% 9.7% 94.3% 1.3%
2015 Review
1. Two producers in Taiwan
Formosa Plastics Corp. 530kt
USI Corp. 100kt
Total capacity 630kt
2. Total production was 586kt, which increased by 11.7% over 2014.
3. Domestic demand was 324kt which increased by 8.1% and exports increased by 9.1% over 2014.
4. Operating rate raised to 93.0% from 83.3% in 2015, because the margins of HDPE were better than
in 2014.
2016 Outlook
1. No new projects or additional capacity for HDPE in Taiwan.
2. Although economic growth slowed in Asia, the current oil price is still low. HDPE will be kept at
stable level. Taiwan producers will keep high operating rate in 2016.
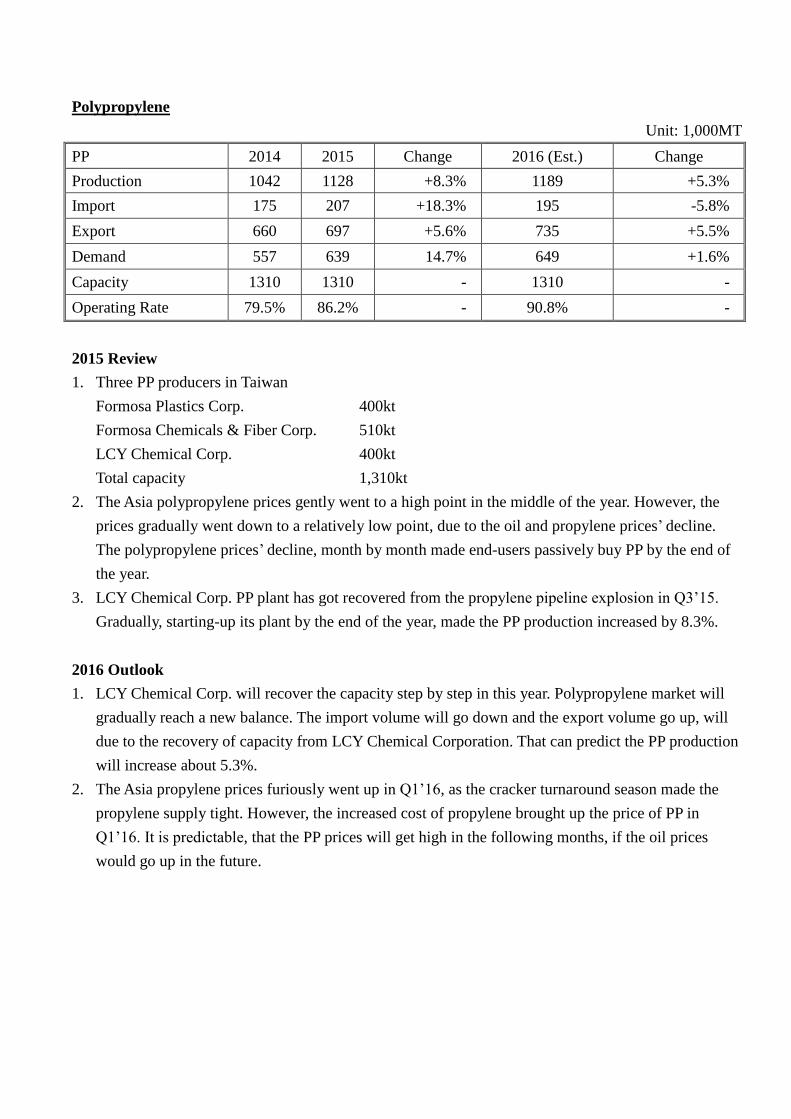
Polypropylene
Unit: 1,000MT
PP 2014 2015 Change 2016 (Est.) Change
Production 1042 1128 +8.3% 1189 +5.3%
Import 175 207 +18.3% 195 -5.8%
Export 660 697 +5.6% 735 +5.5%
Demand 557 639 14.7% 649 +1.6%
Capacity 1310 1310 - 1310 -
Operating Rate 79.5% 86.2% - 90.8% -
2015 Review
1. Three PP producers in Taiwan
Formosa Plastics Corp. 400kt
Formosa Chemicals & Fiber Corp. 510kt
LCY Chemical Corp. 400kt
Total capacity 1,310kt
2. The Asia polypropylene prices gently went to a high point in the middle of the year. However, the
prices gradually went down to a relatively low point, due to the oil and propylene prices’ decline.
The polypropylene prices’ decline, month by month made end-users passively buy PP by the end of
the year.
3. LCY Chemical Corp. PP plant has got recovered from the propylene pipeline explosion in Q3’15.
Gradually, starting-up its plant by the end of the year, made the PP production increased by 8.3%.
2016 Outlook
1. LCY Chemical Corp. will recover the capacity step by step in this year. Polypropylene market will
gradually reach a new balance. The import volume will go down and the export volume go up, will
due to the recovery of capacity from LCY Chemical Corporation. That can predict the PP production
will increase about 5.3%.
2. The Asia propylene prices furiously went up in Q1’16, as the cracker turnaround season made the
propylene supply tight. However, the increased cost of propylene brought up the price of PP in
Q1’16. It is predictable, that the PP prices will get high in the following months, if the oil prices
would go up in the future.
1
Taiwan, Republic of China
PVC Committee
1. Market review of PVC in 2015
In 2015 PVC production was 1,608 KMT in Taiwan, accounting for 91.1% of operating rate and
6.1% of annual increase, due to crude oil and ethylene price was much lower than in 2014.
PVC demand in 2015 amounted 522 KMT, with a decrease of 0.5% from previous year, because
of less competitive PVC finished goods from China.
In 2015, PVC exported 1,114 KMT with an increase of 14.2% due to lower price of crude oil and
ethylene, that caused competitive ethylene-based PVC.
Taiwan imported 27 KMT PVC in 2015.
2. Market review of VCM in 2015
In 2015 VCM production was 1,949 KMT in Taiwan, accounting for 6.9% of annual increase
which was caused by good ethylene based PVC competition.
2015 VCM demand was 1,607 KMT, with 5.1% of annual increase.
2015 VCM export was recorded at 407 KMT and the major volume was shipped to FPC’s Ninbo
plant.
Taiwan imported 51 KMT VCM in 2015.
2. Prospects for 2016
Following the past year, China is suffering in sluggish economic growth continuously in the meantime,
Europe, Japan and most of developing countries are facing the pressure of deflation, that contributed to the
slowdown of global PVC demand growth. As a result, global PVC is still kept in a serious surplus situation,
especially in China and USA.
However, the price of crude oil has plunged, due to the global oversupply and is now floating at US$40/bbl.,
even though Asian ethylene price is still standing in apparent high level, resulted from shortage of supply
and largely collective turn around. It will probably remain till the expansion commencement of Olefin in
USA and China.
Other than that, the comparative cost of PVC materials – natural gas ethylene, carbide acetylene and naphtha
ethylene – carbide acetylene PVC is increasing, due to expansive lower mercury contained catalyst
conversion, strict environmental protection issue and rising domestic logistics cost. Asian naphtha ethylene
PVC shall keep in high level, caused by high cost of ethylene.
Yet, the over-capacity of PVC in Asia, especially in China, is still in a critical condition and it’ll take at least
another two years to be consumed. Sources said, about 1.2million tone of carbide PVC plants in China had
shut down in 2015, due to harsh competition and trust, that will keep going in the next year.
As for the future Asian PVC market, the new developing countries, including India, south east Asia and so

2
on, are striving to prosper their economy, the demands of PVC for infrastructures are huge, which is
considered as a main power of PVC growth. In this vision, accompanied by a relatively low crude oil price
and phase out the high cost capacity in China, we can expect a rather optimistic and healthy PVC market in
the near future.
Table 1. Nameplate Capacity of PVC in Taiwan
Unit:KMT/YR
Producer Location 2009 2010 2011 2012 2013 2014 2015
FPC
Kaohsiung 40 40 40 40 40 40 --
Jenwu 580 580 580 580 580 580 580
Linyuan 187 187 187 187 187 187 187
Mailiao 494 494 494 494 494 494 498
Total 1,301 1,301 1,301 1,301 1,301 1,301 1,265
CGPC
CGPPC
Toufen 180 180 180 180 180 180 180
Linyuan -- -- 170 170 170 170 170
Total 180 180 350 350 350 350 350
OPC Taoyuan 150 150 150 150 150 150 150
Grand Total 1,631 1,631 1,631 1,801 1,801 1,801 1,765
Table 2. PVC Supply/Demand in Taiwan
Unit:MT/YR
Year Production (1) Import (2) Export (3) Demand (1) + (2) - (3)
MT Growth MT MT MT Growth
2009 1,415,914 2.1% 22,964 910,239 528,639 -11.6%
2010 1,432,356 1.2% 29,100 830,357 631,099 19.4%
2011 1,410,642 -1.5% 24,345 854,056 580,931 -8.0%
2012 1,510,378 7.1% 20,199 988,555 542,022 -6.7%
2013 1,621,111 7.3% 22,522 1,068,876 574,757 6.0%
2014 1,514,893 -6.6% 26,643 975,206 566,330 -1.5%
2015 1,608,264 6.2% 27,265 1115,057 520,472 -8.1%
3
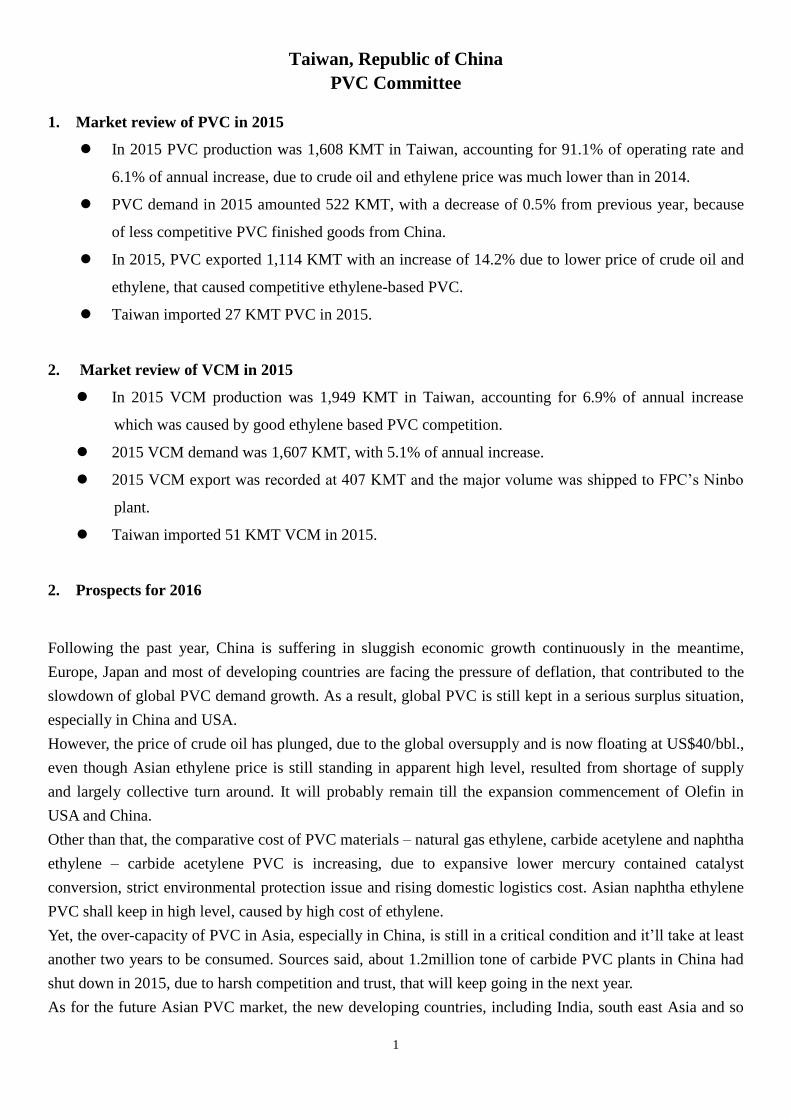
Table 3. Nameplate Capacity of VCM in Taiwan
Unit:KMT/YR
Producer Location 2009 2010 2011 2012 2013 2014 2015
FPC
Jenwu 540 540 540 540 540 540 *584
Linyuan 240 240 240 240 240 240 *260
Mailiao 800 800 800 800 800 800 800
Total 1,580 1,580 1,580 1,580 1,580 1,580 1,644
TVCMC Linyuan 300 300 385 385 400 420 420
Grand Total 1,820 1,880 1,880 1,965 1,965 2,000 2,064
Improve the EDC cracker fuel system
Table 4. VCM Supply/Demand in Taiwan
Unit:MT/YR
Year Production Net Export Demand
MT Growth MT MT Growth
2009 1,772,586 8.6% 340,619 1,431,967 3.8%
2010 1,758,189 -0.8% 343,790 1,414,399 -1.2%
2011 1,684,720 -4.2% 274,714 1,410,006 -0.3%
2012 1,817,398 7.9% 305,059 1,512,339 7.3%
2013 1,900,197 4.6% 266,142 1,634,055 8.0%
2014 1,822,013 -4.1% 292,635 1,529,378 -6.4%
2015 1,948,576 7.0% 356,737 1,591,839 4.1%
Taiwan, Republic of China
Styrenics Committee
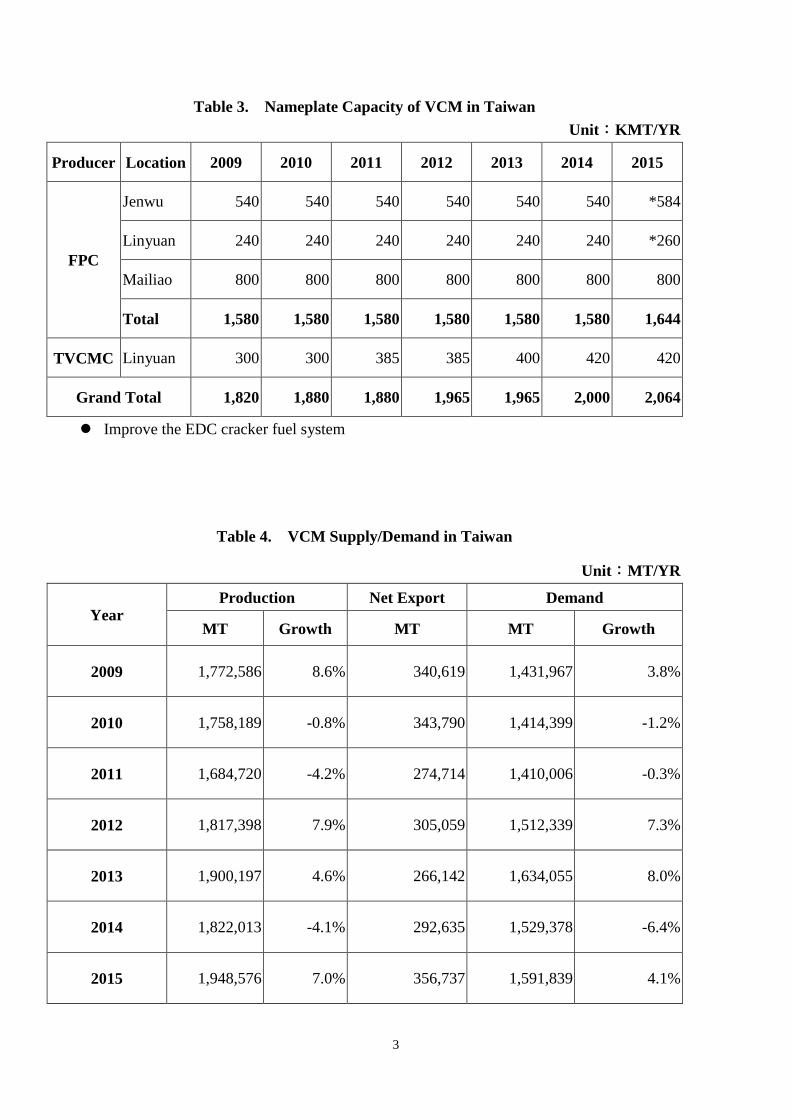
STYRENE
Unit: MT
Year 2013 2014 2015 2016 (Est)
Supply
Production 2,044,325 1,974,323 2,020,355 2050,660
Import 393,855 384,808 335,965 341,004
Total 2,438,180 2,359,131 2,356,320 2,391,664
Demand
Domestic 1,924,233 1,794,666 1,863,540 1,874,245
Export 513,947 564,465 492,780 517,419
Total 2,438,180 2,359,131 2,356,320 2,391,664
Year End Capacity 1,910,000 2,030,000 2,030,000 2,030,000
2015 Market Review
1) The export volume of SM was 492KT. The total import volume was less than the in 2014,
the supply/demand balance was still net short in Taiwan.
2) The first half of the year 2015, LG Chemical, Lotte chemical, Samsung Total PC, YNCC,
NIHON Oxirane et al. was a turnaround. The second half of the year, the crude oil and
Chinese stock market was under shock and other external environment, the Asian styrene
market was weak.
3) The oil prices continue to add uncertainly and volatility to styrene price in 2015, but the
crude oil price began to move back towards a more sustainable level than in 2014. The
current oil prices are the result of several large suppliers fighting for market shares.
2016 Outlook
1) Demand growth is inevitably concentrated in China throughout the forecast years.
However, some things’ growth is also expected in Taiwan, mainly into ABS for export.
Forecast annual growth rates in Northeast Asia are expected to be slower at around 1.5%.
2) A combination of feedstock, low oil price, technical, economic, logistical and
commercial factors will causes the supply’s increase, the forecast is predicted 1.5%
increase in comparison with last year.
3) In spite of these predicted higher oil prices, we also see a global economy, which will
continue to improve and do better than most forecasts currently suggest, although some
of the sheen has recently came off the Chinese economy miraculously. It is still growing
at an impressive clip and this is combined with better the expected performance.

Polystyrene
Unit: MT
Year 2013 2014 2015 2016 (Est)
Production 828,031 775,105 797,198 837,058
Import 8,508 7,743 4,084 4,900
Export 760,927 723,916 764,784 780,079
Domestic Demand 75,612 58,932 36,498 61,879
Export Comparison
Unit: MT
Year 2014 2015 Change of 2015
Hong Kong 63,618 64120 502
China 229,041 223,136 -5,905
Other 431,281 477,526 46,245
Total 723,940 764,782 40,842
2015 Market Review
1) Total export volume increased by 5.6% or 40.8 KT, resulting from demand increase from
outside of China’s and HK market, for which export volume increased by 10.7% in
comparison with last year. HK and China’s markets occupied 37.5% of total PS export
volume of Taiwan. The other areas like USA or South East Asian demand increased in
comparison with last year.
2) In 2015, the crude oil prices have continued to move lower, PS market in China also
continued to decline.
2016 Outlook
1) PS market in China forecasted to keep declining in 2016 because of the slowdown of its
GDP growth and self-sufficiency in all things. PS production in Taiwan is forecasted for
little increase comparing with the year 2015 because the raw materials would be cheaper
and economy will recover.
2) PS manufactures in Taiwan keep making their effort to cautiously expand export markets
in developing countries, particularly in the Middle East, outside of the HK and China’s
area.

ABS
Year 2013 2014 2015 2016 (Est)
Production 1,210,159 1,201,685 1,225,677 1,227,677
Import 10,231 13,167 12,408 11,231
Export 1,095,372 1,046,874 1,060,626 1,061,626
Domestic Demand 125,018 167,978 177,459 177,282
Export Comparison
Year 2014 2015 Change of 2015
Hong Kong 296,445 287,072 -9,373
China 523,932 528,066 4,134
Other 226,506 245,488 18,982
Total 1,046,883 1,062,642 15,758
2015 Market Review
1) ABS export volume from Taiwan increased by 1.3% or 13.7KT in comparison with 2014
nearly the same.
2) China's economic growth rate slowed to a 25-year low of 6.9% in 2015, as the world's
second-largest economy continues to shift away from its manufacturing roots.
2016 Outlook
1) GDP of China is forecasted by 6.8% this year. While there is an evidence that the old
growth engine, powered by manufacturing, investment and exports, has started to stutter,
we find far fewer indicators that point to a pickup in consumption.
2) Over the next years, operating rate percentages are expected to improve to over 80% as
global demand will improve and the excessive capacity will be absorbed based upon the
lower oil price.
3) Domestic ABS demand in Taiwan in 2016 is forecasted the same as 2015.

1
Taiwan, Republic of China
Synthetic Fiber Raw Material Committee
Production and Trade of Major Synthetic Fiber Raw Materials
Unit: MT
2012 2013 2014 2015 2016
(Est)
2014/2015
increase
(+%) or
Decrease
(-%)
2015/2016
increase
(+%) or
Decrease
(-%)
AN
Production 443,105 458,211 464,511 469,764 465,000 1.1% -1.0%
Import 107,432 97,820 110,180 97,440 100,000 -11.6% 2.6%
Export 155,337 175,752 184,852 192,307 185,000 4.0% -3.8%
Domestic
Demand 395,200 380,279 389,840 374,927 380,000 -3.8% 5.4%
CPL
Production 288,256 272,700 227,200 233,100 301,000 2.6% 29.1%
Import 390,116 444,515 442,950 404,649 340,000 -8.7% -16.0%
Export 7,452 8,704 0 0 0 N/A N/A
Domestic
Demand 670,920 708,511 670,150 637,749 641,000 -4.9% 0.5%
EG
Production 1,944,305 2,112,419 2,298,600 2,348,696 2,400,000 2.2% 2.2%
Import 273,159 311,130 204,556 168,349 250,000 -17.7% 48.5%
Export 1,237,193 1,323,431 1,482,794 1,413,509 1,500,000 -4.7% 6.1%
Domestic
Demand 980,271 1,100,118 1,020,362 1,103,536 1,150,000 8.2% 4.2%
PTA
Production 4,388,262 2,929,805 2,596,260 2,626,500 2,700,000 1.2% 2.8%
Import 2,543 21 0 0 0 N/A N/A
Export 1,938,284 497,718 208,724 154,498 150,000 -26.0% -2.9%
Domestic
Demand 2,452,521 2,432,108 2,387,536 2,472,002 2,550,000 3.5% 3.2%
Total
Production 7,063,928 5,773,135 5,586,571 5,678,090 5,866,000 1.6% 3.3%
Import 773,250 853,486 757,687 670,438 690,000 -11.5% 2.9%
Export 3,338,266 2,005,605 1,876,370 1,760,314 1,835,000 -6.2% 4.2%
Domestic
Demand 4,798,912 4,621,016 4,467,888 4,588,214 4,721,000 2.7% 2.9%

2
Supply & Demand of AN
Unit: MT
2011 2012 2013 2014 2015 2016 (Est)
Supply
Production 416,262 443,105 458,211 464,511 469,794 465,000
Import 107,834 107,432 97,820 110,181 97,440 100,000
Total 524,096 550,537 556,031 574,692 567,234 565,000
Demand
Domestic 410,658 395,200 380,279 389,840 374,927 380,000
Direct Export 113,438 155,337 175,752 184,852 192,307 185,000
Total 524,096 550,537 556,031 574,692 567,234 565,000
Capacity
(as of the end of
each year)
495,000 520,000 520,000 520,000 520,000 520,000
Review of 2015
In 2015, the demand side from varied fields of ABS was as follow: AF remained "roll-over", while NBR
posed a strong demand. ABS was with a slight growth; AF was with a slight shrink; NBR was kept stable
as usual for the medical use. The price trend differed totally, compared with the previous few years,
mainly for the fluctuating crude oil price. Since the crude oil price trend kept downward for the whole
year in 2015, all the related raw material prices posed the same downward trend. Further, 2 new capacities
in China joined AN market during 2015, making AN S/D unbalanced and leading to the AN profit
shrinking much. Besides, Chinese authority made a protective policy for domestic AN industry from
2015, severely reducing the import volume in China and posing a big threat to Asian AN producers.
Overall, for the demand with a slight growth or even roll- over and new capacity joined market, the profit
and operation performance was weaker than in 2014.
Prospect for 2016
In 2016, the economic development in China will slow down, since Chinese government now has to
adjust its economic structure. "Stableness and de-capacity, de-leverage, de-inventory" seems to be highest
principle. In 2016, as Chi-Mei, the biggest ABS plant in the world, estimates ABS global growth rate will
only be 2%, with a conservative viewpoint. As for the AF business, Tonghua is facing challenges from
Chinese and Thailand’s AF producers. NBR still seems to be strong in 2016, for the medical use. Overall,
it is believed that the demand for 2016 will rollover or a bit grow, compared with 2015. However, 1 new
capacity joined AN market from the beginning in 2016, making Chinese AN S/D really in the status of
"over-supply" and posing a bigger threat to Asian AN producers. Overall, we expect a worse performance
for Asian producers on profit and operation.
3
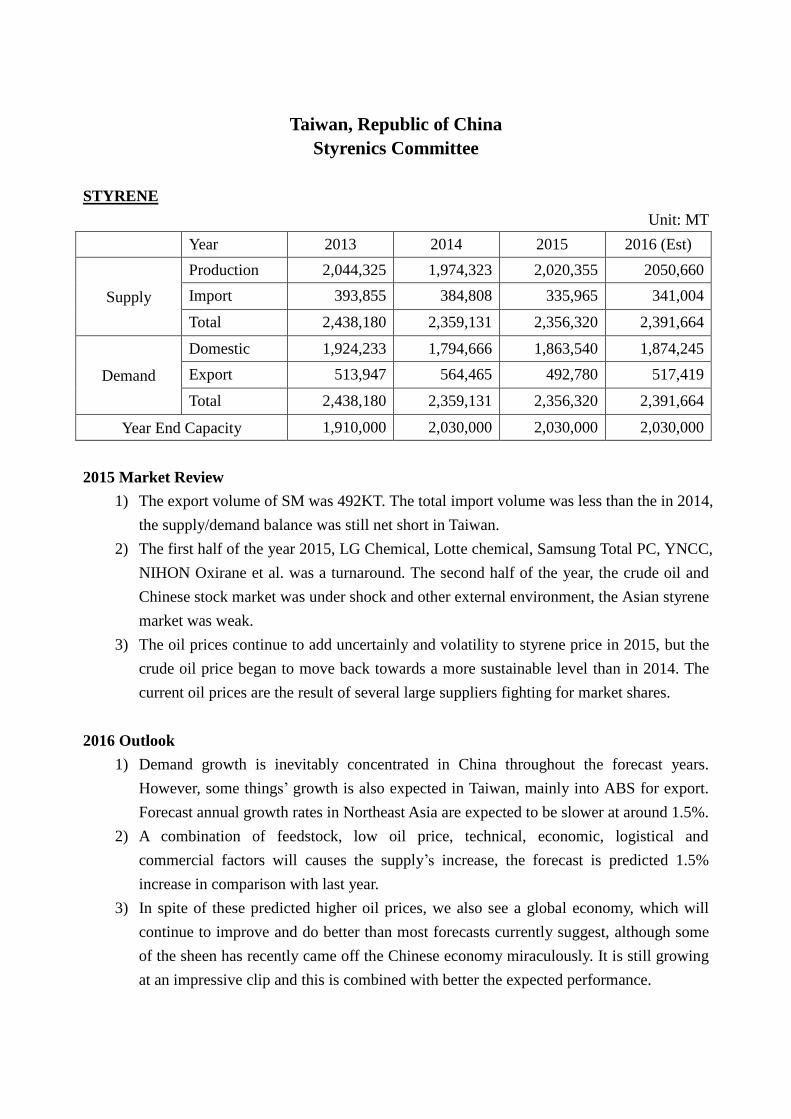
Supply & Demand of CPL
2011 2012 2013 2014 2015 2016 (Est)
Supply
Production 271,215 288,256 272,700 227,200 233,100 301,000
Import 410,634 390,116 444,515 442,950 404,649 340,000
Total 681,849 678,372 717,215 670,150 637,749 641,000
Demand
Domestic 681,480 670,920 708,511 670,149 637,749 641,000
Direct Export 369 7,452 8,704 0 0 0
Total 681,849 678,372 717,215 670,150 637,749 641,000
Capacity
(as of the end of
each year)
300,000 300,000 400,000 400,000 400,000 400,000
Review of 2015
CPL capacity increased smoothly, around 300 KMTA in Asia and total capacity reached 3,700 KMTA
level. Demand in Taiwan was stable in 1H, 2015, but uncertain crude oil and China’s economy impacted
demand for nylon chain in 2H, 2015. Total CPL demand in Taiwan was 637 KMT, decreased of 32 KMT
in 2015. Production volume for local CPL producer, CPDC, was 233 KMT, increased of 6 KMT, but
import column was 404 KMT, decreased of 38 KMT in 2015.
PA6 demand was stable in Taiwan’s Domestic market, but export volume was squeezed, around 330
KMTA and 30 KMTA less in 2015. China’s new PA6 capacity kept to replace import cargo and this issue
will continue in the future.
Prospect for 2016
Raw material price will increase gradually, due to the lower base of crude oil in the beginning of 2016.
New CPL capacities will still be on stream in China, but not on schedule. 400 KMTA capacities will start
to operate in market view and will be less than new coming PA6 capacities. CPL producers will still
suffer and try to get reasonable margin by self-controlled production in 2016. PA6 producers will face a
challenge for less profit, due to the oversupply in Asia, especially in China and Taiwan. Growth of nylon
downstream will be over 6%, but still will not catch up the growth of upstream. Uncertain China’s
economic situation will still be an issue, which will impact supply and demand in Asia.

4
Supply & Demand of EG
2011 2012 2013 2014 2015 2016 (Est)
Supply
Production 1,993,615 1,944,305 2,112,419 2,298,600 2,348,696 2,400,000
Import 278,893 273,159 311,130 204,556 168,349 250,000
Total 2,272,508 2,217,464 2,423,549 2,503,156 2,517,045 2,650,000
Demand
Domestic 1,038,400 980,271 1,100,118 1,020,362 1,103,536 1,150,000
Direct Export 1,234,108 1,237,193 1,323,431 1,482,794 1,413,509 1,500,000
Total 2,272,508 2,217,464 2,423,549 2,503,156 2,517,045 2,650,000
Capacity
(as of the end of
each year)
2,380,000 2,380,000 2,380,000 2,380,000 2,580,000 2,630,000
Review of 2015
In 2015, domestic production increased by 2.2% to 2,348KT and demand also went up by 8.2% to 1,103KT.
MEG price was steadily improved with crude oil bounced and recovery of polyester demand in the first 5
months. However, since June, the series global economic issues, including Greek debt crisis, Iran's sanctions
lift and global stock market crash, have impacted the market’s demand.
Meanwhile, the expensive ethylene raw materials eroded margins of ethylene glycol manufacturers in that
period.
Prospect for 2016
The current price of Brent oil has recovered to $40 from the 13 years’ historic lows, but continued worry in
particularly Chinese economy have pressured all commodity.
MEG demand is expected to increase in the second quarter due to the traditional turnaround period and PET
consuming peak season.
Domestic polyester market is expected to consume around 1.1-1.2 MMT as that of 2015.

5
Supply & Demand of PTA
2011 2012 2013 2014 2015 2016 (Est)
Supply
Production 5,302,900 4,388,262 2,929,805 2,596,260 2,626,500 2,700,000
Import 1,008 2,543 21 0 0 0
Total
5,303,908 4,390,805 2,929,826 2,596,260 2,626,500 2,700,000
Demand
Domestic
2,342,925 2,452,521 2,432,108 2,387,536 2,472,002 2,550,000
Direct
Export 2,960,983 1,938,284 497,718 208,724 154,498 150,000
Total
5,303,908 4,390,805 2,929,826 2,596,260 2,626,500 2,700,000
Capacity
(as of the end of
each year)
5,470,000
5,470,000 5,220,000 3,900,000 3,250,000 3,250,000
Review of 2015
In 2015, one domestic PTA facility has been shut down and left the market, the total capacity decreased to
3.3MMT as the major market is still oversupplied.
The squeezed spread showed below $100/MT. Domestic production has slightly increased of 1.2% YoY.
Prospect for 2016
Although some Asian PTA makers were out of the market in the past few years, the critically competitive
conditions still need more time to return to the balance.
Comparing to 2015, the domestic demand and production are expected to increase by 2-3% at the same
period in 2016.


![PRODUCT-SPECIFIC SAFEGUARD IN CHINA’S WTO …...GATT “[i]n the confusion” brought about by the abrupt move from the mainland to Taiwan.8 This withdrawal by the ROC (or Taiwan)](https://static.fdocuments.in/doc/165x107/5fce0e1d01d9110392754b6f/product-specific-safeguard-in-chinaas-wto-gatt-aoein-the-confusiona-brought.jpg)