The Peking University Digital Financial Inclusion Index of ...
72
① This project is supported by the Major Program of National Social Science Foundation of China "Innovation, Risk and Regulation of Digital Financial Inclusion " (No. 18ZDA091). And this index series is a product of a collaboration between the Institute of Digital Finance at the Peking University and the Ant Financial Services Group. The research team gratefully acknowledges the guidance and assistance provided by many colleagues at both organizations. The Peking University Digital Financial Inclusion Index of China (2011-2018) ① Institute of Digital Finance, Peking University Project advisors: HUANG Yiping Director of IDF, Peking University LIANG Shidong Vice President of Ant Financial Services Group Members of the research team: Stage II, 2016-2018 GUO Feng, WANG Jingyi, CHENG Zhiyun, LI Yongguo, WANG Fang, WEI Aiyong Stage I, 2011-2015 GUO Feng, KONG Tao, WANG Jingyi, ZHANG Xun, CHENG Zhiyun, RUAN Fangyuan, SUN Tao, WANG Fang Technical support CHEN Qianjin, FU Zhibin, HU Xi, LI Huan, LI Zhenhua, LIU Peng, LIU Xiaohui, RUAN Fangyuan, WANG Peng, YUAN Shengxiong, ZHANG Li, ZHOU Weilin, ZHENG Ming April 2019
Transcript of The Peking University Digital Financial Inclusion Index of ...
The PKU-DFIIC (2011-2018)
http://idf.pku.edu.cn April 2019i
① This project is supported by the Major Program of National Social Science Foundation of China "Innovation, Risk and Regulation of Digital Financial Inclusion " (No. 18ZDA091). And this index series is a product of a collaboration between the Institute of Digital Finance at the Peking University and the Ant Financial Services Group. The research team gratefully acknowledges the guidance and assistance provided by many colleagues at both organizations.
The Peking University Digital Financial Inclusion Index of China
(2011-2018)①
Institute of Digital Finance, Peking University
Project advisors:
HUANG Yiping Director of IDF, Peking University
LIANG Shidong Vice President of Ant Financial Services Group
Members of the research team:
Stage II, 2016-2018
GUO Feng, WANG Jingyi, CHENG Zhiyun, LI Yongguo, WANG Fang, WEI Aiyong
Stage I, 2011-2015
GUO Feng, KONG Tao, WANG Jingyi, ZHANG Xun, CHENG Zhiyun,
RUAN Fangyuan, SUN Tao, WANG Fang
Technical support
CHEN Qianjin, FU Zhibin, HU Xi, LI Huan, LI Zhenhua, LIU Peng,
LIU Xiaohui, RUAN Fangyuan, WANG Peng, YUAN Shengxiong,
ZHANG Li, ZHOU Weilin, ZHENG Ming
April 2019

The PKU-DFIIC (2011-2018)
http://idf.pku.edu.cn April 2019ii 01
ContentsAbstract…………………………………………………………………………………01
1. Introduction…………………………………………………………………………03
2. Literature Review…………………………………………………………………08
3. Indicator System of Digital Financial Inclusion………………………………13
3.1 Principles of indicator design……………………………………………………13
3.2 Indicators of digital financial inclusion…………………………………………15
4. Index Calculation Methodology…………………………………………………19
4.1 Nondimensionalization……………………………………………………………19
4.2 Analytic hierarchy process…………………………………………………………21
4.3 Index synthesis………………………………………………………………………27
5. Main Features of the Digital Financial Inclusion Index………………………29
5.1 Growth and regional differences in digital financial inclusion………………31
5.2 Comprehensiveness of digital financial inclusion………………………………39
5.3 Effectiveness of digital financial inclusion………………………………………48
5.4 The top 20 countries are mainly distributed in Hangzhou and Shanghai……51
6. Conclusions……………………………………………………………………………55
References…………………………………………………………………………………57
Appendix 1: The Provincial PKU-DFIIC 2011-2018………………………………60
Appendix 2: Profile of the Institute of Digital Finance at Peking University…68

The PKU-DFIIC (2011-2018)
http://idf.pku.edu.cn April 2019ii 01
Abstract
Improving financial inclusion has been an important policy objective of the
Chinese government in recent years. Financial inclusion means providing financial
services to all social classes and groups who demand appropriate and effective financial
services, at an affordable cost, and based on the principle of equal opportunity and
service sustainability. In addition to efforts made by traditional financial institutions
in this area, innovative digital finance, which relies on information technology, big
data and cloud computing, has significantly expanded the accessibility and coverage
of financial inclusion. However, discussions of financial inclusion and construction
of financial inclusion indicators to date mainly focus on traditional financial products
and services and fail to take into full account the advantages of digital finance –
its wider coverage and greater accessibility. To fill this gap, the Institute of Digital
Finance at Peking University and Ant Financial Services Group formed a joint research
team (Research Team) to develop a unique index series—“The Peking University
Digital Financial Inclusion Index of China (PKU-DFIIC)”. PKU-DFIIC utilizes Ant
Financial’s massive dataset on digital financial inclusion. To date, the project has
completed two phases: Stage I (2011-2015) and Stage II (2016-2018). The index covers
three geographical levels—province, prefecture-level municipality and county—and
updates the Stage I series from 2011-2015 to 2016-2018. In addition to the aggregate
index, the PKU-DFIIC also presents disaggregated indexes, such as coverage breadth,
usage depth and digitization level, as well as other subsector indexes like payment,
insurance, monetary funds, credit investigation, investment, and credit. In particular, to
maintain time consistency and comparability, the research team maintained continuity
of the calculation methodology when preparing the Stage II indexes. Considering the
progress of digital finance, the research team also added a small number of indicators
to better capture the new development.
After compiling the latest PKU-DFIIC at the provincial, prefecture and county
levels from 2011 to 2018, the research team also conducted some preliminary analyses.

The PKU-DFIIC (2011-2018)
http://idf.pku.edu.cn April 201902 03
The key findings are as follows:
1)Digital financial inclusion is an important model to realize low-cost, wide-
coverage and sustainable financial inclusion.
2)The practices of digital financial inclusion over the past few years offer
preliminary evidence of the feasibility and reproducibility of this model.
In particular, digital financial inclusion makes it possible for economically
undeveloped regions to catch up with and even surpass other regions in this area
and lays a foundation to allow low-income and disadvantaged groups access to
low-cost financial services.
3)The Yangtze River Delta region, especially the municipal districts of Hangzhou
and Shanghai, continue to dominate the list of the top 20 in digital financial
inclusion ranking at the country level.
4)Some provinces and cities in Central China have seen rapid development
in digital financial inclusion, and an obvious trend of a “rising central region”
is emerging. However, the figures in certain areas in the Northeast region and
Western region have declined sharply. Furthermore, compared with those in
Stage I (2011-2015), the PKU-DFIIC during 2016-2018 also captured
significant changes. In particular, PKU-DFIIC has since shifted to reflect an
increasing depth of use in recent years. This is in sharp contrast with the index
in Stage I (2011-2015), which proves that China’s digital financial inclusion
has passed the era of extensive enclosure and is embracing a new stage
characterized by deep expansion.
People from all walks of life are welcome to use this index. All the data of the
index can be obtained from the research team: [email protected] (GUO Feng).
Please indicate the data source as “The Peking University Digital Financial Inclusion
Index of China”. At the same time, please cite our work in the following way: GUO
Feng, WANG Jingyi, WANG Fang, KONG Tao, ZHANG Xun, CHENG Zhiyun,
2019, “Measuring China’s Digital Financial Inclusion: Index Compilation and Spatial
Characteristics”, Working paper, Institute of Digital Finance, Peking University.

The PKU-DFIIC (2011-2018)
http://idf.pku.edu.cn April 201902 03
1. Introduction
The United Nations has defined financial inclusion as a financial system that
effectively and comprehensively serves all social classes and groups (Jiao et al.,
2015). The original intention of financial inclusion is to highlight the continuous
improvement of the financial infrastructure and the availability of financial services to
provide more convenient financial services to people from all walks of life, especially
those in underdeveloped areas or categorized as low-income, at a lower cost. This
concept was initially adopted by the United Nations for the International Year of
Microcredit 2005 and was then vigorously promoted by the United Nations and the
World Bank. According to the World Bank's Global Financial Development Report
2014: Financial Inclusion, it has joined hands with public and private partners in more
than 70 countries and regions around the world on financial inclusion projects; over 50
countries and regions worldwide have established goals to improve financial inclusion
(The World Bank Group, 2015).
The concept of financial inclusion was first introduced to China by the China
Association of Microfinance (CAM). To promote the International Year of Microcredit
2005, Bai Chengyu, Secretary General of CAM, proposed “普惠金融体系 (Pu Hui
Jin Rong Ti Xi)” as the Chinese translation of “financial inclusion system”. In March
2006, Jiao Jinpu, Former Deputy Director of the Research Bureau of the People's
Bank of China, officially used this concept at the Asia Microfinance Forum in Beijing.
Afterwards, at the G20 Summit held in Mexico in June 2012, the then President of
China Hu Jintao noted that financial inclusion is essentially a development issue and
that all countries should strengthen communication and cooperation, better protect
consumer interests, and jointly build a financial mechanism that would benefit all
nations and peoples to guarantee that all consumers, particularly those in developing
countries, have access to modern, secure and convenient financial services. In
November 2013, the Third Plenary Session of the 18th CPC Central Committee
adopted the Decision of the Central Committee of the Communist Party of China on

The PKU-DFIIC (2011-2018)
http://idf.pku.edu.cn April 201904 05
Some Major Issues Concerning Comprehensively Deepening the Reform, proposing
to develop financial inclusion. At the end of 2015, the State Council clarified the
definition of financial inclusion at the national level for the first time in the notice
of the Plan for Advancing Financial Inclusion Development (2016-2020). Financial
inclusion means providing financial services to all social classes and groups with
demand for appropriate and effective financial services, at an affordable cost, and
based on the principle of equal opportunity and service sustainability by increasing
policy guidance and support, strengthening the construction of financial systems, and
improving financial infrastructure. The notice also identifies small and micro services,
subsistence-level farmers, urban low-income groups, impoverished groups, those
with disabilities, elderly individuals and other special groups as the focus for financial
inclusion in China.
At both home and abroad, the concept, theory and practice of financial inclusion
have gradually deepened: from the initial focus on the availability of banks’ physical
outlets and credit services to extending coverage over a variety of service areas
including payments, deposits, loans, insurance, credit investigations and securities. At
the practical level, financial inclusion in China has gradually expanded from public
welfare microfinance at the preliminary stage to integrated financial services, including
payment, credit and other services, and has embraced substantial development thanks
to the extensive application of network and mobile communication technologies.
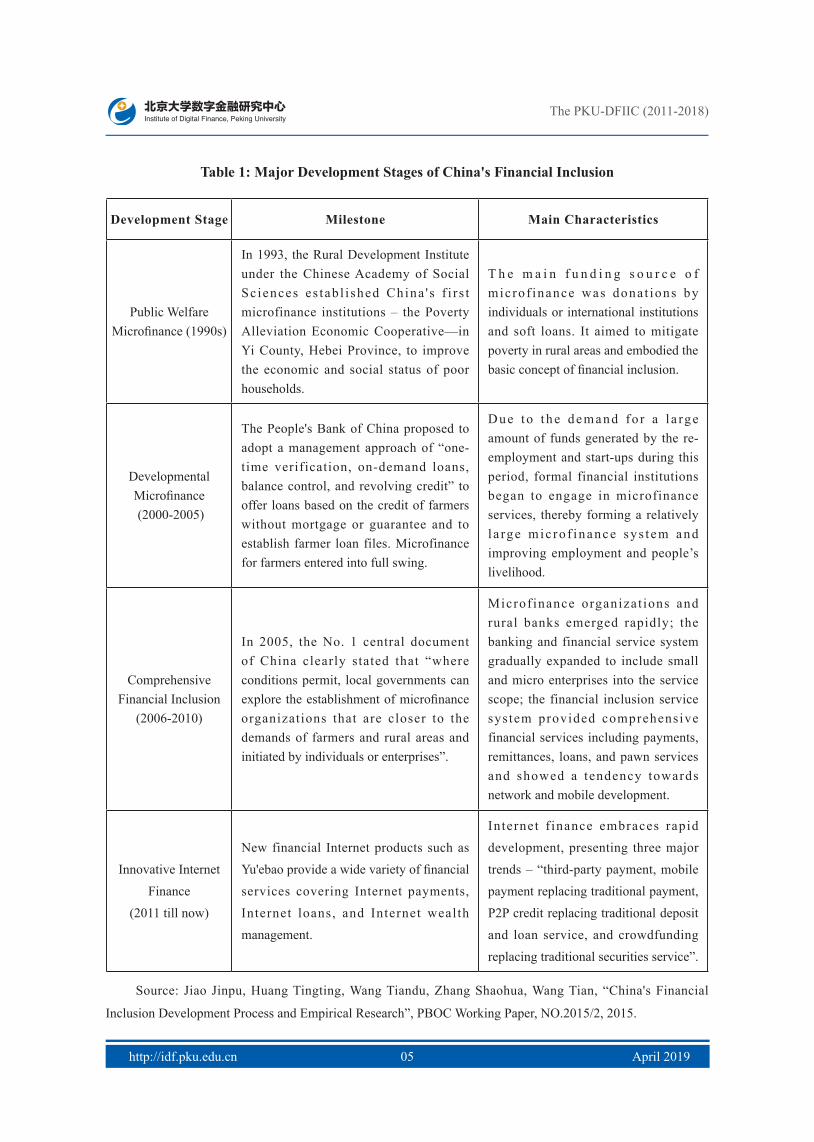
Based on international experience and China’s local context, Jiao et al. (2015) have
summarized and divided the course of China's financial inclusion practices into four
stages: public welfare microfinance, developmental microfinance, comprehensive
financial inclusion and innovative Internet finance (See Table 1). The main task of
financial inclusion is to provide financial services to low-income groups and small and
micro services that may be excluded from traditional or formal financial institution
systems.
The PKU-DFIIC (2011-2018)
http://idf.pku.edu.cn April 201904 05
Table 1: Major Development Stages of China's Financial Inclusion
Development Stage Milestone Main Characteristics
Public Welfare Microfinance (1990s)
In 1993, the Rural Development Institute under the Chinese Academy of Social Sc iences es tab l i shed China ' s f i r s t microfinance institutions – the Poverty Alleviation Economic Cooperative—in Yi County, Hebei Province, to improve the economic and social status of poor households.
T h e m a i n f u n d i n g s o u r c e o f microf inance was donat ions by individuals or international institutions and soft loans. It aimed to mitigate poverty in rural areas and embodied the basic concept of financial inclusion.
Developmental Microfinance (2000-2005)
The People's Bank of China proposed to adopt a management approach of “one-time verification, on-demand loans, balance control, and revolving credit” to offer loans based on the credit of farmers without mortgage or guarantee and to establish farmer loan files. Microfinance for farmers entered into full swing.
Due to t he demand fo r a l a rge amount of funds generated by the re-employment and start-ups during this period, formal financial institutions began to engage in microfinance services, thereby forming a relatively l a rge mic ro f inance sys t em and improving employment and people’s livelihood.
Comprehensive Financial Inclusion
(2006-2010)
In 2005, the No. 1 central document of China clearly stated that “where conditions permit, local governments can explore the establishment of microfinance organizations that are closer to the demands of farmers and rural areas and initiated by individuals or enterprises”.
Microf inance organizat ions and rural banks emerged rapidly; the banking and financial service system gradually expanded to include small and micro enterprises into the service scope; the financial inclusion service system provided comprehensive financial services including payments, remittances, loans, and pawn services and showed a tendency towards network and mobile development.
Innovative Internet Finance
(2011 till now)
New financial Internet products such as Yu'ebao provide a wide variety of financial services covering Internet payments, Internet loans, and Internet wealth management.
Internet f inance embraces rapid development, presenting three major trends – “third-party payment, mobile payment replacing traditional payment, P2P credit replacing traditional deposit and loan service, and crowdfunding replacing traditional securities service”.
Source: Jiao Jinpu, Huang Tingting, Wang Tiandu, Zhang Shaohua, Wang Tian, “China's Financial
Inclusion Development Process and Empirical Research”, PBOC Working Paper, NO.2015/2, 2015.

The PKU-DFIIC (2011-2018)
http://idf.pku.edu.cn April 201906 07
China's current financial inclusion practice shows a strong correlation with
innovative digital finance. One of the major positions adopted by the new digital
financial services represented by Internet companies offering financial services is
exactly to target low-income and disadvantaged groups with its extended services,
reduce the cost of financial service products and expand access to financial services
through information technology and product innovation to achieve win-win results
for organizations and customers. Therefore, innovative digital finance is an important
driving force in the present development of financial inclusion in China. Specifically,
in terms of coverage, traditional financial institutions need to build outlets to expand
coverage, and the resulting high cost makes it difficult for them to penetrate into
relatively impoverished regions. However, the crossover and integration of digital
technology and financial services can overcome such shortcomings. In some areas,
even without hardware facilities such as bank outlets and ATMs, customers still have
access to desirable financial services through terminal devices such as computers and
mobile phones. Compared with the traditional financial institutions that distribute most
resources in densely inhabited and commercial areas, digital finance makes financial
services more direct and accessible to more customers. For the social groups covered,
the innovations offered by digital financial products have lowered the access threshold
for customers, weakening the “nobility” attribute of financial services, and making
them increasingly accessible to the public. Compared with the exclusivity of traditional
financial institutions, digital finance can meet the needs of small and medium
businesses and low-income groups who are generally underprivileged and unable to
access financial services, thus reflecting the due meaning of financial inclusion.
This report aims to quantify China's digital financial inclusion practices in the
form of indexes. Such efforts have at least two implications. First, in theory, the index
will provide an important reference for the study of innovative financial inclusion
and the design of statistical indicator systems in China. The existing research on
financial inclusion in China mainly focuses on its concept, significance, index structure
and function from the perspective of traditional financial services. A scientific and
comprehensive summary of the theories and indicator systems of digital financial

The PKU-DFIIC (2011-2018)
http://idf.pku.edu.cn April 201906 07
inclusion from the perspective of innovative digital finance is still absent for China.
Based on a consolidation of the current research on indicator systems of financial
inclusion and indexes worldwide and with reference to the rapid development of
innovative digital finance at the current stage in China, this report has built an indicator
system for digital financial inclusion to further deepen the research on financial
inclusion. Second, in practice, based on the indicator system built, this report has
compiled digital financial inclusion indexes at the provincial, prefecture and county
levels, which serve to display digital financial inclusion development and regional
equilibrium under the current trend of innovative digital finance in China. These
indexes can help policy makers and practitioners better understand the development
status of digital financial inclusion in China and identify bottlenecks and obstacles to
its development with the purpose of formulating corresponding policies to promote
healthy and sustainable development. It should be noted to report readers, index users,
and relevant conclusion quoters that due to the limited availability of data, this report
and the indexes measure only the development of digital financial inclusion services
provided by Internet companies; the related services of traditional financial institutions
such as banks are not included.
The rest of the report is arranged as follows: Section II provides a brief overview
of the related literature; Section III introduces the indicator system of digital financial
inclusion; Section IV describes the calculation methods for the indexes, including
a discussion on the method of weight assignment; Section V presents the digital
financial inclusion indexes compiled based on the above methods, together with some
preliminary toing describe the overall development trend and regional variations; and
Section VI summarizes the report and proposes a direction for future research.

The PKU-DFIIC (2011-2018)
http://idf.pku.edu.cn April 201908 09
2. Literature Review
Financial inclusion is of great significance and value in regard to the function of
finance as serving the real economy and disadvantaged groups. Kapoor (2013) argued
that financial inclusion is an equalizer that contributes to economic growth and benefits
all citizens. The absence of a financial inclusion system will lead to continued income
inequality and the slowdown of economic growth (Beck et al., 2007). Chattopadhyay
(2011) reached a similar conclusion, and further quantitative analysis proved that
a lack of inclusion or even exclusion from the banking system results in a loss of 1
percent of GDP. Demirguc-Kunt and Klapper (2012) noted in the World Bank report
that financial inclusion gives those living in poverty access to saving and borrowing so
that they can accumulate assets and establish personal credit for a more secure future.
Wang and Lu (2012) believed that the development of financial inclusion will help
optimize the allocation of financial resources, improve the financing conditions of
SMEs, promote financial stability and raise overall profitability. The research of Xie et
al. (2018) based on the PKU-DFIIC (Stage I, 2011-2015) found that digital finance in
China has significantly promoted innovation and entrepreneurship, and similar findings
have been presented in other studies, such as Zhang et al. (2018). On the other hand,
some studies have found that there are still some shortcomings in financial inclusion
development in China (Guo and Ding, 2015).
In theory, financial inclusion is a multidimensional concept. The measurement of
financial inclusion involves multiple indicators from different dimensions. Therefore,
it is important to construct a scientific indicator system for financial inclusion
(Zeng et al., 2014). After the 2008 financial crisis, the concept of financial inclusion
attracted extensive attention around the world, and a number of countries, including
the UK, India and Kenya, as well as institutions including the World Bank, started to
research how to better understand financial inclusion and improve its development
in each country. For example, the indicator system of financial inclusion proposed
by the Association of Financial Inclusion (AFI) consists of two dimensions, financial

The PKU-DFIIC (2011-2018)
http://idf.pku.edu.cn April 201908 09
availability and the use of formal financial services, and a total of five indicators.
Among them, for the availability indicators, AFI’s system obtains most data from
financial institutions, while the indicators for use are mainly based on surveys of
the demand side or from financial institutions. The indicator system of financial
inclusion established by the Global Partnership for Financial Inclusion (GPFI) at
the G20 Summit in St. Petersburg, Russia, in 2013 consists of three dimensions—
availability, usage and financial services—and a total of 19 indicators (GPFI, 2013).
Compared with the systems above, the Global Financial Inclusion Database (also
known as Global Findex, hereinafter referred to as the Findex database), colaunched
by the World Bank and the Bill & Melinda Gates Foundation in 2012, is a database of
financial inclusion indicators that are comparable across countries and offers ongoing
monitoring. It offers high convenience for research on financial inclusion (Demirguc-
Kunt and Klapper, 2012). The Findex database stands out in terms of the dimensions
included and its abundant data. For statistical thinking, the Findex indicators are more
focused on the actual use of financial services by users rather than simply analyzing
financial coverage from the perspective of financial suppliers. For indicator design,
the indicators are divided into four categories—account penetration, savings behavior,
borrowing behavior, and insurance behavior—and then decomposed into a number
of dimensions based on the characteristics of groups, such as gender, age, education,
income, urban and rural areas. Regarding data source, Findex obtains data from
sample surveys administered by third-party organizations to 150,000 adults around the
world, which means that the data are relatively objective and unlikely to be affected
by administrative data. In China, to meet the requirements for financial inclusion
achievements proposed by documents such as State Council's Plan for Advancing
Financial Inclusion Development (2016-2020) and the G20 High Level Principles for
Digital Financial Inclusion adopted at the 2016 G20 Hangzhou Summit, at the end of
2016, the People's Bank of China (PBOC) established the China Indicator System of
Financial Inclusion. For the time being, the System includes three dimensions: usage,
availability, and quality, 21 categories and 51 indicators (Financial Consumer Rights
Protection Bureau under PBOC, 2018).
The PKU-DFIIC (2011-2018)
http://idf.pku.edu.cn April 201910 11
Multidimensional indicators contain the information useful for measuring
financial inclusion. The use of only a single indicator or only indicators in one specific
dimension may lead to a biased interpretation of the status quo for financial inclusion.
Therefore, many institutions and scholars have invested high effort and attempted to
prepare financial inclusion indexes, hoping to measure financial inclusion in a holistic
manner with as many indicators and comprehensive methods as possible. For example,
the Indian economist Sarma (2012) drew on the United Nations Human Development
Index (HDI), selected banking penetration, availability of banking services and
usage of the banking system as the main indicators, and applied a linear efficacy
function and Euclidean metric to measure the development of financial inclusion
in different countries. Chinese researchers have also researched the compilation of
financial inclusion indexes. Wang et al. (2011) measured China's financial exclusion
with the 2008 data and found that among the 31 provinces in China, 3 provinces had
low financial exclusion, 17 suffered severe financial exclusion, and the remaining
11 were subject to moderate financial exclusion. Wu and Xiao (2014) utilized the
indicators released by the World Bank and the International Monetary Fund and a
modified exponential efficacy function model to develop and analyze the financial
inclusion indexes of 133 economies in the world. Jiao et al. (2015) established an
indicator system of financial inclusion including three dimensions—the availability,
usage and quality of financial services—and 19 indicators and applied an analytic
hierarchy process (AHP) to determine the indicator weights. After collecting data at the
provincial level, they calculated the financial inclusion indexes of provinces in China
in 2013. Chen et al. (2015) calculated the provincial financial inclusion index from
2004 to 2013 and found a slight downward trend in China's financial inclusion.
Considering above preliminary analysis of related studies at home and abroad,
largely due to limits to the availability of data, the existing research presents the
following gaps. First, the financial services captured by most of the relevant studies
are not diverse; they mainly focus on banking services (such as Chen et al., 2015)
and fail to reflect the contribution of other types of financial institutions to financial
inclusion. In comparison, although Jiao et al. (2015) include some nonbank financial

The PKU-DFIIC (2011-2018)
http://idf.pku.edu.cn April 201910 11
services, their coverage of innovative digital finance is still insufficient. Second, the
dimensions proposed by existing indicator systems are not sufficiently comprehensive
and usually fail to consider service convenience and cost. In this period of innovative
digital finance, digital and mobile financial services have greatly improved the
accessibility of financial services and effectively reduced their cost. At the G20
Summit held in Hangzhou, China, in September 2016, the G20 High Level Principles
for Digital Financial Inclusion were formally adopted. The unique role that digital
finance can play in promoting financial inclusion has been recognized by many in
the industry. However, due to limited data, these increasingly important new digital
financial services are still often absent from current financial inclusion indexes.
When researchers do notice financial inclusion services beyond traditional financial
institutions, the attention given them remains insufficient, leading to the low proportion
of digital finance indicators in the indicator systems for financial inclusion as a whole
(Financial Consumer Rights Protection Bureau under PBOC, 2018). For service
types, financial inclusion should include not only bank-related financial services but
also online investment and wealth management, online loans, Internet insurance,
big data credit investigation, and other financial services. Given the shortcomings of
existing research, we compiled digital financial inclusion indexes with a focus on the
measurement of digital financial inclusion from the perspective of innovative digital
finance to supplement to the existing indicator systems and index calculations that
focus on traditional finance. Furthermore, in terms of the dimensions covered by the
indicator system, financial inclusion should capture financial services’ breadth of
reach, depth of utilization and the extent to which customers are truly benefited and
helped. Therefore, we set three dimensions—the coverage breadth of digital finance,
the use depth of digital finance, and the digitization level of financial inclusion—as
the foundation to compile digital financial inclusion indexes, and each of the three
dimensions contains multiple indicators. Ultimately, regarding the integration of
indexes at different levels and in different dimensions, the required weight setting
should have a certain scientific basis and be adaptable to adjustments and changes.
In recent years, due to the rapid development of communication technology and

The PKU-DFIIC (2011-2018)
http://idf.pku.edu.cn April 201912 13
e-commerce and the tolerance of regulators, China's digital finance has experienced
rapid development (Li, 2014). According to the Internet Finance Development Index
compiled by the Institute of Digital Finance at Peking University, from January 2014
to December 2015, the Internet Finance Development Index grew by 3.8 times, almost
doubling every year (Guo et al., 2016). The development of digital finance in China
has attracted worldwide attention and high anticipation. Some scholars have defined
Internet finance as a third financing model in addition to direct financing and indirect
financing (Xie and Zou, 2012). Innovative digital finance eliminates the dependence
on physical outlets that generally accompanies traditional finance, together with
advantages including higher geographical penetration and low cost. Attention has
also focused on the significance of digital finance for achieving financial inclusion.
For example, the rapid development of mobile Internet has created conditions for
improving financial inclusion services in underdeveloped regions (Jiao, 2014), and
digital currency plays an essential role in increasing financial service coverage and
penetration, reducing the cost and improving the quality of financial services. (Jiao
et al., 2015) In fact, the digital financial inclusion brought by digital finance has
penetrated every aspect of our lives (Chen, 2016). The practice of digital financial
inclusion in China and corresponding experiences in serving the real economy are also
presented in books and papers written by researchers (2017, 2018a, 2018b).

The PKU-DFIIC (2011-2018)
http://idf.pku.edu.cn April 201912 13
3. Indicator System of Digital Financial Inclusion
3.1 Principles of indicator design
i. Take both breadth and depth into account
An indicator system of financial inclusion should be a comprehensive summary of
its meanings and characteristics. Each indicator and dimension covered by the system
should capture one perspective and altogether, they should reflect financial inclusion as
a whole . Therefore, compilation of the digital financial inclusion index should start by
constructing a indicator system and ensure that all the dimensions and indicators work
together, offer organic integrity, and reflect the substance and features of financial
inclusion comprehensively, scientifically and accurately.
ii. Reflect the balance of financial inclusion services
Financial inclusion aims to establish a financial system that effectively and
comprehensively serves all social classes and groups, provides opportunities and rights
so that disadvantaged groups can enjoy modern financial services on an equal basis,
and allows groups subject to involuntary financial exclusion to have fair and timely
access to financial services and share the achievements of financial development.
Therefore, an indicator system of digital financial inclusion should be designed to
reflect the role of developing digital financial inclusion in mitigating the imbalance and
unfairness of financial services, and an indicator of financial poverty alleviation should
be set.
iii. Consider both vertical and horizontal comparability
Financial development varies across time and region. Hence, the ideal financial
inclusion index should be comparable both horizontally (across regions) and vertically
(across time). As a dynamic process, the development of financial inclusion is
constantly changing with the development of economic society and financial systems.
The financial inclusion status of the same region will change from year to year, while
different regions may deliver different financial inclusion performances in the same

The PKU-DFIIC (2011-2018)
http://idf.pku.edu.cn April 201914 15
year due to gaps in their natural endowment, economic development and structure,
policy and institutions. Therefore, the design and construction of the digital financial
inclusion index must ensure vertical comparability across years and horizontal
comparability across regions.
iv. Reflect the multilevel and diversity of financial services
Most of the existing research on financial inclusion is conducted from the
perspective of traditional banking. However, as financial services continue to innovate
and evolve, they present the characteristics of a multilevel nature and diversity.
Consequently, a holistic depiction of digital financial inclusion requires that an
indicator system include not only banking services (mainly credit) but also payment,
investment, insurance, monetary funds, and credit investigation, among other services.
v. Emphasize Internet technology
With the constant development and innovation of Internet technology, new
digital financial products represented by Yu'ebao offer a wide variety of financial
services, such as payment, credit, insurance, investment, monetary funds and credit
investigation. These new digital financial services have greatly lowered the threshold
to access financial services and allowed groups previously subject to involuntary
financial exclusion to have fair and timely access to financial services and share in the
achievements of financial development, highlighting the inclusivity of Internet finance.
vi. Ensure data continuity and method integrity
The data used to calculate the financial inclusion index must come from reliable
and accurate sources. In addition to the authority, accuracy and continuity of data,
calculation methods must follow the basic principles of mathematics, statistics,
economics, and other disciplines to ensure the relative objectivity of evaluation results.
To reflect the latest developments in digital finance, in the Stage II index (2016-
2018) update, the Research Group adjusted some indicators. The level of digital
support services is renamed the level of digitization, and the composition of its
subindex is enriched: credit, used to measure the development of credit consumption
scenarios and "credit as deposit" scenarios; convenience, used to measure the
The PKU-DFIIC (2011-2018)
http://idf.pku.edu.cn April 201914 15
application of offline merchant acquisition (which is currently mainly in the form of
QR code payment). For the investment service, the corresponding indicators remain
unchanged. However, Ant Financial made a major service adjustment: in 2015 and
before, service was mainly based on products such as Zhaocaibao that were similar to
fixed-income wealth management products, featuring low returns but a large principal
amount; currently, Ant Fortune serves more users, and thus the investment amount
of a single user may have declined significantly. Therefore, considering the index
construction mechanism, the investment service index of some regions has declined,
and data users are advised to notice the causes.
3.2 Indicators of digital financial inclusion
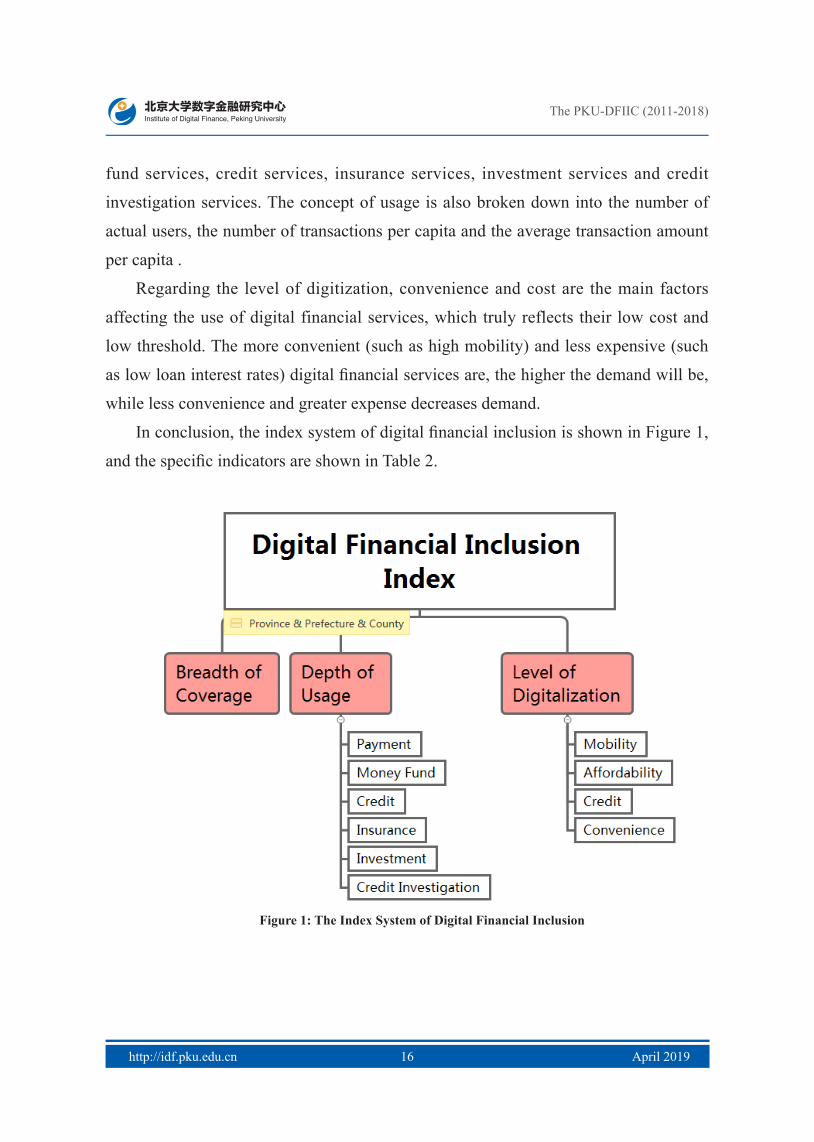
In accordance with the principles proposed above, including comprehensiveness,
balance, comparability, continuity and feasibility, the indicator system of digital
financial inclusion in this report adopts the following design aim: based on the
traditional financial inclusion indexes proposed by existing literature and international
organizations, considering the features of traditional and Internet financial services, in
combination with the availability and reliability of data, to build an indicator system
of digital financial inclusion considering three dimensions of financial services—
breadth of coverage, depth of use and level of digitization. More precisely, on the
basis of 26 specific indicators in Stage I (2011-2015), the current indicator system of
digital financial inclusion has been expanded to contain a total of 33 specific indicators
to reflect the development of digital financial inclusion in a more objective and
comprehensive manner.
Regarding the breadth of digital financial coverage, the accessibility of traditional
financial institutions is shown in the “number of outlets” and “number of service
personnel”. By contrast, under the model of Internet-based new finance, because the
Internet has no location restrictions by nature, the reach of Internet financial services is
reflected by the number of e-accounts, etc. (such as Internet payment accounts and the
bank accounts they are bound to).
In terms of the depth of digital finance usage, this report measures the actual use
of Internet financial services, which are classified into payment services, monetary
The PKU-DFIIC (2011-2018)
http://idf.pku.edu.cn April 201916 17
fund services, credit services, insurance services, investment services and credit
investigation services. The concept of usage is also broken down into the number of
actual users, the number of transactions per capita and the average transaction amount
per capita .
Regarding the level of digitization, convenience and cost are the main factors
affecting the use of digital financial services, which truly reflects their low cost and
low threshold. The more convenient (such as high mobility) and less expensive (such
as low loan interest rates) digital financial services are, the higher the demand will be,
while less convenience and greater expense decreases demand.
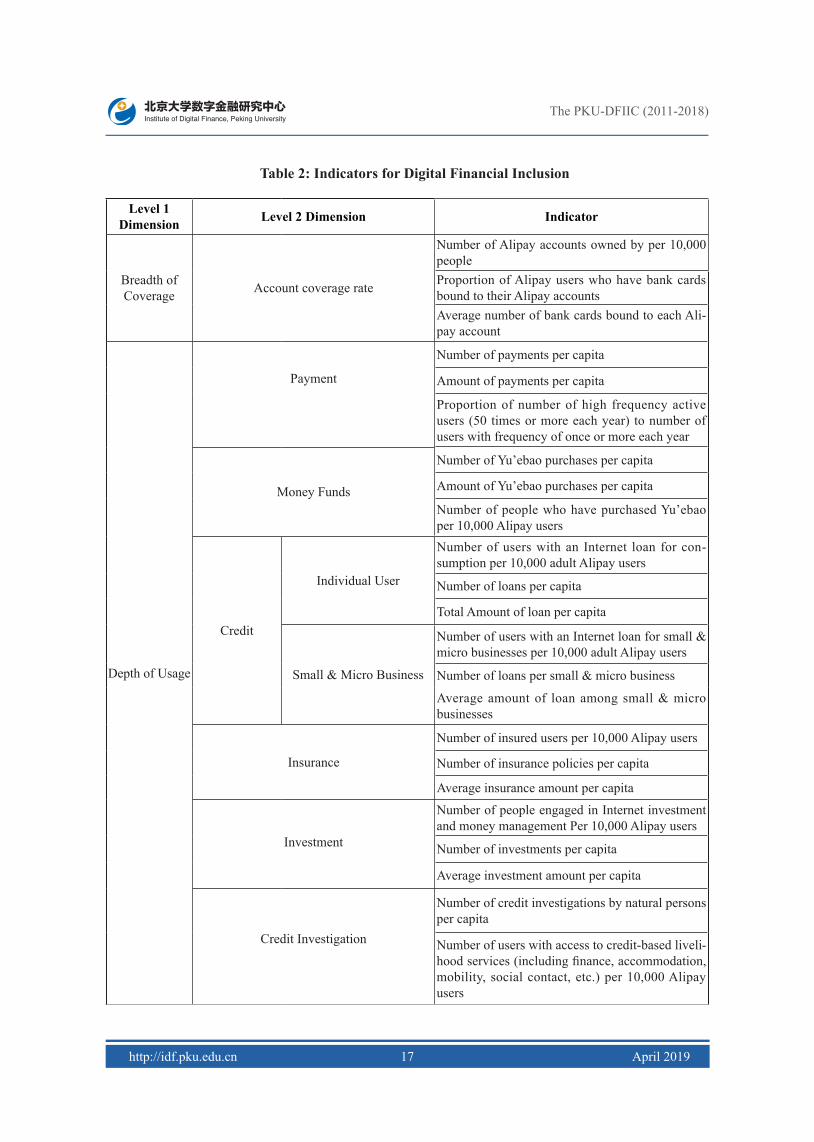
In conclusion, the index system of digital financial inclusion is shown in Figure 1,
and the specific indicators are shown in Table 2.
Figure 1: The Index System of Digital Financial Inclusion
The PKU-DFIIC (2011-2018)
http://idf.pku.edu.cn April 201917
Table 2: Indicators for Digital Financial Inclusion
Level 1 Dimension Level 2 Dimension Indicator
Breadth of Coverage Account coverage rate
Number of Alipay accounts owned by per 10,000 peopleProportion of Alipay users who have bank cards bound to their Alipay accountsAverage number of bank cards bound to each Ali-pay account
Depth of Usage
Payment
Number of payments per capita
Amount of payments per capita
Proportion of number of high frequency active users (50 times or more each year) to number of users with frequency of once or more each year
Money Funds
Number of Yu’ebao purchases per capita
Amount of Yu’ebao purchases per capita
Number of people who have purchased Yu’ebao per 10,000 Alipay users
Credit
Individual User
Number of users with an Internet loan for con-sumption per 10,000 adult Alipay users
Number of loans per capita
Total Amount of loan per capita
Small & Micro Business
Number of users with an Internet loan for small & micro businesses per 10,000 adult Alipay users
Number of loans per small & micro business
Average amount of loan among small & micro businesses
Insurance
Number of insured users per 10,000 Alipay users
Number of insurance policies per capita
Average insurance amount per capita
Investment
Number of people engaged in Internet investment and money management Per 10,000 Alipay users
Number of investments per capita
Average investment amount per capita
Credit Investigation
Number of credit investigations by natural persons per capita
Number of users with access to credit-based liveli-
mobility, social contact, etc.) per 10,000 Alipay users

The PKU-DFIIC (2011-2018)
http://idf.pku.edu.cn April 201918
Level of Digi-talization
MobilityProportion of number of mobile payments
Proportion of total amount of mobile payments
Affordability
Average loan interest rate for small & micro businesses
Average loan interest rate for individuals
Credit
Proportion of number of Ant Check Later payments
Proportion of total amount Ant Check Later payment
Proportion of number of “Zhima Credit as deposit” cases (to number of full-deposit cases)
Proportion of total amount of “Zhima Credit as deposit” (to amount of full-deposit)
Convenience
Proportion of number of QR code payments by users
Proportion of As above, please clarify with “Av-erage amount” or “total amount”.of QR code payment by users

The PKU-DFIIC (2011-2018)
http://idf.pku.edu.cn April 201918 19
4. Index Calculation Methodology
4.1 Nondimensionalization
In this section, we discuss how we consolidate the above 33 indicators of digital
financial inclusion into a single digital financial inclusion index. For a comprehensive
evaluation system with multiple indicators, it is necessary to nondimensionalize the
indicators with different properties and units to facilitate the consolidation of specific
indicators describing varied aspects of digital financial inclusion into a comprehensive
index that reflects digital financial inclusion as a whole. Nondimensionalization is the
removal of units from indicators so that they can be directly consolidated. To select a
nondimensionalization function, the general principle is that it be strict monotonic have
a clear value range, intuitive results, definite meaning, and little influence from the
positive or negative forms of indicators.
In this regard, the existing literature has generally adopted efficacy functions.
For a comprehensive evaluation system with multiple indicators, there are many
common efficacy functions, such as linear efficacy functions (also called traditional
efficacy function), exponential efficacy functions, logarithmic efficacy functions,
power-function-type efficacy functions, etc., that vary in terms of form (Peng et al.,
2007). At present in academic circles, the nondimensionalization of financial inclusion
indicators mainly includes two methods: the linear efficacy function method and the
exponential efficacy function method. Sarma (2012) made improvements to the HDI
used by the United Nations Development Programme to compute a financial inclusion
index. Jiao et al. (2015) nondimensionalized indicators with the linear efficacy
function. Considering the shortcomings of the linear efficacy function, Wu and Xiao
(2014) chose the exponential efficacy function to calculate a financial inclusion index.
In this report, we have taken into account the rapid expansion of digital finance. To
mitigate the impact of extreme values, avoid the excessive growth of indicators and
maintain their stability, we adopted the logarithmic efficacy function method, which
can effectively avoid the excessive growth of indicators brought about by rapid service

The PKU-DFIIC (2011-2018)
http://idf.pku.edu.cn April 201920 21
growth. Specifically, the formula of the logarithmic efficacy function is as follows:
log log 100log log
l
h l
x xdx x
−= ×
−
The function has the following characteristics:
a) Monotonic
' 1
logh
l
dxxx
=
For positive indicators, / 1h lx x > , ' 0d > , d is the monotonic increasing function about x ; for negative indicators, / 1h lx x < , ' 0d < , d is the monotonic
decreasing function about x .
b) Convexity
''
2
1
logh
l
dxxx
−=
For positive indicators, / 1h lx x > , '' 0d < , d is the convex upward function of x ;
for negative indicators, / 1h lx x < , '' 0d > , d is the convex downward function of x .
Regarding the determination of threshold value in the logarithmic efficacy function
formula, if the maximum and minimum values of each indicator in different years are
taken as upper and lower limits, when the maximum or minimum value is an extreme
or abnormal value, the exponential value is very likely to be distorted, resulting in
abnormality of the regional indicator. In addition, if the upper and lower limits of
each indicator are set on an annual basis, it will lead to changes in the benchmarks of
the indicator among regions in different years, resulting in vertical incomparability.
Therefore, to ensure both horizontal and vertical comparability when measuring
the development of digital financial inclusion in various regions in the future, we
processed values as follows:
a) For positive indicators, take the 95% quantile of the actual indicator value in
each region in 2011 as the upper limit hx , and the 5% quantile as the lower limit lx ;
The PKU-DFIIC (2011-2018)
http://idf.pku.edu.cn April 201920 21
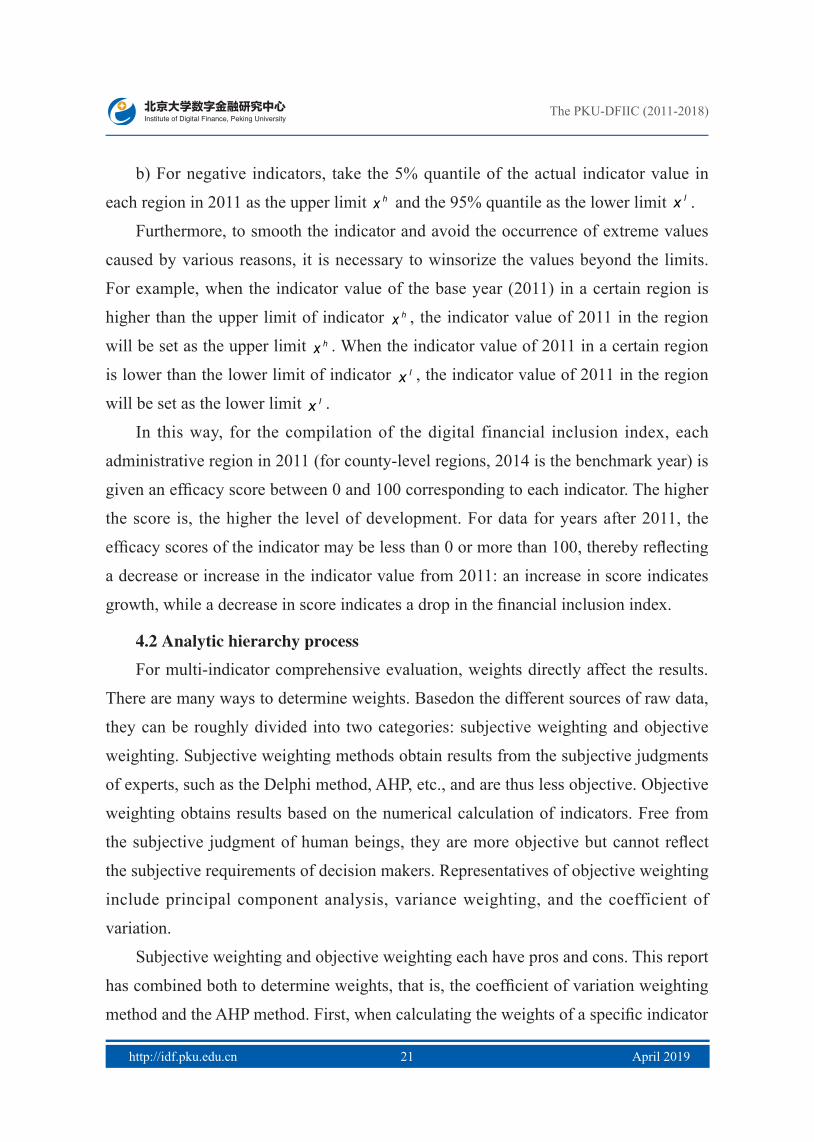
b) For negative indicators, take the 5% quantile of the actual indicator value in
each region in 2011 as the upper limit hx and the 95% quantile as the lower limit lx .
Furthermore, to smooth the indicator and avoid the occurrence of extreme values
caused by various reasons, it is necessary to winsorize the values beyond the limits.
For example, when the indicator value of the base year (2011) in a certain region is
higher than the upper limit of indicator hx , the indicator value of 2011 in the region
will be set as the upper limit hx . When the indicator value of 2011 in a certain region
is lower than the lower limit of indicator lx , the indicator value of 2011 in the region
will be set as the lower limit lx .
In this way, for the compilation of the digital financial inclusion index, each
administrative region in 2011 (for county-level regions, 2014 is the benchmark year) is
given an efficacy score between 0 and 100 corresponding to each indicator. The higher
the score is, the higher the level of development. For data for years after 2011, the
efficacy scores of the indicator may be less than 0 or more than 100, thereby reflecting
a decrease or increase in the indicator value from 2011: an increase in score indicates
growth, while a decrease in score indicates a drop in the financial inclusion index.
4.2 Analytic hierarchy process
For multi-indicator comprehensive evaluation, weights directly affect the results.
There are many ways to determine weights. Basedon the different sources of raw data,
they can be roughly divided into two categories: subjective weighting and objective
weighting. Subjective weighting methods obtain results from the subjective judgments
of experts, such as the Delphi method, AHP, etc., and are thus less objective. Objective
weighting obtains results based on the numerical calculation of indicators. Free from
the subjective judgment of human beings, they are more objective but cannot reflect
the subjective requirements of decision makers. Representatives of objective weighting
include principal component analysis, variance weighting, and the coefficient of
variation.
Subjective weighting and objective weighting each have pros and cons. This report
has combined both to determine weights, that is, the coefficient of variation weighting
method and the AHP method. First, when calculating the weights of a specific indicator

The PKU-DFIIC (2011-2018)
http://idf.pku.edu.cn April 201922 23
on the upper rule hierarchy, we used the coefficient of variation; then, we applied AHP
to calculate the weights of the indicator of rule hierarchy on the upper hierarchy targets
and finally, we obtained the total index.
i. The analytic hierarchy process determines the weights of the middle
hierarchy
AHP is a comprehensive evaluation method for system analysis and decision
making that can quantify qualitative problems in a relatively rational manner. The main
feature of AHP is that by building a hierarchical structure, judgments are converted
into an importance comparison between two factors, thereby transforming a qualitative
decision into a quantitative decision that is easier to handle. Its essence is a way of
thinking that decomposes complex problems into multiple components and then
builds these components into a hierarchical structure according to their subordination
relationships. Through pairwise comparison, an overall ranking of decision-making
schemes according to relative importance is obtained.
The basic principle of AHP is to decompose the factors related to the overall
evaluation target into three hierarchies: the target hierarchy, the rule hierarchy, and the
evaluation index hierarchy. In a constructed AHP model, a decision matrix is formed
through investigation and judgment. When the decision matrix passes the consistency
check, the weight of each indicator can be calculated; if the consistency check fails, the
element values of the decision matrix need adjustment until it passes the consistency
check. Specifically, the AHP calculation process is as follows:
Step 1: establish the hierarchical model. For the in-depth analysis on digital
financial inclusion, subdivide the factors into several hierarchies according to their
subordination relationship. The top is the target hierarchy, the middle is the rule
hierarchy, and the specific indicators are at the bottom. The hierarchical model for this
index is shown in Figure 1 above.
Step 2: build the decision matrix. According to the indicator system of digital
financial inclusion constructed in this report, there are three decision matrixes: “Digital
Financial Inclusion System” decision matrix, “Depth of Usage” decision matrix, and
“Level of Digitalization” decision matrix.
The PKU-DFIIC (2011-2018)
http://idf.pku.edu.cn April 201922 23
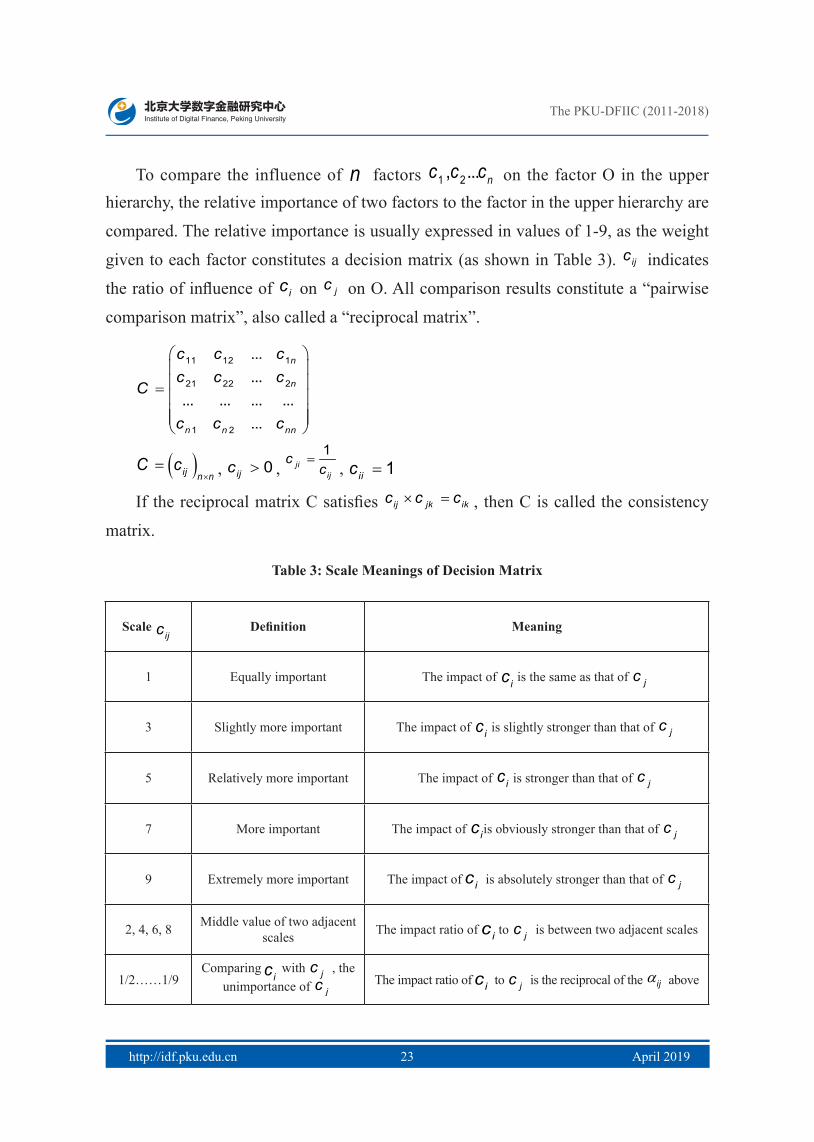
To compare the influence of n factors 1 2, ... nc c c on the factor O in the upper hierarchy, the relative importance of two factors to the factor in the upper hierarchy are
compared. The relative importance is usually expressed in values of 1-9, as the weight
given to each factor constitutes a decision matrix (as shown in Table 3). ijc indicates
the ratio of influence of ic on jc on O. All comparison results constitute a “pairwise
comparison matrix”, also called a “reciprocal matrix”.
11 12 1
21 22 2
1 2
...
...... ... ... ...
...
n
n
n n nn
c c cc c c
C
c c c
=
( )ij n nC c
×= , 0ijc > ,
1ji
ij
cc
= , 1iic =
If the reciprocal matrix C satisfies ij jk ikc c c× = , then C is called the consistency
matrix.
Table 3: Scale Meanings of Decision Matrix
Scale ijc Definition Meaning
1 Equally important The impact of ic is the same as that of jc
3 Slightly more important The impact of ic is slightly stronger than that of jc
5 Relatively more important The impact of ic is stronger than that of jc
7 More important The impact of ic is obviously stronger than that of jc
9 Extremely more important The impact of ic is absolutely stronger than that of jc
2, 4, 6, 8 Middle value of two adjacent scales The impact ratio of ic to jc
is between two adjacent scales
1/2……1/9 Comparing
ic with jc , the
unimportance of jc
The impact ratio of ic to jc is the reciprocal of the αij
above

The PKU-DFIIC (2011-2018)
http://idf.pku.edu.cn April 201924 25
For the three dimensions under the “digital financial inclusion system”, we believe
that the breadth of digital financial inclusion coverage is a prerequisite, the depth of
usage represents actual use, and the level of digitization can be regarded as a potential
condition. The first two embody "inclusion", while the last reflects “affordability”.
According to the relative importance of the three, we constructed a decision matrix, as
shown in Table 4.
Table 4: Decision Matrix of Digital Financial Inclusion System
Breadth of Coverage Depth of Usage Level of Digitalization
Breadth of Coverage 1 2 3
Depth of Usage 1/2 1 2
Level of Digitalization 1/3 1/2 1
Regarding the six dimensions of financial services under “depth of usage”, we
selected the “threshold” (complexity and risk) and “popularity” of financial services
as criteria. The higher the popularity, or the lower the threshold, the lower weight a
service has, and vice versa. In this way, we obtained the following decision matrix:
Table 5: Decision Matrix of Depth of Usage
Payment Monetary fund Credit investigation Insurance Investment Credit
Payment 1 1/2 1/3 1/4 1/5 1/6
Monetary fund 2 1 1/2 1/3 1/4 1/5
Credit investigation 3 2 1 1/2 1/3 1/4
Insurance 4 3 2 1 1/2 1/3
Investment 5 4 3 2 1 1/2
Credit 6 5 4 3 2 1
For the four dimensions of financial services under the “level of digitalization”,
the impact on real life and service maturity were chosen as criteria. The less mature
a service or the less impact it has on real life, the lower weight that service will have,
and vice versa. In this way, we obtain the decision matrix as follows:

The PKU-DFIIC (2011-2018)
http://idf.pku.edu.cn April 201924 25
Table 6: Decision Matrix of Level of Digitalization
Credit Convenience Affordability Mobility
Credit 1 1/2 1/3 1/4
Convenience 2 1 1/2 1/3
Affordability 3 2 1 1/2
Mobility 4 3 2 1
Step 3: calculate the maximum eigenvalue of the decision matrix and its
eigenvector. The process of determining the weight of each indicator with a decision
matrix actually aims to obtain the eigenvector of the decision matrix. By solving for
the maximum eigenvalue of the reciprocal matrix, the corresponding eigenvector can
be obtained and then normalized to be the weight vector.
maxCW Wλ=
Step 4: conduct a consistency check. First, calculate the consistency indicator CI
of the n × n decision matrix:
max
1n
CIn
λ −=
−
Second, calculate the average random consistency indicator RI. 1) Randomly
select numbers from 1-9 and their reciprocals to form a n × n reciprocal matrix and
calculate its maximum eigenvalue; 2) Repeat 1,000 times to obtain the maximum
eigenvalues of 1,000 random reciprocal matrixes and calculate the mean value of the
1,000 max eigenvalues k ; 3) Obtain the average random consistency indicator.
1k nRIn−
=−
Finally, calculate the consistency ratio CR and check consistency.CICRRI
=
When CR<0.1, the inconsistency degree of matrix A is generally considered to
be within the tolerance range, and its eigenvector can be used as a weight vector.
Otherwise, the decision matrix needs to be modified until CR<0.1.

The PKU-DFIIC (2011-2018)
http://idf.pku.edu.cn April 201926 27
Step 5: calculate weight vector. By normalizing the eigenvector corresponding
to the maximum eigenvalue of the decision matrix that has passed the consistency
check, the weight of the factor on the factors of the upper hierarchy can be obtained.
The weight vectors corresponding to the three decision matrixes are shown in Table 7,
Table 8, and Table 9.
It should be noted that the weights of “affordability” and “mobility” under the
level of digitization receive manually intervention and are reallocated to maintain
the same weight ratio of 1:2 as in Stage I (2011-2015) to ensure the continuity of the
Index.
Table 7: Weight Vectors of Three Dimensions under Digital Financial Inclusion System
Dimension Breadth of Coverage Depth of Usage Level of Digitalization
Weight 54.0% 29.7% 16.3%
Table 8: Weight Vectors of Six Service Dimensions under Depth of Usage
Dimension Payment Monetary fund Credit investigation Insurance Investment Credit
Weight 4.3% 6.4% 10.0% 16.0% 25.0% 38.3%
Table 9: Weight Vectors of Four Service Dimensions under Level of Digitalization
Dimension Credit Convenience Adorability Mobility
Weight 9.5% 16.0% 24.8% 49.7%
ii. The coefficient of variation determines the weight of a specific indicator
Upon determining the weight of the indicator of the middle hierarchy on its upper
hierarchy as shown above, the coefficient of variation method was utilized to obtain
the weight of each specific indicator of the bottom hierarchy on its upper hierarchy.
The basic idea of the method is to weight each indicator based on its degree of
variation in observed values. Specifically, if the coefficient of variation of an indicator
is large, it means that the indicator has greater explanatory power when measuring the
overall difference in the assessment target, and such indicator should be given a greater

The PKU-DFIIC (2011-2018)
http://idf.pku.edu.cn April 201926 27
weight. The specific process of determining indicator weight by the coefficient of
variation method is as follows:
First, calculate the coefficient of variation of each indicator, which indicates the
absolute degree of variation of each indicator:
where iS is the standard deviation of each indicator and ix is the mean value of
each indicator. Then, normalize the coefficient of variation of each indicator to obtain
the weight of each index:
=
== …
∑,
1
1,2,3,ii n
ii
CVq
CVi n
4.3 Index synthesis
In multi-indicator comprehensive evaluation, synthesis refers to the integration of
the evaluation values of different indicators for different aspects of a subject through a
certain formula to produce a holistic evaluation. There are a number of mathematical
methods applicable to synthesis. Common synthesis models are weighted arithmetic
mean, weighted geometric mean, or their combination. These three have different
features and applicable occasions but no absolute difference in terms of their
advantages or disadvantages. Therefore, to select an appropriate synthesis model,
it is necessary to analyze the mathematical properties and characteristics of models
according to the features and data properties of the subject to be evaluated.
After comprehensively comparing the three methods, we chose the weighted
arithmetic mean. The main basis for determination is as follows: when calculating
the score of each indicator through the logarithmic efficacy function, the comparison
benchmark of each year is the upper and lower limits of the corresponding indicator in
2011, so the score upon nondimensionalization is likely to be 0 or negative. To avoid a
situation in which the final weighted indicator is 0, it is most appropriate to apply the
weighted arithmetic mean. The formula is as follows:
1
n
i ii
d w d=
= ∑
The PKU-DFIIC (2011-2018)
http://idf.pku.edu.cn April 201928 29
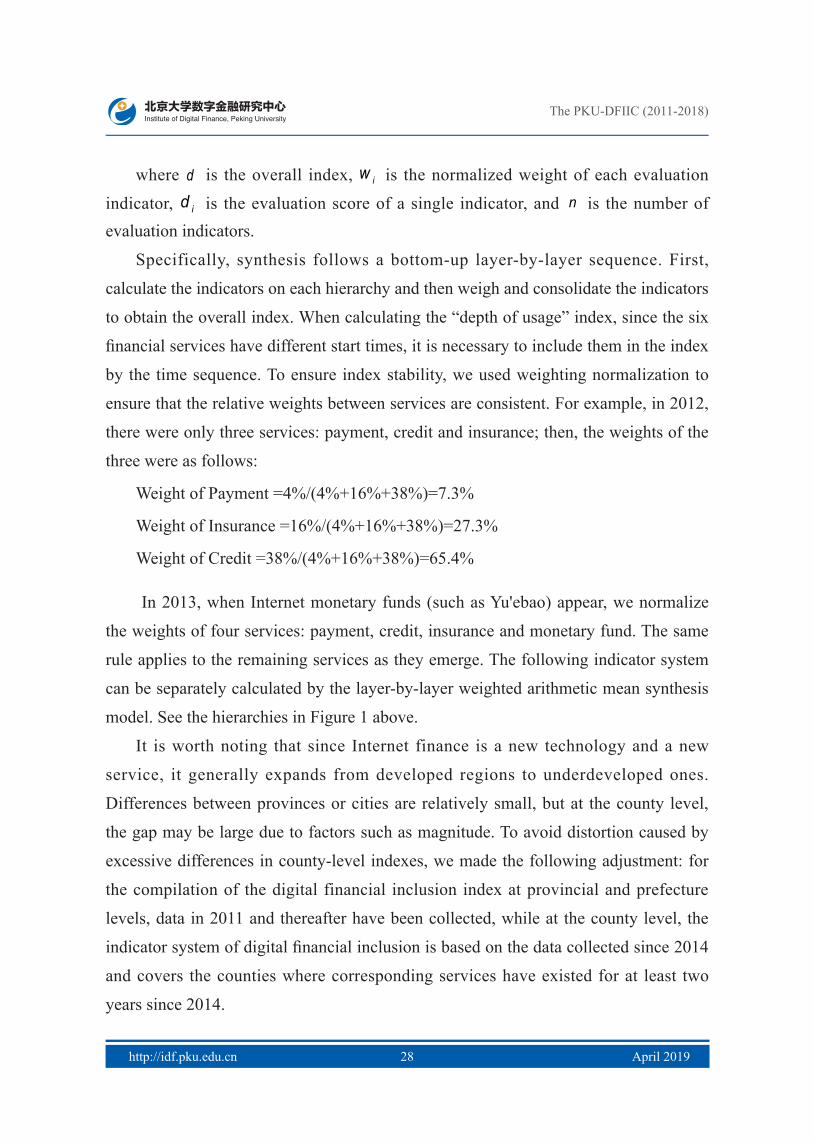
where d is the overall index, iw is the normalized weight of each evaluation
indicator, id is the evaluation score of a single indicator, and n is the number of evaluation indicators.
Specifically, synthesis follows a bottom-up layer-by-layer sequence. First,
calculate the indicators on each hierarchy and then weigh and consolidate the indicators
to obtain the overall index. When calculating the “depth of usage” index, since the six
financial services have different start times, it is necessary to include them in the index
by the time sequence. To ensure index stability, we used weighting normalization to
ensure that the relative weights between services are consistent. For example, in 2012,
there were only three services: payment, credit and insurance; then, the weights of the
three were as follows:
Weight of Payment =4%/(4%+16%+38%)=7.3%
Weight of Insurance =16%/(4%+16%+38%)=27.3%
Weight of Credit =38%/(4%+16%+38%)=65.4%
In 2013, when Internet monetary funds (such as Yu'ebao) appear, we normalize
the weights of four services: payment, credit, insurance and monetary fund. The same
rule applies to the remaining services as they emerge. The following indicator system
can be separately calculated by the layer-by-layer weighted arithmetic mean synthesis
model. See the hierarchies in Figure 1 above.
It is worth noting that since Internet finance is a new technology and a new
service, it generally expands from developed regions to underdeveloped ones.
Differences between provinces or cities are relatively small, but at the county level,
the gap may be large due to factors such as magnitude. To avoid distortion caused by
excessive differences in county-level indexes, we made the following adjustment: for
the compilation of the digital financial inclusion index at provincial and prefecture
levels, data in 2011 and thereafter have been collected, while at the county level, the
indicator system of digital financial inclusion is based on the data collected since 2014
and covers the counties where corresponding services have existed for at least two
years since 2014.

The PKU-DFIIC (2011-2018)
http://idf.pku.edu.cn April 201928 29
5. Main Features of the Digital Financial Inclusion Index
Using the index preparation methods discussed above, we obtained the digital
financial inclusion index for three levels of regions①, i.e., 31 provinces (municipalities,
autonomous regions, collectively referred to as “provinces”), 337 cities above the
prefecture level (regions, autonomous prefectures, leagues, etc., collectively referred
to as “cities”), and nearly 2,800 counties (county-level cities, banners, municipal
districts, etc., collectively referred to as “counties”). The time span of the indexes at
the provincial and prefectural levels is 2011-2018 and that of county-level indexes
is 2014-2018. In addition to the overall index, we also compiled indexes describing
the coverage breadth, use depth and digitization level of digital financial inclusion,
as well as subindexes for payments, insurance, monetary funds, credit investigation,
investment, credit, and more. The digital financial inclusion indexes of 31 provinces
from 2011 to 2018 are shown in Table 10. This section provides an overview of some
basic features of the digital financial inclusion index.
① The county-level indexes for 2014-2015 cover only counties and county-level cities, not municipal districts; the county-level indexes for 2016-2018 cover municipal districts.

The PKU-DFIIC (2011-2018)
http://idf.pku.edu.cn April 201930 31
Table 10: Provincial Digital Financial Inclusion Indexes 2011-2018
Province 2011 2012 2013 2014 2015 2016 2017 2018
Beijing 79.41 150.65 215.62 235.36 276.38 286.37 329.94 368.54
Tianjin 60.58 122.96 175.26 200.16 237.53 245.84 284.03 316.88
Hebei 32.42 89.32 144.98 160.76 199.53 214.36 258.17 282.77
Shanxi 33.41 92.98 144.22 167.66 206.3 224.81 259.95 283.65
Inner Mongolia 28.89 91.68 146.59 172.56 214.55 229.93 258.50 271.57
Liaoning 43.29 103.53 160.07 187.61 226.4 231.41 267.18 290.95
Jilin 24.51 87.23 138.36 165.62 208.2 217.07 254.76 276.08
Heilongjiang 33.58 87.91 141.4 167.8 209.93 221.89 256.78 274.73
Shanghai 80.19 150.77 222.14 239.53 278.11 282.22 336.65 377.73
Jiangsu 62.08 122.03 180.98 204.16 244.01 253.75 297.69 334.02
Zhejiang 77.39 146.35 205.77 224.45 264.85 268.10 318.05 357.45
Anhui 33.07 96.63 150.83 180.59 211.28 228.78 271.60 303.83
Fujian 61.76 123.21 183.1 202.59 245.21 252.67 299.28 334.44
Jiangxi 29.74 91.93 146.13 175.69 208.35 223.76 267.17 296.23
Shandong 38.55 100.35 159.3 181.88 220.66 232.57 272.06 301.13
Henan 28.4 83.68 142.08 166.65 205.34 223.12 266.92 295.76
Hubei 39.82 101.42 164.76 190.14 226.75 239.86 285.28 319.48
Hunan 32.68 93.71 147.71 167.27 206.38 217.69 261.12 286.81
Guangdong 69.48 127.06 184.78 201.53 240.95 248.00 296.17 331.92
Guangxi 33.89 89.35 141.46 166.12 207.23 223.32 261.94 289.25
Hainan 45.56 102.94 158.26 179.62 230.33 231.56 275.64 309.72
Chongqing 41.89 100.02 159.86 184.71 221.84 233.89 276.31 301.53
Sichuan 40.16 100.13 153.04 173.82 215.48 225.41 267.80 294.30
Guizhou 18.47 75.87 121.22 154.62 193.29 209.45 251.46 276.91
Yunan 24.91 84.43 137.9 164.05 203.76 217.34 256.27 285.79
Tibet 16.22 68.53 115.1 143.91 186.38 204.73 245.57 274.33
Shaanxi 40.96 98.24 148.37 178.73 216.12 229.37 266.85 295.95
Gansu 18.84 76.29 128.39 159.76 199.78 204.11 243.78 266.82
Qinghai 18.33 61.47 118.01 145.93 195.15 200.38 240.20 263.12
Ningxia 31.31 87.13 136.74 165.26 214.7 212.36 255.59 272.92
Xinjiang 20.34 82.45 143.4 163.67 205.49 208.72 248.69 271.84
Source: The PKU-DFIIC

The PKU-DFIIC (2011-2018)
http://idf.pku.edu.cn April 201930 31
5.1 Growth and regional differences in digital financial inclusion
i. Digital financial inclusion has stronger accessibility
Taking provincial indexes as an example, shown in Table 10 and Figure 2, the
digital financial inclusion service in China saw leapfrog development from 2011 to
2018. The median of the provincial digital financial inclusion index was 33.6 in 2011,
grew to 214.6 in 2015 and further rose to 294.3 in 2018. The median of the provincial
digital financial inclusion index in 2018 was 8.9 times that of 2011, representing an
average annual growth of 36.4%. We also observed a surge in the digital financial
inclusion index in the eastern, central and western regions of China. At the prefecture
level, the index rose rapidly as well, with the median of the prefecture digital financial
inclusion index increasing from 46.9 in 2011 to 167.0 in 2015 and 226.6 in 2018. The
median prefecture index in 2018 was 4.8 times that of 2011.
0
50
100
150
200
250
300
350
2011 2012 2013 2014 2015 2016 2017 2018
Digi
tal F
inan
cial
Incl
usio
n In
dex
Provincial Mean Provincial Median
Figure 2: Provincial Mean and Median of Digital Financial Inclusion Indexes 2011-2018
Source: The PKU-DFIIC
Along with the rapid growth of digital financial inclusion, like most of China's
economic characteristics, digital financial inclusion development in China displays
regional differences. As shown in Figure 3, the highest digital financial inclusion
index in 2018, which belonged to Shanghai, was 1.4 times that of the lowest, which
was Qinghai Province. According to the traditional financial inclusion index in 2013
provided by Jiao et al. (2015), the gap between the highest and lowest index was

The PKU-DFIIC (2011-2018)
http://idf.pku.edu.cn April 201932 33
greater: the highest (Shanghai) was 2.8 times that of the lowest (Tibet), while the
highest digital financial inclusion index in 2013 was 1.9 times that of the lowest. These
results indicate that compared with traditional financial inclusion, digital financial
inclusion features higher geographical penetration and has secured broader coverage.
200 220 240 260 280 300 320 340 360 380 400
Shan
ghai
Beiji
ngZh
ejia
ngFu
jian
Jiang
suG
uang
dong
Hube
iTi
anjin
Hain
anAn
hui
Chon
gqin
gSh
ando
ng
Jiang
xiSh
aanx
i He
nan
Sich
uan
Liao
ning
G
uang
xi
Huna
n Yu
nan
Shan
xiHe
bei
Gui
zhou
Jil
inHe
ilong
jiang
Tibe
t N
ingx
iaXi
njia
ngIn
ner M
ongo
liaG
ansu
Qin
ghai
Digi
tal F
inan
cial
Incl
usio
n In
dex
Figure 3: Digital Financial Inclusion Index by Province in 2018Source: The PKU-DFIIC
ii. Digital financial inclusion in different dimensions presents regional differences of various degrees
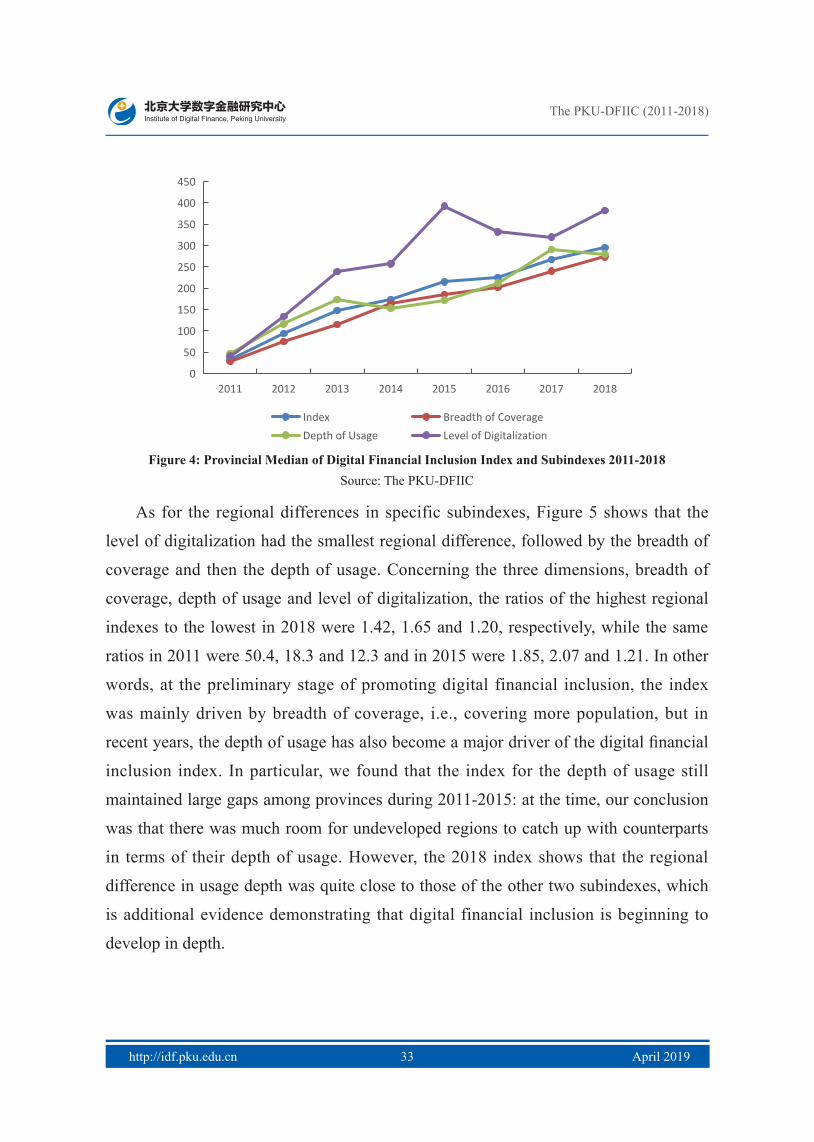
If we take a look at subindexes, in Stage I (2011-2015), the dimension that grew
the fastest was the level of digitalization, followed by the breadth of coverage, with
the depth of usage growing the slowest. However, some changes took place during
2016-2018. Specifically, the provincial median of the usage depth of digital financial
inclusion in 2018 was 1.63 times that of 2015, which is faster than the growth of
coverage breadth and digitization level, which were 1.48 times and 0.97 times,
respectively. In this regard, Figure 4 is another intuitive presentation. As digital
financial inclusion reached a certain level in terms of coverage and digitization, the depth
of usage also became a driver of index growth nationwide. However, we find that the depth
of usage in 2018 has a slight downward trend compared with 2017, which is mainly due to
the decline of monetary funds and investment under the influence of policy constraints and
other factors, while the other depth of usage indicators are still growing.
The PKU-DFIIC (2011-2018)
http://idf.pku.edu.cn April 201932 33
0
50
100
150
200
250
300
350
400
450
2011 2012 2013 2014 2015 2016 2017 2018
Index Breadth of CoverageDepth of Usage Level of Digitalization
Figure 4: Provincial Median of Digital Financial Inclusion Index and Subindexes 2011-2018Source: The PKU-DFIIC
As for the regional differences in specific subindexes, Figure 5 shows that the
level of digitalization had the smallest regional difference, followed by the breadth of
coverage and then the depth of usage. Concerning the three dimensions, breadth of
coverage, depth of usage and level of digitalization, the ratios of the highest regional
indexes to the lowest in 2018 were 1.42, 1.65 and 1.20, respectively, while the same
ratios in 2011 were 50.4, 18.3 and 12.3 and in 2015 were 1.85, 2.07 and 1.21. In other
words, at the preliminary stage of promoting digital financial inclusion, the index
was mainly driven by breadth of coverage, i.e., covering more population, but in
recent years, the depth of usage has also become a major driver of the digital financial
inclusion index. In particular, we found that the index for the depth of usage still
maintained large gaps among provinces during 2011-2015: at the time, our conclusion
was that there was much room for undeveloped regions to catch up with counterparts
in terms of their depth of usage. However, the 2018 index shows that the regional
difference in usage depth was quite close to those of the other two subindexes, which
is additional evidence demonstrating that digital financial inclusion is beginning to
develop in depth.

The PKU-DFIIC (2011-2018)
http://idf.pku.edu.cn April 201934 35
200
250
300
350
400
450
500
Shan
ghai
Beiji
ngZh
ejia
ngFu
jian
Jiang
suG
uang
dong
Hube
iTi
anjin
Hain
anAn
hui
Chon
gqin
gSh
ando
ng
Jiang
xiSh
aanx
i He
nan
Sich
uan
Liao
ning
G
uang
xi
Huna
n Yu
nan
Shan
xiHe
bei
Gui
zhou
Jil
inHe
ilong
jiang
Tibe
t N
ingx
iaXi
njia
ngIn
ner M
ongo
liaG
ansu
Qin
ghai
Subi
ndex
Breadth of Coverage Depth of Usage Level of Digitalization
Figure 5: Subindex of Digital Financial Inclusion by Province in 2018Source: The PKU-DFIIC
By comparing the ranking of provinces in terms of comparing their digital financial
inclusion index in 2018 with that in 2015, it is found that the ranking of the top six
provinces remained the same, which implies the stability of the Index. However, the
remainder of the ranking shows that the speed with which digital financial inclusion
develops varies greatly from region to region, as some rose by several ranks and some
dropped significantly. Specifically, as shown in Table 11, the regions with obvious
improvements are concentrated in Central China, such as Anhui, Jiangxi, and Henan
provinces, while the regions that saw great declines are mainly located in Northeastern
and Western China, such as Liaoning, Heilongjiang, Ningxia, Inner Mongolia and
more. Thus, we can conclude that the convergence of digital financial inclusion
nationwide is mainly driven by the rise of Central China.
Table 11: Ranking of Overall Provincial Indexes in 2018 and Changes
Province Index in 2018 Rank in 2018 Change from 2015 Change from 2011
Shanghai 377.73 1 Unchanged Unchanged
Beijing 368.54 2 Unchanged Unchanged
Zhejiang 357.45 3 Unchanged Unchanged
Fujian 334.44 4 Unchanged Up by 2 places

The PKU-DFIIC (2011-2018)
http://idf.pku.edu.cn April 201934 35
Jiangsu 334.02 5 Unchanged Unchanged
Guangdong 331.92 6 Unchanged Down by 2 places
Hubei 319.48 7 Up by 2 places Up by 6 places
Tianjin 316.88 8 Down by 1 place Down by 1 place
Hainan 309.72 9 Down by 1 place Down by 1 place
Anhui 303.83 10 Up by 7 places Up by 8 places
Chongqing 301.53 11 Unchanged Down by 1 place
Shandong 301.13 12 Unchanged Up by 2 places
Jiangxi 296.23 13 Up by 6 places Up by 9 places
Shaanxi 295.95 14 Down by 1 place Down by 3 places
Henan 295.76 15 Up by 10 places Up by 9 places
Sichuan 294.30 16 Down by 2 places Down by 4 places
Liaoning 290.95 17 Down by 7 places Down by 8 places
Guangxi 289.25 18 Up by 3 places Down by 3 places
Hunan 286.81 19 Up by 3 places Unchanged
Yunan 285.79 20 Up by 6 places Up by 5 places
Shanxi 283.65 21 Up by 2 places Down by 4 places
Hebei 282.77 22 Up by 6 places Down by 2 places
Guizhou 276.91 23 Up by 7 places Up by 6 places
Jilin 276.08 24 Down by 4 places Up by 2 places
Heilongjiang 274.73 25 Down by 7 places Down by 9 places
Tibet 274.33 26 Up by 5 places Down by 5 places
Ningxia 272.92 27 Down by 12 places Down by 6 places
Xinjiang 271.84 28 Down by 4 places Down by 1 place
Inner Mongolia 271.57 29 Down by 13 places Down by 6 places
Gansu 266.82 30 Down by 3 places Down by 2 places
Qinghai 263.12 31 Down by 2 places Down by 1 place
Source: The PKU-DFIIC

The PKU-DFIIC (2011-2018)
http://idf.pku.edu.cn April 201936 37
At the prefecture level, Table 12 shows that the top-ranking cities basically belong
to the coastal provinces in the east, especially the Yangtze River Delta region, which
indicates a clear sign of clustering. In terms of ranking changes, the rise of cities such
as Sanya, Yangzhou, Zhenjiang, Wuhan and Nantong is prominent.
Table 12: Top 30 cities in 2018
City Index in 2018 Rank in 2018 Change from 2015 Change from 2011
Hangzhou 302.98 1 Unchanged Up by 1 place
Shanghai 291.44 2 Unchanged Up by 7 places
Shenzhen 289.22 3 Up by 1 place Unchanged
Nanjing 289.18 4 Up by 2 places Up by 10 places
Beijing 285.41 5 Down by 1 place Up by 5 places
Xiamen 284.91 6 Down by 2 places Up by 6 places
Guangzhou 282.66 7 Unchanged Down by 2 places
Suzhou 281.97 8 Up by 6 places Up by 3 places
Wuhan 281.64 9 Up by 1 place Up by 20 places
Changzhou 279.53 10 Up by 5 places Up by 9 places
Zhuhai 278.25 11 Down by 2 places Up by 10 places
Jinhua 277.19 12 Unchanged Up by 3 places
Wuxi 276.08 13 Up by 3 places Up by 5 places
Ningbo 274.40 14 Down by 6 places Down by 6 places
Wenzhou 273.98 15 Down by 4 places Down by 8 places
Zhengzhou 272.83 16 Down by11 places Up by 19 places
Jiaxing 272.74 17 Unchanged Down by 16 places
Fuzhou 272.67 18 Down by 5 places Up by 6 places
Hefei 272.52 19 Up by 10 places Up by 17 places
Huzhou 269.89 20 Up by 8 places Up by 3 places
Sanya 269.04 21 Up by 19 places Up by 35 places
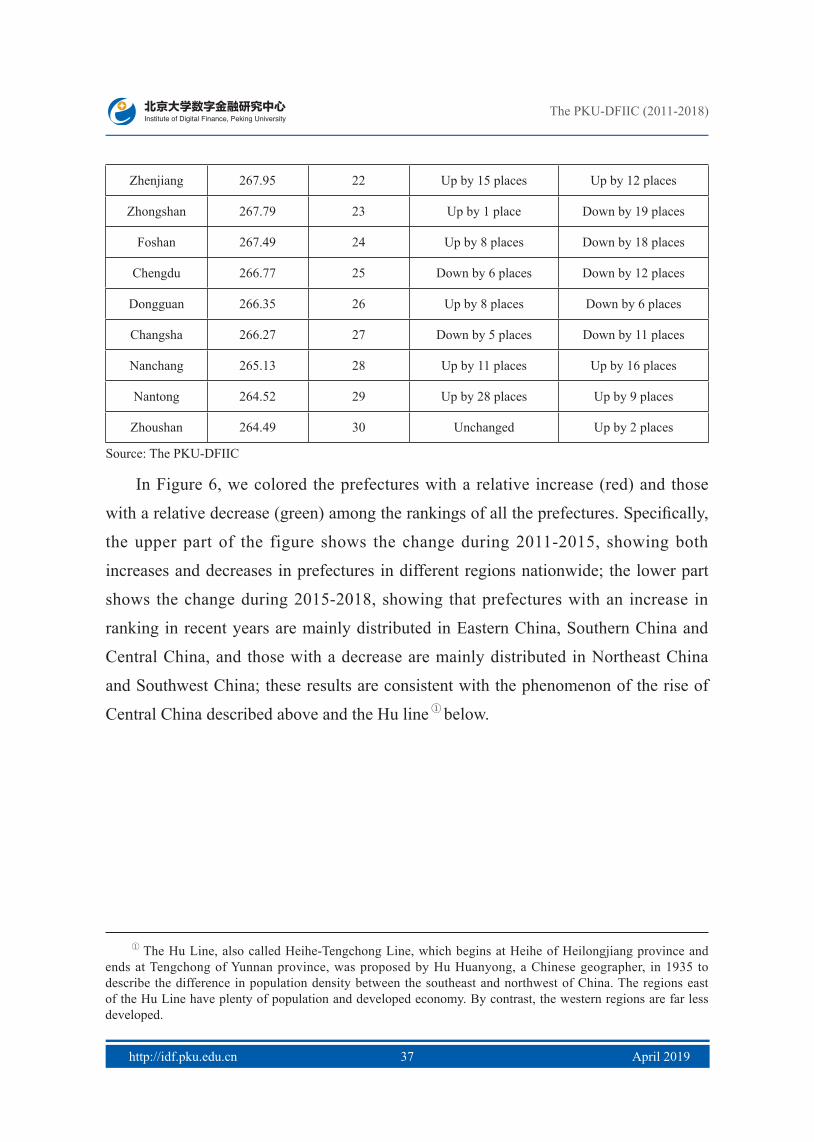
The PKU-DFIIC (2011-2018)
http://idf.pku.edu.cn April 201936 37
Zhenjiang 267.95 22 Up by 15 places Up by 12 places
Zhongshan 267.79 23 Up by 1 place Down by 19 places
Foshan 267.49 24 Up by 8 places Down by 18 places
Chengdu 266.77 25 Down by 6 places Down by 12 places
Dongguan 266.35 26 Up by 8 places Down by 6 places
Changsha 266.27 27 Down by 5 places Down by 11 places
Nanchang 265.13 28 Up by 11 places Up by 16 places
Nantong 264.52 29 Up by 28 places Up by 9 places
Zhoushan 264.49 30 Unchanged Up by 2 places
Source: The PKU-DFIIC
In Figure 6, we colored the prefectures with a relative increase (red) and those
with a relative decrease (green) among the rankings of all the prefectures. Specifically,
the upper part of the figure shows the change during 2011-2015, showing both
increases and decreases in prefectures in different regions nationwide; the lower part
shows the change during 2015-2018, showing that prefectures with an increase in
ranking in recent years are mainly distributed in Eastern China, Southern China and
Central China, and those with a decrease are mainly distributed in Northeast China
and Southwest China; these results are consistent with the phenomenon of the rise of
Central China described above and the Hu line ① below.
① The Hu Line, also called Heihe-Tengchong Line, which begins at Heihe of Heilongjiang province and ends at Tengchong of Yunnan province, was proposed by Hu Huanyong, a Chinese geographer, in 1935 to describe the difference in population density between the southeast and northwest of China. The regions east of the Hu Line have plenty of population and developed economy. By contrast, the western regions are far less developed.

The PKU-DFIIC (2011-2018)
http://idf.pku.edu.cn April 201938 39
Figure 6: Prefecture-level Digital Financial Inclusion Ranking Change
Source: The PKU-DFIIC
Note: The upper part of the figure shows the change from 2011-2015 and the lower part shows 2015-2018; red
indicates an increase, green, a decrease, yellow unchanged. and white indicates that relevant data are lacking, e.g.,
Taiwan, Hong Kong and Macao.
Furthermore, from the Stage I Index, we found that among the top 10 cities ranked
according to the subindexes under depth of usage, at least half were in Zhejiang
Province, except for the sector of credit investigation. In 2018, the corresponding top
10 cities under the depth of usage were no longer limited to Zhejiang Province but
included other cities as well (Table 13).
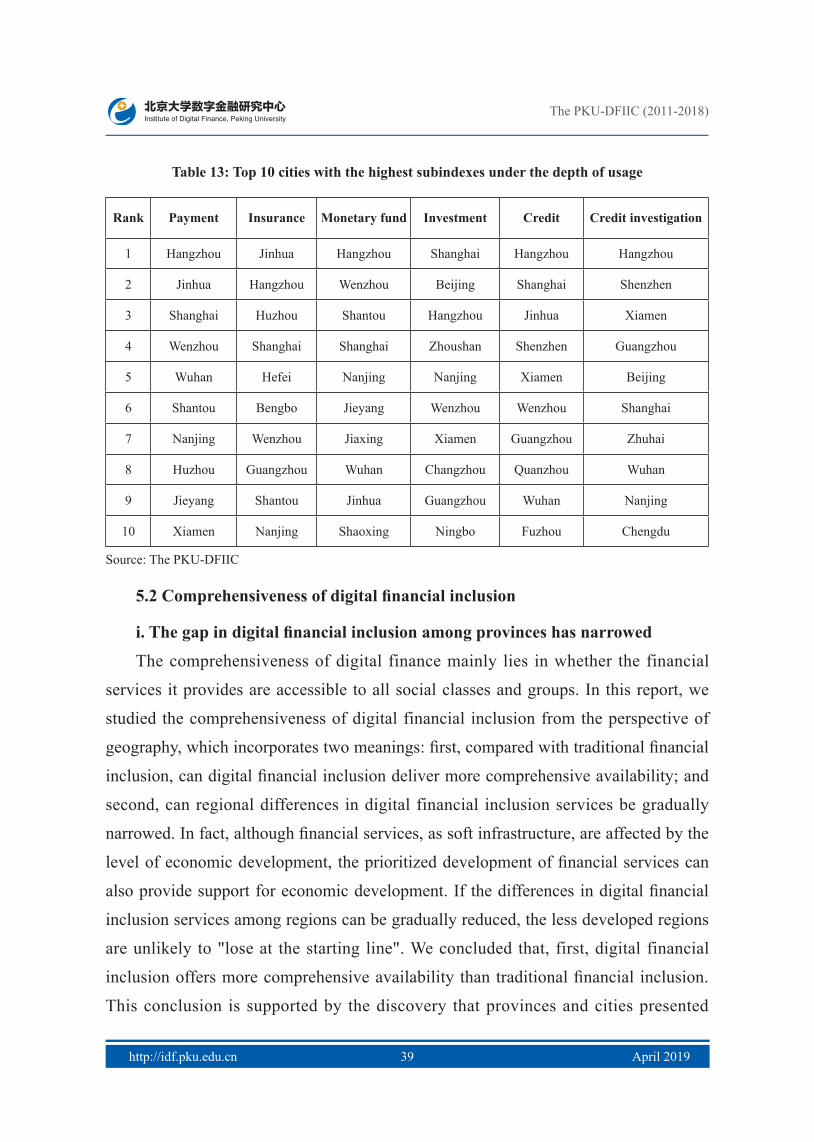
The PKU-DFIIC (2011-2018)
http://idf.pku.edu.cn April 201938 39
Table 13: Top 10 cities with the highest subindexes under the depth of usage
Rank Payment Insurance Monetary fund Investment Credit Credit investigation
1 Hangzhou Jinhua Hangzhou Shanghai Hangzhou Hangzhou
2 Jinhua Hangzhou Wenzhou Beijing Shanghai Shenzhen
3 Shanghai Huzhou Shantou Hangzhou Jinhua Xiamen
4 Wenzhou Shanghai Shanghai Zhoushan Shenzhen Guangzhou
5 Wuhan Hefei Nanjing Nanjing Xiamen Beijing
6 Shantou Bengbo Jieyang Wenzhou Wenzhou Shanghai
7 Nanjing Wenzhou Jiaxing Xiamen Guangzhou Zhuhai
8 Huzhou Guangzhou Wuhan Changzhou Quanzhou Wuhan
9 Jieyang Shantou Jinhua Guangzhou Wuhan Nanjing
10 Xiamen Nanjing Shaoxing Ningbo Fuzhou Chengdu
Source: The PKU-DFIIC
5.2 Comprehensiveness of digital financial inclusion
i. The gap in digital financial inclusion among provinces has narrowed
The comprehensiveness of digital finance mainly lies in whether the financial
services it provides are accessible to all social classes and groups. In this report, we
studied the comprehensiveness of digital financial inclusion from the perspective of
geography, which incorporates two meanings: first, compared with traditional financial
inclusion, can digital financial inclusion deliver more comprehensive availability; and
second, can regional differences in digital financial inclusion services be gradually
narrowed. In fact, although financial services, as soft infrastructure, are affected by the
level of economic development, the prioritized development of financial services can
also provide support for economic development. If the differences in digital financial
inclusion services among regions can be gradually reduced, the less developed regions
are unlikely to "lose at the starting line". We concluded that, first, digital financial
inclusion offers more comprehensive availability than traditional financial inclusion.
This conclusion is supported by the discovery that provinces and cities presented
The PKU-DFIIC (2011-2018)
http://idf.pku.edu.cn April 201940 41
a smaller development gap in digital financial inclusion compared with traditional
financial inclusion. As shown in Figure 3 above, the highest digital financial inclusion
index in 2018, which belonged to Shanghai, was 1.4 times that of the lowest, which
was scored by Qinghai (the highest was 1.5 times that of the lowest in 2015, and 4.9
times in 2011). Regarding aggregate financing to the real economy (AFRR), in 2017,
the highest increase in per capita AFRR was recorded in Shanghai, which was 8.4
times that of the lowest in Jilin; the same ratio in 2015 was 3.3 times. This shows that
compared with traditional financial inclusion, digital financial inclusion features higher
geographical penetration and offers wider coverage of financial services, allowing
undeveloped regions access to relatively more financial services.
Second, in recent years, the gap in digital financial inclusion among provinces
has greatly narrowed. Overall, as time goes by and service develops, digital financial
inclusion is converging among regions. As shown in Figure 7, the digital financial
inclusion index varies widely from province to province in 2011, while in 2018, this
difference was significantly reduced. A comparison of Figure 8, Figure 9 and Figure
10 indicates that the regional convergence of the digital financial inclusion index at the
early stage could mainly be attributed to the convergence of digital finance’s coverage
breadth and digitalization level, but in the past two years, the convergence of usage
depth has also become an important driving force. In particular, by comparing Figure
8, Figure 9 and Figure 10, we can see clearly that the depth of usage in digital financial
inclusion started to gain momentum in recent years. Such a development tendency
for digital finance may be of great inspiration local governments and enterprises as it
concerns the development of digital finance and the strategic layout of Internet+ as a
whole.

The PKU-DFIIC (2011-2018)
http://idf.pku.edu.cn April 201940 41
0
50
100
150
200
250
300
350
400
Shan
ghai
Beiji
ngZh
ejia
ngFu
jian
Jiang
suG
uang
dong
Hube
iTi
anjin
Hain
anAn
hui
Chon
gqin
gSh
ando
ng
Jiang
xiSh
aanx
i He
nan
Sich
uan
Liao
ning
G
uang
xi
Huna
n Yu
nan
Shan
xiHe
bei
Gui
zhou
Jil
inHe
ilong
jiang
Tibe
t N
ingx
iaXi
njia
ngIn
ner M
ongo
liaG
ansu
Qin
ghai
Digi
tal F
inan
cial
Incl
usio
n In
dex
2011 2015 2018
Figure 7: Provincial Digital Financial Inclusion Index in 2011, 2015 and 2018Source: The PKU-DFIIC
0
50
100
150
200
250
300
350
400
Shan
ghai
Beiji
ngZh
ejia
ngTi
anjin
Jinag
suG
uang
dong
Fujia
nLi
aoni
ng
Chon
gqin
gSh
annx
iHu
bei
Shan
dong
N
ingx
iaHa
inan
Sich
uan
Shan
xiIn
ner M
ongo
lia Jilin
Heilo
ngjia
ngAn
hui
Gua
nxi
Hebe
iHu
nan
Jiang
xiHe
nan
Xinj
iang
Yunn
anG
ansu
Tibe
tG
uizh
ouQ
ingh
ai
Cove
rage
Bre
adth
of D
igita
l Fin
ance
2011年 2015年 2018年
Figure 8: Provincial Index of Breadth of Coverage in 2011, 2015 and 2018
Source: The PKU-DFIIC

The PKU-DFIIC (2011-2018)
http://idf.pku.edu.cn April 201942 43
0 50
100 150 200 250 300 350 400 450
Shan
ghai
Zhej
iang
Beiji
ngFu
jian
Jinag
suG
uang
dong
Hube
iTi
anjin
Anhu
iHa
inan
Jiang
xiSi
chua
nSh
ando
ngHu
nan
Chon
gqin
gLi
aoni
ngYu
nnan
Shan
nxi
Hena
nG
uang
xiHe
bei
Tibe
tJil
inHe
ilong
jiang
Shan
xiG
uizh
ouQ
ingh
aiXi
njia
ngIn
ner M
ongo
liaG
ansu
Nin
gxia
Usa
ge D
epth
of D
igita
l Fin
ance
2011 2015 2018
Figure 9: Provincial Index of Depth of Usage in 2011, 2015 and 2018Source: The PKU-DFIIC
0 50
100 150 200 250 300 350 400 450 500
Shan
ghai
Zhej
iang
Beiji
ngJia
ngsu
Fujia
nHu
bei
Gua
ngdo
ngJia
ngxi
Anhu
iHe
nan
Shan
dong
Tian
jinCh
ongq
ing
Sich
uan
Huna
nG
uang
xiSh
annx
iJil
inHa
inan
Yunn
anLi
aoni
ngG
uizh
ouHe
ilong
jiang
Hebe
iTi
bet
Shan
xiXi
njia
ngG
ansu
Nin
gxia
Qin
ghai
Inne
r Mon
golia
Digi
taliz
atio
n Le
vel o
f Inc
lusi
ve F
inan
ce
2011 2015 2018
Figure 10: Provincial Index of Level of Digitalization in 2011, 2015 and 2018Source: The PKU-DFIIC
Note: During 2016-2018, the specific indexes under the level of digitization changed greatly. In fact, compared with 2016 and 2017, the level of digitization rose in 2018.
ii. The gap in digital financial inclusion among cities has narrowed
Maps more intuitively show the relatively faster development of digital financial
inclusion in remote cities, which has narrowed the gap among cities. Figure 11 displays
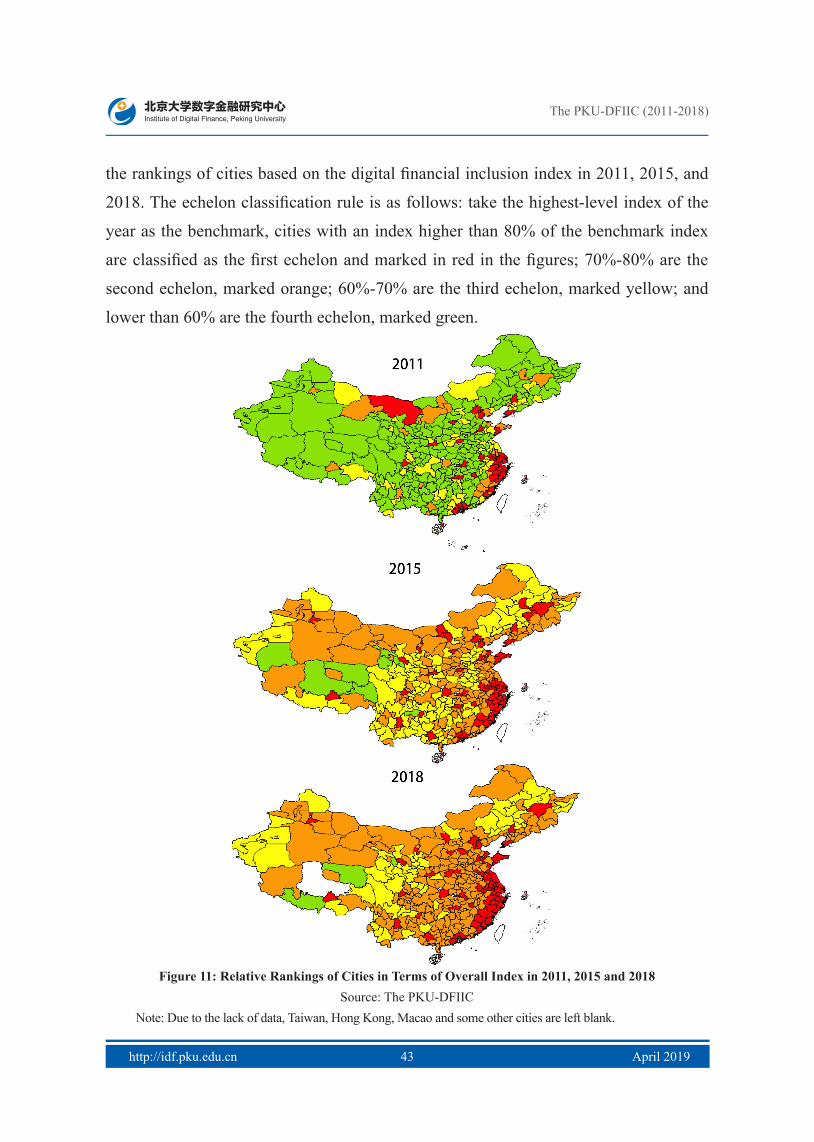
The PKU-DFIIC (2011-2018)
http://idf.pku.edu.cn April 201942 43
the rankings of cities based on the digital financial inclusion index in 2011, 2015, and
2018. The echelon classification rule is as follows: take the highest-level index of the
year as the benchmark, cities with an index higher than 80% of the benchmark index
are classified as the first echelon and marked in red in the figures; 70%-80% are the
second echelon, marked orange; 60%-70% are the third echelon, marked yellow; and
lower than 60% are the fourth echelon, marked green.
Figure 11: Relative Rankings of Cities in Terms of Overall Index in 2011, 2015 and 2018Source: The PKU-DFIIC
Note: Due to the lack of data, Taiwan, Hong Kong, Macao and some other cities are left blank.

The PKU-DFIIC (2011-2018)
http://idf.pku.edu.cn April 201944 45
Figure 11 shows the distribution changes in city-level indexes over the three
periods, from which we can find that in 2011, there was a large gap in development
among cities, as the first echelon was concentrated in the surrounding areas of
Shanghai and other large cities, the second and third echelons were few in number, and
most of the cities belonged to the fourth echelon; in 2015, the first echelon reached
the coastal cities in Southeast China and regional-central cities, while the second and
third echelons grew and expanded; and by 2018, most of the cities were in the first and
second echelons, that is, the majority of cities had a digital financial inclusion index
higher than 70% of the highest-level index, implying that the gap among regions had
further narrowed.
Considering the significant changes in the depth of usage, we further visualized
maps on this dimension. As shown in Figure 12, the depth of usage is another
perspective that can manifest the development trend identified above. Because the
depth of usage is an objective depiction of the actual use of digital financial inclusion
services, it is completely determined by the service application in use in reality (as
for the level of digitization, the indexes also describe technical support). In 2011 and
2015, except for some fringe areas where the population is sparse (Ngari Prefecture &
Shannan, Tibet), the depth of usage showed a clear stepwise trend from the southeast
coast inland. The index distribution in 2015 coincides with the three steps in terms
of geographical location. The first and second echelons are basically within the first
step, the second step covers a mix of the third and fourth echelons, and the third step
and beyond is almost completely occupied by the third echelon. In 2018, the stepwise
trend diminished. However, comparing the figure with the renowned Hu Line from
geoeconomics, we can still see that the first and second echelons of cities in 2018 are
basically located east of the Hu Line, and those west of the line still have much room for
development. Then, we can conclude that digital financial inclusion has indeed promoted
the coordinated development of regions, with the original gap gradually narrowing;
however, the inherent network effect is still present, and there is substantial room to grow
and improve in those sparsely populated areas (regions west of the Hu Line).

The PKU-DFIIC (2011-2018)
http://idf.pku.edu.cn April 201944 45
Figure 12: Relative Ranking of Cities in Terms of Depth of Usage in 2011, 2015 and 2018Source: The PKU-DFIIC
Note: Due to the lack of data, Taiwan, Hong Kong, Macao and some other cities are left blank.
However, turning to the breadth of coverage index of digital finance in Figure
13, it can be seen that the characteristic of Hu Line is not obvious, as the breadth of
coverage indexes for some cities west of the Hu Line also entered the first and second
echelons in 2018. The figure demonstrates that digital finance has more extensive
penetration in terms of accessibility, and Western China still has space to develop in
terms of depth of usage.

The PKU-DFIIC (2011-2018)
http://idf.pku.edu.cn April 201946 47
Figure 13: Relative Rankings of Cities in Terms of Breadth of Coverage in 2011, 2015 and 2018Source: The PKU-DFIIC
Note: Due to the lack of data, Taiwan, Hong Kong, Macao and some cities and counties in Hainan are left blank.
To measure the relative gap in digital financial inclusion among regions in a more
scientific manner, we also calculated the coefficients of variation ① of the provincial
indexes across the country, as well as the coefficient of variation within each province.
① The coefficient of variation is the ratio of the raw data standard deviation to the raw data mean. The coefficient of variation is dimensionless and measures the data dispersion of variables.
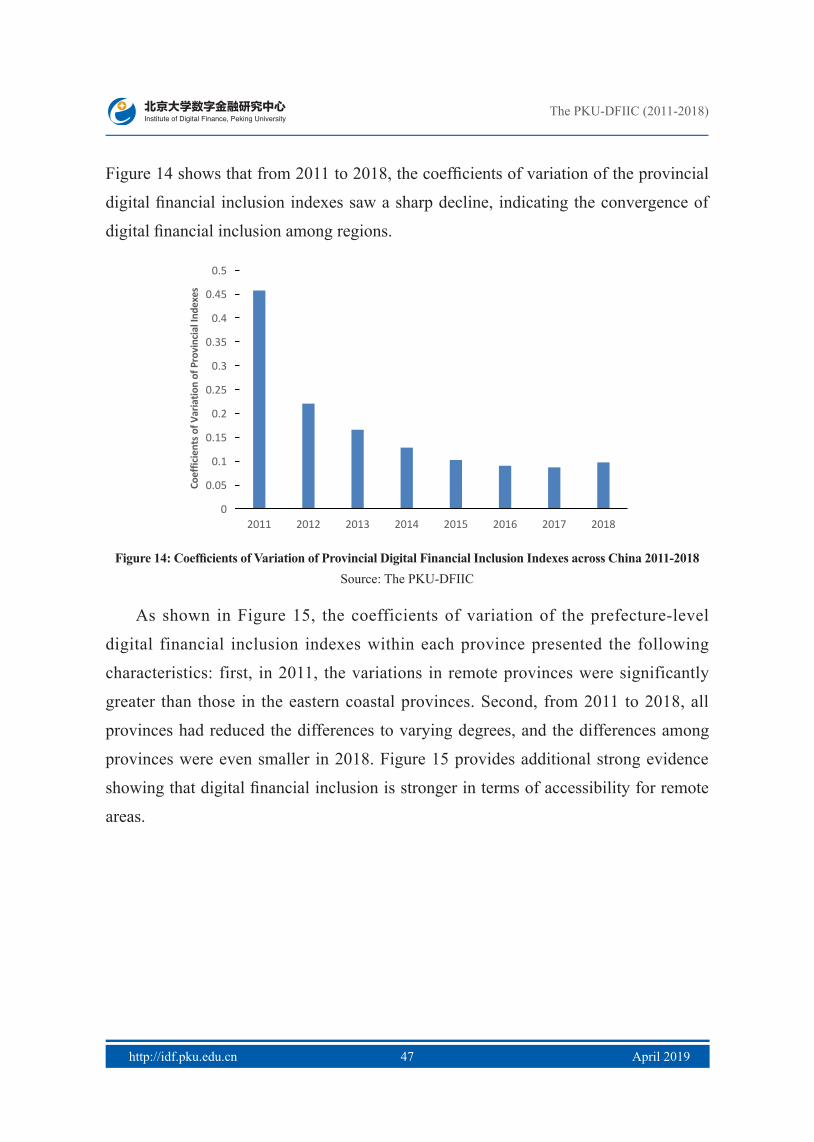
The PKU-DFIIC (2011-2018)
http://idf.pku.edu.cn April 201946 47
Figure 14 shows that from 2011 to 2018, the coefficients of variation of the provincial
digital financial inclusion indexes saw a sharp decline, indicating the convergence of
digital financial inclusion among regions.
0
0.05
0.1
0.15
0.2
0.25
0.3
0.35
0.4
0.45
0.5
2011 2012 2013 2014 2015 2016 2017 2018
Coe
ffici
ents
of V
aria
tion
of P
rovi
ncia
l Ind
exes
Figure 14: Coefficients of Variation of Provincial Digital Financial Inclusion Indexes across China 2011-2018Source: The PKU-DFIIC
As shown in Figure 15, the coefficients of variation of the prefecture-level
digital financial inclusion indexes within each province presented the following
characteristics: first, in 2011, the variations in remote provinces were significantly
greater than those in the eastern coastal provinces. Second, from 2011 to 2018, all
provinces had reduced the differences to varying degrees, and the differences among
provinces were even smaller in 2018. Figure 15 provides additional strong evidence
showing that digital financial inclusion is stronger in terms of accessibility for remote
areas.
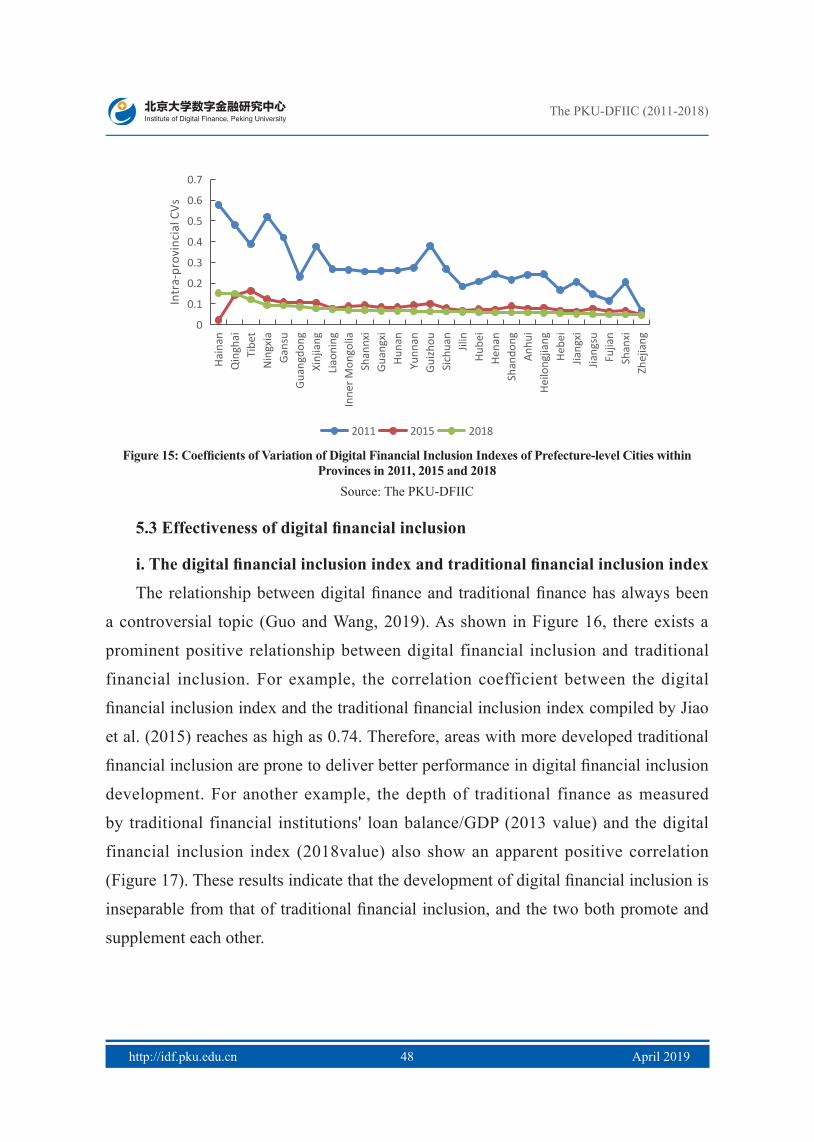
The PKU-DFIIC (2011-2018)
http://idf.pku.edu.cn April 201948 49
0
0.1
0.2
0.3
0.4
0.5
0.6
0.7
Hain
anQ
ingh
aiTi
bet
Nin
gxia
Gan
suG
uang
dong
Xinj
iang
Liao
ning
Inne
r Mon
golia
Shan
nxi
Gua
ngxi
Huna
nYu
nnan
Gui
zhou
Sich
uan
Jilin
Hube
iHe
nan
Shan
dong
Anhu
iHe
ilong
jiang
Hebe
iJia
ngxi
Jiang
suFu
jian
Shan
xiZh
ejia
ng
Intr
a-pr
ovin
cial
CVs
2011 2015 2018
Figure 15: Coefficients of Variation of Digital Financial Inclusion Indexes of Prefecture-level Cities within Provinces in 2011, 2015 and 2018
Source: The PKU-DFIIC
5.3 Effectiveness of digital financial inclusion
i. The digital financial inclusion index and traditional financial inclusion index
The relationship between digital finance and traditional finance has always been
a controversial topic (Guo and Wang, 2019). As shown in Figure 16, there exists a
prominent positive relationship between digital financial inclusion and traditional
financial inclusion. For example, the correlation coefficient between the digital
financial inclusion index and the traditional financial inclusion index compiled by Jiao
et al. (2015) reaches as high as 0.74. Therefore, areas with more developed traditional
financial inclusion are prone to deliver better performance in digital financial inclusion
development. For another example, the depth of traditional finance as measured
by traditional financial institutions' loan balance/GDP (2013 value) and the digital
financial inclusion index (2018value) also show an apparent positive correlation
(Figure 17). These results indicate that the development of digital financial inclusion is
inseparable from that of traditional financial inclusion, and the two both promote and
supplement each other.

The PKU-DFIIC (2011-2018)
http://idf.pku.edu.cn April 201948 49
0
0.1
0.2
0.3
0.4
0.5
0.6
0.7
0 50
100 150 200 250 300 350 400
Beiji
ng
Tian
jin
Hebe
i Sh
anxi
In
ner M
ongo
liaLi
aoni
ng
Jilin
He
ilong
jiang
Sh
angh
ai
Jiang
su
Zhej
iang
An
hui
Fujia
n Jia
ngxi
Sh
ando
ng
Hena
n Hu
bei
Huna
n G
uang
dong
G
uang
xiHa
inan
Ch
ongq
ing
Sich
uan
Gui
zhou
Yu
nan
Tibe
tSh
aanx
i G
ansu
Q
ingh
ai
Nin
gxia
Xinj
iang
PKU-DFIIC(left) Jiao et al. (right)
Figure 16: The Traditional/Digital Financial Inclusion IndexSource: The PKU-DFIIC and Jiao et al. (2015)
150
170
190
210
230
250
270
290
310
330
350
0 0.5 1 1.5 2 2.5 3
Digi
tal
Fina
ncia
l Inc
lusi
on In
dex
Financial Institutions' Loan Balance/GDP
Figure 17: Financial Institutions' Loan Balance/GDP and the Digital Financial Inclusion IndexSource: The PKU-DFIIC, China Statistical Yearbook for Regional Economy
ii. Digital financial inclusion and economic development
The charts visualized above show that eastern regions with relatively developed
economies have relatively higher digital financial inclusion indexes. Now, we will
further analyze the direct relationship between the digital financial inclusion index and
economic development. According to Figure 18, the regions with better performance
in terms of economic development are more developed in digital financial inclusion.

The PKU-DFIIC (2011-2018)
http://idf.pku.edu.cn April 201950 51
However, there do exist some cities—mainly resource-based cities—that have high
GDP per capita but a low digital financial inclusion index. The positive correlation
between the digital financial inclusion index and economic development is mainly
attributed to the breadth of coverage and the depth of usage for digital financial
inclusion (Figures 19 and 20), while the level of digitization is more weakly correlated
with economic development (Figure 21). However, we merely present the direct
correlation between digital financial inclusion and traditional financial inclusion, or
economic development, at an absolute level rather than a causal relation. Rigorous
conclusions would require a more in-depth analysis.
150.00
170.00
190.00
210.00
230.00
250.00
270.00
290.00
310.00
330.00
0 50000 100000 150000 200000
Digi
tal
Fina
ncia
l Inc
lusi
on In
dex
GDP Per Capita
Figure 18: GDP Per Capita and the Digital Financial Inclusion IndexSource: The PKU-DFIIC, China Statistical Yearbook for Regional Economy
50
100
150
200
250
300
350
0 50000 100000 150000 200000
Cove
rage
Bre
adth
of D
igita
l Fin
ance
GDP Per Capita
Figure 19: GDP Per Capita and Coverage Breadth of Digital Financial InclusionSource: The PKU-DFIIC, China Statistical Yearbook for Regional Economy

The PKU-DFIIC (2011-2018)
http://idf.pku.edu.cn April 201950 51
150
170
190
210
230
250
270
290
310
330
0 50000 100000 150000 200000
Usa
ge D
epth
of D
igita
l Fin
ance
GDP Per Capita
Figure 20: GDP Per Capita and Usage Depth of Digital Financial InclusionSource: The PKU-DFIIC, China Statistical Yearbook for Regional Economy
150
170
190
210
230
250
270
290
310
330
350
0 50000 100000 150000 200000
Digi
taliz
atio
n Le
vel o
f In
clus
ive
Fina
nce
GDP Per Capita
Figure 21: GDP Per Capita and Digitalization Level of Financial InclusionSource: The PKU-DFIIC, China Statistical Yearbook for Regional Economy
5.4 The top 20 countries are mainly distributed in Hangzhou and Shanghai
While compiling the digital financial inclusion index at the county level, in
addition to the counties/banners and county-level cities that were previously included,
we also incorporated municipal districts for unified index compilation and ranking.
As shown in Table 14, based on the digital financial inclusion index at the county
level, the counties ranking at the top were mostly from eastern China, especially the
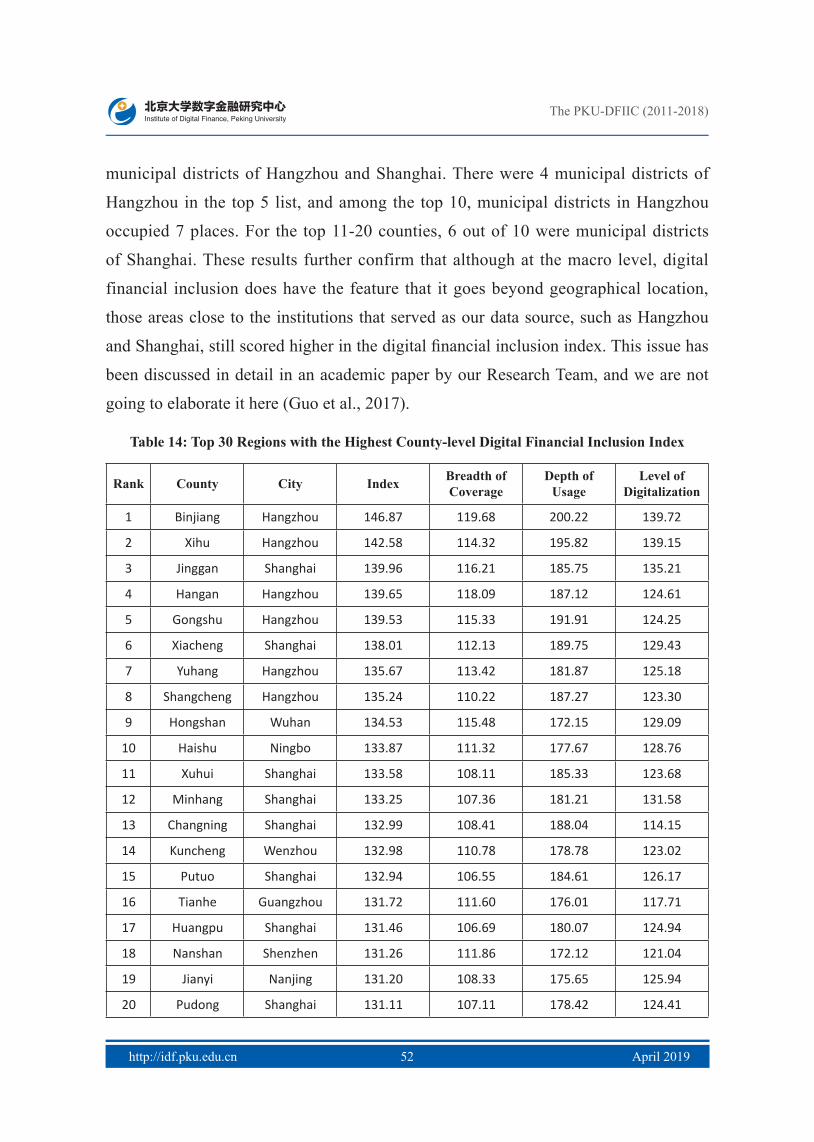
The PKU-DFIIC (2011-2018)
http://idf.pku.edu.cn April 201952 53
municipal districts of Hangzhou and Shanghai. There were 4 municipal districts of
Hangzhou in the top 5 list, and among the top 10, municipal districts in Hangzhou
occupied 7 places. For the top 11-20 counties, 6 out of 10 were municipal districts
of Shanghai. These results further confirm that although at the macro level, digital
financial inclusion does have the feature that it goes beyond geographical location,
those areas close to the institutions that served as our data source, such as Hangzhou
and Shanghai, still scored higher in the digital financial inclusion index. This issue has
been discussed in detail in an academic paper by our Research Team, and we are not
going to elaborate it here (Guo et al., 2017).
Table 14: Top 30 Regions with the Highest County-level Digital Financial Inclusion Index
Rank County City Index Breadth of Coverage
Depth of Usage
Level of Digitalization
1 Binjiang Hangzhou 146.87 119.68 200.22 139.72
2 Xihu Hangzhou 142.58 114.32 195.82 139.15
3 Jinggan Shanghai 139.96 116.21 185.75 135.21
4 Hangan Hangzhou 139.65 118.09 187.12 124.61
5 Gongshu Hangzhou 139.53 115.33 191.91 124.25
6 Xiacheng Shanghai 138.01 112.13 189.75 129.43
7 Yuhang Hangzhou 135.67 113.42 181.87 125.18
8 Shangcheng Hangzhou 135.24 110.22 187.27 123.30
9 Hongshan Wuhan 134.53 115.48 172.15 129.09
10 Haishu Ningbo 133.87 111.32 177.67 128.76
11 Xuhui Shanghai 133.58 108.11 185.33 123.68
12 Minhang Shanghai 133.25 107.36 181.21 131.58
13 Changning Shanghai 132.99 108.41 188.04 114.15
14 Kuncheng Wenzhou 132.98 110.78 178.78 123.02
15 Putuo Shanghai 132.94 106.55 184.61 126.17
16 Tianhe Guangzhou 131.72 111.60 176.01 117.71
17 Huangpu Shanghai 131.46 106.69 180.07 124.94
18 Nanshan Shenzhen 131.26 111.86 172.12 121.04
19 Jianyi Nanjing 131.20 108.33 175.65 125.94
20 Pudong Shanghai 131.11 107.11 178.42 124.41
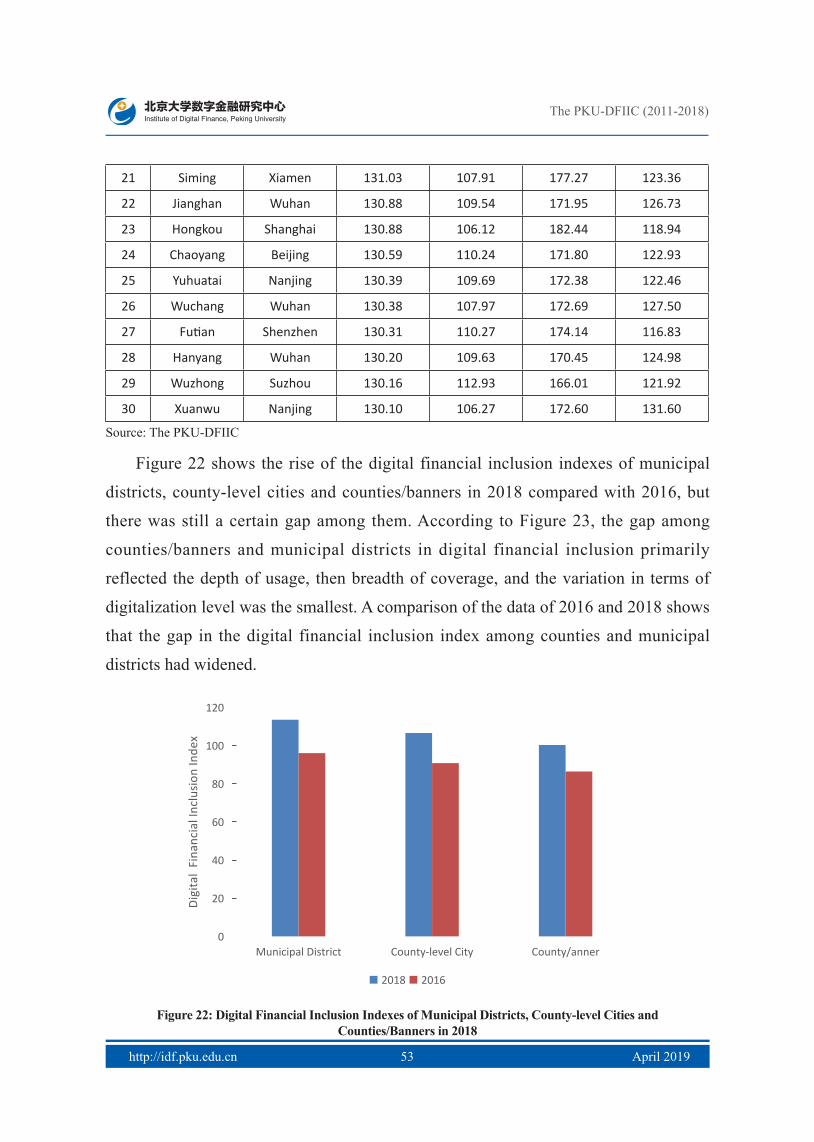
The PKU-DFIIC (2011-2018)
http://idf.pku.edu.cn April 201952 53
21 Siming Xiamen 131.03 107.91 177.27 123.36
22 Jianghan Wuhan 130.88 109.54 171.95 126.73
23 Hongkou Shanghai 130.88 106.12 182.44 118.94
24 Chaoyang Beijing 130.59 110.24 171.80 122.93
25 Yuhuatai Nanjing 130.39 109.69 172.38 122.46
26 Wuchang Wuhan 130.38 107.97 172.69 127.50
27 Futian Shenzhen 130.31 110.27 174.14 116.83
28 Hanyang Wuhan 130.20 109.63 170.45 124.98
29 Wuzhong Suzhou 130.16 112.93 166.01 121.92
30 Xuanwu Nanjing 130.10 106.27 172.60 131.60
Source: The PKU-DFIIC
Figure 22 shows the rise of the digital financial inclusion indexes of municipal
districts, county-level cities and counties/banners in 2018 compared with 2016, but
there was still a certain gap among them. According to Figure 23, the gap among
counties/banners and municipal districts in digital financial inclusion primarily
reflected the depth of usage, then breadth of coverage, and the variation in terms of
digitalization level was the smallest. A comparison of the data of 2016 and 2018 shows
that the gap in the digital financial inclusion index among counties and municipal
districts had widened.
0
20
40
60
80
100
120
Municipal District County-level City County/anner
Digi
tal
Fina
ncia
l Inc
lusi
on In
dex
2018 2016
Figure 22: Digital Financial Inclusion Indexes of Municipal Districts, County-level Cities andCounties/Banners in 2018
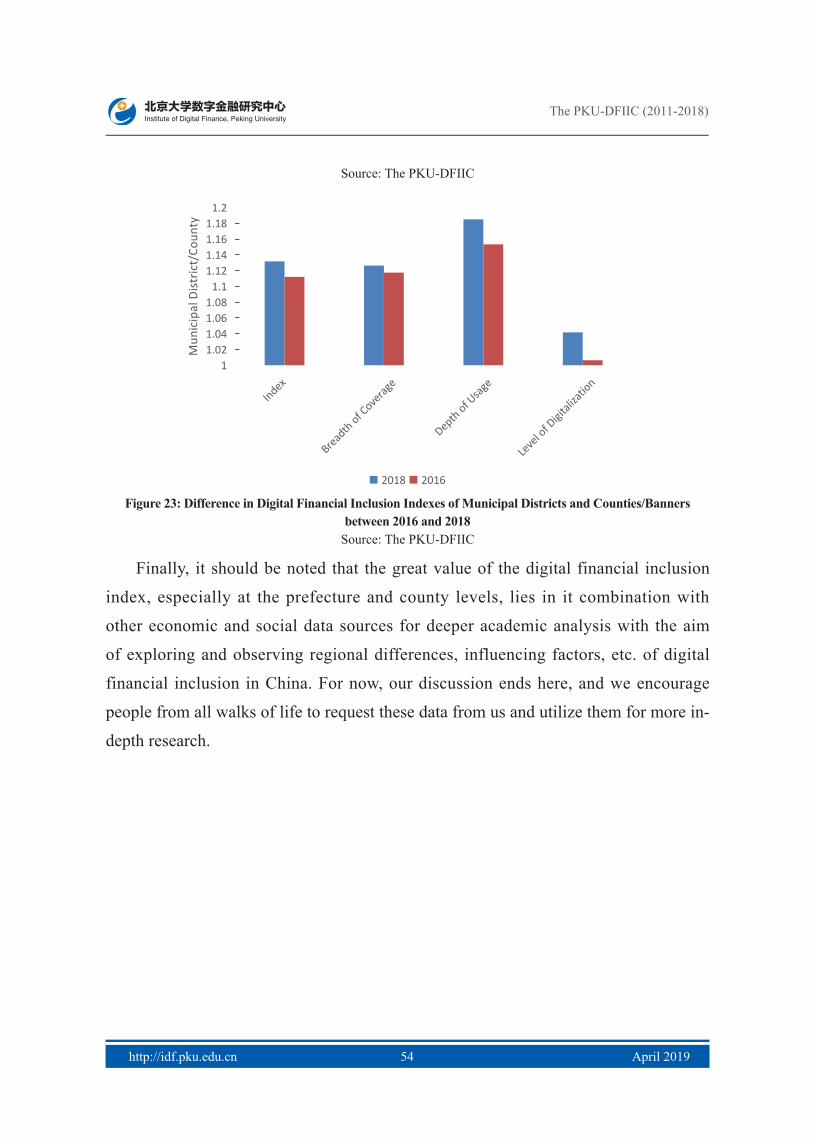
The PKU-DFIIC (2011-2018)
http://idf.pku.edu.cn April 201954 55
Source: The PKU-DFIIC
11.021.041.061.08
1.11.121.141.161.18
1.2
Index
Breadth of C
overag
e
Depth of Usag
e
Leve
l of D
igital
izatio
n
Mun
icip
al D
istr
ict/
Coun
ty
2018 2016
Figure 23: Difference in Digital Financial Inclusion Indexes of Municipal Districts and Counties/Banners between 2016 and 2018
Source: The PKU-DFIIC
Finally, it should be noted that the great value of the digital financial inclusion
index, especially at the prefecture and county levels, lies in it combination with
other economic and social data sources for deeper academic analysis with the aim
of exploring and observing regional differences, influencing factors, etc. of digital
financial inclusion in China. For now, our discussion ends here, and we encourage
people from all walks of life to request these data from us and utilize them for more in-
depth research.

The PKU-DFIIC (2011-2018)
http://idf.pku.edu.cn April 201954 55
6. Conclusions
To compile this Index, we have referred to the existing literature, especially the
literature on the compilation of traditional financial inclusion indexes, while taking
into account the characteristics of digital financial inclusion and utilizing the massive
dataset of Ant Financial on financial inclusion. Based on the 2011-2015 digital
financial inclusion indexes at the provincial, prefecture and county levels prepared in
2016, this report has updated the relevant indexes for 2016-2018. The compilation of
the Stage II Index has continued the basic structure of the Stage I Index, guaranteeing
the continuity of indexes, while also making some innovations, especially expanding
and improving the subindexes of digital finance, the level of digitalization, and
incorporating municipal districts into the county-level indexes.
Based on the above index preparation methods and major data results, this report
has drawn the following basic conclusions: digital financial inclusion is an important
model for realizing low-cost, broad coverage and sustainable financial inclusion. The
practices of digital financial inclusion over the past few years offer preliminary proof
of the feasibility and reproducibility of this model. In particular, digital financial
inclusion provides possibilities for economically undeveloped areas to catch up with
and surpass other areas in the sector of financial inclusion and lays a foundation for
low-income and disadvantaged groups to have access to low-cost financial services.
Furthermore, compared with the indexes for 2011-2015, the digital financial inclusion
indexes for 2016-2018 have undergone significant changes. In particular, the growth
of the digital financial inclusion indexes has shifted to the depth of usage in recent
years, which proves that China’s digital financial inclusion has passed the era of
extensive enclosure and is embracing a new stage and a new era characterized by deep
expansion.
Although we have made improvements to the methods from preparing the
Stage I Index that were developed in 2016, especially the measurement of the
level of digitization, which is now more comprehensive and complete, it must be

The PKU-DFIIC (2011-2018)
http://idf.pku.edu.cn April 201956 57
acknowledged that there is still room for improvement in this research. For example,
restricted by the availability of data and the compatibility of data from different
organizations, this report has selected the Ant Financial Services Group as the sole
data source, so it cannot depict the development landscape of China’s digital financial
inclusion in a comprehensive manner. Taking Guangdong as an example, the province
with the highest GDP in the country only ranked No. 6 in this Index due to its long
distance from Hangzhou, among other reasons. However, considering the absence
of the measurement of cross-regional development in digital financial inclusion, this
Index provides a rough measurement of the development of digital financial inclusion
in various regions for people from all walks of life and for reference by researchers,
regulators and industry insiders.

The PKU-DFIIC (2011-2018)
http://idf.pku.edu.cn April 201956 57
References
Chen Yin’e, Sun Qiong, Xu Wenyun, “Dynamic and Spatial Convergent of
Distribution of China’s Financial Inclusion Development”, Financial Economics
Research, 2015, (6), pp.72-81.
Guo Feng, Kong Tao, Wang Jingyi, “The Spatial Agglomeration Effect of
Internet Financial: Evidence from the Financial Development Index”, Studies of
International Finance, 2017, (8), pp.75-85.
Guo Feng, Wang Yaopei, “Formal Financial Basis, Knowledge Threshold and Digital
Finance for Farmers”, Journal of Fiance and Economics, forthcoming, 2019.
Guo Tianyong, Ding Xiao, “An International Comparative Study on Financial
Inclusion – From the Perspective of Banking Services”, Studies of International
Finance, 2015, (2), pp.55-64.
Jiao Jinpu, “Importance of Building a Financial Inclusion System”, China
Finance, 2010, (10), pp.12-13.
Jiao Jinpu, “Analysis on the Application of Mobile Payment in Promoting
the Financial Inclusion Development and Related Policy Suggestions”, China
Business and Market, 2014, (7), pp.7-10.
Jiao Jinpu, Huang Tingting, Wang Tiandu, Zhang Shaohua, Wang Tian, “China's
Financial Inclusion Development Process and Empirical Research”, Shanghai
Finance, 2015, (4), pp.12-22.
Jiao Jinpu, Sun Tianqi, Huang Tingting, Wang Tiandu, “Digital Currency and the
Development of Financial Inclusions – the Theoretical Framework, International
Practice and Regulation System”, Financial Regulation Research, 2015, (7),
pp.19-35.
Li Jizun, “Study on Internet Finance”, Management World, 2015, (7), pp.1-7.
Peng Fei, Yuan Wei, Hui Zhengqin, “Research on Exponential Efficacy Function
for Comprehensive Evaluation”, Statistical Research, 2007, (12), pp.29-34.
Research Group of Institute of Digital Finance, Peking University (Guo
Feng, Kong Tao, Wang Jingyi, Cheng Zhiyun, Ruan Fangyuan, Shao Genfu,
[1]
[2]
[3]
[4]
[5]
[6]
[7]
[8]
[9]
[10]
[11]
The PKU-DFIIC (2011-2018)
http://idf.pku.edu.cn April 201958 59
Wang Fang, Yang Jing), “The Creation and Analysis of the Internet Finance
Development Index”, New Finance Review, 2016, (1), pp.101-129.
Research Group of Institute of Digital Finance, Peking University, Chinese
Practice of Digital Financial Inclusion, Beijing: China Renmin University Press,
August 2017.
Research Group of Institute of Digital Finance, Peking University, Technology
Empowerment: The Business Practices of Digital Finance in China, Beijing:
China Renmin University Press, July 2018.
Research Group of Institute of Digital Finance, Peking University, Digital
Finance: Enhancing the Real Economy, Beijing: China Renmin University Press,
August 2018.
The World Bank Group, Global Financial Development Report 2014: Financial
Inclusion, Beijing: China Financial & Economic Publishing House, October 2015
Wang Wei, Tian Jie, Li Peng, “Analysis of Spatial Differences and Influencing
Factors of Financial Exclusion in China”, Southwest Finance, 2011, (3), pp.14-17.
Wang Ying, Lu Lei, “Financial Inclusion System and Financial Stability”, Journal
of Financial Development Research, 2012, (2), pp.4-10.
Wu Xuchuan, Xiao Xiang, “Study on the Financial Inclusion Index in A Global
Perspective”, South China Finance, 2014, (6), pp.15-20.
Xiao Xiang, Hong Xin, “Research on the Compilation of Financial Inclusion
Index”, Wuhan Finance, 2014, (9), pp. 7-11.
Xie Ping, Zou Chuanwei, “A Study on Internet Based Financial Models”, Journal
of Financial Research, 2012, (12), pp. 11-22.
Xie Xuanli, Shen Yan, Zhang Haoxing, Guo Feng, “Can Digital Finance Promote
Entrepreneurship? Evidence from China”, China Economic Quarterly, 2018,
17(4), pp. 1557-1580.
Zeng Xinghui, Wu Xia, Li Wei, Liao Yanping, Liu Xi, “Research on System of
Statistical Indexes for Measuring Financial Inclusion in China”, PBOC Working
Paper, NO.2014/5, 2014.
Zhang Xun, Wan Guanghua, Zhang Jiajia, He Zongyue, “Digital Finance and
[12]
[13]
[14]
[15]
[16]
[17]
[18]
[19]
[20]
[21]
[22]
[23]

The PKU-DFIIC (2011-2018)
http://idf.pku.edu.cn April 201958 59
Inclusive Growth”, Working Paper of Institute of Digital Finance, Peking
University, 2018.
Financial Consumer Rights Protection Bureau under PBOC, “2017 Report for
Financial Inclusion Index of China”, PBOC Research Report, August 2018.
Beck, T., Demirguc-Kunt, A., Martinez Peria, M. S., “Reaching Out: Access to
and Use of Banking Services Across Countries”, Journal of Financial Economics,
2007,85(1), pp.234-266.
Chattopadhyay, S. K., “Financial Inclusion in India: A Case-study of West
Bengal”, Reserve Bank of India Working Paper, 2011.
Chen, L., “From Fintech to Finlife: the case of Fintech Development in China”,
China Economic Journal, 2016, 9(3), pp.225-239..
Demirguc-Kunt, A. and Klapper, L., “Measuring Financial Inclusion: The Global
Findex Database”, Policy Research Working Paper Series, No.6025, 2012.
Guo, F., S. T. Kong and J. Wang, “General Patterns and Regional Disparity of
Internet Finance Development in China: Evidence from the Peking University
Internet Finance Development Index”, China Economic Journal, 2016, 9(3), 253-271.
Global Parternship for Financial Inclusion, 2013, G20 Financial Inclusion Index.Kapoor, A., “Financial Inclusion and the Future of the Indian Economy”, Futures,
2013, (10), pp.35-42.
Sarma, M., “Index of Financial Inclusion-A measure of financial sector
inclusiveness”, Berlin Working Papers on Money, Finance, Trade and
Development, 2012, No. 07/2012.
[24]
[25]
[26]
[27]
[28]
[29]
[30]
[31]
[32]

The PKU-DFIIC (2011-2018)
http://idf.pku.edu.cn April 201960 61
Appendix 1: The Provincial PKU-DFIIC 2011-2018Table A1:The Provincial Digital Financial Inclusion Index and Sub-indexes of 2011
Province Index Breadth ofCoverage
Depth ofUsage Payment Insurance Credit Level of
Digitalization
Beijing 79.41 97.53 72.23 79.4 59.48 76.75 32.59
Tianjin 60.58 69.37 53.33 55.52 75.74 43.73 44.72
Hebei 32.42 18.46 44.19 24.36 24.83 54.49 57.15
Shanxi 33.41 28.94 21.61 19.48 20.25 22.42 69.57
Inner Mongolia 28.89 24.65 30.27 27.51 49.83 22.42 40.35
Liaoning 43.29 44.96 44.64 49.24 48.98 42.31 35.33
Jilin 24.51 23.75 24.04 23.89 23.85 24.13 27.86
Heilongjiang 33.58 21.12 36.28 33.74 39.37 35.28 69.83
Shanghai 80.19 98.85 86.24 100 72.82 90.3 7.58
Jiangsu 62.08 66.7 79.22 80.77 78.49 79.35 15.71
Zhejiang 77.39 85.53 93.52 96.52 100 90.48 21.22
Anhui 33.07 20.2 55.58 49.04 40.63 62.54 34.66
Fujian 61.76 63.28 68.51 77.26 46.12 76.87 44.5
Jiangxi 29.74 13.97 54.82 56.7 46.6 58.04 36.21
Shandong 38.55 33.67 47.16 44.24 9.07 63.38 39.01
Henan 28.4 13.54 38.11 38.37 0.25 53.88 59.81
Hubei 39.82 35.17 53.56 69.15 44.82 55.47 30.18
Hunan 32.68 15.33 60.73 53.36 51.76 65.29 39.02
Guangdong 69.48 63.41 80.97 59.96 50.69 95.96 68.66
Guangxi 33.89 19.98 44.06 52.17 42.03 44 61.33
Hainan 45.56 30.96 57.74 60.56 61.02 56.06 71.63
Chongqing 41.89 40.38 47.46 59.24 57.04 42.14 36.77
Sichuan 40.16 29.02 58.56 45.49 73.61 53.74 43.5
Guizhou 18.47 3.06 27.51 49.21 47.38 16.79 52.92
Yunan 24.91 7.47 48.39 55.11 82.08 33.58 39.81
Tibet 16.22 3.37 30.16 0 66.3 18.46 33.33
Shaanxi 40.96 37.81 29.74 34.44 26.16 30.71 71.74
Gansu 18.84 4.99 12.76 10.82 6.48 15.59 75.61
Qinghai 18.33 1.96 6.76 0 21.99 1.16 93.42
Ningxia 31.31 32.27 23.16 15.68 41.09 16.51 42.96
Xinjiang 20.34 12.92 23.6 21.47 51.84 12.05 38.92
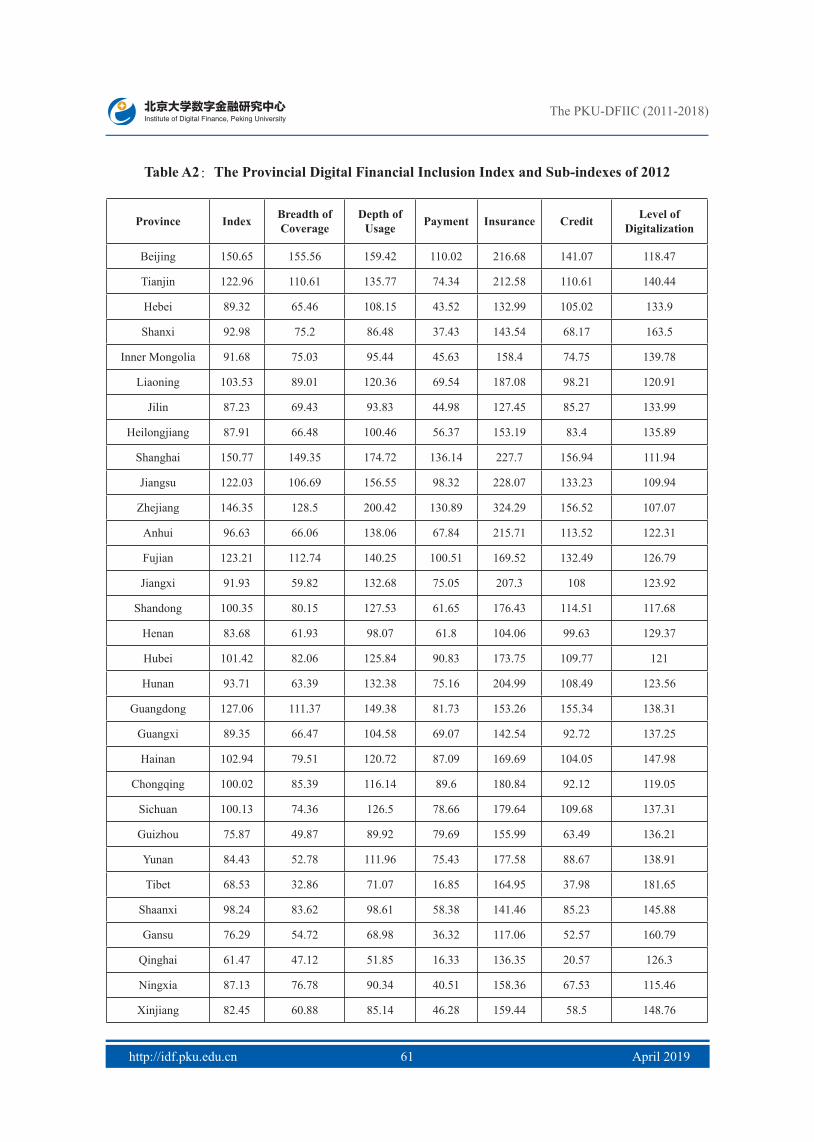
The PKU-DFIIC (2011-2018)
http://idf.pku.edu.cn April 201960 61
Table A2:The Provincial Digital Financial Inclusion Index and Sub-indexes of 2012
Province Index Breadth ofCoverage
Depth ofUsage Payment Insurance Credit Level of
Digitalization
Beijing 150.65 155.56 159.42 110.02 216.68 141.07 118.47
Tianjin 122.96 110.61 135.77 74.34 212.58 110.61 140.44
Hebei 89.32 65.46 108.15 43.52 132.99 105.02 133.9
Shanxi 92.98 75.2 86.48 37.43 143.54 68.17 163.5
Inner Mongolia 91.68 75.03 95.44 45.63 158.4 74.75 139.78
Liaoning 103.53 89.01 120.36 69.54 187.08 98.21 120.91
Jilin 87.23 69.43 93.83 44.98 127.45 85.27 133.99
Heilongjiang 87.91 66.48 100.46 56.37 153.19 83.4 135.89
Shanghai 150.77 149.35 174.72 136.14 227.7 156.94 111.94
Jiangsu 122.03 106.69 156.55 98.32 228.07 133.23 109.94
Zhejiang 146.35 128.5 200.42 130.89 324.29 156.52 107.07
Anhui 96.63 66.06 138.06 67.84 215.71 113.52 122.31
Fujian 123.21 112.74 140.25 100.51 169.52 132.49 126.79
Jiangxi 91.93 59.82 132.68 75.05 207.3 108 123.92
Shandong 100.35 80.15 127.53 61.65 176.43 114.51 117.68
Henan 83.68 61.93 98.07 61.8 104.06 99.63 129.37
Hubei 101.42 82.06 125.84 90.83 173.75 109.77 121
Hunan 93.71 63.39 132.38 75.16 204.99 108.49 123.56
Guangdong 127.06 111.37 149.38 81.73 153.26 155.34 138.31
Guangxi 89.35 66.47 104.58 69.07 142.54 92.72 137.25
Hainan 102.94 79.51 120.72 87.09 169.69 104.05 147.98
Chongqing 100.02 85.39 116.14 89.6 180.84 92.12 119.05
Sichuan 100.13 74.36 126.5 78.66 179.64 109.68 137.31
Guizhou 75.87 49.87 89.92 79.69 155.99 63.49 136.21
Yunan 84.43 52.78 111.96 75.43 177.58 88.67 138.91
Tibet 68.53 32.86 71.07 16.85 164.95 37.98 181.65
Shaanxi 98.24 83.62 98.61 58.38 141.46 85.23 145.88
Gansu 76.29 54.72 68.98 36.32 117.06 52.57 160.79
Qinghai 61.47 47.12 51.85 16.33 136.35 20.57 126.3
Ningxia 87.13 76.78 90.34 40.51 158.36 67.53 115.46
Xinjiang 82.45 60.88 85.14 46.28 159.44 58.5 148.76

The PKU-DFIIC (2011-2018)
http://idf.pku.edu.cn April 201962 63
Table A3:The Provincial Digital Financial Inclusion Index and Sub-indexes of 2013
Province Index Breadth ofCoverage
Depth ofUsage Payment Insurance Monetary
fund Credit Level ofDigitalization
Beijing 215.62 193.86 247.5 136.53 617.63 94.21 131.17 229.57
Tianjin 175.26 146.54 197.52 110.17 511.81 53.85 100.24 229.67
Hebei 144.98 105.66 162.85 64.92 422.49 24.22 88.71 242.35
Shanxi 144.22 115.4 139.08 61.87 422.74 14.73 50.21 248.75
Inner Mongolia 146.59 116.37 138.84 73.66 369.88 4.22 72.3 260.45
Liaoning 160.07 126.67 181.54 93.89 485.17 27.93 90.42 231.33
Jilin 138.36 106.85 147.95 72.92 396.34 8.92 76.01 224.97
Heilongjiang 141.4 104.49 152.58 80.25 418.82 13.87 72.84 242.97
Shanghai 222.14 187.31 280.93 169.95 680.74 100 156.87 230.3
Jiangsu 180.98 144.68 223.09 128.77 543.88 70.02 125.46 224.3
Zhejiang 205.77 167.96 265.48 166.23 649.99 95.21 144.69 222.12
Anhui 150.83 106.51 190.86 95.33 493.54 37.52 100.96 224.45
Fujian 183.1 157.43 194.12 130.14 436.21 60.94 122.6 247.85
Jiangxi 146.13 99.81 183.73 102.46 478.45 43.19 93.4 230.78
Shandong 159.3 122.01 189.07 89.87 483.75 45.87 101.22 228.32
Henan 142.08 105.06 155.23 87.45 395.02 31.51 83.51 240.42
Hubei 164.76 123.74 197.04 111.2 511.31 53.97 99.5 241.51
Hunan 147.71 103.46 175 100.22 454.11 34.87 90.4 244.25
Guangdong 184.78 153.33 208.44 106.47 466.62 59.28 137.12 245.61
Guangxi 141.46 106.97 153.84 99.06 417 20.3 72.55 232.82
Hainan 158.26 121.75 173.37 110.76 468.48 32.71 80.81 251.39
Chongqing 159.86 125.27 178.2 113.4 471.66 35.23 86.97 240.74
Sichuan 153.04 114.03 176.71 102.38 445.78 35.62 96.41 238.82
Guizhou 121.22 89.59 125.46 100.53 384.99 0 41 217.93
Yunan 137.9 95.59 153.55 97.13 413.08 26.56 72.86 249.15
Tibet 115.1 74.09 112.84 63.75 363.27 21.4 29.17 254.65
Shaanxi 148.37 123.6 145.94 78.61 399.93 23.61 68 234.55
Gansu 128.39 96.77 114.2 69.51 357.1 3.33 36.43 258.6
Qinghai 118.01 88.18 113.42 63.67 389.3 3.26 22.35 224.82
Ningxia 136.74 115.08 129.02 44.5 399.35 3.37 46.74 222.32
Xinjiang 143.4 101.44 146.39 76.03 422.5 24.01 59.57 276.48

The PKU-DFIIC (2011-2018)
http://idf.pku.edu.cn April 201962 63
Table A4:The Provincial Digital Financial Inclusion Index and Sub-indexes of 2014
Province Index Breadth ofCoverage
Depth ofUsage Payment Insurance Monetary
fund Investment Credit Level ofDigitalization
Beijing 235.36 243.92 219.89 196.25 663.95 209.83 94.93 120.76 235.22
Tianjin 200.16 193.86 180.28 165.52 576.75 166.06 59.55 97.95 257.11
Hebei 160.76 149.97 131.34 114.97 423.99 126.08 27.5 79.94 249.86
Shanxi 167.66 163.16 124.78 117.06 462.67 122.03 20.44 53.43 260.43
Inner Mongolia 172.56 165.46 114.88 117.47 428.7 111.48 9.2 53.41 300.84
Liaoning 187.61 175.49 162.89 143.45 550.31 139.88 40.66 87.32 272.53
Jilin 165.62 154.91 136.01 118.63 462.03 119.15 30.66 73.74 254.75
Heilongjiang 167.8 152.48 142.48 127.57 484.01 129.53 32.27 75.98 264.41
Shanghai 239.53 237.02 242.78 225.1 725.26 220.53 96.62 142.88 241.88
Jiangsu 204.16 193.18 201.09 184.42 611.07 182.13 72.09 119.53 246.02
Zhejiang 224.45 217.48 233.67 224.06 687.54 206.83 96.58 139.65 230.71
Anhui 180.59 156.56 173.84 151.5 547.03 151.28 59.96 98.99 272.22
Fujian 202.59 204.22 164.85 181.25 457.02 161.83 37.59 124.93 265.76
Jiangxi 175.69 148.73 167.19 154.14 535.69 148.08 44.25 98.59 280.18
Shandong 181.88 169.89 161.19 142.07 511.64 151.85 49.31 91.92 259.08
Henan 166.65 157.52 132.24 137.08 415.49 136.22 23.47 84.05 259.31
Hubei 190.14 176.61 175.7 165.88 548.79 162.44 59.01 99.75 261.07
Hunan 167.27 150.42 153.46 148.44 479.47 139.81 40.84 94.02 247.99
Guangdong 201.53 199.63 175.04 156.69 485.07 159.13 56.45 128.04 255.98
Guangxi 166.12 154.29 139.98 139.02 449.06 115.7 36.92 82.67 252.66
Hainan 179.62 170.99 153.8 157.71 529.76 136.61 42.99 71.93 255.03
Chongqing 184.71 175.57 157.88 158.33 514.01 141.85 34.8 92.5 263.63
Sichuan 173.82 162.58 159.82 149.32 499.44 140.04 46.33 96.92 236.39
Guizhou 154.62 139.9 114.08 126.53 421.51 95.77 10.18 55.52 276.9
Yunan 164.05 147.22 144.3 134.42 475.79 123.72 35.1 82.03 255.54
Tibet 143.91 126.67 108.76 113.51 450.07 126.67 19.73 21.11 264.7
Shaanxi 178.73 173.25 139 122.05 472.64 131.49 32.45 72.71 269
Gansu 159.76 148.1 107.29 111.91 426.42 110.28 11.49 35.84 293.6
Qinghai 145.93 139.24 108.4 109.16 443.05 111.57 22.21 24.58 236.23
Ningxia 165.26 167.18 114.28 111.45 446.04 111.85 14.42 41.97 251.55
Xinjiang 163.67 151.28 134.87 133.48 487.16 134.97 39.1 50.72 256.91

The PKU-DFIIC (2011-2018)
http://idf.pku.edu.cn April 201964 65
Table A5:The Provincial Digital Financial Inclusion Index and Sub-indexes of 2015
Province Index Breadth ofCoverage
Depth ofUsage Payment Insurance Monetary
fund Investment Credit Creditinvestigation
Level ofDigitalization
Beijing 276.38 268.39 234.17 243.23 469.42 239.07 230.65 173.81 92.32 379.48
Tianjin 237.53 211.89 195.46 206.76 427.33 193.62 183.24 143.47 52.11 398.62
Hebei 199.53 172.78 151.45 161.59 306.8 162.76 144.95 127.69 0 375.2
Shanxi 206.3 186.14 141.52 159.41 337.67 156.65 124.49 97.75 21.99 390.57
Inner Mongolia 214.55 185.34 136.04 154.71 332.6 136.78 111.59 100.99 10.04 453.66
Liaoning 226.4 194.17 178.41 181.6 398.6 168.45 166.5 132.75 37.34 420.06
Jilin 208.2 175.49 154.68 166.01 343.1 152.29 149.57 113.84 20.53 413.47
Heilongjiang 209.93 174.68 164.06 170.1 363.16 163.96 168.8 111.5 33.75 409.72
Shanghai 278.11 258.98 259.81 268.49 521.32 252.66 246.52 201.7 99.92 374.54
Jiangsu 244.01 215.94 218.62 227.43 441.96 216.8 196.83 173.28 88.44 382.84
Zhejiang 264.85 239.33 251.29 270.92 518.33 243.83 233.82 196.9 74.43 373.77
Anhui 211.28 171.65 189.78 196.92 396.7 188.13 175.28 149.57 48.54 381.23
Fujian 245.21 226.6 198.23 230.19 396.13 198.59 140.07 185.79 62.59 392.01
Jiangxi 208.35 170.86 182.48 194.78 397.91 182.27 144.49 151.45 48.25 379.14
Shandong 220.66 192.11 178.15 186.17 372.83 187.49 165.04 141.22 33.02 392.16
Henan 205.34 181.5 151.05 174.98 307.69 171.16 127.15 130.9 15.71 382.73
Hubei 226.75 199.53 189.08 210.98 396.45 196.58 168.41 146.92 57.81 385.07
Hunan 206.38 170.07 174.47 186.49 371.97 171.84 150.14 143.89 34.65 384.24
Guangdong 240.95 225.52 195.87 207.36 365.29 194.22 155.49 187.62 55.21 373.79
Guangxi 207.23 176.33 153.46 177.23 341.68 145.27 108.67 133.25 38.33 406.94
Hainan 230.33 192.26 184.91 195.59 438.8 164.35 163.58 128.84 57.04 438.59
Chongqing 221.84 197.46 171.58 191.7 395.35 168.62 137.05 132.4 44.92 393.65
Sichuan 215.48 182.08 176.54 190.6 378.83 168.17 152.43 141.43 48.59 396.51
Guizhou 193.29 160.98 132.74 155.83 345.19 119.99 99.82 95.4 17.94 410.01
Yunan 203.76 167.96 158.79 168.47 383.48 144.2 126.27 122.14 27.86 403.67
Tibet 186.38 139.87 157.75 168.77 447.65 160.9 131.77 87.66 22.33 391.97
Shaanxi 216.12 194.92 157.95 162.76 355.33 161.98 142.39 116.87 35.15 391.85
Gansu 199.78 169.67 125.25 142.62 319.06 130.5 107.17 84.74 6.12 434.64
Qinghai 195.15 159.59 136.5 143.26 357.89 135.74 125.92 85.05 4.95 419.14
Ningxia 214.7 190.35 134.87 149.39 364.97 135.96 104.12 90.12 9.68 440.18
Xinjiang 205.49 172.01 148.6 165.46 397.95 155.11 125.97 92.83 10.14 419.4

The PKU-DFIIC (2011-2018)
http://idf.pku.edu.cn April 201964 65
Table A6:The Provincial Digital Financial Inclusion Index and Sub-indexes of 2016
Province Index Breadth ofCoverage
Depth ofUsage Payment Insurance Monetary
fund Investment Credit Creditinvestigation
Level ofDigitalization
Beijing 286.37 285.65 263.74 286.87 566.47 262.63 210.94 172.79 251.61 329.90
Tianjin 245.84 225.41 231.61 247.13 541.83 226.72 159.76 155.95 202.60 339.15
Hebei 214.36 191.55 196.87 214.64 434.79 213.26 125.48 145.45 174.72 321.46
Shanxi 224.81 205.51 189.38 206.37 451.07 201.16 101.35 134.39 187.73 352.96
Inner Mongolia 229.93 202.00 184.89 195.22 466.55 176.23 99.44 125.88 176.30 404.00
Liaoning 231.41 207.74 220.06 219.02 523.97 205.06 142.03 152.90 197.61 330.21
Jilin 217.07 191.94 204.14 209.46 482.14 195.40 124.46 144.93 189.90 323.59
Heilongjiang 221.89 191.24 206.54 214.35 496.97 204.83 122.77 142.58 195.35 350.97
Shanghai 282.22 274.25 281.48 309.09 615.25 278.98 222.35 190.79 233.86 309.94
Jiangsu 253.75 233.22 253.08 279.69 560.71 255.34 172.07 174.22 253.81 322.80
Zhejiang 268.10 254.44 270.62 316.53 608.21 279.39 192.47 189.77 212.02 308.66
Anhui 228.78 194.89 229.95 248.77 524.77 234.42 148.09 161.80 214.37 338.54
Fujian 252.67 240.47 245.12 287.16 566.68 249.60 137.36 180.46 228.43 306.70
Jiangxi 223.76 188.79 222.74 242.01 533.27 226.68 129.04 157.10 202.21 341.08
Shandong 232.57 209.80 217.81 235.54 488.04 228.83 145.30 154.33 196.47 334.58
Henan 223.12 200.65 199.22 226.02 446.66 219.76 113.26 146.68 195.95 340.80
Hubei 239.86 215.55 233.41 264.87 530.70 241.57 158.89 159.41 210.13 331.83
Hunan 217.69 186.13 219.80 233.88 517.19 216.16 130.90 158.56 198.54 318.07
Guangdong 248.00 240.07 236.50 266.79 516.88 238.18 143.89 181.38 217.88 295.07
Guangxi 223.32 193.51 202.21 227.42 476.80 200.46 101.20 149.01 210.69 360.15
Hainan 231.56 210.09 220.35 232.99 562.52 203.50 140.08 134.72 208.30 322.83
Chongqing 233.89 214.03 211.54 236.07 508.19 209.84 120.02 147.53 202.76 340.10
Sichuan 225.41 197.00 216.54 237.79 492.85 213.79 135.37 154.36 209.48 335.38
Guizhou 209.45 180.70 182.70 190.36 479.22 168.13 74.26 131.03 184.71 353.03
Yunan 217.34 185.37 203.17 206.68 501.83 186.39 116.03 141.41 190.33 348.65
Tibet 204.73 167.21 202.53 210.12 537.69 197.95 141.09 113.15 163.39 332.66
Shaanxi 229.37 211.17 202.87 213.12 471.15 203.41 128.32 140.55 195.17 337.60
Gansu 204.11 189.28 172.66 182.10 434.02 172.07 99.70 111.11 170.03 310.24
Qinghai 200.38 177.73 182.26 181.72 457.67 173.70 112.73 118.71 165.84 308.11
Ningxia 212.36 205.92 179.62 191.98 461.68 174.42 91.80 118.95 179.54 293.12
Xinjiang 208.72 190.32 190.11 197.22 490.82 189.52 130.24 112.29 155.41 303.31
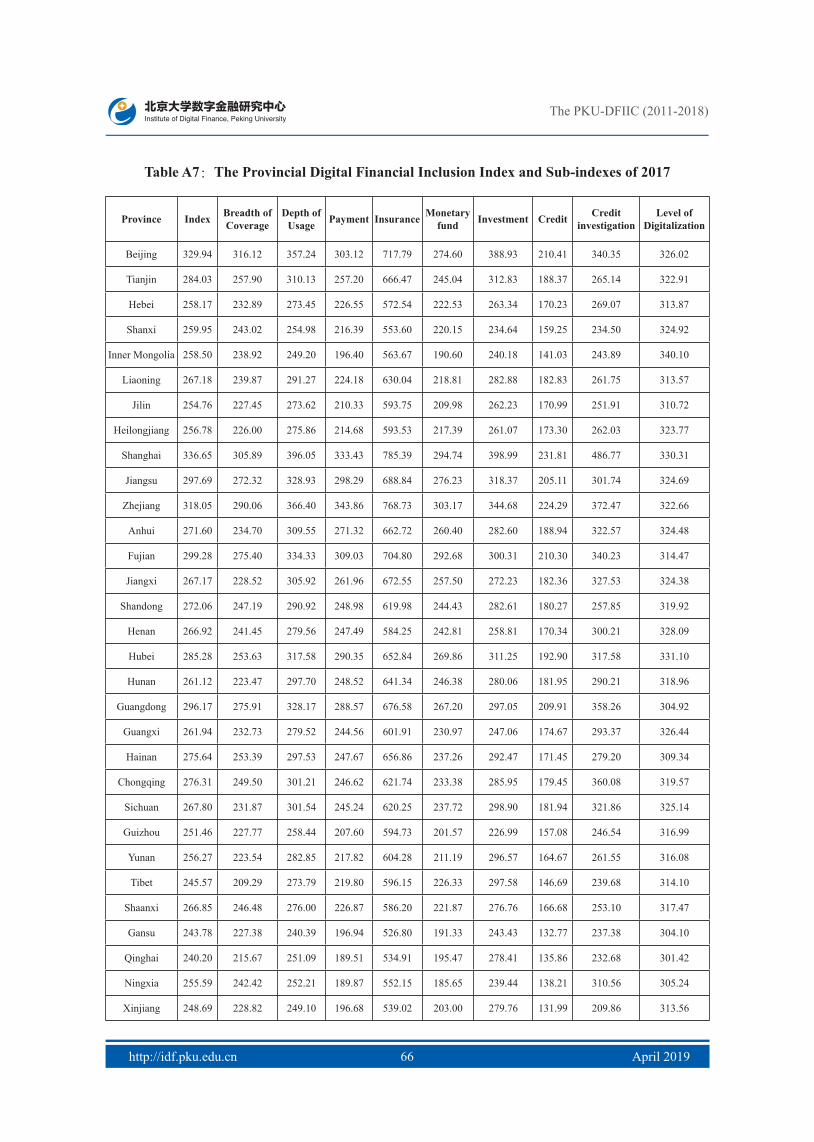
The PKU-DFIIC (2011-2018)
http://idf.pku.edu.cn April 201966 67
Table A7:The Provincial Digital Financial Inclusion Index and Sub-indexes of 2017
Province Index Breadth ofCoverage
Depth ofUsage Payment Insurance Monetary
fund Investment Credit Creditinvestigation
Level ofDigitalization
Beijing 329.94 316.12 357.24 303.12 717.79 274.60 388.93 210.41 340.35 326.02
Tianjin 284.03 257.90 310.13 257.20 666.47 245.04 312.83 188.37 265.14 322.91
Hebei 258.17 232.89 273.45 226.55 572.54 222.53 263.34 170.23 269.07 313.87
Shanxi 259.95 243.02 254.98 216.39 553.60 220.15 234.64 159.25 234.50 324.92
Inner Mongolia 258.50 238.92 249.20 196.40 563.67 190.60 240.18 141.03 243.89 340.10
Liaoning 267.18 239.87 291.27 224.18 630.04 218.81 282.88 182.83 261.75 313.57
Jilin 254.76 227.45 273.62 210.33 593.75 209.98 262.23 170.99 251.91 310.72
Heilongjiang 256.78 226.00 275.86 214.68 593.53 217.39 261.07 173.30 262.03 323.77
Shanghai 336.65 305.89 396.05 333.43 785.39 294.74 398.99 231.81 486.77 330.31
Jiangsu 297.69 272.32 328.93 298.29 688.84 276.23 318.37 205.11 301.74 324.69
Zhejiang 318.05 290.06 366.40 343.86 768.73 303.17 344.68 224.29 372.47 322.66
Anhui 271.60 234.70 309.55 271.32 662.72 260.40 282.60 188.94 322.57 324.48
Fujian 299.28 275.40 334.33 309.03 704.80 292.68 300.31 210.30 340.23 314.47
Jiangxi 267.17 228.52 305.92 261.96 672.55 257.50 272.23 182.36 327.53 324.38
Shandong 272.06 247.19 290.92 248.98 619.98 244.43 282.61 180.27 257.85 319.92
Henan 266.92 241.45 279.56 247.49 584.25 242.81 258.81 170.34 300.21 328.09
Hubei 285.28 253.63 317.58 290.35 652.84 269.86 311.25 192.90 317.58 331.10
Hunan 261.12 223.47 297.70 248.52 641.34 246.38 280.06 181.95 290.21 318.96
Guangdong 296.17 275.91 328.17 288.57 676.58 267.20 297.05 209.91 358.26 304.92
Guangxi 261.94 232.73 279.52 244.56 601.91 230.97 247.06 174.67 293.37 326.44
Hainan 275.64 253.39 297.53 247.67 656.86 237.26 292.47 171.45 279.20 309.34
Chongqing 276.31 249.50 301.21 246.62 621.74 233.38 285.95 179.45 360.08 319.57
Sichuan 267.80 231.87 301.54 245.24 620.25 237.72 298.90 181.94 321.86 325.14
Guizhou 251.46 227.77 258.44 207.60 594.73 201.57 226.99 157.08 246.54 316.99
Yunan 256.27 223.54 282.85 217.82 604.28 211.19 296.57 164.67 261.55 316.08
Tibet 245.57 209.29 273.79 219.80 596.15 226.33 297.58 146.69 239.68 314.10
Shaanxi 266.85 246.48 276.00 226.87 586.20 221.87 276.76 166.68 253.10 317.47
Gansu 243.78 227.38 240.39 196.94 526.80 191.33 243.43 132.77 237.38 304.10
Qinghai 240.20 215.67 251.09 189.51 534.91 195.47 278.41 135.86 232.68 301.42
Ningxia 255.59 242.42 252.21 189.87 552.15 185.65 239.44 138.21 310.56 305.24
Xinjiang 248.69 228.82 249.10 196.68 539.02 203.00 279.76 131.99 209.86 313.56
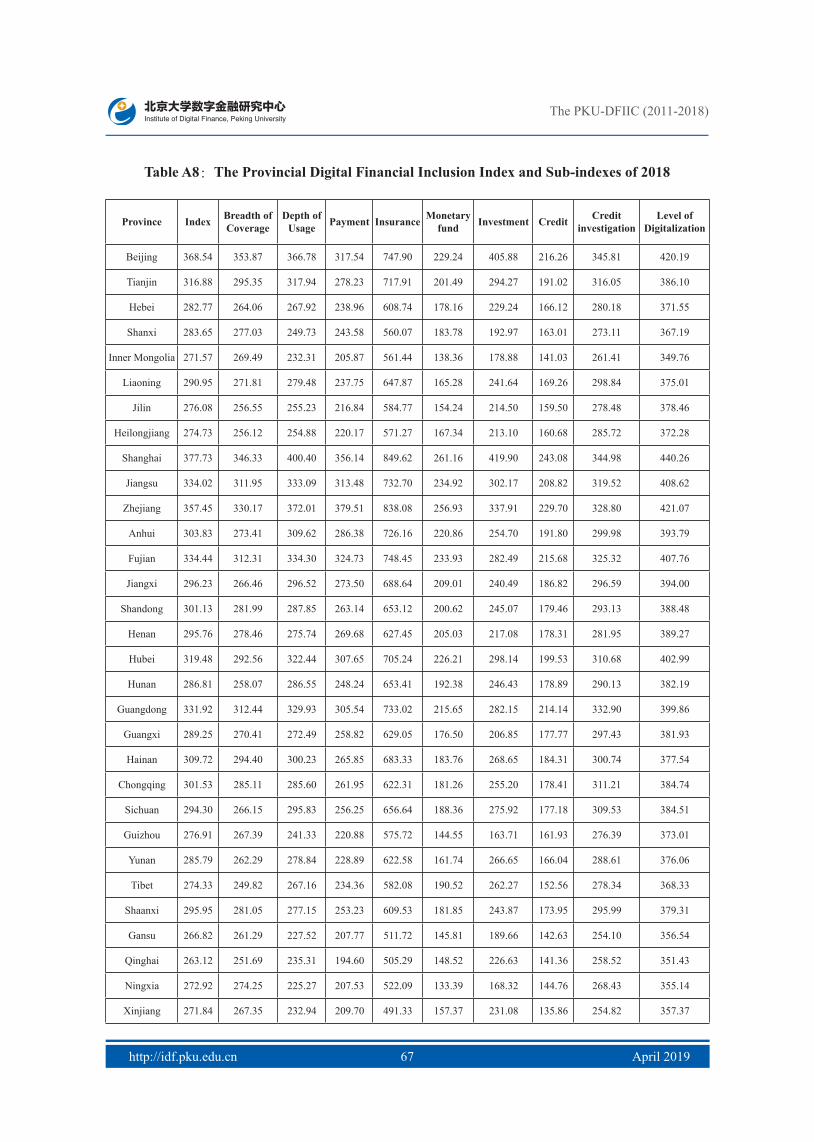
The PKU-DFIIC (2011-2018)
http://idf.pku.edu.cn April 201966 67
Table A8:The Provincial Digital Financial Inclusion Index and Sub-indexes of 2018
Province Index Breadth ofCoverage
Depth ofUsage Payment Insurance Monetary
fund Investment Credit Creditinvestigation
Level ofDigitalization
Beijing 368.54 353.87 366.78 317.54 747.90 229.24 405.88 216.26 345.81 420.19
Tianjin 316.88 295.35 317.94 278.23 717.91 201.49 294.27 191.02 316.05 386.10
Hebei 282.77 264.06 267.92 238.96 608.74 178.16 229.24 166.12 280.18 371.55
Shanxi 283.65 277.03 249.73 243.58 560.07 183.78 192.97 163.01 273.11 367.19
Inner Mongolia 271.57 269.49 232.31 205.87 561.44 138.36 178.88 141.03 261.41 349.76
Liaoning 290.95 271.81 279.48 237.75 647.87 165.28 241.64 169.26 298.84 375.01
Jilin 276.08 256.55 255.23 216.84 584.77 154.24 214.50 159.50 278.48 378.46
Heilongjiang 274.73 256.12 254.88 220.17 571.27 167.34 213.10 160.68 285.72 372.28
Shanghai 377.73 346.33 400.40 356.14 849.62 261.16 419.90 243.08 344.98 440.26
Jiangsu 334.02 311.95 333.09 313.48 732.70 234.92 302.17 208.82 319.52 408.62
Zhejiang 357.45 330.17 372.01 379.51 838.08 256.93 337.91 229.70 328.80 421.07
Anhui 303.83 273.41 309.62 286.38 726.16 220.86 254.70 191.80 299.98 393.79
Fujian 334.44 312.31 334.30 324.73 748.45 233.93 282.49 215.68 325.32 407.76
Jiangxi 296.23 266.46 296.52 273.50 688.64 209.01 240.49 186.82 296.59 394.00
Shandong 301.13 281.99 287.85 263.14 653.12 200.62 245.07 179.46 293.13 388.48
Henan 295.76 278.46 275.74 269.68 627.45 205.03 217.08 178.31 281.95 389.27
Hubei 319.48 292.56 322.44 307.65 705.24 226.21 298.14 199.53 310.68 402.99
Hunan 286.81 258.07 286.55 248.24 653.41 192.38 246.43 178.89 290.13 382.19
Guangdong 331.92 312.44 329.93 305.54 733.02 215.65 282.15 214.14 332.90 399.86
Guangxi 289.25 270.41 272.49 258.82 629.05 176.50 206.85 177.77 297.43 381.93
Hainan 309.72 294.40 300.23 265.85 683.33 183.76 268.65 184.31 300.74 377.54
Chongqing 301.53 285.11 285.60 261.95 622.31 181.26 255.20 178.41 311.21 384.74
Sichuan 294.30 266.15 295.83 256.25 656.64 188.36 275.92 177.18 309.53 384.51
Guizhou 276.91 267.39 241.33 220.88 575.72 144.55 163.71 161.93 276.39 373.01
Yunan 285.79 262.29 278.84 228.89 622.58 161.74 266.65 166.04 288.61 376.06
Tibet 274.33 249.82 267.16 234.36 582.08 190.52 262.27 152.56 278.34 368.33
Shaanxi 295.95 281.05 277.15 253.23 609.53 181.85 243.87 173.95 295.99 379.31
Gansu 266.82 261.29 227.52 207.77 511.72 145.81 189.66 142.63 254.10 356.54
Qinghai 263.12 251.69 235.31 194.60 505.29 148.52 226.63 141.36 258.52 351.43
Ningxia 272.92 274.25 225.27 207.53 522.09 133.39 168.32 144.76 268.43 355.14
Xinjiang 271.84 267.35 232.94 209.70 491.33 157.37 231.08 135.86 254.82 357.37

The PKU-DFIIC (2011-2018)
http://idf.pku.edu.cn April 201968 69
Appendix 2: Profile of the Institute of Digital Finance at Peking University
Approved by the Presidential Office Meeting of Peking University, the Institute
of Digital Finance at Peking University (IDF) was established in October 2015. IDF
is committed to conducting academic, policy and industrial research in the fields of
digital finance, financial inclusion, financial reforms, etc., providing authoritative
results from scientific research for the public, theoretical guidance for the development
of relevant industries and scientific reference for the decision-making process of the
government. Prof. Li Qiang, Director of the Institute of Social Science Survey at
PKU (ISSS), is the Chairman of the IDF Council; Prof. Huang Yiping, Deputy Dean
of National School of Development (NSD) at PKU, is the Director of IDF; Wang
Haiming, Executive President of Shanghai Finance Institute (SFI), is the Executive
Deputy Director of IDF; and Prof. Huang Zhuo and Prof. Shen Yan from NSD are the
Deputy Directors. IDF now has 25 full-time and part-time researchers.
Since its inception, IDF has scored fruitful research results, with research brands
such as the Peking University Digital Finance Index Series and the “New Finance Book
Series of the Institute of Digital Finance at Peking University”. The Digital Finance
Index Series, independently or jointly developed and released by IDF researchers,
consist of the Peking University Internet Finance Development Index of China, the
Peking University Digital Financial Inclusion Index of China, the Peking University
Internet Finance Sentiment Index of China and the Peking University Commercial
Bank Internet Transformation Index of China. The New Finance Book Series of the
Institute of Digital Finance of Peking University is an authoritative brand with theory,
practice and policy value. To date, 12 Lectures on Digital Finance, Chinese Practices
of Digital Financial Inclusion, Financial Technology in China: 12 Lectures on Digital
Finance, Ant Finance: From Alipay to the New Finance Ecosystem, Technology
Empowerment: The Business Practices of Digital Finance in China, and Digital
Finance: Enhancing the Real Economy, among other works, have been published. In
addition, IDF has carried out a number of studies on topics including the support of

The PKU-DFIIC (2011-2018)
http://idf.pku.edu.cn April 201968 69
the real economy by digital finance, the promotion of financial inclusion practices by
digital technology, constructing personal credit investigation systems, strategies for
commercial banks addressing Internet finance transformation, risks of P2P lending
platforms, big data finance, etc. It also organizes academic annual conferences in
collaboration with authoritative journals in economics and finance sectors to promote
academic exchange in the field of digital finance. From 2016 to 2018, it joined hands
with China Economic Journal, China Economic Quarterly and Journal of Financial
Research.
IDF regularly holds activities such as policy seminars and the Peking University
Digital Finance Forum, which provide a platform for communication among
academics, industry practitioners and policy makers. The annual academic conference
of IDF each November attracts the research team of IDF, officials from PBOC, CSRC
and CBIRC, university scholars and industry representatives, making it one of the
most influential events in the sector of digital finance. IDF also delivers digital finance
lectures at Peking University to share the latest issues on digital finance.
As a vital and dynamic think tank, the researchers of IDF, based on massive
corporate research datasets, also actively participate in policy study and consultation
focused on Internet finance and systemic risks, the regulation of P2P lending and
agendas promoting financial inclusion with digital finance as advocated by the
PBOC under the G20 framework. Multiple achievements have received attention
and instructions from leaders at the decision-making level. In 2018, IDF, together
with 24 Chinese universities and research institutes, launched the China Digital
Finance Research Alliance, with the aim of enhancing exchange and cooperation on
academic research and personnel development in the fields of digital finance, financial
technology, Internet finance, and financial big data analysis in China’s academic
circles.
Furthermore, IDF has organized a number of international exchange activities,
including visits co-organized with SFI to developed or emerging economies in Europe
and the US for research on the development status and path of the financial technology
industry, annual international conferences co-organized with SFI and IMF, and
The PKU-DFIIC (2011-2018)
http://idf.pku.edu.cn April 201970
international academic seminars co-organized with international institutions such as
the Graduate Institute, Geneva, and the University of Nottingham.