Assessing Countries’ Financial Inclusion Standing: A New Composite Index

A NATIONAL URBAN LEAGUE PUBLICATION
WWW.STATEOFBLACK AMERICA.ORG
#STATEOFBLACK AMERICA
®
DIGITAL INCLUSION INDEX ™
OVERVIEW
2018 STATE OF BLACK AMERICA® SAVE OUR CITIES: POWERING THE DIGITAL REVOLUTION
™
NATIONAL URBAN LEAGUE
3
BLACK–WHITE DIGITAL INCLUSION INDEX™
2018 STATE OF BLACK AMERICA® SAVE OUR CITIES: POWERING THE DIGITAL REVOLUTION
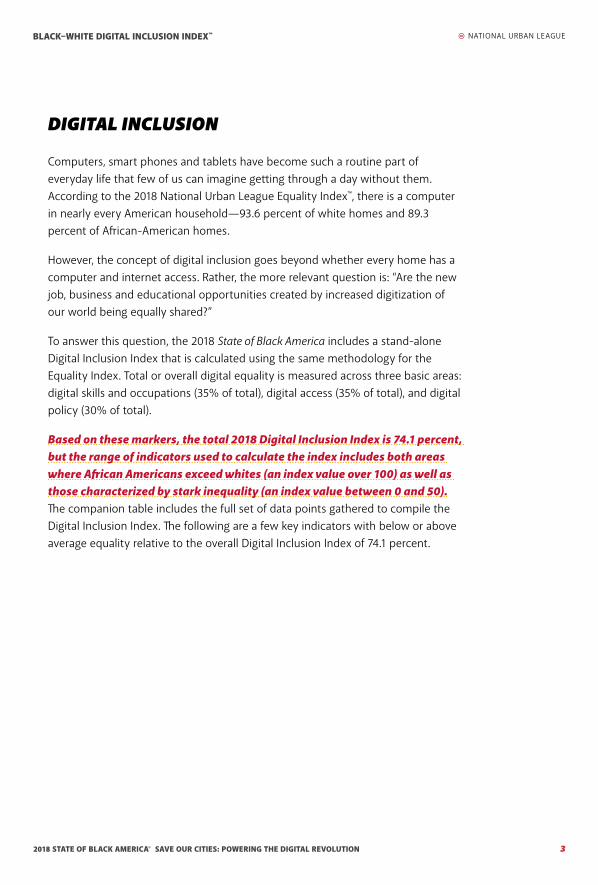
DIGITAL INCLUSION
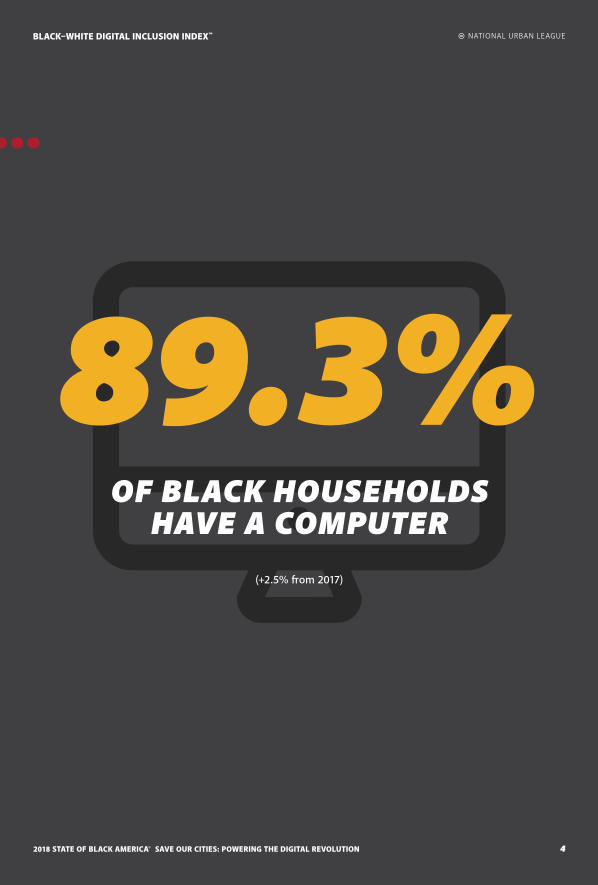
Computers, smart phones and tablets have become such a routine part of everyday life that few of us can imagine getting through a day without them. According to the 2018 National Urban League Equality Index™, there is a computer in nearly every American household—93.6 percent of white homes and 89.3 percent of African-American homes.
However, the concept of digital inclusion goes beyond whether every home has a computer and internet access. Rather, the more relevant question is: “Are the new job, business and educational opportunities created by increased digitization of our world being equally shared?”
To answer this question, the 2018 State of Black America includes a stand-alone Digital Inclusion Index that is calculated using the same methodology for the Equality Index. Total or overall digital equality is measured across three basic areas: digital skills and occupations (35% of total), digital access (35% of total), and digital policy (30% of total).
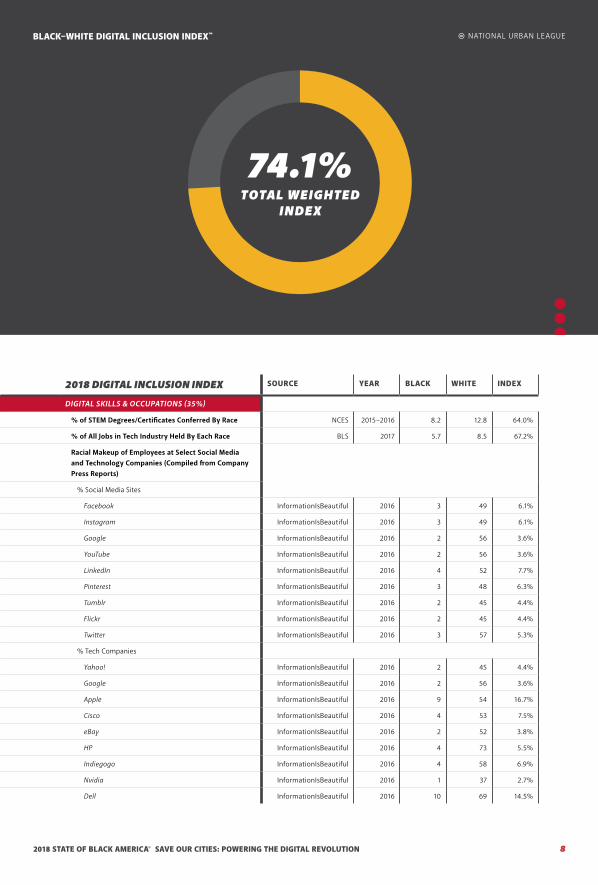
Based on these markers, the total 2018 Digital Inclusion Index is 74.1 percent, but the range of indicators used to calculate the index includes both areas where African Americans exceed whites (an index value over 100) as well as those characterized by stark inequality (an index value between 0 and 50). The companion table includes the full set of data points gathered to compile the Digital Inclusion Index. The following are a few key indicators with below or above average equality relative to the overall Digital Inclusion Index of 74.1 percent.
NATIONAL URBAN LEAGUE
4
BLACK–WHITE DIGITAL INCLUSION INDEX™
2018 STATE OF BLACK AMERICA® SAVE OUR CITIES: POWERING THE DIGITAL REVOLUTION
89.3%OF BLACK HOUSEHOLDS
HAVE A COMPUTER(+2.5% from 2017)
NATIONAL URBAN LEAGUE
4
BLACK–WHITE DIGITAL INCLUSION INDEX™
2018 STATE OF BLACK AMERICA® SAVE OUR CITIES: POWERING THE DIGITAL REVOLUTION

NATIONAL URBAN LEAGUE
5
BLACK–WHITE DIGITAL INCLUSION INDEX™
2018 STATE OF BLACK AMERICA® SAVE OUR CITIES: POWERING THE DIGITAL REVOLUTION
AREAS OF BELOW AVERAGE DIGITAL EQUALITY
The percentage of Blacks and whites with STEM degrees and certificates or employed in the tech industry are areas where there is less equality than measured by the overall Digital Inclusion Index. The Bureau of Labor Statistics collectively defines the tech industry as any industry in which at least 14.5 percent of jobs are in STEM occupations. STEM workers include various types of engineers, IT workers, scientists, postsecondary teachers and managers of these employees. Only 8.2 percent of all degrees conferred to Blacks in 2015–2016 were in STEM fields and just 5.7 percent of total Black employment in 2017 was in the tech industry. By contrast, 12.8 percent of degrees and certificates conferred to whites were in STEM, and 8.5 percent of white workers were employed in the tech industry.
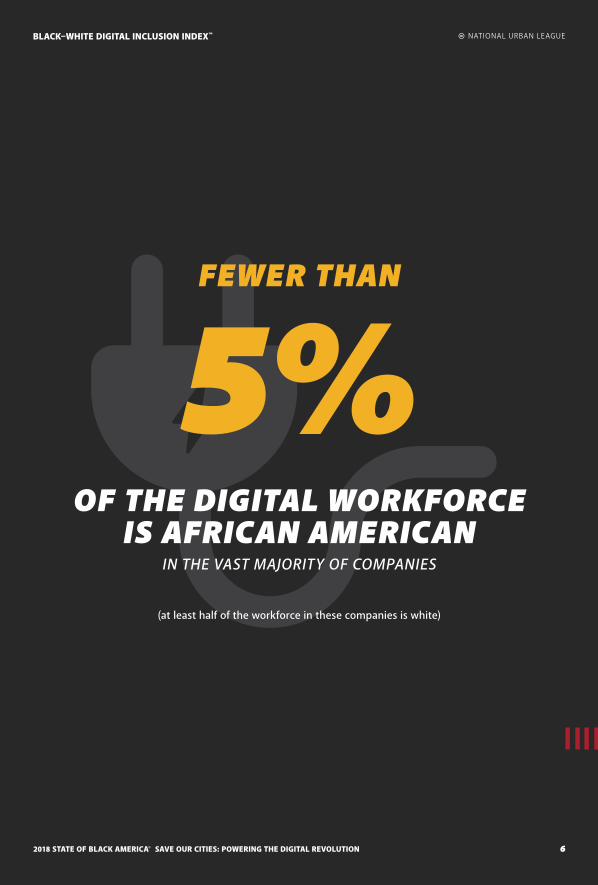
Racial diversity in social media and technology companies is an area where the equality gap is starkly wider. As reported in the Digital Inclusion Index, in the vast majority of companies, fewer than five percent of the workforce is African American. By contrast, at least half of the workforce in these companies is white.
In higher education, historically Black college and universities (HBCUs) receive fewer research and development (R&D) dollars per student and spend less on R&D per student compared to other universities. While one might expect total R&D dollars to be lower at HBCUs than non-HBCUs based on the fact that on average HBCUs are smaller schools, the wide gap in per student dollars is troubling. The average HBCU receives just 10.2 percent of the federal per student R&D funds that go to non-HBCUs and spends just 7.9 percent of what the average non-HBCU spends on R&D per student.
NATIONAL URBAN LEAGUE
6
BLACK–WHITE DIGITAL INCLUSION INDEX™
2018 STATE OF BLACK AMERICA® SAVE OUR CITIES: POWERING THE DIGITAL REVOLUTION
FEWER THAN
5%OF THE DIGITAL WORKFORCE
IS AFRICAN AMERICANIN THE VAST MAJORITY OF COMPANIES
(at least half of the workforce in these companies is white)
NATIONAL URBAN LEAGUE
6
BLACK–WHITE DIGITAL INCLUSION INDEX™
2018 STATE OF BLACK AMERICA® SAVE OUR CITIES: POWERING THE DIGITAL REVOLUTION
NATIONAL URBAN LEAGUE
7
BLACK–WHITE DIGITAL INCLUSION INDEX™
2018 STATE OF BLACK AMERICA® SAVE OUR CITIES: POWERING THE DIGITAL REVOLUTION
AREAS OF ABOVE AVERAGE DIGITAL EQUALITY
Although African Americans are less likely than whites to receive STEM degrees in general, one particular kind of STEM degree is actually more common among African Americans than whites. In 2015–2016, 2.8 percent of African Americans and 2.6 percent of whites earned degrees in computer and data science.
While African Americans with doctoral degrees in science and engineering don’t have the same outcomes as their white counterparts, they are closer to parity than the average worker. For example, the median salary of full-time employed African-American doctoral scientists and engineers in computer/information science occupations is 92.8 percent that of whites. They are also nearly as likely to be employed as associate professors—2.6 percent of Blacks and 2.8 percent of whites (index of 95.1 percent). However, larger gaps exist at the full professor (index of 79.8 percent) and assistant professor (index of 64.5 percent) levels. Since research is essential to career success at this level, the ability to secure funding is critical. 24.6 percent of African-American doctoral scientists and engineers receive federal support, compared to 28.8 percent of whites.
Finally, based on the geography of the country’s technological infrastructures, cities where over half the residents are African American are more likely than cities where a majority of residents are white to have lower monthly costs of high speed broadband, better mobile speeds and reliability (as measured by the percentage of dropped calls) and Smart City projects. Examples of majority Black cities include New Orleans, LA, Montgomery, AL and Savannah, GA. Examples of majority white cities include Scottsdale, AZ, Saline, MI and Fort Collins, CO. It is important to note that majority Black or majority white cities may not be representative of where most of the population lives; therefore, national access could be very different than indicated by these measures. Further, given the segregated nature of most American cities, the presence of these various forms of technological infrastructure in a city does not necessarily guarantee equal access to them.
NATIONAL URBAN LEAGUE
8
BLACK–WHITE DIGITAL INCLUSION INDEX™
2018 STATE OF BLACK AMERICA® SAVE OUR CITIES: POWERING THE DIGITAL REVOLUTION
2018 DIGITAL INCLUSION INDEX SOURCE YEAR BLACK WHITE INDEX
DIGITAL SKILLS & OCCUPATIONS (35%)
% of STEM Degrees/Certificates Conferred By Race NCES 2015–2016 8.2 12.8 64.0%
% of All Jobs in Tech Industry Held By Each Race BLS 2017 5.7 8.5 67.2%
Racial Makeup of Employees at Select Social Media and Technology Companies (Compiled from Company Press Reports)
% Social Media Sites
Facebook InformationIsBeautiful 2016 3 49 6.1%
Instagram InformationIsBeautiful 2016 3 49 6.1%
Google InformationIsBeautiful 2016 2 56 3.6%
YouTube InformationIsBeautiful 2016 2 56 3.6%
LinkedIn InformationIsBeautiful 2016 4 52 7.7%
Pinterest InformationIsBeautiful 2016 3 48 6.3%
Tumblr InformationIsBeautiful 2016 2 45 4.4%
Flickr InformationIsBeautiful 2016 2 45 4.4%
Twitter InformationIsBeautiful 2016 3 57 5.3%
% Tech Companies
Yahoo! InformationIsBeautiful 2016 2 45 4.4%
Google InformationIsBeautiful 2016 2 56 3.6%
Apple InformationIsBeautiful 2016 9 54 16.7%
Cisco InformationIsBeautiful 2016 4 53 7.5%
eBay InformationIsBeautiful 2016 2 52 3.8%
HP InformationIsBeautiful 2016 4 73 5.5%
Indiegogo InformationIsBeautiful 2016 4 58 6.9%
Nvidia InformationIsBeautiful 2016 1 37 2.7%
Dell InformationIsBeautiful 2016 10 69 14.5%
NATIONAL URBAN LEAGUE
74.1%TOTAL WEIGHTED
INDEX
BLACK–WHITE DIGITAL INCLUSION INDEX™

NATIONAL URBAN LEAGUE
92018 STATE OF BLACK AMERICA® SAVE OUR CITIES: POWERING THE DIGITAL REVOLUTION
BLACK–WHITE DIGITAL INCLUSION INDEX™
2018 DIGITAL INCLUSION INDEX SOURCE YEAR BLACK WHITE INDEX
Ingram Micro InformationIsBeautiful 2016 14 52 26.9%
Intel InformationIsBeautiful 2016 4 48 8.3%
Groupon InformationIsBeautiful 2016 8 62 12.9%
Amazon InformationIsBeautiful 2016 21 48 43.8%
Etsy InformationIsBeautiful 2016 3 79 3.8%
Microsoft InformationIsBeautiful 2016 4 56 7.1%
Salesforce InformationIsBeautiful 2016 3 65 4.6%
Pandora InformationIsBeautiful 2016 5 65 7.7%
Uber InformationIsBeautiful 2016 9 50 18.0%
Median Weekly Earnings of Technology Related Occupations, U.S. Dollars
BLS 2016 1,138 1,446 78.7%
Median Annual Salaries of Full-Time Employed Doctoral Scientists and Engineers in Computer/Information Science Occupations, U.S. Dollars
Total NSF 2015 116,000 125,000 92.8%
Male NSF 2015 123,000 129,000 95.3%
Female NSF 2015 102,000 117,000 87.2%
% of All High Skill Digital Occupations Held By Each Race (Digital Occupation Defined By Brookings, Scoring 60 Points and Above)
BLS, Brookings 2017 23.7 29.7 79.8%
% of Social Media Usage, Per Race
Total PEW 2018 69 68 101.5%
Linkedin PEW 2018 28 26 107.7%
Facebook PEW 2018 70 67 104.5%
% of Degrees in Computer and Data Science By Race NCES 2015–2016 2.8 2.6 106.5%
% of Students Enrolled at Top 25 STEM Colleges/Universities, Per Race
Forbes, CollegeData, CollegeFactual, NCES
2016–2017 0.2 0.6 36.9%
DIGITAL ACCESS (35%)
Technology Incubators Targeted for Minority Startups NBIA 2012 8.0 69.0 11.6%
Monthly Cost of High Speed Broadband Among Black Vs. White Majority Cities, U.S. Dollars
Numbeo, ACS 2018 55.7 60.1 107.9%
Use of High Speed Broadband ACS 2016 77.4 87.4 88.6%
Technology Use
Desktop Computer Use NTIA 2015 28.8 37.6 76.7%
Laptop Computer Use NTIA 2015 37.9 50.9 74.6%
Mobile Internet Service Used Outside the Home NTIA 2015 22.6 26.4 85.7%
% of Employed Doctoral Scientists and Engineers in 4-Year Educational Institutions in the Computer/Information Sciences Field, Per Race
Full Professor NSF 2015 1.8 2.2 79.8%
Associate Professor NSF 2015 2.6 2.8 95.1%
Assistant Professor NSF 2015 1.7 2.7 64.5%
% of STEM High Schools Per Black Vs. White Majority Cities (Based on U.S. News Ranking of the Top 251 STEM High Schools)
US News 2017 0.51 0.79 64.1%

NATIONAL URBAN LEAGUE
10
BLACK–WHITE DIGITAL INCLUSION INDEX™
2018 STATE OF BLACK AMERICA® SAVE OUR CITIES: POWERING THE DIGITAL REVOLUTION
2018 DIGITAL INCLUSION INDEX SOURCE YEAR BLACK WHITE INDEX
Technology Company Diversity Commitments/Goals (Based On the Top 20 Fortune 500 Technology Companies)
Fortune 2018 20 20 100.0%
% of School Districts That Have Signed the Future Ready District Pledge
FutureReady, ACS 2018 50.6 38.5 131.4%
DIGITAL POLICY (30%)
Smart City Projects, % Per Black Vs. White Majority Cities
TMT, ACS 2018 0.42 0.27 158.0%
Mobile Speeds and Reliability (% of Dropped Calls Among Black Vs. White Majority Cities)
Rootmetrics, ACS 2018 0.35 0.39 90.6%
Average R&D Expenditures, HBCUs Vs. Non-HBCUs (Thousands of U.S. Dollars)
NSF 2016 10,920 121,200 9.0%
Average of Funds Going to HBCUs Vs. Non-HBCUs By Source (Thousands of U.S. Dollars)
Federal Government NSF 2016 8,535 65,221 13.1%
State and Local Government NSF 2016 585 6,794 8.6%
Institution Funds NSF 2016 1,645 30,970 5.3%
Business NSF 2016 99 7,164 1.4%
Nonprofit Organizations NSF 2016 206 7,870 2.6%
Others NSF 2016 72 3,766 1.9%
Average R&D Expenditure Per Student, HBCUs Vs. Non-HBCUs
NSF, NCES 2016 2,457 30,925 7.9%
Average of R&D Funds Going to HBCUs Vs. Non-HBCUs By Source, Per Student, U.S. Dollars
Federal Government NSF, NCES 2016 1,624 15,965 10.2%
State and Local Government NSF, NCES 2016 160 1,876 8.5%
Institution Funds NSF, NCES 2016 436 8,346 5.2%
Business NSF, NCES 2016 135 1,634 8.3%
Nonprofit Organizations NSF, NCES 2016 89 2,386 3.7%
Others NSF, NCES 2016 19 962 2.0%
% of Doctoral Scientists and Engineers Receiving Federal Support
Total NSF 2015 24.6 28.8 85.3%
Male NSF 2015 25.6 30.2 84.7%
Female NSF 2015 23.8 26.2 90.8%

NATIONAL URBAN LEAGUE
11
BLACK–WHITE DIGITAL INCLUSION INDEX™
2018 STATE OF BLACK AMERICA® SAVE OUR CITIES: POWERING THE DIGITAL REVOLUTION
SOURCE ACRONYMAmerican Community Survey ACS
U.S. Bureau of Labor Statistics BLS
Brookings —
CollegeData —
CollegeFactual —
Forbes —
Fortune —
FutureReady —
InformationIsBeautiful —
National Business Incubation Association NBIA
National Center for Education Statistics NCES
National Science Foundation NSF
National Telecommunications and Information Administration NTIA
Numbeo —
Pew Research Center PEW
Rootmetrics —
IHS Markit Technology, Media, and Telecom TMT
U.S. News —
80 PINE STREET, 9TH FLOOR | NEW YORK, NY 10005 | WWW.NUL.ORG
SUPPORT THE WORK OF THE NATIONAL URBAN LEAGUE AS WE CONTINUE TO ADVANCE POLICIES AND PROGRAMS TO EMPOWER AFRICAN-AMERICAN AND OTHER URBAN COMMUNITIES.
W W W.STATEOFBLACK AMERICA .ORG | #STATEOFBLACK AMERICA | @NATURBANLEAGUE