![Massively Parallel Electromagnetic Transient Simulation of ... · The electromagnetic transient program (EMTP) [1], which analyzes the temporary electro- magnetic phenomena in both](https://static.fdocuments.in/doc/165x107/5e7d93ff28f8280cd266c837/massively-parallel-electromagnetic-transient-simulation-of-the-electromagnetic.jpg)
the Parallel Amplification Architecture for Electromagnetic ...
18
sensors Article Broadband Linear High-Power Amplifier Based on the Parallel Amplification Architecture for Electromagnetic Ultrasonic Guided Wave Jinjie Zhou 1 and Yang Zheng 2, * 1 School of Mechanical Engineering, North University of China, Taiyuan 030051, China 2 China Special Equipment Inspection and Research Institute, Beijing 100029, China * Correspondence: [email protected]; Tel.: +86-010-5906-8314 Received: 13 May 2019; Accepted: 25 June 2019; Published: 2 July 2019 Abstract: The linear power amplifier with high-output power in the broadband frequency is the critical component required by exciting the electromagnetic acoustic transducer (EMAT) to generate ultrasonic guided wave (UGW). The methods to realize the output of a high-power signal in the linear amplification mode and to expand the bandwidth at high-output power are seldom reported. To solve these problems, a power amplifier with differential structure is developed by using the parallel amplification architecture and the broadband feedback circuits. The proposed power amplifier uses a differential structure to suppress the even harmonic waves and remove the disruptions. Each branch of the differential structure consists of five linear power amplifier modules with output terminals connected in parallel to increase the output power. Also, the negative voltage feedback is used to extend the bandwidth of the power amplifier. The experimental results show that the -3 dB bandwidth of the amplifier is from 40 kHz to 2.5 MHz, and the transient output power is greater than 1 kW. The power amplifier can drive the EMATs to generate ultrasonic guided waves. Because of the high-output power and good linearity, the proposed power amplifier has excellent potential for EMAT UGW applications. Keywords: linear power amplifier; high-output power; electromagnetic acoustic transducer (EMAT); ultrasonic guided wave (UGW) 1. Introduction Ultrasonic guided waves can be excited at one point and propagate a very long distance along wave guide structures, such as pipe-like or plate-like structures [1,2]. In addition, the sound field of the ultrasonic guided waves can cover the entire range of the wall thickness. Thus, ultrasonic guided waves are especially suitable for the large-scale NDT and NDE applications of wave guide structures. Compared with piezoelectric transducers, the contactless characteristic of EMATs overcomes the need of couplant between the conductive materials and the transducer itself [3–5] and makes them particularly suitable for NDT and NDE at high temperatures [6–8]. Furthermore, EMATs can generate a single wave mode, such as S0 or SH mode, by varying the shape and array of magnets and coils, which is very difficult to generate with piezoelectric transducers [2–4]. Electromagnetic ultrasonic guided wave techniques integrate the advantages of EMATs and guided waves. This technology has been demonstrated to offer great promise for the in-line inspection of pipelines [5], high-temperature plates testing of the solar thermal industry [7], and so on. In the development of the EMAT inspection system for guided waves, power amplifier design is one of the most critical and challenging works. The power amplifier is employed to amplify the small signal from the analog signal source and drives the EMAT to generate ultrasonic guided waves. The Sensors 2019, 19, 2924; doi:10.3390/s19132924 www.mdpi.com/journal/sensors
Transcript of the Parallel Amplification Architecture for Electromagnetic ...

sensors
Article
Broadband Linear High-Power Amplifier Based onthe Parallel Amplification Architecture forElectromagnetic Ultrasonic Guided Wave
Jinjie Zhou 1 and Yang Zheng 2,*1 School of Mechanical Engineering, North University of China, Taiyuan 030051, China2 China Special Equipment Inspection and Research Institute, Beijing 100029, China* Correspondence: [email protected]; Tel.: +86-010-5906-8314
Received: 13 May 2019; Accepted: 25 June 2019; Published: 2 July 2019
Abstract: The linear power amplifier with high-output power in the broadband frequency is thecritical component required by exciting the electromagnetic acoustic transducer (EMAT) to generateultrasonic guided wave (UGW). The methods to realize the output of a high-power signal in the linearamplification mode and to expand the bandwidth at high-output power are seldom reported. To solvethese problems, a power amplifier with differential structure is developed by using the parallelamplification architecture and the broadband feedback circuits. The proposed power amplifier uses adifferential structure to suppress the even harmonic waves and remove the disruptions. Each branchof the differential structure consists of five linear power amplifier modules with output terminalsconnected in parallel to increase the output power. Also, the negative voltage feedback is usedto extend the bandwidth of the power amplifier. The experimental results show that the −3 dBbandwidth of the amplifier is from 40 kHz to 2.5 MHz, and the transient output power is greater than1 kW. The power amplifier can drive the EMATs to generate ultrasonic guided waves. Because ofthe high-output power and good linearity, the proposed power amplifier has excellent potential forEMAT UGW applications.
Keywords: linear power amplifier; high-output power; electromagnetic acoustic transducer (EMAT);ultrasonic guided wave (UGW)
1. Introduction
Ultrasonic guided waves can be excited at one point and propagate a very long distance alongwave guide structures, such as pipe-like or plate-like structures [1,2]. In addition, the sound field ofthe ultrasonic guided waves can cover the entire range of the wall thickness. Thus, ultrasonic guidedwaves are especially suitable for the large-scale NDT and NDE applications of wave guide structures.Compared with piezoelectric transducers, the contactless characteristic of EMATs overcomes theneed of couplant between the conductive materials and the transducer itself [3–5] and makes themparticularly suitable for NDT and NDE at high temperatures [6–8]. Furthermore, EMATs can generatea single wave mode, such as S0 or SH mode, by varying the shape and array of magnets and coils,which is very difficult to generate with piezoelectric transducers [2–4]. Electromagnetic ultrasonicguided wave techniques integrate the advantages of EMATs and guided waves. This technology hasbeen demonstrated to offer great promise for the in-line inspection of pipelines [5], high-temperatureplates testing of the solar thermal industry [7], and so on.
In the development of the EMAT inspection system for guided waves, power amplifier design isone of the most critical and challenging works. The power amplifier is employed to amplify the smallsignal from the analog signal source and drives the EMAT to generate ultrasonic guided waves. The
Sensors 2019, 19, 2924; doi:10.3390/s19132924 www.mdpi.com/journal/sensors
Sensors 2019, 19, 2924 2 of 18
characteristics of the power amplifier affect the generation of ultrasound guided waves. Commonly,two main objects must be simultaneously achieved for this kind of power amplifier design: (1) Theamplifier should be able to work in the linear amplification mode across a range of frequencies. Thefrequency range of the exciting signal to generate the UGWs is often 50–500 kHz [1–3,9]. Because of themultimode phenomenon and dispersion effect, the guided wave signals become difficult to analyze [10].The multimode phenomenon can be resolved by the special design of transducers. However, to suppressthe dispersion effect of the guided waves, the short-time and narrow-band pulses, such as rectangular [1],Hanning [2,9], and Gaussian [3] windowed sine signals at the appreciated operating frequency areused as exciting signals. The short-time and narrow-band pulses are very suitable for amplificationby using a linear amplification method. (2) One should output high-power exciting signals into aninductive load to drive the EMAT. The main reasons are that the energy conversion efficiency of EMATsis extremely low [11], and peak powers greater than 1 kW are required to excite an EMAT [12].
In the past few decades, many pulses or switch-mode power amplifiers (PAs) or linear PAs weredesigned for exciting ultrasonic signals. Because the ultrasonic signal is nondispersion, the short-timesignal with both broad and narrow bands can be used as an exciting signal. Many high-voltage pulseswere designed for exciting ultrasonic signals with piezoelectric transducers [13–20] and EMATs [21].These pulses can produce unipolar or bipolar square wave signals, and the square wave may have acertain tilt in the high half cycle or the low half cycle. However, they cannot produce the short-timeand narrow-band signals for ultrasonic guided wave detection.
Both high-output power and high efficiency can be realized by switch-mode PAs, but the outputmatching network only generates high-power signals with low frequencies of 10–100 kHz [22] as theoutput. Because the windowed modulation sinusoidal signals vary more severely than those withoutmodulation, a pulse-width modulation signal should make the power MOSFETs work at least twentytimes higher than the input signal center frequency. To amplify a 500 kHz windowed modulationsinusoidal signal, the switching frequency is at least 10 MHz. At this frequency, it is difficult to designa high-speed square-wave driving circuit. Most power MOSFETs cannot rise from the closed state tothe high-voltage state within a very short time.
In principle, to amplify a hundreds of kHz signal to a high voltage is not a problem if one useslinear PAs. Linear PAs often use Class AB configuration whose two branches are respectively drivenby differential signals and outputted with the transformer. The static operating point of each branchwith the same N-channel MOSFETs linear amplifier circuit is slightly higher than the open voltage.Class AB configuration solves the contradiction between improving efficiency and reducing waveformdistortion, so it is often used to amplify the signal from hundreds of kHz [23] to tens of MHz [24,25] toa high-voltage signal for the high-impedance transducer. However, these linear PAs were designed toexcite piezoelectric transducers, and their output powers are too small to excite EMATs.
The method to achieve the output of a high-power signal in the linear amplification mode wasnot reported in detail. The problem that follows is how to expand the bandwidth at a high-poweroutput. To add channels to construct an array detection system, a customized linear PA to excite EMATsto generate UGWs is very desirable. The current publication aims to study the linear amplificationmethod of a kilowatt high-output-power signal for the EMAT. Multiple power MOSFETs with linearamplification modules (LAMs) operating in parallel are used to improve the output power of thedesigned linear PA. The negative voltage feedback is used to extend the bandwidth of the linear PA.Therefore, a linear PA is developed, which can achieve an output power that is always more than 1 kWat the −3 dB bandwidth from 40 kHz to 2.5 MHz. The parameters of the proposed PA are tested, andits performance is verified by exciting the EMAT to generate UGW.

Sensors 2019, 19, 2924 3 of 18
2. Configuration Selection
2.1. Performance Evaluation of the Parallel LAMs
Due to the limitation of fabrication technology and the heat dissipation conditions of powerdevices, it is difficult for the Class AB linear PA with two power MOSFETs to output thousands ofwatts. The challenges of expanding the transient outputting power of a PA that functions in a linearamplification mode must be carefully considered. The output stage is the most key model of linearPA, and its performance decides the maximum output power. At radio frequency and Ku-band, thelinear PA can reach the required high power by using a power combiner to combine the output of eachsmall-power amplifier module [26–30]. The ultrasound driver that sends square-wave signals useseight [31] or fourteen [32] MOSFETs in parallel to increase the output power. Therefore, it is worthconsidering that the output power can be increased by using multiple LAMs in parallel.
Ideally, when multiple LAMs with identical MOSFETs are set at the same static operating pointand identical small AC signals are separately inputted into each MOSFET, the magnified AC currentby each MOSFET linear amplifier circuit has identical magnitude and direction for identical load. Ifthe output terminals of each MOSFET LAM are connected in parallel to one load, the amplified ACcurrents by each MOSFET LAM simultaneously pass through the load, and the current and outputpower on the load can be increased. Although the output power of the linear PAs in class AB designedwith two active elements is very small [23–25], when each branch is composed of multiple MOSFETLAMs, whose output terminals are connected in parallel to one end of the power transformer, theoutput current and output power of the transformer output terminal can be significantly increased.Based on the AB class with transformer output configuration, each branch was designed with fivelinear LAMs in parallel as the output stage, as is shown in Figure 1. Considering the performance andprice, an N-channel power MOSFET IRF840 is selected as the active element of each LAM.
Sensors 2019, 19, x FOR PEER REVIEW 3 of 18
watts. The challenges of expanding the transient outputting power of a PA that functions in a linear amplification mode must be carefully considered. The output stage is the most key model of linear PA, and its performance decides the maximum output power. At radio frequency and Ku-band, the linear PA can reach the required high power by using a power combiner to combine the output of each small-power amplifier module [26–30]. The ultrasound driver that sends square-wave signals uses eight [31] or fourteen [32] MOSFETs in parallel to increase the output power. Therefore, it is worth considering that the output power can be increased by using multiple LAMs in parallel.
Ideally, when multiple LAMs with identical MOSFETs are set at the same static operating point and identical small AC signals are separately inputted into each MOSFET, the magnified AC current by each MOSFET linear amplifier circuit has identical magnitude and direction for identical load. If the output terminals of each MOSFET LAM are connected in parallel to one load, the amplified AC currents by each MOSFET LAM simultaneously pass through the load, and the current and output power on the load can be increased. Although the output power of the linear PAs in class AB designed with two active elements is very small [23–25], when each branch is composed of multiple MOSFET LAMs, whose output terminals are connected in parallel to one end of the power transformer, the output current and output power of the transformer output terminal can be significantly increased. Based on the AB class with transformer output configuration, each branch was designed with five linear LAMs in parallel as the output stage, as is shown in Figure 1. Considering the performance and price, an N-channel power MOSFET IRF840 is selected as the active element of each LAM.
Figure 1. Linear amplification parallel output circuit with five linear amplification modules (LAMs).
To compare the parallel output performance of different numbers of LAMs, the PSpice simulation of a linear PA consisting of one, two, three, four, and five MOSFETs is performed. The spice models of the key component (IRF840) were provided by the vendors. The simulation result is displayed in Figure 2. The voltage amplitudes of one, two, three, four, and five LAMs loaded on 50 Ω are 62.91 V, 125.93 V, 188.79 V, 251.3 V, and 313.2 V, respectively. The current amplitudes of one, two, three, four, and five LAMs are 1.2583 A, 2.519 A, 3.776 A, 5.025 A, and 6.264 A, respectively. The results show that the voltage or current amplitudes on the load are approximately proportional to the number of parallel LAMs. The output peak powers of one, two, three, four, and five LAMs are 79.16 W, 317.22 W, 712.87 W, 1262.78 W, and 1961.88 W, respectively. The results show that the peak output power increases approximately with the square of the number of parallel LAMs. However, there are more parallel LAMs in the actual circuit; the stronger driving ability of the required front circuit corresponds to greater inter stage crosstalk and lower stability of the circuit. Therefore, it is necessary to select the maximum number of parallel LAMs according to the actual debugging results.
V1 V20
VCC
RL
00
R5
V4V30
0R10
M10
M9
M8
M7
M6
R9
R8
R7
R6
L1
1
2
L3
1
2
M5
M4
M3
M2
M1
R4
R3
R2
R1
L2
1
2
Figure 1. Linear amplification parallel output circuit with five linear amplification modules (LAMs).
To compare the parallel output performance of different numbers of LAMs, the PSpice simulationof a linear PA consisting of one, two, three, four, and five MOSFETs is performed. The spice modelsof the key component (IRF840) were provided by the vendors. The simulation result is displayedin Figure 2. The voltage amplitudes of one, two, three, four, and five LAMs loaded on 50 Ω are62.91 V, 125.93 V, 188.79 V, 251.3 V, and 313.2 V, respectively. The current amplitudes of one, two,three, four, and five LAMs are 1.2583 A, 2.519 A, 3.776 A, 5.025 A, and 6.264 A, respectively. Theresults show that the voltage or current amplitudes on the load are approximately proportional tothe number of parallel LAMs. The output peak powers of one, two, three, four, and five LAMs are79.16 W, 317.22 W, 712.87 W, 1262.78 W, and 1961.88 W, respectively. The results show that the peak

Sensors 2019, 19, 2924 4 of 18
output power increases approximately with the square of the number of parallel LAMs. However,there are more parallel LAMs in the actual circuit; the stronger driving ability of the required frontcircuit corresponds to greater inter stage crosstalk and lower stability of the circuit. Therefore, it isnecessary to select the maximum number of parallel LAMs according to the actual debugging results.Sensors 2019, 19, x FOR PEER REVIEW 4 of 18
Figure 2. Simulation result of the linear PA with different numbers of LAMs: (a) voltage; (b) current.
2.2. Gated Linear PA Configuration
The linear PA functions for a very short time (such as tens of µs) and rests for a very long time (such as from tens to hundreds of ms) in one detection process, so the continuous linear PA is not suitable for ultrasonic guided wave inspection. The gated mode can be used to run the linear PA in a linear amplification mode, where the burst signal is instantaneously transmitted; then, the linear PA is stopped during the resting period of the detection process. Therefore, the power consumption of the proposed linear PA can be significantly reduced. However, the gated mode will often turn on and off the linear PA, which causes the inevitable disruption in the output stage in the range of tens of volts because of the switching characteristics of the circuits. If these disruptions are delivered to the EMAT, they cause inherent noise in the time history curve, and it is easy to induce the fault decision. Therefore, suppressing the disruptions in the output stage caused by the switching characteristics is a key problem that must be carefully considered in the development of the linear PA. In addition, AB class with Transformer output must input the differential AC signals. To resolve these problems, the proposed linear PA for EMAT excitation was designed with the configuration in Figure 3.
Signal Generator
DC bias
DC bias
Gated Signal
T2
To EMAT
Current Driver
Driver Amplifier
Driver Amplifier
T1
VCC1
VCC2
Figure 3. Gate configuration of the proposed linear PA.
A single-to-differential conversion circuit with transformer T1 was adopted in the input stage of the linear PA. Each branch of the differential structure consists of five LAMs with output terminals that are connected in parallel to increase the output power. Five LAMs are driven by one driver
Figure 2. Simulation result of the linear PA with different numbers of LAMs: (a) voltage; (b) current.
2.2. Gated Linear PA Configuration
The linear PA functions for a very short time (such as tens of µs) and rests for a very long time(such as from tens to hundreds of ms) in one detection process, so the continuous linear PA is notsuitable for ultrasonic guided wave inspection. The gated mode can be used to run the linear PA in alinear amplification mode, where the burst signal is instantaneously transmitted; then, the linear PA isstopped during the resting period of the detection process. Therefore, the power consumption of theproposed linear PA can be significantly reduced. However, the gated mode will often turn on andoff the linear PA, which causes the inevitable disruption in the output stage in the range of tens ofvolts because of the switching characteristics of the circuits. If these disruptions are delivered to theEMAT, they cause inherent noise in the time history curve, and it is easy to induce the fault decision.Therefore, suppressing the disruptions in the output stage caused by the switching characteristics is akey problem that must be carefully considered in the development of the linear PA. In addition, ABclass with Transformer output must input the differential AC signals. To resolve these problems, theproposed linear PA for EMAT excitation was designed with the configuration in Figure 3.
A single-to-differential conversion circuit with transformer T1 was adopted in the input stage ofthe linear PA. Each branch of the differential structure consists of five LAMs with output terminalsthat are connected in parallel to increase the output power. Five LAMs are driven by one driveramplifier. Each LAM has negative voltage feedback to extend the bandwidth. A differential tosingle-ended conversion circuit with transformer T2 was adopted in the output stage. A gated signalthat is synchronous with the arbitrary waveform burst signal emitted from the signal generator is usedto switch on the power to the DC bias circuit. The DC bias circuit is used to set a quiescent operationpoint for each branch of the differential structure. The voltage and current of the arbitrary waveformburst signal emitted from the signal generator are amplified by the current driver to improve the drivercapability of the arbitrary waveform burst signal.
When the gate is opened, the inputted burst signal is converted into two equal-amplitude burstsignals with a phase difference of 180 by T1. Then, two burst signals of equal amplitude with a phasedifference of 180 are each amplified by one of two identical branches, and the amplified high-powersignals also have equal amplitudes and a phase difference of 180. Two amplified high-power signalsare combined with transformer T2 and deliver the total power to the EMAT. Because each branch of thedifferential circuit is theoretically identical, the disruption in the output stage of each branch caused bycircuit-switching characteristics should also be identical when the same gate signal is inputted to each

Sensors 2019, 19, 2924 5 of 18
branch. Therefore, this differential structure should suppress the disruption that would occur at theoutput stage of each branch.
Sensors 2019, 19, x FOR PEER REVIEW 4 of 18
Figure 2. Simulation result of the linear PA with different numbers of LAMs: (a) voltage; (b) current.
2.2. Gated Linear PA Configuration
The linear PA functions for a very short time (such as tens of µs) and rests for a very long time (such as from tens to hundreds of ms) in one detection process, so the continuous linear PA is not suitable for ultrasonic guided wave inspection. The gated mode can be used to run the linear PA in a linear amplification mode, where the burst signal is instantaneously transmitted; then, the linear PA is stopped during the resting period of the detection process. Therefore, the power consumption of the proposed linear PA can be significantly reduced. However, the gated mode will often turn on and off the linear PA, which causes the inevitable disruption in the output stage in the range of tens of volts because of the switching characteristics of the circuits. If these disruptions are delivered to the EMAT, they cause inherent noise in the time history curve, and it is easy to induce the fault decision. Therefore, suppressing the disruptions in the output stage caused by the switching characteristics is a key problem that must be carefully considered in the development of the linear PA. In addition, AB class with Transformer output must input the differential AC signals. To resolve these problems, the proposed linear PA for EMAT excitation was designed with the configuration in Figure 3.
Signal Generator
DC bias
DC bias
Gated Signal
T2
To EMAT
Current Driver
Driver Amplifier
Driver Amplifier
T1
VCC1
VCC2
Figure 3. Gate configuration of the proposed linear PA.
A single-to-differential conversion circuit with transformer T1 was adopted in the input stage of the linear PA. Each branch of the differential structure consists of five LAMs with output terminals that are connected in parallel to increase the output power. Five LAMs are driven by one driver
Figure 3. Gate configuration of the proposed linear PA.
3. Implementation
3.1. AC and DC Coupling Circuit
The AC and DC coupling circuits are shown in Figure 4. When the level of the gated signalinputted from the SYN port is low, the DC power supply VCC1 cannot power the DC bias circuit andthe power amplifier circuit is expected to stop working. When the level of the gated signal inputtedfrom the SYN port is high, the collector and emitter of the n-p-n amplifier transistor U1 (2N5551,Motorola, Chicago, IL, USA) are in a conducting state. The gate pole of the p-channel power MOSFETU2 (IRF9540, Vishay, Malvern, PA, USA) is connected with the ground plane through a conductingresistor between the collector and the emitter of the amplifier transistor U1. Therefore, the p-channelpower MOSFET U2, which has a drain-source on-state resistance of less than 0.2 Ω, is a conductingelement. One electrical terminal that consists of two sliding rheostats is connected to the power supplyVCC1 through the drain-source on-state resistance of U2, and the sliding contact of the two rheostats isused to set up the appropriate biasing voltage for the driver amplifier circuits. Because the componentsof the two branches cannot be exactly identical, a small amplitude disruption in the output stagemay always be present. This small amplitude disruption can be suppressed by finely tuning the twosliding rheostats.
The arbitrary waveform burst pulse inputted from the IN port is amplified by high-voltage,high-speed, current-feedback amplifier U3 (THS3091, Texas Instruments, Dallas, TX, USA). The highslew rate of over 7300 V/s and large output current of over ±250 mA of the THS3091 make it sufficientto drive two driver amplifiers. The wideband transmission line transformer T1, which is fabricatedfrom two strands of enamel-coated copper wire twisted together and wound around a wideband ferritecore 20 times, is used to convert the single-ended signal outputted from U3 into differential signals.The wideband ferrite core of T1 is made from a soft ferrite magnet (MXO-2000, Flight Bo De Electroniccomponent, Beijing, China) with an inner diameter of 10 mm, an outer diameter of 16 mm, and a heightof 5 mm. Two differential burst signals are added into the gated DC biasing signals with capacitorsC1 and C2. The AC coupling mode eliminates the effects of DC signals on the signal generator. Themain function of the diode (1N4148, Chenyi Electronics, Shanghai, China) is to prevent the AC signal
Sensors 2019, 19, 2924 6 of 18
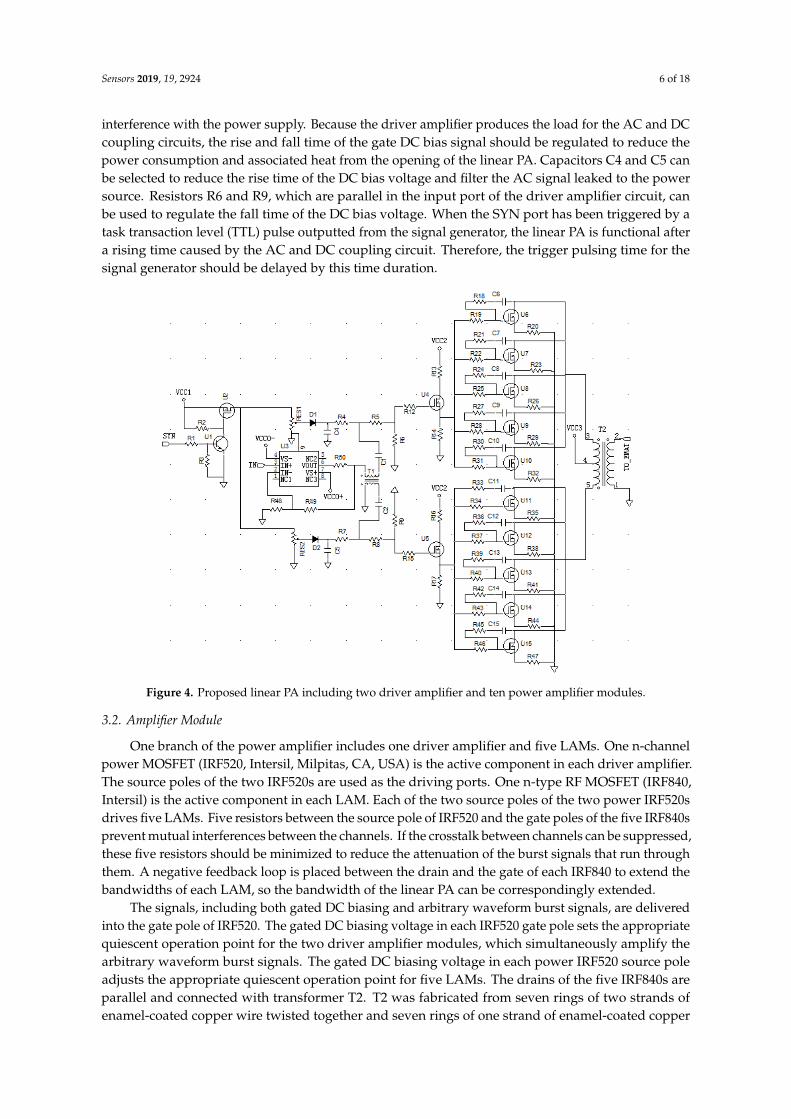
interference with the power supply. Because the driver amplifier produces the load for the AC and DCcoupling circuits, the rise and fall time of the gate DC bias signal should be regulated to reduce thepower consumption and associated heat from the opening of the linear PA. Capacitors C4 and C5 canbe selected to reduce the rise time of the DC bias voltage and filter the AC signal leaked to the powersource. Resistors R6 and R9, which are parallel in the input port of the driver amplifier circuit, canbe used to regulate the fall time of the DC bias voltage. When the SYN port has been triggered by atask transaction level (TTL) pulse outputted from the signal generator, the linear PA is functional aftera rising time caused by the AC and DC coupling circuit. Therefore, the trigger pulsing time for thesignal generator should be delayed by this time duration.
Sensors 2019, 19, x FOR PEER REVIEW 6 of 18
from the signal generator, the linear PA is functional after a rising time caused by the AC and DC coupling circuit. Therefore, the trigger pulsing time for the signal generator should be delayed by this time duration.
3.2. Amplifier Module
One branch of the power amplifier includes one driver amplifier and five LAMs. One n-channel power MOSFET (IRF520, Intersil, Milpitas, CA, USA) is the active component in each driver amplifier. The source poles of the two IRF520s are used as the driving ports. One n-type RF MOSFET (IRF840, Intersil) is the active component in each LAM. Each of the two source poles of the two power IRF520s drives five LAMs. Five resistors between the source pole of IRF520 and the gate poles of the five IRF840s prevent mutual interferences between the channels. If the crosstalk between channels can be suppressed, these five resistors should be minimized to reduce the attenuation of the burst signals that run through them. A negative feedback loop is placed between the drain and the gate of each IRF840 to extend the bandwidths of each LAM, so the bandwidth of the linear PA can be correspondingly extended.
The signals, including both gated DC biasing and arbitrary waveform burst signals, are delivered into the gate pole of IRF520. The gated DC biasing voltage in each IRF520 gate pole sets the appropriate quiescent operation point for the two driver amplifier modules, which simultaneously amplify the arbitrary waveform burst signals. The gated DC biasing voltage in each power IRF520 source pole adjusts the appropriate quiescent operation point for five LAMs. The drains of the five IRF840s are parallel and connected with transformer T2. T2 was fabricated from seven rings of two strands of enamel-coated copper wire twisted together and seven rings of one strand of enamel-coated copper wire wound around three wideband ferrite cores, which were fixed together with a strong mixture of glue and water. Each wideband ferrite core was made from the soft ferrite magnet (MXO-2000, Flight BoDe Electronic component), with an inner diameter of 20 mm, an outer diameter of 32 mm, and a height of 5 mm. T2 has to two roles: To protect the IRF840s by intercepting abrupt changes in the signal from the DC power supply VCC2 and to implement the differential to single-ended conversion and combine the total power provided by all power amplifier modules, which is delivered to the EMAT.
Figure 4. Proposed linear PA including two driver amplifier and ten power amplifier modules. Figure 4. Proposed linear PA including two driver amplifier and ten power amplifier modules.
3.2. Amplifier Module
One branch of the power amplifier includes one driver amplifier and five LAMs. One n-channelpower MOSFET (IRF520, Intersil, Milpitas, CA, USA) is the active component in each driver amplifier.The source poles of the two IRF520s are used as the driving ports. One n-type RF MOSFET (IRF840,Intersil) is the active component in each LAM. Each of the two source poles of the two power IRF520sdrives five LAMs. Five resistors between the source pole of IRF520 and the gate poles of the five IRF840sprevent mutual interferences between the channels. If the crosstalk between channels can be suppressed,these five resistors should be minimized to reduce the attenuation of the burst signals that run throughthem. A negative feedback loop is placed between the drain and the gate of each IRF840 to extend thebandwidths of each LAM, so the bandwidth of the linear PA can be correspondingly extended.
The signals, including both gated DC biasing and arbitrary waveform burst signals, are deliveredinto the gate pole of IRF520. The gated DC biasing voltage in each IRF520 gate pole sets the appropriatequiescent operation point for the two driver amplifier modules, which simultaneously amplify thearbitrary waveform burst signals. The gated DC biasing voltage in each power IRF520 source poleadjusts the appropriate quiescent operation point for five LAMs. The drains of the five IRF840s areparallel and connected with transformer T2. T2 was fabricated from seven rings of two strands ofenamel-coated copper wire twisted together and seven rings of one strand of enamel-coated copper
Sensors 2019, 19, 2924 7 of 18
wire wound around three wideband ferrite cores, which were fixed together with a strong mixture ofglue and water. Each wideband ferrite core was made from the soft ferrite magnet (MXO-2000, FlightBoDe Electronic component), with an inner diameter of 20 mm, an outer diameter of 32 mm, and aheight of 5 mm. T2 has to two roles: To protect the IRF840s by intercepting abrupt changes in the signalfrom the DC power supply VCC2 and to implement the differential to single-ended conversion andcombine the total power provided by all power amplifier modules, which is delivered to the EMAT.
4. Performance Evaluation
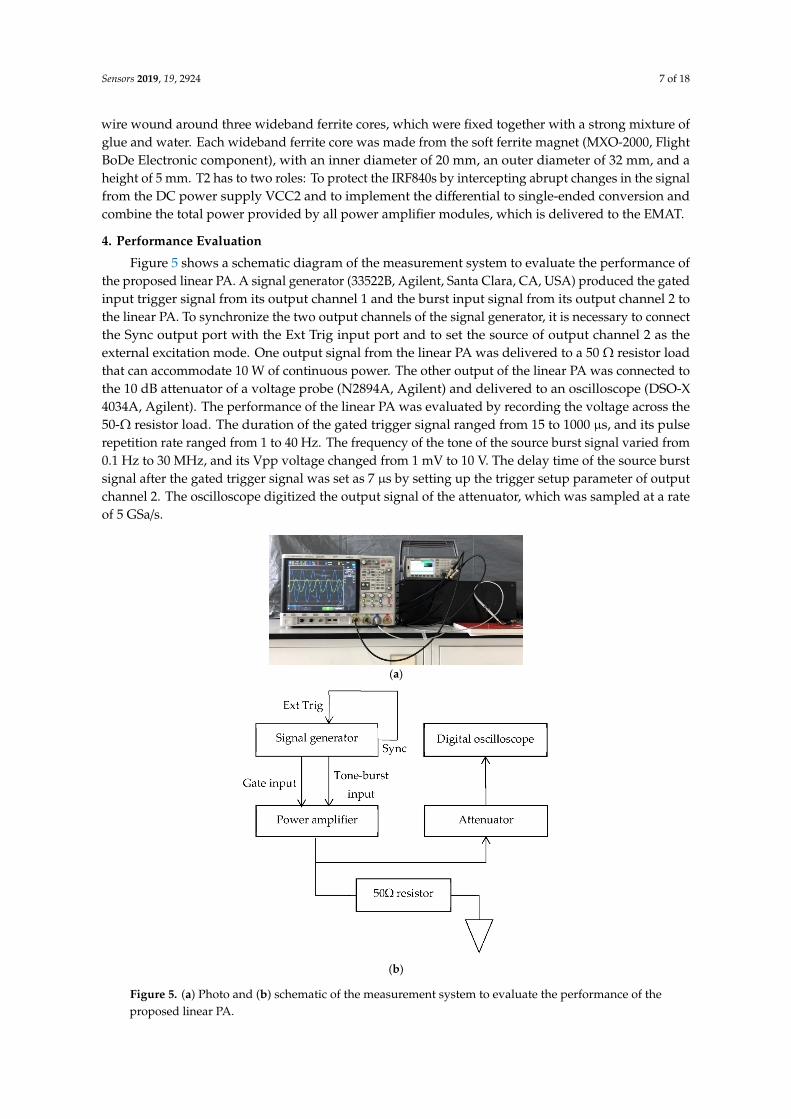
Figure 5 shows a schematic diagram of the measurement system to evaluate the performance ofthe proposed linear PA. A signal generator (33522B, Agilent, Santa Clara, CA, USA) produced the gatedinput trigger signal from its output channel 1 and the burst input signal from its output channel 2 tothe linear PA. To synchronize the two output channels of the signal generator, it is necessary to connectthe Sync output port with the Ext Trig input port and to set the source of output channel 2 as theexternal excitation mode. One output signal from the linear PA was delivered to a 50 Ω resistor loadthat can accommodate 10 W of continuous power. The other output of the linear PA was connected tothe 10 dB attenuator of a voltage probe (N2894A, Agilent) and delivered to an oscilloscope (DSO-X4034A, Agilent). The performance of the linear PA was evaluated by recording the voltage across the50-Ω resistor load. The duration of the gated trigger signal ranged from 15 to 1000 µs, and its pulserepetition rate ranged from 1 to 40 Hz. The frequency of the tone of the source burst signal varied from0.1 Hz to 30 MHz, and its Vpp voltage changed from 1 mV to 10 V. The delay time of the source burstsignal after the gated trigger signal was set as 7 µs by setting up the trigger setup parameter of outputchannel 2. The oscilloscope digitized the output signal of the attenuator, which was sampled at a rateof 5 GSa/s.
Sensors 2019, 19, x FOR PEER REVIEW 7 of 18
4. Performance Evaluation
Figure 5 shows a schematic diagram of the measurement system to evaluate the performance of the proposed linear PA. A signal generator (33522B, Agilent, Santa Clara, CA, USA) produced the gated input trigger signal from its output channel 1 and the burst input signal from its output channel 2 to the linear PA. To synchronize the two output channels of the signal generator, it is necessary to connect the Sync output port with the Ext Trig input port and to set the source of output channel 2 as the external excitation mode. One output signal from the linear PA was delivered to a 50 Ω resistor load that can accommodate 10 W of continuous power. The other output of the linear PA was connected to the 10 dB attenuator of a voltage probe (N2894A, Agilent) and delivered to an oscilloscope (DSO-X 4034A, Agilent). The performance of the linear PA was evaluated by recording the voltage across the 50-Ω resistor load. The duration of the gated trigger signal ranged from 15 to 1000 µs, and its pulse repetition rate ranged from 1 to 40 Hz. The frequency of the tone of the source burst signal varied from 0.1 Hz to 30 MHz, and its Vpp voltage changed from 1 mV to 10 V. The delay time of the source burst signal after the gated trigger signal was set as 7 µs by setting up the trigger setup parameter of output channel 2. The oscilloscope digitized the output signal of the attenuator, which was sampled at a rate of 5 GSa/s.
(a)
(b)
Figure 5. (a) Photo and (b) schematic of the measurement system to evaluate the performance of the proposed linear PA.
4.1. Gating Mode Test
Gating mode test shows that the power amplifier can work in gating mode and eliminate the disruptions caused by switching characteristics. The high-level width of the gate-controlled signal
Figure 5. (a) Photo and (b) schematic of the measurement system to evaluate the performance of theproposed linear PA.

Sensors 2019, 19, 2924 8 of 18
4.1. Gating Mode Test
Gating mode test shows that the power amplifier can work in gating mode and eliminate thedisruptions caused by switching characteristics. The high-level width of the gate-controlled signal forpowering the DC bias circuit was set to 40 µs. A 5-cycle sinusoidal wave modulated by a Hanningwindow with a frequency of 360 kHz was inputted into the LPA. Moreover, the amplified signal with300 V was transmitted at 50 ms interval. The oscilloscope was used to observe the output waveform ofAC and DC coupling circuit of each branch, as shown in Figure 6a,b, and the output waveform on 50-Ωresistor load, as shown in Figure 6c. From Figure 6a,b, it is known that the gated signals providedto the two branches rise and fall with 7 µs delay. The delay time should be considered for the ACsignal. From Figure 6c, it is known that the output signals are located near the zero line when thewhole circuit is turned on or off. This shows that the linear PA not only realizes the gating mode butalso can effectively suppress the disruptions caused by the switching characteristics.
Sensors 2019, 19, x FOR PEER REVIEW 8 of 18
for powering the DC bias circuit was set to 40 µs. A 5-cycle sinusoidal wave modulated by a Hanning window with a frequency of 360 kHz was inputted into the LPA. Moreover, the amplified signal with 300 V was transmitted at 50 ms interval. The oscilloscope was used to observe the output waveform of AC and DC coupling circuit of each branch, as shown in Figure 6a,b, and the output waveform on 50-Ω resistor load, as shown in Figure 6c. From Figure 6a,b, it is known that the gated signals provided to the two branches rise and fall with 7 µs delay. The delay time should be considered for the AC signal. From Figure 6c, it is known that the output signals are located near the zero line when the whole circuit is turned on or off. This shows that the linear PA not only realizes the gating mode but also can effectively suppress the disruptions caused by the switching characteristics.
Figure 6. The driving signals of each branch and output signals of the power amplifier: (a), (b) driving waveforms of two branches; (c) output waveforms of the output stage.
4.2. Measurement with Typical Guided Wave Source Signals
Usually, two kinds of signals are employed as guided wave driving source signals: A few cycles of sine signals and Hanning window function-modulated sine signals. In this study both types of source signals were used to test the flexibility of the proposed linear PA. Figure 7 shows the waveforms of three- and ten-cycle sine signals with frequencies of 360 kHz and Hanning windowed three- and ten-cycle sinusoidal signals with center frequencies of 360 kHz. The Vpp of the high voltage waveforms emitted from the linear PA was 300 V. To evaluate the performance of the waveforms emitted by the linear PA, the time domain waveform shape and spectral characteristics of high voltage burst signals and the ideal waveforms for the guided wave application were compared with each other, as shown in Figure 7.
For driving source signals using a few cycles of sine signals, Figure 7a,c show that their waveforms outputted from the linear PA are approximately the same as the ideal waveforms. However, there is a small amount of hysteresis in the first quarter cycle. This is primarily because of the linear PA’s transient response effect. An amplified signal usually requires a transition time to achieve the steady-state response. Therefore, the figure shows that the amplified signal has a slight lag relative to the ideal signal during the transition time. In addition, the amplitude of the amplified signal is slightly smaller than ideal signal during the transition time, and furthermore, a tailing phenomenon appears at the end of the output waveforms. Figure 7b,d shows that the main lobes of the output sine waveform spectra fit well with those of the ideal waveforms; however, the side lobes of the output sine waveform spectra have smaller amplitudes at the lower frequencies and larger amplitudes at higher frequencies. For driving source signals using a few cycles of Hanning windowed sine signals, Figure 7e,g show that the output waveforms fit well with the ideal waveforms and that when the cycle number increases the output and ideal waveforms are almost the same. It should be noted that the transient response effect for Hanning windowed sine signal is
Figure 6. The driving signals of each branch and output signals of the power amplifier: (a,b) drivingwaveforms of two branches; (c) output waveforms of the output stage.
4.2. Measurement with Typical Guided Wave Source Signals
Usually, two kinds of signals are employed as guided wave driving source signals: A few cyclesof sine signals and Hanning window function-modulated sine signals. In this study both types ofsource signals were used to test the flexibility of the proposed linear PA. Figure 7 shows the waveformsof three- and ten-cycle sine signals with frequencies of 360 kHz and Hanning windowed three- andten-cycle sinusoidal signals with center frequencies of 360 kHz. The Vpp of the high voltage waveformsemitted from the linear PA was 300 V. To evaluate the performance of the waveforms emitted by thelinear PA, the time domain waveform shape and spectral characteristics of high voltage burst signalsand the ideal waveforms for the guided wave application were compared with each other, as shown inFigure 7.
For driving source signals using a few cycles of sine signals, Figure 7a,c show that their waveformsoutputted from the linear PA are approximately the same as the ideal waveforms. However, there is asmall amount of hysteresis in the first quarter cycle. This is primarily because of the linear PA’s transientresponse effect. An amplified signal usually requires a transition time to achieve the steady-stateresponse. Therefore, the figure shows that the amplified signal has a slight lag relative to the idealsignal during the transition time. In addition, the amplitude of the amplified signal is slightly smallerthan ideal signal during the transition time, and furthermore, a tailing phenomenon appears at the endof the output waveforms. Figure 7b,d shows that the main lobes of the output sine waveform spectrafit well with those of the ideal waveforms; however, the side lobes of the output sine waveform spectrahave smaller amplitudes at the lower frequencies and larger amplitudes at higher frequencies. Fordriving source signals using a few cycles of Hanning windowed sine signals, Figure 7e,g show that the

Sensors 2019, 19, 2924 9 of 18
output waveforms fit well with the ideal waveforms and that when the cycle number increases theoutput and ideal waveforms are almost the same. It should be noted that the transient response effectfor Hanning windowed sine signal is smaller than that found for rectangular window sine waves,especially when the modulation cycle is higher. This is primarily because the Vpp of each cycle ofHanning windowed sine signal increases gradually to the maximum value and then decreases tothe minimum value. When the modulation cycle number is higher, the amplitude of the first cyclewill become small. Therefore, the transient response effect becomes weaker than in cases with fewermodulation cycles. Figure 7f,h show that within the entire frequency domain, the second harmonicsof the output waveforms are always smaller than those of the ideal waveforms. Therefore, even theharmonics component of the output waveforms could be suppressed by the differential structures.Both of these two kinds of signals are able to yield the largest peak-to-peak amplitudes and be adoptedas the guided wave inspection signals.
Sensors 2019, 19, x FOR PEER REVIEW 9 of 18
smaller than that found for rectangular window sine waves, especially when the modulation cycle is higher. This is primarily because the Vpp of each cycle of Hanning windowed sine signal increases gradually to the maximum value and then decreases to the minimum value. When the modulation cycle number is higher, the amplitude of the first cycle will become small. Therefore, the transient response effect becomes weaker than in cases with fewer modulation cycles. Figure 7f,h show that within the entire frequency domain, the second harmonics of the output waveforms are always smaller than those of the ideal waveforms. Therefore, even the harmonics component of the output waveforms could be suppressed by the differential structures. Both of these two kinds of signals are able to yield the largest peak-to-peak amplitudes and be adopted as the guided wave inspection signals.
Figure 7. Output results of typical signals: (a) a 360-kHz three-cycle sine burst and its spectrum (b); (c) a 360-kHz ten-cycle sine burst and its spectrum (d); (e) a Hanning window function-modulated 360-kHz three-cycle sinusoidal signal and its spectrum (f); (g) a Hanning-window-function-modulated 360-kHz ten-cycle sinusoidal signal and its spectrum (h). Solid lines are measured values and dashed lines are ideal waveforms.
4.3. Evaluation of Voltage Gain and P1dB Compression Point
When the MOSFETs and output power transformer of the final amplifier stages are not changed, the bandwidth of each LAM can be expanded by adding feedback circuit, and the bandwidth of the linear PA can be correspondingly expanded. The linear PA with and without feedback are measured separately to study the effect of feedback circuits on bandwidth. The output responses of the linear PA were measured by loading 25 cycles of long-duration sine bursts into the signal generator. The amplitudes of waveforms outputted from the linear PA were recorded by the oscilloscope, and then the peak output power was acquired according to the relation
2
out Load/
outP V R= (1)
Figure 7. Output results of typical signals: (a) a 360-kHz three-cycle sine burst and its spectrum (b);(c) a 360-kHz ten-cycle sine burst and its spectrum (d); (e) a Hanning window function-modulated360-kHz three-cycle sinusoidal signal and its spectrum (f); (g) a Hanning-window-function-modulated360-kHz ten-cycle sinusoidal signal and its spectrum (h). Solid lines are measured values and dashedlines are ideal waveforms.
4.3. Evaluation of Voltage Gain and P1dB Compression Point
When the MOSFETs and output power transformer of the final amplifier stages are not changed,the bandwidth of each LAM can be expanded by adding feedback circuit, and the bandwidth of thelinear PA can be correspondingly expanded. The linear PA with and without feedback are measuredseparately to study the effect of feedback circuits on bandwidth. The output responses of the linearPA were measured by loading 25 cycles of long-duration sine bursts into the signal generator. The
Sensors 2019, 19, 2924 10 of 18
amplitudes of waveforms outputted from the linear PA were recorded by the oscilloscope, and thenthe peak output power was acquired according to the relation
Pout = V2out/RLoad (1)
In Equation (1), Pout is the peak output power for the resistor load, Vout is the peak-peak voltageof the resistor load, RLoad is the value of the resistor load.
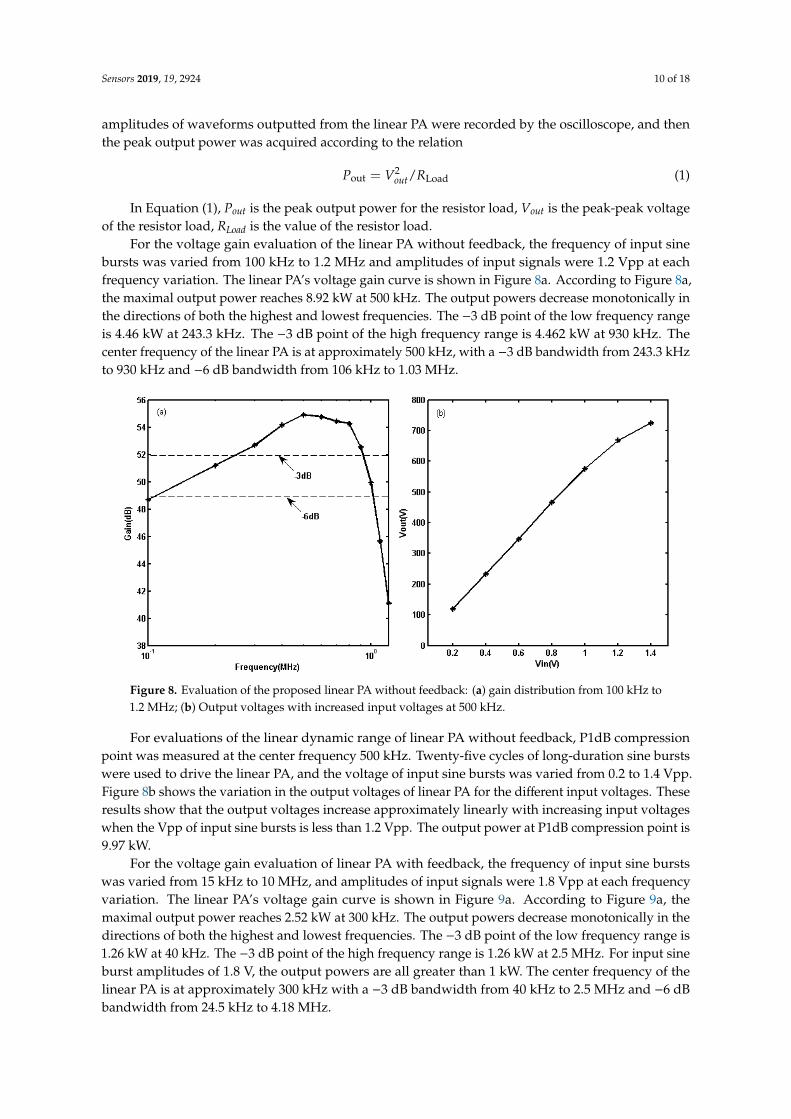
For the voltage gain evaluation of the linear PA without feedback, the frequency of input sinebursts was varied from 100 kHz to 1.2 MHz and amplitudes of input signals were 1.2 Vpp at eachfrequency variation. The linear PA’s voltage gain curve is shown in Figure 8a. According to Figure 8a,the maximal output power reaches 8.92 kW at 500 kHz. The output powers decrease monotonically inthe directions of both the highest and lowest frequencies. The −3 dB point of the low frequency rangeis 4.46 kW at 243.3 kHz. The −3 dB point of the high frequency range is 4.462 kW at 930 kHz. Thecenter frequency of the linear PA is at approximately 500 kHz, with a −3 dB bandwidth from 243.3 kHzto 930 kHz and −6 dB bandwidth from 106 kHz to 1.03 MHz.
Sensors 2019, 19, x FOR PEER REVIEW 10 of 18
In Equation (1), outP is the peak output power for the resistor load, outV is the peak-peak voltage of the resistor load, LoadR is the value of the resistor load.
For the voltage gain evaluation of the linear PA without feedback, the frequency of input sine bursts was varied from 100 kHz to 1.2 MHz and amplitudes of input signals were 1.2 Vpp at each frequency variation. The linear PA’s voltage gain curve is shown in Figure 8a. According to Figure 8a, the maximal output power reaches 8.92 kW at 500 kHz. The output powers decrease monotonically in the directions of both the highest and lowest frequencies. The −3 dB point of the low frequency range is 4.46 kW at 243.3 kHz. The −3 dB point of the high frequency range is 4.462 kW at 930 kHz. The center frequency of the linear PA is at approximately 500 kHz, with a −3 dB bandwidth from 243.3 kHz to 930 kHz and −6 dB bandwidth from 106 kHz to 1.03 MHz.
For evaluations of the linear dynamic range of linear PA without feedback, P1dB compression point was measured at the center frequency 500 kHz. Twenty-five cycles of long-duration sine bursts were used to drive the linear PA, and the voltage of input sine bursts was varied from 0.2 to 1.4 Vpp. Figure 8b shows the variation in the output voltages of linear PA for the different input voltages. These results show that the output voltages increase approximately linearly with increasing input voltages when the Vpp of input sine bursts is less than 1.2 Vpp. The output power at P1dB compression point is 9.97 kW.
Figure 8. Evaluation of the proposed linear PA without feedback: (a) gain distribution from 100 kHz to 1.2 MHz; (b) Output voltages with increased input voltages at 500 kHz.
For the voltage gain evaluation of linear PA with feedback, the frequency of input sine bursts was varied from 15 kHz to 10 MHz, and amplitudes of input signals were 1.8 Vpp at each frequency variation. The linear PA’s voltage gain curve is shown in Figure 9a. According to Figure 9a, the maximal output power reaches 2.52 kW at 300 kHz. The output powers decrease monotonically in the directions of both the highest and lowest frequencies. The −3 dB point of the low frequency range is 1.26 kW at 40 kHz. The −3 dB point of the high frequency range is 1.26 kW at 2.5 MHz. For input sine burst amplitudes of 1.8 V, the output powers are all greater than 1 kW. The center frequency of the linear PA is at approximately 300 kHz with a −3 dB bandwidth from 40 kHz to 2.5 MHz and −6 dB bandwidth from 24.5 kHz to 4.18 MHz.
For evaluations of the linear dynamic range of linear PA with feedback, P1dB compression point was measured at the center frequency 300 kHz. Twenty-five cycles of long-duration sine bursts were used to drive the linear PA, and the voltage of input sine bursts was varied from 0.05 to 2.2 Vpp. Figure 9b shows the variation in output voltages of linear PA for the different input voltages. These results show that the output voltages increase approximately linearly with increasing input voltages
Figure 8. Evaluation of the proposed linear PA without feedback: (a) gain distribution from 100 kHz to1.2 MHz; (b) Output voltages with increased input voltages at 500 kHz.
For evaluations of the linear dynamic range of linear PA without feedback, P1dB compressionpoint was measured at the center frequency 500 kHz. Twenty-five cycles of long-duration sine burstswere used to drive the linear PA, and the voltage of input sine bursts was varied from 0.2 to 1.4 Vpp.Figure 8b shows the variation in the output voltages of linear PA for the different input voltages. Theseresults show that the output voltages increase approximately linearly with increasing input voltageswhen the Vpp of input sine bursts is less than 1.2 Vpp. The output power at P1dB compression point is9.97 kW.
For the voltage gain evaluation of linear PA with feedback, the frequency of input sine burstswas varied from 15 kHz to 10 MHz, and amplitudes of input signals were 1.8 Vpp at each frequencyvariation. The linear PA’s voltage gain curve is shown in Figure 9a. According to Figure 9a, themaximal output power reaches 2.52 kW at 300 kHz. The output powers decrease monotonically in thedirections of both the highest and lowest frequencies. The −3 dB point of the low frequency range is1.26 kW at 40 kHz. The −3 dB point of the high frequency range is 1.26 kW at 2.5 MHz. For input sineburst amplitudes of 1.8 V, the output powers are all greater than 1 kW. The center frequency of thelinear PA is at approximately 300 kHz with a −3 dB bandwidth from 40 kHz to 2.5 MHz and −6 dBbandwidth from 24.5 kHz to 4.18 MHz.

Sensors 2019, 19, 2924 11 of 18
Sensors 2019, 19, x FOR PEER REVIEW 11 of 18
when the Vpp of input sine bursts is less than 1.9 Vpp. The output power at P1dB compression point is 2.9 kW.
Figure 9. Evaluation of the proposed linear PA with feedback: (a) gain distribution from 15 kHz to 10 MHz; (b) Output voltages with increased input voltages at 300 kHz.
When each LPA without and with negative voltage feedback, the maximum transient output power reduces from 8.92 kW to 2.52 kW, but the low and high frequency performance of linear PA is improved. The −3 dB bandwidth has expanded from 930 kHz to 2.5 MHz at high frequency bandwidth. The output power of linear PA without feedback is only 462 W at 1.2 MHz, and the output power of linear PA with feedback is increased to 1.93 kW at the same frequency. The −3 dB bandwidth has expanded from 243.3 kHz to 40 kHz at low frequency bandwidth. The output power of linear PA without feedback is only 1.95 kW at 100 kHz, and the output power of linear PA with feedback is increased to 2.2 kW at the same frequency. Furthermore, at the frequency point of 40 kHz, the output power of the linear PA with feedback circuit is 1.26 kW, but the output waveform of the linear PA without feedback circuit has been seriously distorted. Therefore, the linear PA with feedback circuit is more suitable for EMATs UGW applications.
4.4. Evaluation of Different Resistance Effects
Different material detected and lift-off variation lead to the change of coil impedance in EMAT, which has been confirmed in the research of eddy current in reference [33–36]. Then, different loads of 20 Ω, 50 Ω, 75 Ω, and 100 Ω were studied. When the input voltage was 1.8 V, the output voltages of different loads were tested in the range of 30 kHz to 3.2 MHz. The results are shown in Figure 10. From Figure 10, we can see that for 20 Ω load, the −3 dB bandwidth is 39 kHz–1.83 MHz, and the maximum voltage gain is 43.16 dB; for 50 Ω load, the −3 dB bandwidth is 40 kHz–2.5 MHz, and the maximum voltage gain is 46.92 dB; for 75 Ω load, the −3 dB bandwidth is 42 kHz–2.9 MHz, and the maximum voltage gain is 48.05 dB; for 100 Ω load, the −3 dB bandwidth is 43 kHz–3.2 MHz, and the maximum voltage gain is 48.51 dB. For the same input voltage, larger load resistance will achieve higher output voltage, larger gain, and wider bandwidth.
Figure 9. Evaluation of the proposed linear PA with feedback: (a) gain distribution from 15 kHz to10 MHz; (b) Output voltages with increased input voltages at 300 kHz.
For evaluations of the linear dynamic range of linear PA with feedback, P1dB compression pointwas measured at the center frequency 300 kHz. Twenty-five cycles of long-duration sine bursts wereused to drive the linear PA, and the voltage of input sine bursts was varied from 0.05 to 2.2 Vpp.Figure 9b shows the variation in output voltages of linear PA for the different input voltages. Theseresults show that the output voltages increase approximately linearly with increasing input voltageswhen the Vpp of input sine bursts is less than 1.9 Vpp. The output power at P1dB compression point is2.9 kW.
When each LPA without and with negative voltage feedback, the maximum transient outputpower reduces from 8.92 kW to 2.52 kW, but the low and high frequency performance of linear PA isimproved. The −3 dB bandwidth has expanded from 930 kHz to 2.5 MHz at high frequency bandwidth.The output power of linear PA without feedback is only 462 W at 1.2 MHz, and the output power oflinear PA with feedback is increased to 1.93 kW at the same frequency. The −3 dB bandwidth hasexpanded from 243.3 kHz to 40 kHz at low frequency bandwidth. The output power of linear PAwithout feedback is only 1.95 kW at 100 kHz, and the output power of linear PA with feedback isincreased to 2.2 kW at the same frequency. Furthermore, at the frequency point of 40 kHz, the outputpower of the linear PA with feedback circuit is 1.26 kW, but the output waveform of the linear PAwithout feedback circuit has been seriously distorted. Therefore, the linear PA with feedback circuit ismore suitable for EMATs UGW applications.
4.4. Evaluation of Different Resistance Effects
Different material detected and lift-off variation lead to the change of coil impedance in EMAT,which has been confirmed in the research of eddy current in reference [33–36]. Then, different loads of20 Ω, 50 Ω, 75 Ω, and 100 Ω were studied. When the input voltage was 1.8 V, the output voltages ofdifferent loads were tested in the range of 30 kHz to 3.2 MHz. The results are shown in Figure 10. FromFigure 10, we can see that for 20 Ω load, the −3 dB bandwidth is 39 kHz–1.83 MHz, and the maximumvoltage gain is 43.16 dB; for 50 Ω load, the −3 dB bandwidth is 40 kHz–2.5 MHz, and the maximumvoltage gain is 46.92 dB; for 75 Ω load, the −3 dB bandwidth is 42 kHz–2.9 MHz, and the maximumvoltage gain is 48.05 dB; for 100 Ω load, the −3 dB bandwidth is 43 kHz–3.2 MHz, and the maximumvoltage gain is 48.51 dB. For the same input voltage, larger load resistance will achieve higher outputvoltage, larger gain, and wider bandwidth.

Sensors 2019, 19, 2924 12 of 18Sensors 2019, 19, x FOR PEER REVIEW 12 of 18
Figure 10. Output voltage (a) and normalized gain (b) measured under different loads of 20 Ω, 50 Ω, 75 Ω and 100 Ω.
From Figure 10, the maximum output power of 20 Ω can reach 2.65 kW; 50 Ω can reach 2.52 kW; 75 Ω can reach 2.18 kW; and 100 Ω can reach 1.82 kW near the central frequency of 300 kHz. In the range below the central frequency, the load is smaller; the output power is larger. However, when the frequency increases to 800 kHz, the output power of 50 Ω is greater than that of 20 Ω. When the frequency increases to 2 MHz, the output power of 100 Ω is greater than that of 20 Ω. This is mainly because the output impedance of the transformer always varies with the frequency, which results in the output impedance of the power amplifier changing with the frequency. In addition, the output characteristics of each amplifier module also vary with frequency.
5. EMAT Inspection Experiment and Results
In Section 4, for the convenience of performance evaluation, a 50 Ω resistor was used as a load on the specially designed linear PA. Because EMATs always exhibit complex impedance, the energy transfer process between the output stage of the linear PA and the EMAT is more complicated than when the linear PA excites a resistor load. Therefore, these experiments were required to verify that the linear PA can excite an EMAT to generate ultrasonic guided waves in an actual inspection.
5.1. Experimental System
Figure 11 shows the experimental system for testing the ability of the linear PA to excite an EMAT for generating ultrasonic guided waves. Pairs of identical EMATs were tested in a pitch-catch configuration on two different plates, and the materials of the plates were listed in Table 1. Planar coil EMATs were developed to excite the single S0 mode according to the principle presented in [2]. The arrangement of two EMATs and the dimensions of the plates used in these experiments were also listed in Table 1.
The gated signal emitted from the synchronic port of the signal generator (33220A, Agilent) was connected to the first channel of a digital storage oscilloscope (TDS2024B, Tektronix, Beaverton, OR, USA). The oscilloscope was triggered at a high TTL by a signal delivered from the signal generator that was longer than the transmitted burst signal over a period of 100 ms. The transmitting EMAT was driven by the output port of the linear PA, which was driven by the signal generator. The signals used to excite the transmitting EMAT were fed into the second channel of the digital storage oscilloscope through a voltage probe (P2220, Tektronix) with the 10 dB attenuator. The receiving EMAT was connected through a specially designed pre-amplifier that provided approximately 92 dB of gain into the third channel of the digital storage oscilloscope. To eliminate random noise, the received signals were averaged 32 times in all experiments.
Figure 10. Output voltage (a) and normalized gain (b) measured under different loads of 20 Ω, 50 Ω,75 Ω and 100 Ω.
From Figure 10, the maximum output power of 20 Ω can reach 2.65 kW; 50 Ω can reach 2.52 kW;75 Ω can reach 2.18 kW; and 100 Ω can reach 1.82 kW near the central frequency of 300 kHz. In therange below the central frequency, the load is smaller; the output power is larger. However, whenthe frequency increases to 800 kHz, the output power of 50 Ω is greater than that of 20 Ω. When thefrequency increases to 2 MHz, the output power of 100 Ω is greater than that of 20 Ω. This is mainlybecause the output impedance of the transformer always varies with the frequency, which results inthe output impedance of the power amplifier changing with the frequency. In addition, the outputcharacteristics of each amplifier module also vary with frequency.
5. EMAT Inspection Experiment and Results
In Section 4, for the convenience of performance evaluation, a 50 Ω resistor was used as a loadon the specially designed linear PA. Because EMATs always exhibit complex impedance, the energytransfer process between the output stage of the linear PA and the EMAT is more complicated thanwhen the linear PA excites a resistor load. Therefore, these experiments were required to verify thatthe linear PA can excite an EMAT to generate ultrasonic guided waves in an actual inspection.
5.1. Experimental System
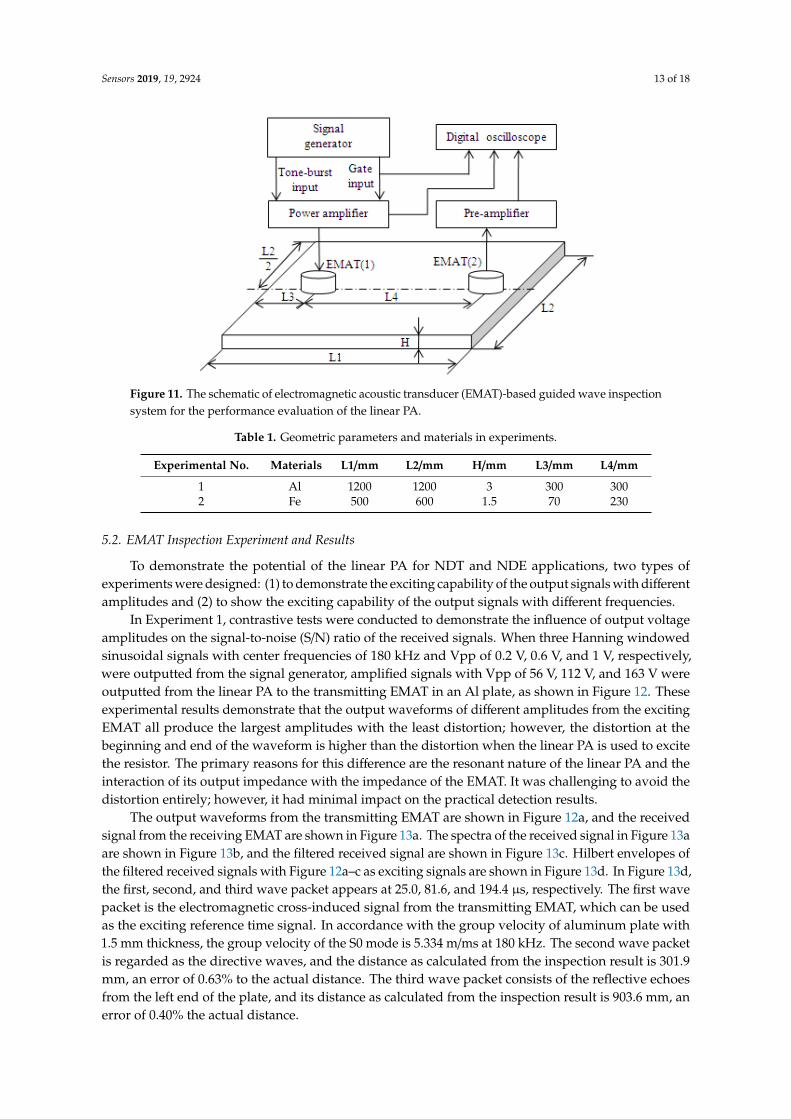
Figure 11 shows the experimental system for testing the ability of the linear PA to excite anEMAT for generating ultrasonic guided waves. Pairs of identical EMATs were tested in a pitch-catchconfiguration on two different plates, and the materials of the plates were listed in Table 1. Planarcoil EMATs were developed to excite the single S0 mode according to the principle presented in [2].The arrangement of two EMATs and the dimensions of the plates used in these experiments were alsolisted in Table 1.
The gated signal emitted from the synchronic port of the signal generator (33220A, Agilent) wasconnected to the first channel of a digital storage oscilloscope (TDS2024B, Tektronix, Beaverton, OR,USA). The oscilloscope was triggered at a high TTL by a signal delivered from the signal generatorthat was longer than the transmitted burst signal over a period of 100 ms. The transmitting EMAT wasdriven by the output port of the linear PA, which was driven by the signal generator. The signals usedto excite the transmitting EMAT were fed into the second channel of the digital storage oscilloscopethrough a voltage probe (P2220, Tektronix) with the 10 dB attenuator. The receiving EMAT wasconnected through a specially designed pre-amplifier that provided approximately 92 dB of gain intothe third channel of the digital storage oscilloscope. To eliminate random noise, the received signalswere averaged 32 times in all experiments.
Sensors 2019, 19, 2924 13 of 18Sensors 2019, 19, x FOR PEER REVIEW 13 of 18
Figure 11. The schematic of electromagnetic acoustic transducer (EMAT)-based guided wave inspection system for the performance evaluation of the linear PA.
Table 1. Geometric parameters and materials in experiments.
Experimental No. Materials L1/mm L2/mm H/mm L3/mm L4/mm 1 Al 1200 1200 3 300 300 2 Fe 500 600 1.5 70 230
5.2. EMAT Inspection Experiment and Results
To demonstrate the potential of the linear PA for NDT and NDE applications, two types of experiments were designed: (1) to demonstrate the exciting capability of the output signals with different amplitudes and (2) to show the exciting capability of the output signals with different frequencies.
In Experiment 1, contrastive tests were conducted to demonstrate the influence of output voltage amplitudes on the signal-to-noise (S/N) ratio of the received signals. When three Hanning windowed sinusoidal signals with center frequencies of 180 kHz and Vpp of 0.2 V, 0.6 V, and 1 V, respectively, were outputted from the signal generator, amplified signals with Vpp of 56 V, 112 V, and 163 V were outputted from the linear PA to the transmitting EMAT in an Al plate, as shown in Figure 12. These experimental results demonstrate that the output waveforms of different amplitudes from the exciting EMAT all produce the largest amplitudes with the least distortion; however, the distortion at the beginning and end of the waveform is higher than the distortion when the linear PA is used to excite the resistor. The primary reasons for this difference are the resonant nature of the linear PA and the interaction of its output impedance with the impedance of the EMAT. It was challenging to avoid the distortion entirely; however, it had minimal impact on the practical detection results.
Figure 11. The schematic of electromagnetic acoustic transducer (EMAT)-based guided wave inspectionsystem for the performance evaluation of the linear PA.
Table 1. Geometric parameters and materials in experiments.
Experimental No. Materials L1/mm L2/mm H/mm L3/mm L4/mm
1 Al 1200 1200 3 300 3002 Fe 500 600 1.5 70 230
5.2. EMAT Inspection Experiment and Results
To demonstrate the potential of the linear PA for NDT and NDE applications, two types ofexperiments were designed: (1) to demonstrate the exciting capability of the output signals with differentamplitudes and (2) to show the exciting capability of the output signals with different frequencies.
In Experiment 1, contrastive tests were conducted to demonstrate the influence of output voltageamplitudes on the signal-to-noise (S/N) ratio of the received signals. When three Hanning windowedsinusoidal signals with center frequencies of 180 kHz and Vpp of 0.2 V, 0.6 V, and 1 V, respectively,were outputted from the signal generator, amplified signals with Vpp of 56 V, 112 V, and 163 V wereoutputted from the linear PA to the transmitting EMAT in an Al plate, as shown in Figure 12. Theseexperimental results demonstrate that the output waveforms of different amplitudes from the excitingEMAT all produce the largest amplitudes with the least distortion; however, the distortion at thebeginning and end of the waveform is higher than the distortion when the linear PA is used to excitethe resistor. The primary reasons for this difference are the resonant nature of the linear PA and theinteraction of its output impedance with the impedance of the EMAT. It was challenging to avoid thedistortion entirely; however, it had minimal impact on the practical detection results.
The output waveforms from the transmitting EMAT are shown in Figure 12a, and the receivedsignal from the receiving EMAT are shown in Figure 13a. The spectra of the received signal in Figure 13aare shown in Figure 13b, and the filtered received signal are shown in Figure 13c. Hilbert envelopes ofthe filtered received signals with Figure 12a–c as exciting signals are shown in Figure 13d. In Figure 13d,the first, second, and third wave packet appears at 25.0, 81.6, and 194.4 µs, respectively. The first wavepacket is the electromagnetic cross-induced signal from the transmitting EMAT, which can be usedas the exciting reference time signal. In accordance with the group velocity of aluminum plate with1.5 mm thickness, the group velocity of the S0 mode is 5.334 m/ms at 180 kHz. The second wave packetis regarded as the directive waves, and the distance as calculated from the inspection result is 301.9mm, an error of 0.63% to the actual distance. The third wave packet consists of the reflective echoesfrom the left end of the plate, and its distance as calculated from the inspection result is 903.6 mm, anerror of 0.40% the actual distance.

Sensors 2019, 19, 2924 14 of 18Sensors 2019, 19, x FOR PEER REVIEW 14 of 18
Figure 12. Output results of Hanning-window-function-modulated 180-kHz three-cycle sinusoidal signals with Vpp of (a) 56 V, (b) 112 V, (c) 163 V when the EMAT was used as the load. Solid lines are measured values, and dashed lines are ideal waveforms.
The output waveforms from the transmitting EMAT are shown in Figure 12a, and the received signal from the receiving EMAT are shown in Figure 13a. The spectra of the received signal in Figure 13a are shown in Figure 13b, and the filtered received signal are shown in Figure 13c. Hilbert envelopes of the filtered received signals with Figure 12a–c as exciting signals are shown in Figure 13d. In Figure 13d, the first, second, and third wave packet appears at 25.0, 81.6, and 194.4 µs, respectively. The first wave packet is the electromagnetic cross-induced signal from the transmitting EMAT, which can be used as the exciting reference time signal. In accordance with the group velocity of aluminum plate with 1.5 mm thickness, the group velocity of the S0 mode is 5.334 m/ms at 180 kHz. The second wave packet is regarded as the directive waves, and the distance as calculated from the inspection result is 301.9 mm, an error of 0.63% to the actual distance. The third wave packet consists of the reflective echoes from the left end of the plate, and its distance as calculated from the inspection result is 903.6 mm, an error of 0.40% the actual distance.
The S/N ratio was acquired according to the relation [8]:
dB 10 signal20 log ( / )
noiseSNR A A= (2)
In Equation (2), dB
SNR is the signal-to-noise ratio of the signals, signalA is the maximum
amplitude in the second wave, noiseA is the average value of noise signal amplitudes between the
second and third wave packet. The S/N ratios of Hilbert envelopes of the filtered received signals in Figure 13d with Figure 12a
–c as exciting signals respectively are 12.11 dB, 26.52 dB, 29.19 dB and the amplitudes of the directive waves are 0.46, 0.8, and 0.93 V. From the experimental results, the amplitudes of the exciting signals are larger, and the S/N ratio is better when the other inspection conditions are the same. When the amplitudes of the exciting signals increase, the amplitudes and S/N ratios of the echoes also increase. Therefore, it would be beneficial to improve the S/N ratios to increase the output power of the linear PA.
Figure 12. Output results of Hanning-window-function-modulated 180-kHz three-cycle sinusoidalsignals with Vpp of (a) 56 V, (b) 112 V, (c) 163 V when the EMAT was used as the load. Solid lines aremeasured values, and dashed lines are ideal waveforms.
Sensors 2019, 19, x FOR PEER REVIEW 15 of 18
Figure 13. Inspection results in an Al plate when the exciting signals were with center frequencies of 180 kHz: (a) received signal when the exciting signals’ Vpp of 56 V; (b) spectra of the received signal when the exciting signals’ Vpp of 56 V (solid lines) and the Gaussian function (dashed lines); (c) filtered received signal when the exciting signals’ Vpp of 56 V; (d) Hilbert envelope of the filtered received signal when the exciting signals’ Vpp of 56 V, 112 V, and 163 V.
To show that the linear PA could excite the EMAT to generate a guided wave in a different frequency, Hanning windowed three-cycle sine bursts at 360 kHz with 236 Vpp outputted from the linear PA were used to excite the EMAT to generate guided waves in a Ferrum plate in Experiment #2. The received signals from the receiving EMAT are shown in Figure 14. In Figure 14d, the first, second, and third wave packet appears at 7.3, 33.4, and 60.2 µs, respectively. The calculated results for the directive waves and the reflective echo from the left end of the plate have an error of 0.41 and 0.93%, respectively, relative to the actual position. The experimental result shows that a high S/N ratio and good detection accuracy are achieved, and verifies the exciting capability of the different frequency signals emitted from the linear PA.
The test results from Experiment 1 and Experiment 2 show that the linear PA can efficiently excite the EMAT to generate ultrasonic guided waves, and the inspected results satisfy the requirements for the application. Therefore, the driving capability of the linear PA is sufficient, not only to drive the resistor load but also to drive the EMAT, and can be effectively used in an electromagnetic ultrasonic guided wave detection system.
Figure 13. Inspection results in an Al plate when the exciting signals were with center frequencies of180 kHz: (a) received signal when the exciting signals’ Vpp of 56 V; (b) spectra of the received signalwhen the exciting signals’ Vpp of 56 V (solid lines) and the Gaussian function (dashed lines); (c) filteredreceived signal when the exciting signals’ Vpp of 56 V; (d) Hilbert envelope of the filtered receivedsignal when the exciting signals’ Vpp of 56 V, 112 V, and 163 V.
The S/N ratio was acquired according to the relation [8]:
SNRdB = 20 log10(Asignal/Anoise) (2)
Sensors 2019, 19, 2924 15 of 18
In Equation (2), SNRdB is the signal-to-noise ratio of the signals, Asignal is the maximum amplitudein the second wave, Anoise is the average value of noise signal amplitudes between the second and thirdwave packet.
The S/N ratios of Hilbert envelopes of the filtered received signals in Figure 13d with Figure 12a–cas exciting signals respectively are 12.11 dB, 26.52 dB, 29.19 dB and the amplitudes of the directivewaves are 0.46, 0.8, and 0.93 V. From the experimental results, the amplitudes of the exciting signalsare larger, and the S/N ratio is better when the other inspection conditions are the same. When theamplitudes of the exciting signals increase, the amplitudes and S/N ratios of the echoes also increase.Therefore, it would be beneficial to improve the S/N ratios to increase the output power of the linear PA.
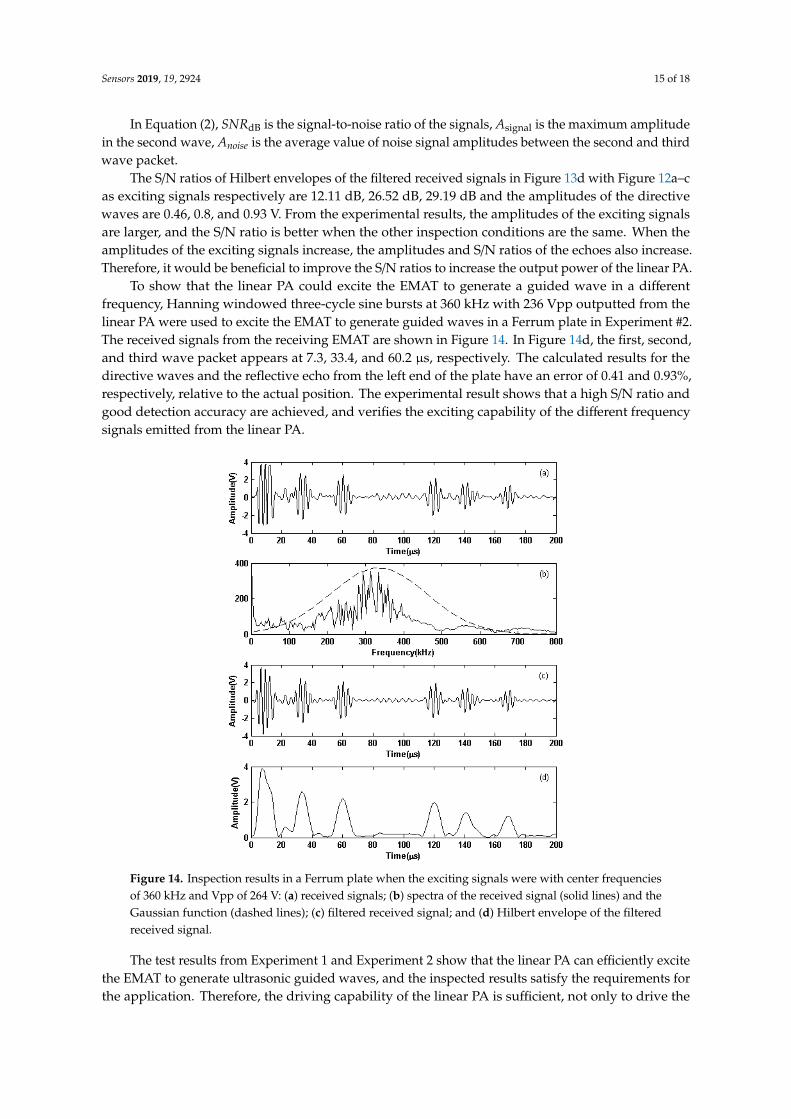
To show that the linear PA could excite the EMAT to generate a guided wave in a differentfrequency, Hanning windowed three-cycle sine bursts at 360 kHz with 236 Vpp outputted from thelinear PA were used to excite the EMAT to generate guided waves in a Ferrum plate in Experiment #2.The received signals from the receiving EMAT are shown in Figure 14. In Figure 14d, the first, second,and third wave packet appears at 7.3, 33.4, and 60.2 µs, respectively. The calculated results for thedirective waves and the reflective echo from the left end of the plate have an error of 0.41 and 0.93%,respectively, relative to the actual position. The experimental result shows that a high S/N ratio andgood detection accuracy are achieved, and verifies the exciting capability of the different frequencysignals emitted from the linear PA.Sensors 2019, 19, x FOR PEER REVIEW 16 of 18
Figure 14. Inspection results in a Ferrum plate when the exciting signals were with center frequencies of 360 kHz and Vpp of 264 V: (a) received signals; (b) spectra of the received signal (solid lines) and the Gaussian function (dashed lines); (c) filtered received signal; and (d) Hilbert envelope of the filtered received signal.
6. Conclusions
A customized linear PA for electromagnetic ultrasonic guided wave inspection was developed. The amplifier adopts a differential circuit structure to suppress the output disruption and even harmonics waves. The output terminals of many LAMs are connected in parallel to increase the output power. The differential circuit structure doubles the output power to greater than 1 kW in its −3 dB bandwidth. The −3 dB bandwidth of the linear PA is broadened from 40 kHz to 2.5 MHz by negative voltage feedback. The testing results show that the linear PA can be used for exciting EMATs to generate guided waves in a metallic plate structure, and has excellent potential to be used as general equipment for exciting EMATs because of its high instantaneous power output, good linearity, and broad bandwidth.
Author Contributions: Conceptualization, J.Z. and Y.Z.; data curation, J.Z. and Y.Z.; formal analysis, J.Z. and Y.Z.; funding acquisition, Y.Z.; investigation, J.Z. and Y.Z.; methodology, J.Z. and Y.Z.; project administration, J.Z. and Y.Z.; resources, J.Z. and Y.Z.; software, Y.Z.; validation, J.Z.; writing—original draft, J.Z.; writing—review and editing. Y.Z. J.Z. and Y.Z contributed equally to the work.
Funding: This research was supported by the National Key Research and Development Program of China, grant number 2016YFF0203003 and the National Natural Science Foundation of China, grant number 61601413, 51605494.
Conflicts of Interest: The authors declare no conflicts of interest.
References
1. Cong, M.; Wu, X.J.; Qian, C.Q. A longitudinal lode electromagnetic acoustic transducer (EMAT) based on a permanent magnet chain for pipe inspection. Sensors 2016, 740, 1–18.
2. Wilcox, P.; Lowe, M.J.S.; Cawley, P. The excitation and detection of Lamb waves with planar coil electromagnetic acoustic transducers. IEEE Trans. Ultrason. Ferroelec. Freq. Contr. 2005, 52, 2370–2382.
Figure 14. Inspection results in a Ferrum plate when the exciting signals were with center frequenciesof 360 kHz and Vpp of 264 V: (a) received signals; (b) spectra of the received signal (solid lines) and theGaussian function (dashed lines); (c) filtered received signal; and (d) Hilbert envelope of the filteredreceived signal.
The test results from Experiment 1 and Experiment 2 show that the linear PA can efficiently excitethe EMAT to generate ultrasonic guided waves, and the inspected results satisfy the requirements forthe application. Therefore, the driving capability of the linear PA is sufficient, not only to drive the

Sensors 2019, 19, 2924 16 of 18
resistor load but also to drive the EMAT, and can be effectively used in an electromagnetic ultrasonicguided wave detection system.
6. Conclusions
A customized linear PA for electromagnetic ultrasonic guided wave inspection was developed.The amplifier adopts a differential circuit structure to suppress the output disruption and evenharmonics waves. The output terminals of many LAMs are connected in parallel to increase theoutput power. The differential circuit structure doubles the output power to greater than 1 kW in its−3 dB bandwidth. The −3 dB bandwidth of the linear PA is broadened from 40 kHz to 2.5 MHz bynegative voltage feedback. The testing results show that the linear PA can be used for exciting EMATsto generate guided waves in a metallic plate structure, and has excellent potential to be used as generalequipment for exciting EMATs because of its high instantaneous power output, good linearity, andbroad bandwidth.
Author Contributions: Conceptualization, J.Z. and Y.Z.; data curation, J.Z. and Y.Z.; formal analysis, J.Z. and Y.Z.;funding acquisition, Y.Z.; investigation, J.Z. and Y.Z.; methodology, J.Z. and Y.Z.; project administration, J.Z. andY.Z.; resources, J.Z. and Y.Z.; software, Y.Z.; validation, J.Z.; writing—original draft, J.Z.; writing—review andediting, Y.Z. J.Z. and Y.Z contributed equally to the work.
Funding: This research was supported by the National Key Research and Development Program of China, grantnumber 2016YFF0203003 and the National Natural Science Foundation of China, grant number 61601413, 51605494.
Conflicts of Interest: The authors declare no conflicts of interest.
References
1. Cong, M.; Wu, X.J.; Qian, C.Q. A longitudinal lode electromagnetic acoustic transducer (EMAT) based on apermanent magnet chain for pipe inspection. Sensors 2016, 16, 740. [CrossRef]
2. Wilcox, P.; Lowe, M.J.S.; Cawley, P. The excitation and detection of Lamb waves with planar coilelectromagnetic acoustic transducers. IEEE Trans. Ultrason. Ferroelec. Freq. Contr. 2005, 52, 2370–2382.[CrossRef]
3. Lee, J.K.; Kim, Y.Y. Tuned double-coil EMATs for omnidirectional symmetric mode lamb wave generation.NDT E Int. 2016, 83, 38–47. [CrossRef]
4. Lee, J.H.; Kim, D.H. Integrity evaluation of pipe welding zones using wavelet transforms, and specificsensitivities based on SH-EMAT Pulse-Echo Method. Int. J. Precis. Eng. Manufac. 2014, 15, 2051–2057.[CrossRef]
5. Clough, M.; Fleming, M.; Dixon, S. Circumferential guided wave EMAT system for pipeline screening usingshear horizontal ultrasound. NDT E Int. 2017, 86, 20–27. [CrossRef]
6. Kogia, M.; Gan, T.H.; Balachandran, W.; Livadas, M.; Kappatos, V.; Szabo, I.; Mohimi, A.; Round, A. Hightemperature shear horizontal electromagnetic acoustic transducer for guided wave inspection. Sensors 2016,16, 582. [CrossRef]
7. Kogia, M.; Cheng, L.; Mohimi, A.; Kappatos, A.; Gan, T.H.; Balachandran, W.; Selcuk, C. Electromagneticacoustic transducers applied to high temperature plates for potential use in the solar thermal industry. Appl.Sci. 2015, 5, 1715–1734. [CrossRef]
8. Lunna, N.; Dixona, S.; Potterb, M.D.G. High temperature EMAT design for scanning or fixed point operationon magnetite coated steel. NDT E Int. 2017, 89, 74–80. [CrossRef]
9. Liu, Z.H.; Zhao, J.C.; Wu, B.; Zhang, L.N.; He, C.F. Configuration optimization of magnetostrictive transducersfor longitudinal guided wave inspection in seven-wire steel strands. NDT E Int. 2010, 43, 484–492. [CrossRef]
10. Wilcox, P.; Lowe, M.J.S.; Cawley, P. The effect of dispersion on long range inspection using guided waves.NDT E Int. 2001, 34, 1–9. [CrossRef]
11. Boonsang, S.; Dewhurst, R.J. A sensitive electromagnetic acoustic transducer for picometer-scale ultrasonicdisplacement measurements. Sens. Actuator A 2006, 127, 345–354. [CrossRef]
12. Isla, J.; Cegla, F. EMAT phased array: A feasibility study of surface crack detection. Ultrasonics 2017, 78, 1–9.[CrossRef] [PubMed]

Sensors 2019, 19, 2924 17 of 18
13. Jeremy, A.B.; Geoffrey, R.L. A low-cost, high-performance pulse generator for ultrasound imaging. IEEETrans. Ultrason. Ferroelec. Freq. Contr. 2002, 49, 848–851.
14. Salazar, J.; Turó, A.J.; Chhvez, J.A.; Ortega, J.A.; Garcia, M.J. High-power high-resolution pulser for air-coupledultrasonic NDE applications. In Proceedings of the IEEE Instrumentation and Measurement TechnologyConference, Budapest, Hungary, 21–23 May 2001.
15. Rodríguez-Olivares, N.A.; Cruz-Cruz, J.V.; Gómez-Hernández, A.; Hernández-Alvarado, R.;Nava-Balanzar, L.; Salgado-Jiménez, T.; Soto-Cajiga, J.A. Improvement of ultrasonic pulse generatorfor automatic pipeline inspection. Sensors 2018, 18, 2950. [CrossRef] [PubMed]
16. Svilainis, L.; Chaziachmetovas, A.; Dumbrava, V. Efficient high voltage pulser for piezoelectric air coupledtransducer. Ultrasonics 2013, 53, 225–231. [CrossRef] [PubMed]
17. Svilainis, L.; Chaziachmetovas, A.; Dumbrava, V. Half bridge topology 500 V pulser for ultrasonic transducerexcitation. Ultrasonics 2015, 59, 79–85. [CrossRef]
18. Svilainis, L.; Dumbrava, V.; Chaziachmetovas, A. Investigation of the half bridge and transformer push–pullpulser topologies for ultrasonic transducer excitation. J. Circuits Syst. Comput. 2015, 24, 1550062. [CrossRef]
19. Xu, X.C.; Yen, J.T.; Shung, K.K. A low-cost bipolar pulse generator for high-frequency ultrasound applications.IEEE Trans. Ultrason. Ferroelec. Freq. Contr. 2007, 54, 443–447. [CrossRef]
20. Peng, H.; Sabate, J.; Wall, K.A.; Glaser, J.S. GaN-based high-frequency high-energy delivery transformerpush–pull inverter for ultrasound pulsing application. IEEE Trans. Power Electron. 2018, 33, 6794–6805.[CrossRef]
21. Gao, H.D.; Lopez, B. Development of single-channel and phased array electromagnetic acoustic transducersfor austenitic weld testing. Mater. Eval. 2010, 68, 821–827.
22. Agbossou, K.; Dion, J.L.; Carignan, S.; Abdelkrim, M.; Cheriti, A. Class D amplifier for a power piezoelectricload. IEEE Trans. Ultrason. Ferroelec. Freq. Contr. 2000, 47, 1036–1041. [CrossRef] [PubMed]
23. Svilainis, L.; Motiejunas, G. Power amplifier for ultrasonic transducer excitation. Ultragarsas 2006, 58, 30–36.24. Park, J.; Hu, C.; Shung, K.K. Stand-alone front-end system for high-frequency, high-frame-rate coded
excitation ultrasonic imaging. IEEE Trans. Ultrason. Ferroelec. Freq. Contr. 2011, 58, 2620–2630. [CrossRef][PubMed]
25. Park, J.; Hu, C.; Li, X.; Zhou, Q.; Shung, K.K. Wideband linear power amplifier for high-frequency ultrasoniccoded excitation imaging. IEEE Trans. Ultrason. Ferroelec. Freq. Contr. 2012, 59, 825–832. [CrossRef][PubMed]
26. Gaspar, M.; Pedrozzi, M.; Ferreira, L.F.R.; Garvey, T. A compact 500 MHz 4 kW solid-state power amplifierfor accelerator applications. Nucl. Instrum. Methods Phys. Res. A 2011, 637, 18–24. [CrossRef]
27. Jain, A.; Hannurkar, P.R.; Sharma, D.K.; Gupta, A.K.; Tiwari, A.K.; Lad, M.; Kumar, R.; Badapanda, M.K.;Gupta, P.D. Modular 20 kW solid state RF amplifier for Indus-2 syncrotron radiation source. Nucl. Instrum.Methods Phys. Res. A 2012, 676, 74–83. [CrossRef]
28. Ramarao, B.V.; Sonal, S.; Mishra, J.K.; Pande, M.; Singh, P.; Kumar, G.; Mukherjee, J. Development of 3 kW at325 MHz solid-state RF power amplifier using four power amplifier modules. Nucl. Instrum. Methods Phys.Res. A 2014, 735, 283–290. [CrossRef]
29. Song, K.; Zhang, F.; Hu, S.; Fan, Y. Ku-band 200-W pulsed power amplifier based on waveguide spatiallypower-combining technique for industrial applications. IEEE Trans. Ind. Electron. 2014, 61, 4274–4280.[CrossRef]
30. Jia, P.C.; Chen, L.Y.; Alexanian, A.; York, R.A. Broad-band high power amplifier using spatial power-combiningtechnique. IEEE Trans. Mircow. Theory Tech. 2003, 51, 2469–2475.
31. Lewis, G.K.; Olbricht, W.L. Development of a portable therapeutic and high intensity ultrasound system formilitary, medical, and research use. Rev. Sci. Instrum. 2008, 80, 114302. [CrossRef]
32. Lewis, G.K.; Olbricht, W.L. Design and characterization of a high-power ultrasound driver withultralow-output impedance. Rev. Sci. Instrum. 2009, 80, 114704. [CrossRef] [PubMed]
33. Mingyang, L.; Anthony, P.; Wuliang, Y. Acceleration of frequency sweeping in eddy-current computation.IEEE Trans. Magn. 2017, 53, 1–8.
34. Mingyang, L.; Liyuan, Y.; Anthony, P.; Wuliang, Y. A novel compensation algorithm for thickness measurementimmune to lift-off variations using eddy current method. IEEE Trans. Instrum. Meas. 2016, 65, 2773–2779.

Sensors 2019, 19, 2924 18 of 18
35. Mingyang, L.; Wenqian, Z.; Liyuan, Y.; Anthony, P.; Wuliang, Y.; Zhigang, Q. Reducing the lift-off effect onpermeability measurement for magnetic plates from multifrequency induction data. IEEE Trans. Instrum.Meas. 2017, 67, 167–174.
36. Mingyang, L.; Hanyang, X.; Wenqian, Z.; Liyuan, Y.; Qian, Z.; Anthony, P.; Wuliang, Y. Conductivity lift-off
invariance and measurement of permeability for ferrite metallic plates. NDT E Int. 2018, 95, 36–44.
© 2019 by the authors. Licensee MDPI, Basel, Switzerland. This article is an open accessarticle distributed under the terms and conditions of the Creative Commons Attribution(CC BY) license (http://creativecommons.org/licenses/by/4.0/).


![ELECTROMAGNETIC MODELING OF SUBSURFACE 3D …/67531/metadc672988/m2/1/high_re… · electromagnetic modeling on massively parallel computers: Radio Science, 31, 1-23. [3] Newman G.](https://static.fdocuments.in/doc/165x107/5edc481ead6a402d6666e2d6/electromagnetic-modeling-of-subsurface-3d-67531metadc672988m21highre-electromagnetic.jpg)