The Overlooked Evolutionary Dimension of Modern Fisheries Ulf Dieckmann 1 and Mikko Heino 2,1 1...
27
The Overlooked Evolutionary Dimension of Modern Fisheries Ulf Dieckmann 1 and Mikko Heino 2,1 1 International Institute for Applied Systems Analysis, Austria 2 University of Bergen, Norway
-
Upload
clark-ashby -
Category
Documents
-
view
214 -
download
0
Transcript of The Overlooked Evolutionary Dimension of Modern Fisheries Ulf Dieckmann 1 and Mikko Heino 2,1 1...

The OverlookedEvolutionary Dimension of
Modern Fisheries
Ulf Dieckmann1 and Mikko Heino2,1
1 International Institute for Applied Systems Analysis, Austria2 University of Bergen, Norway

Fishing the World’s Oceans
• A large fraction of our living natural resources are extracted from the oceans
• Annual production
100 million tonnes
17 kg per capita, on average
16% of world animal-protein supply
US$ 85 billion
• Yet, world fisheries are in a global crisis

World excluding China
China
Total catch in millions of tonnes
UN Food and Agriculture Organization
80
20
40
60
0
100
1950 1960 1970 1980 1990 2000
World Fisheries Have Reached a Ceiling

Percentage of stocks assessed
80%
20%
40%
60%
0%
Maximally exploited
Overexploited
UN Food and Agriculture Organization
1980 1990 2000
World Fisheries Have Reached a Ceiling

Shifting Baselines
Across generations, we lose track of what was natural
Example: Distribution of large fish in the North Atlantic
Tonnes per square km
19001900 20002000Christensen et al. Christensen et al. (2003)(2003)

Two Key Dimensions of Fishing
EcologyEcology
Changes innumbers of fish
EvolutionEvolution
Changes inheritable features of fish

Part 1: Ecological Effects of FishingEcological Effects of Fishing
EvolutionEcologyEcology
Changes innumbers of fish
Changes inheritable features of fish

Fishing Down the Food Web
Pauly et al. (1998) © Pauly et al. (1998) © Nature Publishing GroupNature Publishing Group
Once large fish are gone, small fish further down the food web are caught
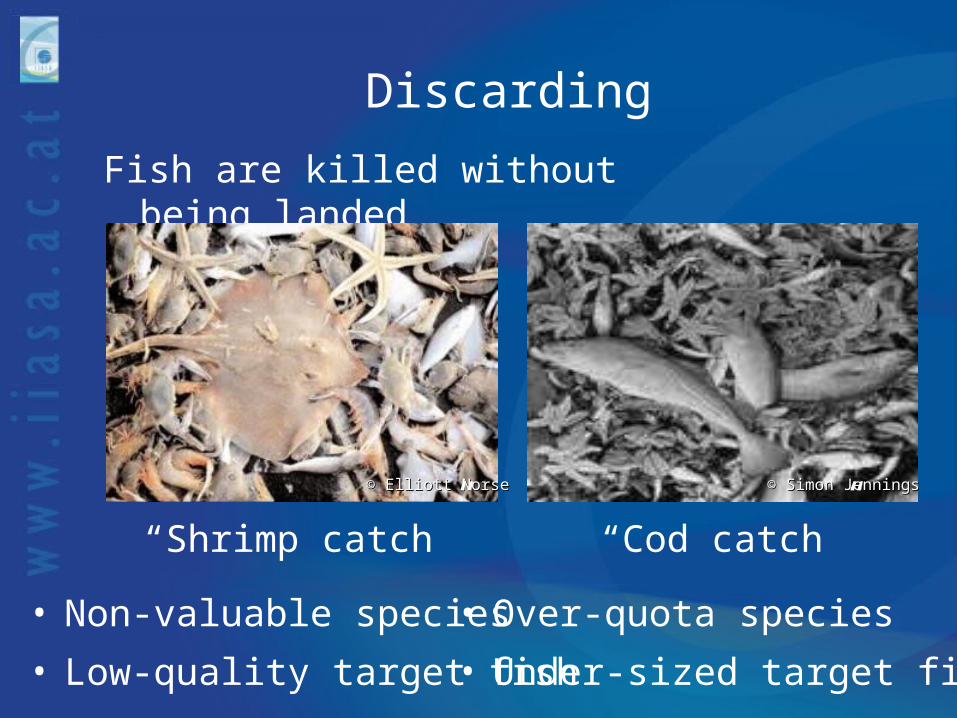
Discarding
Fish are killed without being landed
© © Elliott NorseElliott Norse
“Shrimp catch”
© © Simon JenningsSimon Jennings
“Cod catch”
• Non-valuable species
• Low-quality target fish
• Over-quota species
• Under-sized target fish

Collateral Damage
Bottom trawls destroy ocean-floor ecosystems
© © Peter AusterPeter Auster

Provisioning
Productshumansderive
Ecosystem Services
Supporting
Fundamentallong-termprocesses
Four categories defined by Millennium Ecosystem Assessment
Regulating
Benefits fromecosystemregulation
Cultural
Education,recreation &enrichment

Future Requirements
• Reduced exploitation
• Less discards and collateral damage
• Ecosystem-based fisheries management
• Precautionary approach to risks
• Marine protected areas
• Restoration to maximum sustainable yield (mandated by 2015 by the 2002 UN World Summit on Sustainable Development)

Part 2: Evolutionary Effects of FishingEvolutionary Effects of Fishing
Ecology EvolutionEvolution
Changes innumbers of fish
Changes in heritable features of fish

Fisheries-induced Evolution
Initial compositionInitial composition After fishingAfter fishing After reproductionAfter reproduction

The Overlooked Evolutionary Dimension
• Evolutionary responses of stocks are inevitable
• Significant evolution can occur within just 10 to 20 years
• Evolutionary changes are not necessarily beneficial
• Such changes will be difficult to reverse

Which Traits Are at Risk?
• Age and size at maturation Reproducing late is impossible
• Reproductive effort Saving for future seasons is futile
• Growth rate Staying below mesh size prolongs life
• Morphology and behavior Avoiding fishing gear is advantageous
Focushere

© © Google EarthGoogle Earth
Feeding groundsBarents Sea,mature & juvenile fish
Spawning groundsNorwegian coast,only mature fish
With a catch of 400,000 tonnes per year, Northeast Arctic cod is one of the most important European stocks
Northeast Arctic Cod: Stock Structure

Northeast Arctic Cod: Fishing History
• Fishing along the Norwegian coast has been intensive for centuries
• Trawling in the Barents Sea started in the 1920s and reached its current high level around 1960
• Evolution of earlier maturation at smaller size is thus expected

Northeast Arctic Cod: Evolutionary ChangeL
eng
th a
t mat
ura
tion
at a
ge
7 (
cm)
1930 1970 2005
70
100
90
80
This shift in maturation schedule contributes to a drop in maturation age from 9-10 years to 5-6 years and reduces initial egg production by 50%
Until 1970Until 1970
TodayToday

Total catchin thousands of tonnes800
0
200
400
600
1960 1992
© © Google EarthGoogle Earth
Northern Cod: Fishing History
The northern cod stock collapsed in 1992,in one of the worst disasters of modern fishing
Non-Non-CanadianCanadian
CanadianCanadian

Moratorium
1975 1992 2004
30
80
70
60
50
40
Len
gth
at m
atu
ratio
na
t ag
e 5
(cm
)
Northern Cod: Evolutionary Change
Early warning
A strong negative trend in maturation schedule, as predicted by theory

1978 19920%
80%
100%
Sta
tistic
al c
onf
ide
nce
in n
ega
tive
tre
nd
1985
7 yearsbefore collapse
Northern Cod: Early Warning
A negative trend in the maturation schedule could have been detected with a confidence of more than 80% already 7 years before the collapse

Additional Case Studies
Atlantic codGeorges BankGulf of Maine
Southern Grand BankSt. Pierre Bank
American plaiceLabrador
Grand BankSt. Pierre Bank
Small yellow croaker Yellow Sea
Sole North Sea
Plaice North Sea

Modeling Fisheries-induced Evolution
• To understand past fisheries-induced evolution
• To forecast the direction, speed, and outcome of future fisheries-induced evolution
• To predict the evolutionary vulnerability of species and stocks
• To investigate the consequences of alternative management scenarios

0 100Time (years)
CurrentCurrentfishingfishing
Ag
e a
t mat
ura
tion
(yea
rs)
12
10
8
6
4
2
0
HistoricalHistoricalfishingfishing
Model of Northeast Arctic cod
Fast Pace of Evolutionary Decline
ca. 40 yearsca. 40 yearsT
oda
yT
oda
y

Ag
e a
t mat
ura
tion
(yea
rs)
HistoricalHistoricalfishingfishing
0 100Time (years)
12
10
8
6
4
2
0
CurrentCurrentfishingfishing
Model of Northeast Arctic cod
Slow Pace of Evolutionary Recovery
To
day
To
day
ca. 250 yearsca. 250 years

Conclusions
• Fisheries-induced evolution has been with us for several decades without having been properly recognized
• The speed of such evolution is much faster than previously believed
• Fisheries-induced evolution affects demography and thus yield, stock stability, and recovery potential
• Models suggest that each year during which current exploitation continues may require several years of evolutionary recovery:
A “Darwinian debt” to be paid by future generations