The Outlook for Energy: A View to 2040 · · 2018-03-15ExxonMobil 2018 Outlook for Energy...
35
on March 16, 2018 (13:30-15:30) PTT Auditorium, 2nd Floor, PTT Building 1 Public Lecture: By Lynne Taschner, Energy Advisor Corporate Strategic Planning Department, ExxonMobil The Outlook for Energy: A View to 2040
Transcript of The Outlook for Energy: A View to 2040 · · 2018-03-15ExxonMobil 2018 Outlook for Energy...

on March 16, 2018 (13:30-15:30)
PTT Auditorium, 2nd Floor, PTT Building 1
Public Lecture:
By
Lynne Taschner, Energy Advisor
Corporate Strategic Planning Department, ExxonMobil
The Outlook for Energy: A View to 2040

ExxonMobil 2018 Outlook for Energy‹#›
2018 Outlook for Energy: A View to 2040
The Outlook for Energy includes Exxon Mobil Corporation’s internal estimates and forecasts of energy demand,
supply, and trends through 2040 based upon internal data and analyses as well as publicly available information
from external sources including the International Energy Agency. Work on the report was conducted throughout
2017. This presentation includes forward looking statements. Actual future conditions and results (including
energy demand, energy supply, the relative mix of energy across sources, economic sectors and geographic
regions, imports and exports of energy) could differ materially due to changes in economic conditions,
technology, the development of new supply sources, political events, demographic changes, and other factors
discussed herein and under the heading “Factors Affecting Future Results” in the Investors section of our website
at www.exxonmobil.com. This material is not to be used or reproduced without the permission of Exxon Mobil
Corporation. All rights reserved.
Asia Pacific Energy Outlook Tour
March 2018

ExxonMobil 2018 Outlook for EnergyExxonMobil 2018 Outlook for Energy
Global trends continue to evolve
+1.7 billion
people
2x
GDP
+25%
demand
+10%
CO2 emissions
-45%
CO2 intensity
Percent
Growth from 2016 level 2016
3

2018 Outlook for Energy
FundamentalsWhat will the world’s energy picture look like in the future?
4
ExxonMobil 2018 Outlook for EnergyExxonMobil 2018 Outlook for Energy
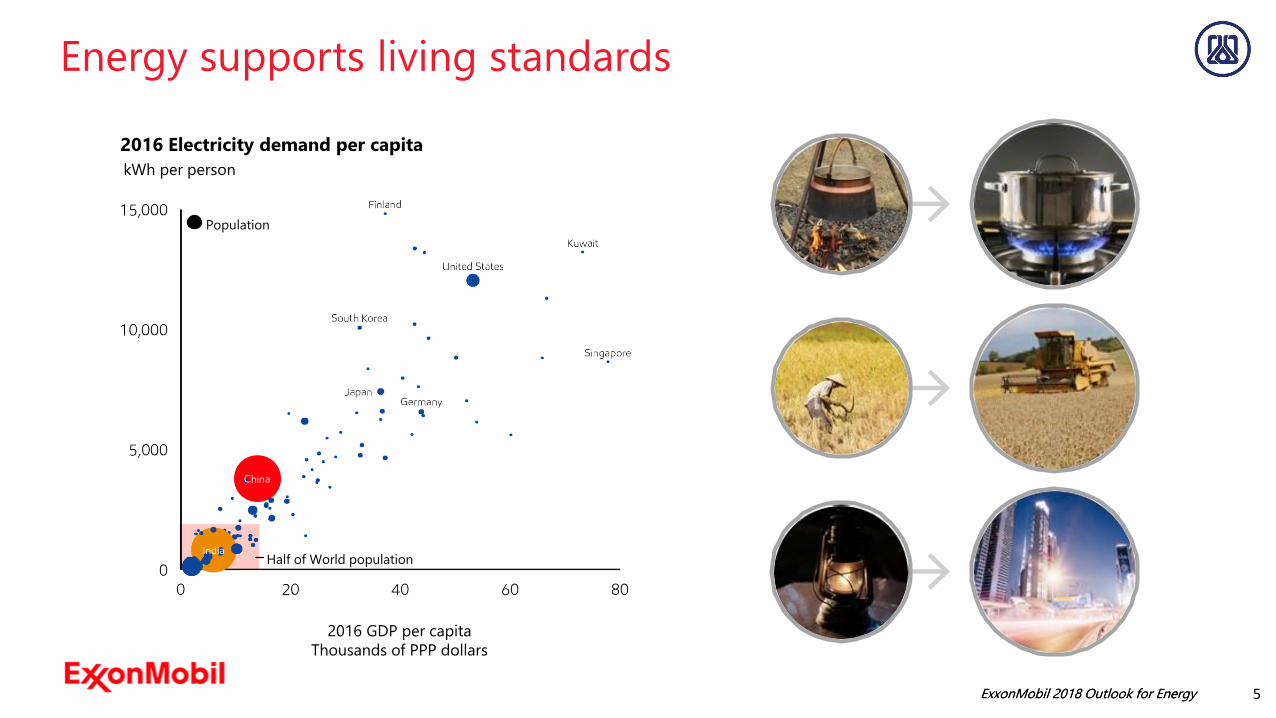
Energy supports living standards
2016 Electricity demand per capita
kWh per person
2016 GDP per capita
Thousands of PPP dollars
Half of World population
Population
5
ExxonMobil 2018 Outlook for EnergyExxonMobil 2018 Outlook for Energy
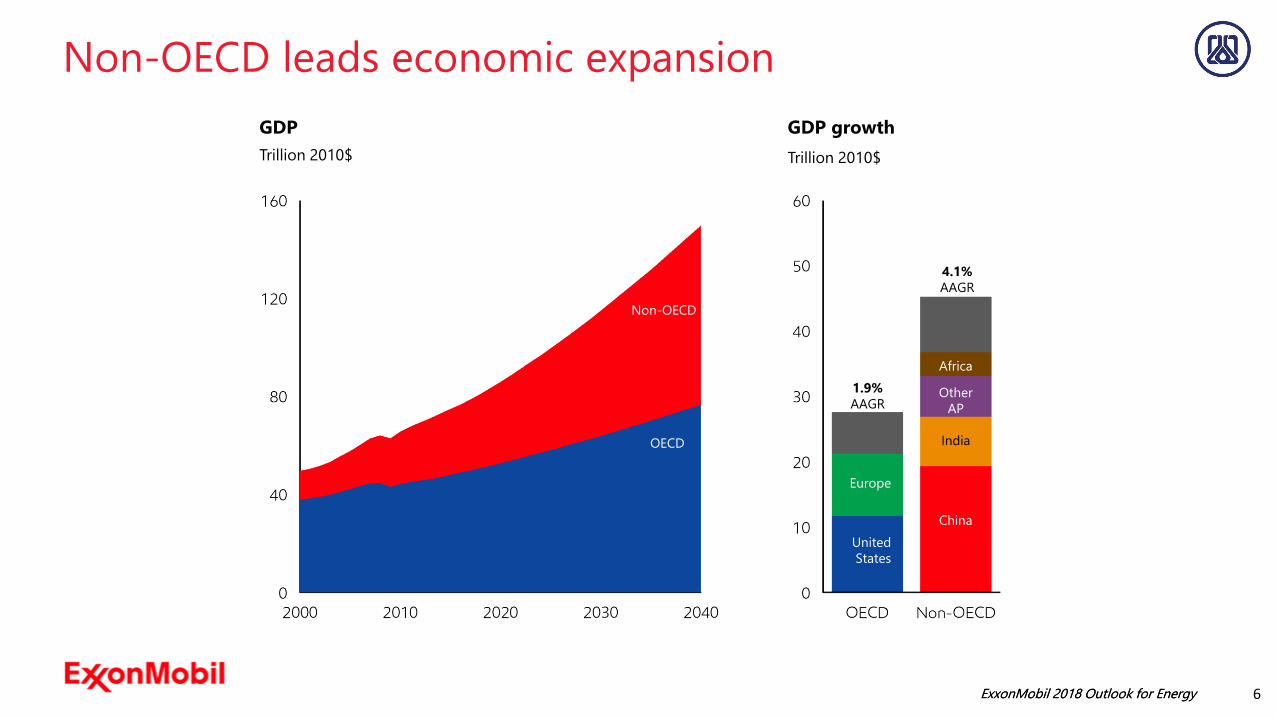
GDP
Trillion 2010$
OECD
Non-OECD
Non-OECD leads economic expansion
GDP growth
Trillion 2010$
Europe
United
States
China
Other
AP
Africa
India
1.9%
AAGR
4.1%
AAGR
6
ExxonMobil 2018 Outlook for EnergyExxonMobil 2018 Outlook for Energy 7
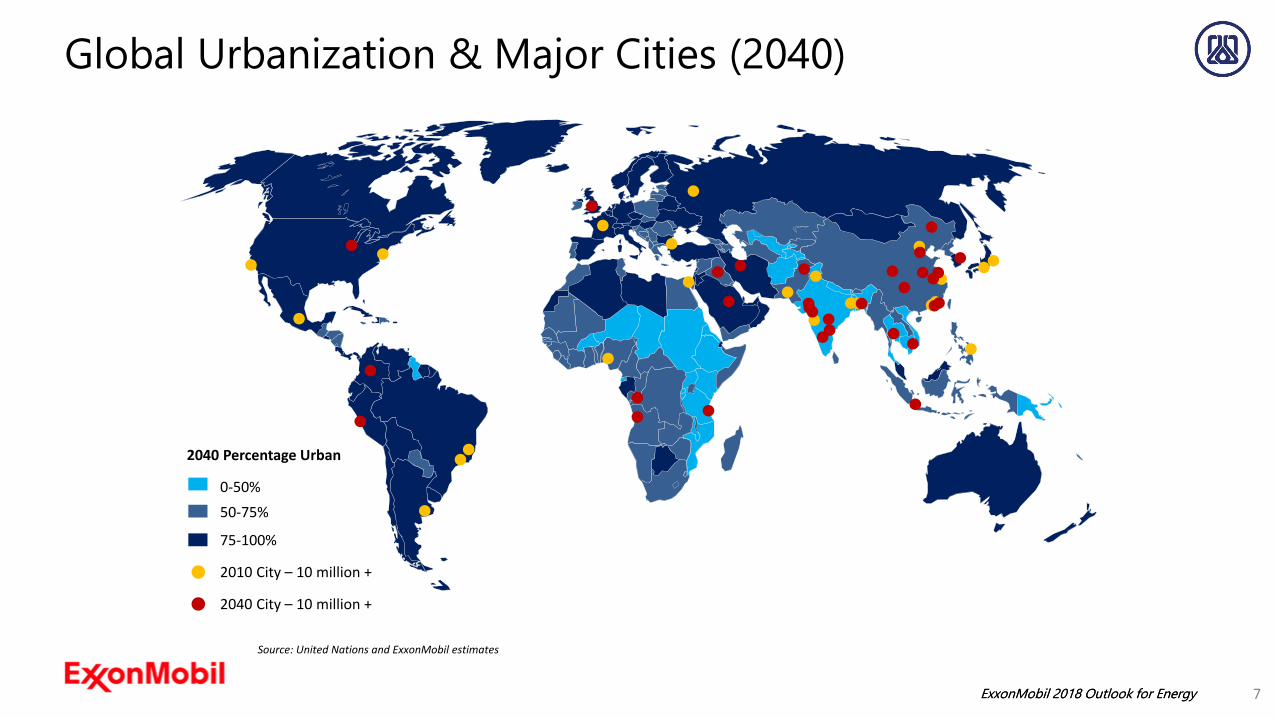
Global Urbanization & Major Cities (2040)
2040 Percentage Urban
0-50%
50-75%
75-100%
2010 City – 10 million +
2040 City – 10 million +
Source: United Nations and ExxonMobil estimates
ExxonMobil 2018 Outlook for EnergyExxonMobil 2018 Outlook for Energy
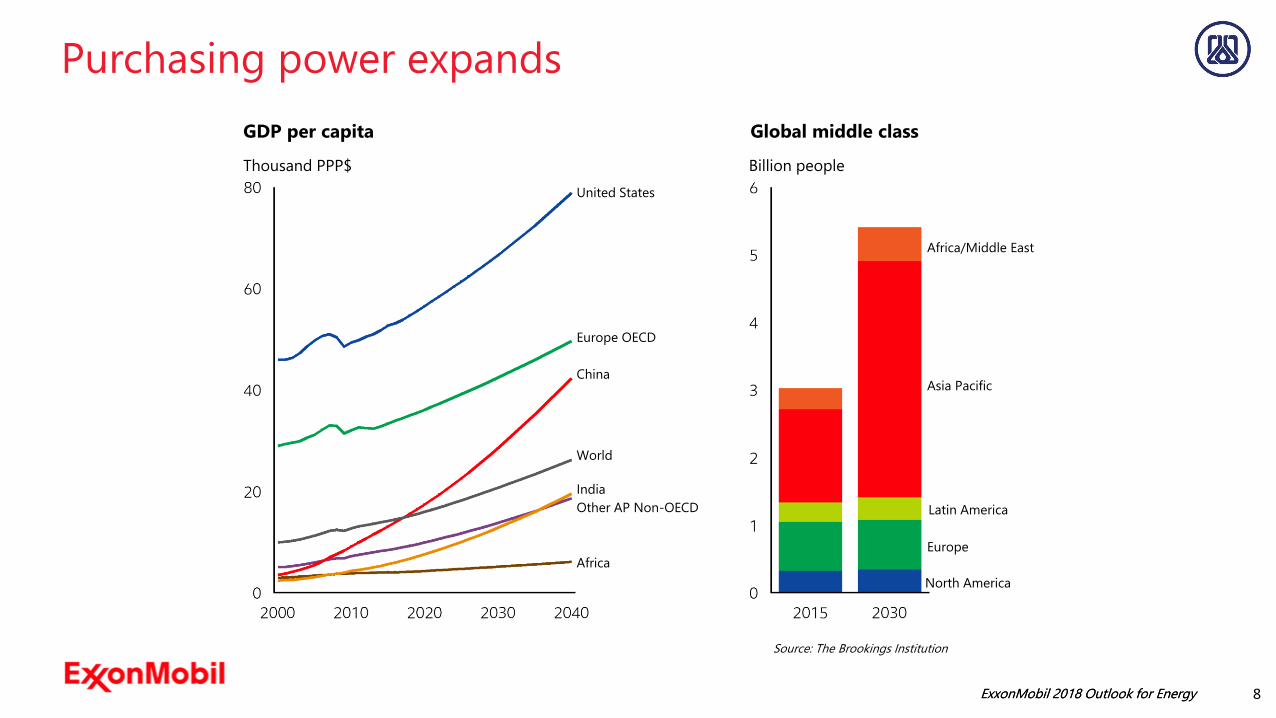
Purchasing power expands
Thousand PPP$
GDP per capita
United States
Europe OECD
China
World
India
Other AP Non-OECD
Global middle class
Billion people
Latin America
Europe
Asia Pacific
North America
Source: The Brookings Institution
Africa/Middle East
Africa
8

ExxonMobil 2018 Outlook for EnergyExxonMobil 2018 Outlook for Energy
2018 Outlook for Energy
Demand
Global energy demand will continue to rise through 2040,
reflecting its fundamental link to expanding prosperity and
better living standards for a growing population worldwide.
9

ExxonMobil 2018 Outlook for EnergyExxonMobil 2018 Outlook for Energy 10
Developing Economies Dominate Growth
0
250
500
750
1980 1985 1990 1995 2000 2005 2010 2016 2020 2025 2030 2035 2040
OECD
Rest of World
India
China
Other AP Non-OECD
Quadrillion BTUs
Demand by Region
ExxonMobil 2018 Outlook for EnergyExxonMobil 2018 Outlook for Energy
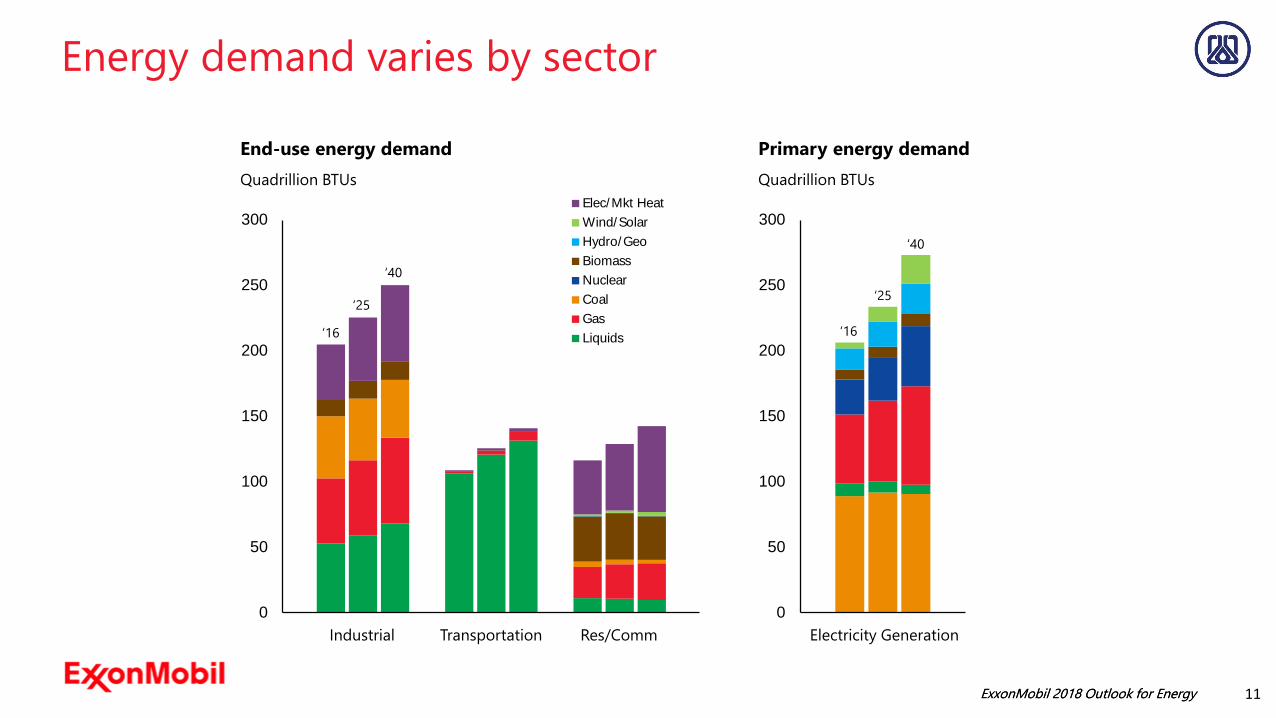
Energy demand varies by sector
End-use energy demand
Quadrillion BTUs
Primary energy demand
Quadrillion BTUs
0
50
100
150
200
250
300
1 2 3 4 5 6 7 8 9 10 11 12 13
Elec/Mkt Heat
Wind/Solar
Hydro/Geo
Biomass
Nuclear
Coal
Gas
Liquids‘16
‘25
‘40
Transportation Res/CommIndustrial
0
50
100
150
200
250
300
201620252040Electricity Generation
‘16
‘25
‘40
11

ExxonMobil 2018 Outlook for EnergyExxonMobil 2018 Outlook for Energy
Rising prosperity lifts chemicals energy demand
Chemicals demand by region
Quadrillion BTUs
Fuel
Feedstock
Mature Regions China Rest of Asia Pacific Rest of World
Emerging Markets
Asia
Pacific
OECD
Europe
Russia/
Caspian
North
America
India
Other
Asia
Middle East
Africa
Latin America
12
ExxonMobil 2018 Outlook for EnergyExxonMobil 2018 Outlook for Energy
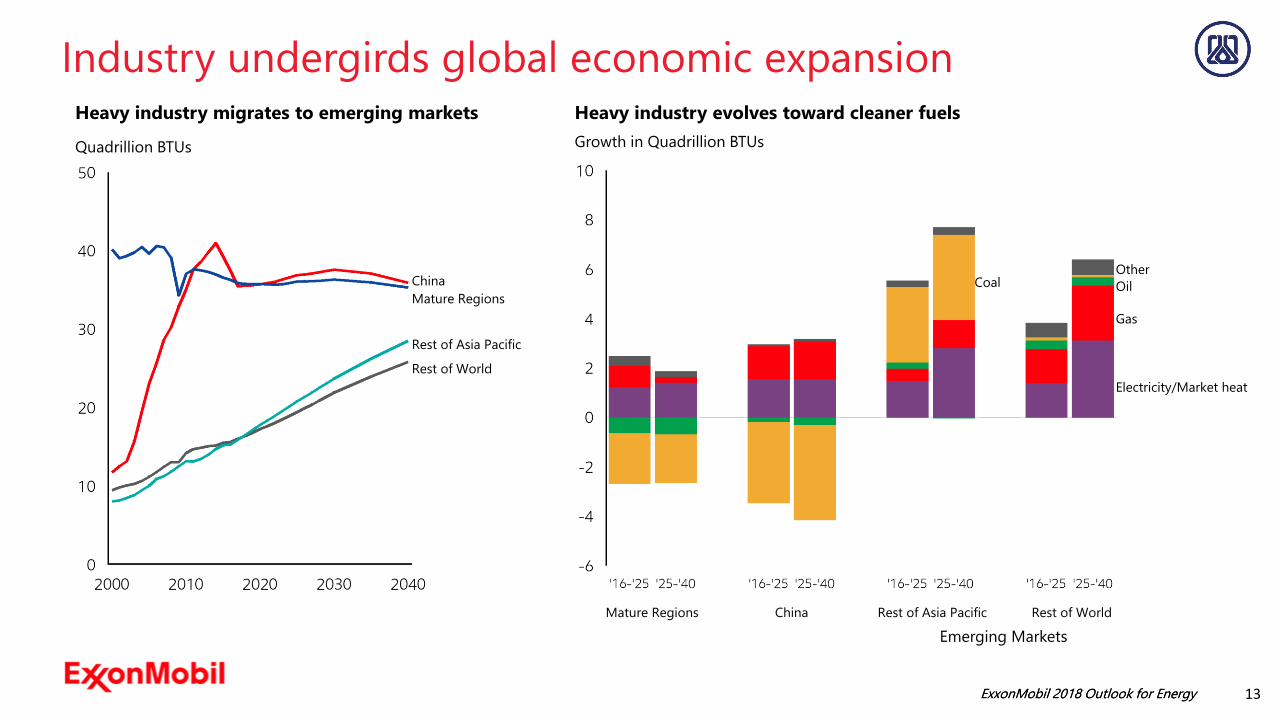
Industry undergirds global economic expansionHeavy industry migrates to emerging markets
Quadrillion BTUs
China
Mature Regions
Rest of Asia Pacific
Rest of World
Heavy industry evolves toward cleaner fuels
Growth in Quadrillion BTUs
Mature Regions China Rest of Asia Pacific Rest of World
Emerging Markets
Electricity/Market heat
Gas
Oil
Other Coal
13
ExxonMobil 2018 Outlook for EnergyExxonMobil 2018 Outlook for Energy
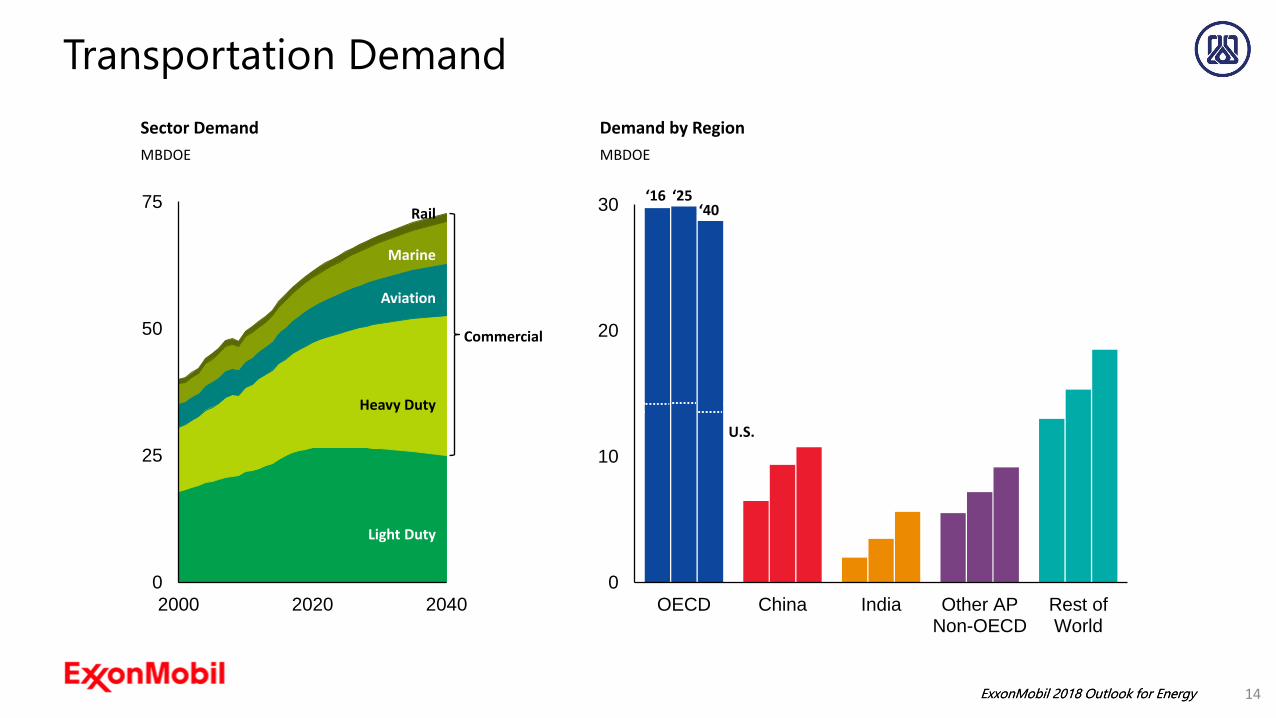
0
25
50
75
2000 2020 2040
0
10
20
30
OECD China India Other APNon-OECD
Rest ofWorld
Sector Demand
MBDOE
Light Duty
Marine
Rail
Heavy Duty
Aviation
14
Transportation Demand
Demand by Region
MBDOE
‘40‘25‘16
U.S.
Commercial

ExxonMobil 2018 Outlook for EnergyExxonMobil 2018 Outlook for Energy
Global fleet increases and diversifies
Fleet by type
Million cars
Gasoline
Diesel
Natural gas/LPG
Full hybrid
Electric/Plug-in/
Fuel cell
Efficiency curbs demand growth
MBDOE
15

ExxonMobil 2018 Outlook for EnergyExxonMobil 2018 Outlook for Energy
Policy and consumer choices impact demand
Electric vehicles grow rapidly
Million cars
Battery
electrics
Plug-in
hybrids
Liquids demand remains resilient
MBDOE
Total liquids
demand
Light-duty liquids
demand
Shaded ranges are indicative of potential shifts in demand relative to base
Outlook
16

ExxonMobil 2018 Outlook for EnergyExxonMobil 2018 Outlook for Energy
0
2
4
6
8
10
1980 2010 2040
Electricity Demand by Region
Thousand TWh
United States
India
Europe
China
OtherAsia Pacific
2016
17
Electricity Demand Continues to Surge
Electricity Net Delivered by Type
Thousand TWh
0
10
20
30
40
2000 2020 2040
Oil
Coal
Nuclear
OtherRenewables
Gas
Wind & Solar

ExxonMobil 2018 Outlook for EnergyExxonMobil 2018 Outlook for Energy
Renewables and gas capture growth
Change in net delivered electricity 2016-2040
Thousand TWh Share of TWh
Wind / Solar share of delivered electricity
North
America
Europe Asia
Pacific
Middle
East
Africa World
Wind
Solar
Solar capacity Wind capacity
'16
'40
18
ExxonMobil 2018 Outlook for EnergyExxonMobil 2018 Outlook for Energy
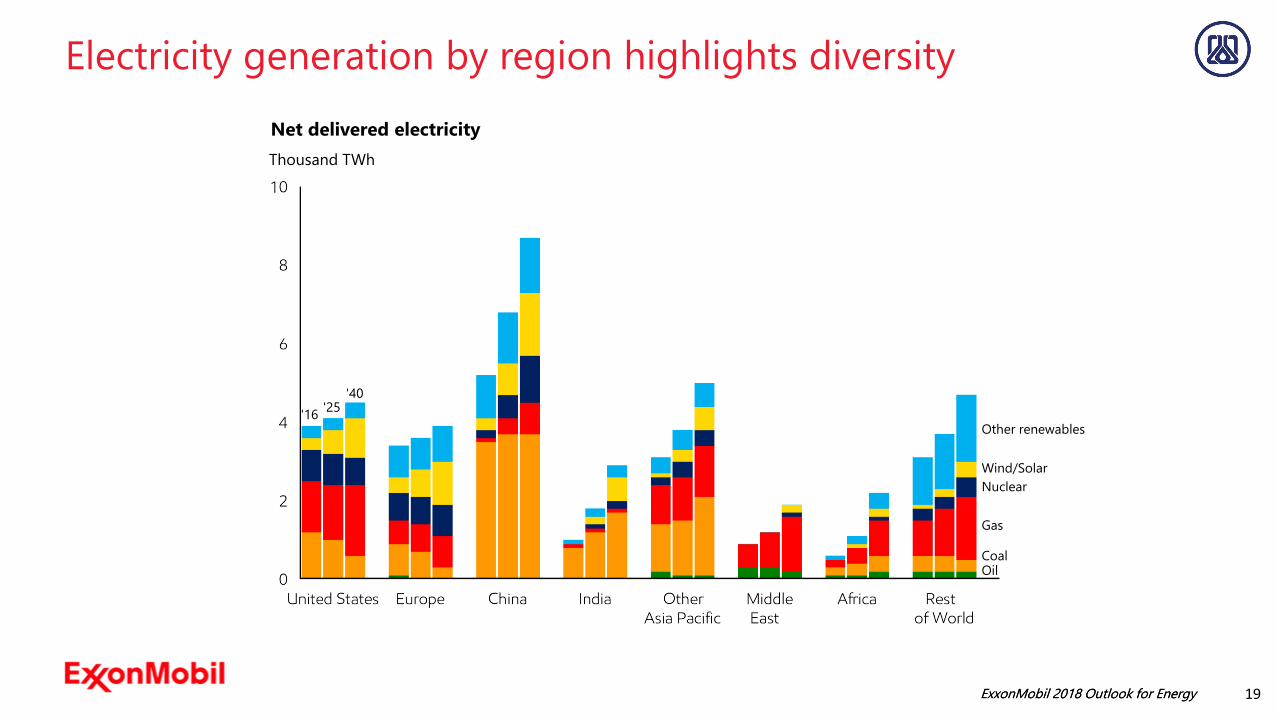
Electricity generation by region highlights diversity
Net delivered electricity
'16
'40
Wind/Solar
Other renewables
'25
Nuclear
Gas
Coal Oil
Thousand TWh
19

ExxonMobil 2018 Outlook for EnergyExxonMobil 2018 Outlook for Energy
Policy and technology choices impact outcome
Gas demand from electricity generation
BCFD
Middle East
Africa
North America
Europe
Other Asia Pacific
China
India
Latin America
Russia/Caspian
Higher wind/solar
penetration
Lower nuclear/
coal use
Shaded ranges are indicative of potential shifts in demand relative to base
Outlook
20

ExxonMobil 2018 Outlook for EnergyExxonMobil 2018 Outlook for Energy
Global Demand
2040 by fuel
Quadrillion BTUs
Average Growth / Yr.
2016 - 2040
0.9%
2016
0.7%
1.3%
-0.1%
1.6%
Nuclear
Biomass
Solar / Wind /
Biofuels
Hydro / Geothermal
21

ExxonMobil 2018 Outlook for EnergyExxonMobil 2018 Outlook for Energy
2018 Outlook for Energy
SupplyWhat resources will be available to meet the world’s
increasing demand for more energy?
22

ExxonMobil 2018 Outlook for EnergyExxonMobil 2018 Outlook for Energy 23
Liquids Supply
MBDOE
World Supply by Type
0
40
80
120
2000 2020 2040
Other Liquids
Biofuels
Developed Conventional Crude & Condensate
Tight Oil
Oil Sands
NGLs
Deepwater
New ConventionalCrude and Condensate
Development
0
40
80
120
2000 2020 2040
By Region
MBDOE
Other Non-OPEC
North America
Russia
OPEC

ExxonMobil 2018 Outlook for EnergyExxonMobil 2018 Outlook for Energy
Gas supply highlights regional diversity
Gas demand by supply type
BCFD
Local unconventional production
Local conventional production
Net
imports
Pipeline imports
Net
exports
North
America
Latin
America
Africa Europe Russia/
Caspian
Middle
East
Asia
Pacific
Total production
LNG imports
Share of growth 2016-2040 Supply type Production
.
'16 '40 '25 '00
24

ExxonMobil 2018 Outlook for EnergyExxonMobil 2018 Outlook for Energy 25
Asia Pacific Natural Gas Demand and Supply
0
50
100
150
2000 2020 2040
Electricity Generation
Industrial
Res/Comm
Transportation
BCFD
Demand by Sector
0
50
100
150
2000 2020 2040
India
Demand by Country
China
Rest of AP
BCFD
0
50
100
150
2000 2020 2040
Local Conventional
Pipeline
LNG
BCFD
Supply by Type
SE Asia
Japan
Korea
Local Unconventional

ExxonMobil 2018 Outlook for EnergyExxonMobil 2018 Outlook for Energy
Climate/Energy policy
Gas import diversityClimate/Energy
policy
Fuel supply diversity
Air quality management
Climate/Energy policy
Air quality management
Chemical feed
Backfill declining
gas production
LNG trade grows and diversifies
Europe and Asia Pacific dominate LNG imports
BCFD
Europe
Japan/Korea/
Taiwan/Singapor
e
China
India
Other Asia Pacific
Rest of World
Asia Pacific
Growth
26

ExxonMobil 2018 Outlook for EnergyExxonMobil 2018 Outlook for Energy
LNG trade grows and diversifies
Europe and Asia Pacific dominate LNG imports
BCFD
Europe
Japan/Korea/
Taiwan/Singapor
e
China
India
Other Asia Pacific
Rest of World
Asia Pacific
Growth
Abundant gas supplies underpin new LNG exports
BCFD
Asia Pacific
Middle East
North America
Africa
Rest of World
27

ExxonMobil 2018 Outlook for EnergyExxonMobil 2018 Outlook for Energy
2018 Outlook for Energy
EmissionsThe dual challenge of providing reliable, affordable energy to
support prosperity and enhance living standards is coupled
with the need to do so in ways that reduce impacts on the
environment, including the risks of climate change. This is a
challenge we take seriously.
28

ExxonMobil 2018 Outlook for EnergyExxonMobil 2018 Outlook for Energy
Energy mix shifts to lower-carbon fuels
Global energy mix
Percent
Gas
Coal
Nuclear
Wind/Solar
Other renewables
Oil
Energy-related CO2 emissions peak
Billion tonnes
North America
Europe
China
Other Asia Pacific
Russia/Caspian
Latin America
Africa
Middle East
29

ExxonMobil 2018 Outlook for EnergyExxonMobil 2018 Outlook for Energy
Restraining energy-related CO2 emissions
Energy-related CO2 emissions
Billion tonnes
2000 GDP
growth
CO2
intensity
Energy
efficienc
y
2016 GDP
growth
CO2
intensity
Energy
efficienc
y
2040
30

ExxonMobil 2018 Outlook for EnergyExxonMobil 2018 Outlook for Energy
Technology Contributes to the Fuel Mix
Primary energy demand
Biomass
Coal
Oil
Gas
Hydro
Nuclear
Other Renewables
Source: Smil, Energy Transitions (1800-1960)
Unconventional Gas
Deepwater, Oil Sands, Tight Oil
Quadrillion BTUs

ExxonMobil 2018 Outlook for EnergyExxonMobil 2018 Outlook for Energy
2018 Outlook for Energy
Energy mattersAs the world’s population approaches 9 billion people in 2040,
we are challenged to help improve living standards
everywhere. We expect that progress will be powered by
human ingenuity and the energy that helps make better lives
possible.
32

ExxonMobil 2018 Outlook for EnergyExxonMobil 2018 Outlook for Energy
Energy powers modern economies and
living standards
Global energy needs rise about 25%, led by
non-OECD nations
Electricity demand nearly doubles in non-
OECD nations
Electricity from solar and wind increases
about 400 percent
Natural gas expands role to meet a wide
variety of needs
Oil plays a leading role to aid mobility and
modern products
Decarbonization of the world’s energy
system will accelerate
33
ExxonMobil 2018 Outlook for EnergyExxonMobil 2018 Outlook for Energy
Subscribe to energyfactor.com
Visit exxonmobil.com/energyoutlook
Visit exxonmobilperspectives.com
Follow linkedin.com/company/exxonmobil
Follow facebook.com/exxonmobil
Stay energy informed.
At ExxonMobil, we continually provide information and insight to help broaden
your understanding of the issues shaping the world’s energy needs. You can stay
informed by following us online and through our social channels.
Follow instagram.com/exxonmobil
Follow @exxonmobil
34
ExxonMobil 2018 Outlook for EnergyExxonMobil 2018 Outlook for Energy 35