The number of ants at a picnic is growing rapidly. At 11am 5 ants find the picnic. Each hour after...
43
The number of ants at a picnic is growing rapidly. At 11am 5 ants find the picnic. Each hour after 11am, 3 times as many ants have found the picnic. Let represent the number of ants at the picnic h hours after 11am. a. Write an equation for a model of . 5.1-1 1 () Ah () Ah
-
Upload
jayson-johnson -
Category
Documents
-
view
215 -
download
2
Transcript of The number of ants at a picnic is growing rapidly. At 11am 5 ants find the picnic. Each hour after...

1
The number of ants at a picnic is growing rapidly. At 11am 5 ants find the picnic. Each hour after 11am, 3 times as many ants have found the picnic. Let represent the number of ants at the picnic h hours after 11am.a. Write an equation for a model of .
5.1-1
( )A h
( )A h
2
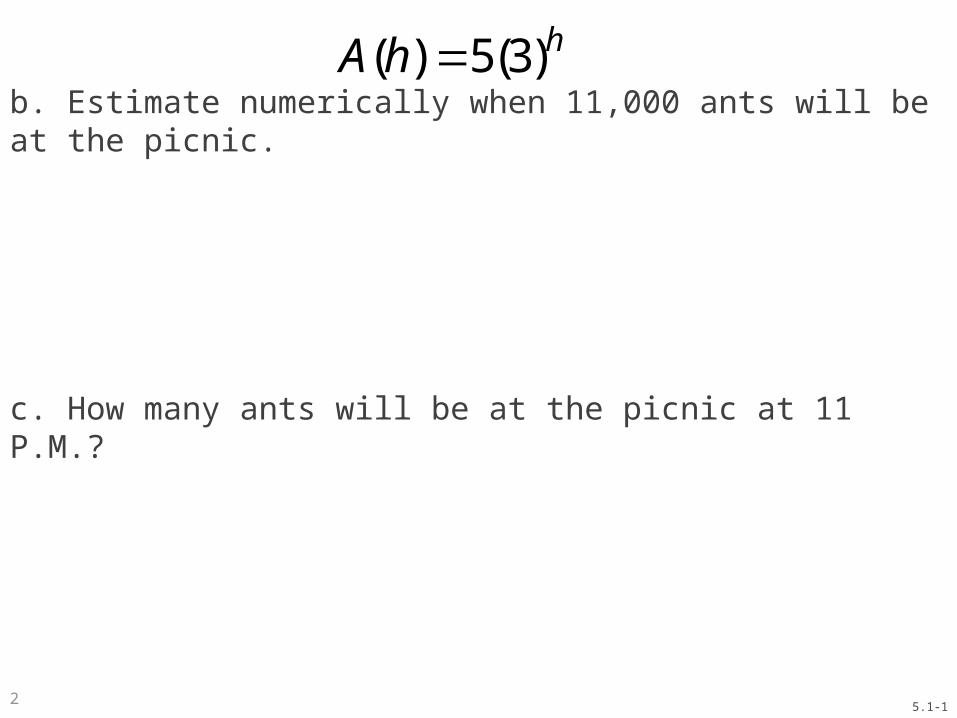
b. Estimate numerically when 11,000 ants will be at the picnic.
c. How many ants will be at the picnic at 11 P.M.?
5.1-1
( ) 5(3)hA h

3
A certain bacteria will double every 15 minutes. If a sample starts with 3 bacteria, find the following.a. Find an equation for a model for the number of bacteria after h hours.
5.1.2

4
A certain bacteria will double every 15 minutes. If a sample starts with 3 bacteria, find the following:
b. Find an equation for a model for the number of bacteria after n 15-minute intervals.
5.1.2

5
c. Use your models to estimate the number of bacteria present after 5 hours.
5.1.2
4( ) 3(2 )hB h ( ) 3(2 )nb n

6
An isotope of hydrogen has a half life of about 4500 days.a. Find an equation for a model for the amount of remaining from a sample of 500 atoms.
5.1.3
3 H3 H
7
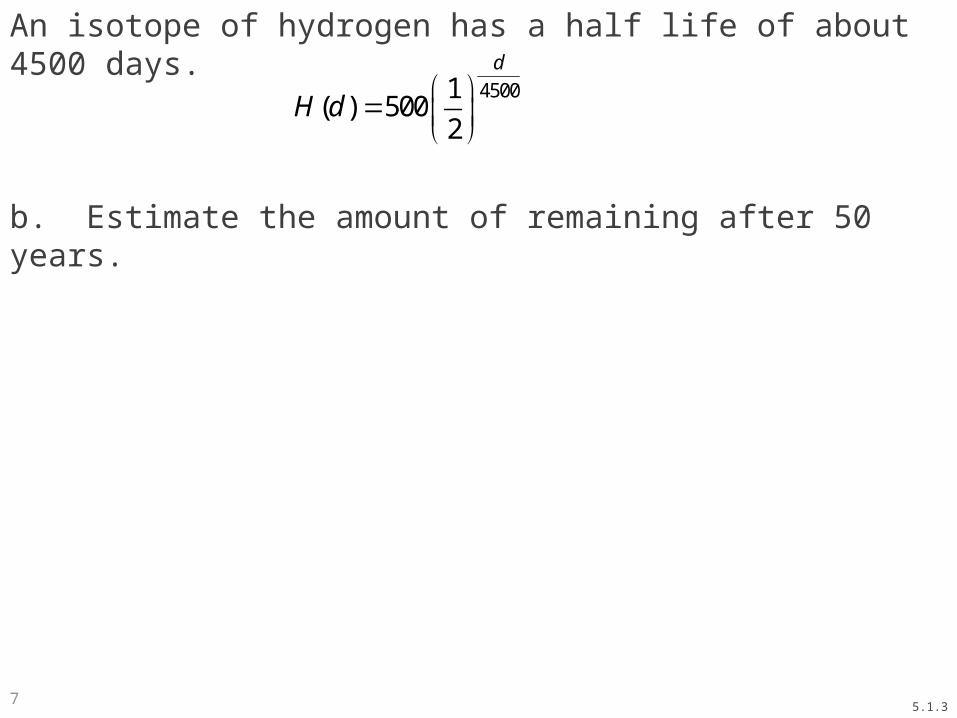
An isotope of hydrogen has a half life of about 4500 days.
b. Estimate the amount of remaining after 50 years.
5.1.3
45001( ) 500
2
d
H d

8
In making jet fuel, kerosene is purified by removing pollutants, using a clay filter. For each foot of clay the kerosene passes through, only 80% of the pollutants remain.a. Find an equation for a model that will give the percentage of pollutants remaining after the kerosene passes through f feet of clay filter.
5.1.4
9
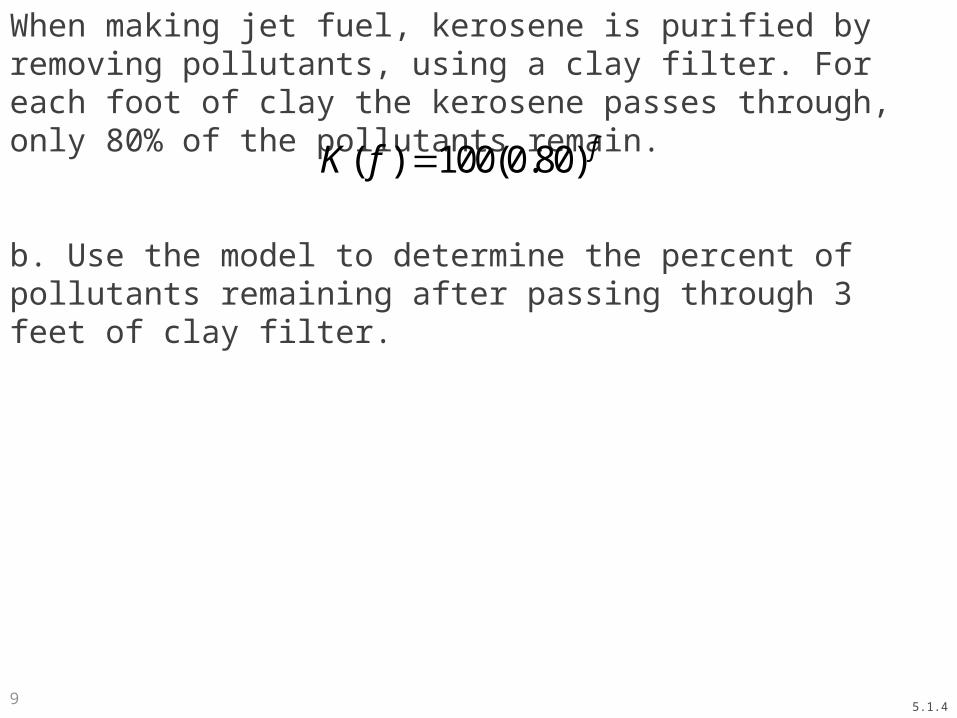
When making jet fuel, kerosene is purified by removing pollutants, using a clay filter. For each foot of clay the kerosene passes through, only 80% of the pollutants remain.
b. Use the model to determine the percent of pollutants remaining after passing through 3 feet of clay filter.
5.1.4
( ) 100(0.80) fK f

10
Use the following tables to find exponential models of the given data.a.
5.1.5
x
0 20
1 60
2 180
3 540
4 1620
( )f x

11
Use the following tables to find exponential models of the given data.b.
5.1.5
x0 251 302 363 43.24 51.84
( )f x

12
Use the following tables to find exponential models of the given data.c.
5.1.5
x0 32003 8006 2009 5012 12.5
( )f x

13
Solve the following exponential equations by inspection or trial and error.a. b.
5.2.1
5 125x 4 16,384x

14
Solve the following exponential equations by inspection or trial and error.c. d.
5.2.1
110
100t
13
27a

15
Solve the following exponential equations by inspection or trial and error.a.
5.2.2
3(4 ) 192x

16
Solve the following exponential equations by inspection or trial and error.b.
5.2.2
12(3 ) 240 2676x

17
Solve the following exponential equations by inspection or trial and error.c.
5.2.2
81(3 ) 12 15t
18
In a classroom example from section 5.1 we found the model
Where n = the number of 15-minute intervals since the beginning of the experiment
b(n) = number of bacteriaUse this model to find the number of 15 minute intervals before there are 196,608 of these bacteria.
5.2.3
( ) 3(2 )nb n

19
Solve the following equations.a.
5.2.4
57776 x
20
Solve the following equations.b.
5.2.4
436 182.25x

21
Solve the following equations.c.
5.2.4
4
52.428820000
t

22
Solve the following equations.d.
5.2.4
74 300 8448n

23
Determine whether the following equations are exponential or power equationsa.
b.
5.2.5
2 7 35x
8 128 345x

24
Sketch the graph of the following functions, by hand. Explain what the values of a and b tell you about this graph.
a.
5.3.1
( ) 4(5)xf x

25
Sketch the graph of the following functions, by hand. Explain what the values of a and b tell you about this graph.
b.
5.3.1
3( ) 800
4
x
f x
26
Sketch the graph of the following functions, by hand. Explain what the values of a and b tell you about this graph.
a.
5.3.2
( ) 7(3)xf x
27
Sketch the graph of the following functions, by hand. Explain what the values of a and b tell you about this graph.
b.
5.3.2
1( ) 100
4
x
f x

28
Find the domain and range of the following exponential functions.a.
b.
c.
5.3.3
( ) 20(1.03)xf x
( ) 25(0.2)xf x
( ) 300(0.65)xf x

29
Sketch the graph of the given exponential functions. Write the equation for the graphs horizontal asymptote. Give the domain and range.a.
5.3.4
( ) 2(1.5) 15xf x

30
Sketch the graph of the given exponential functions. Write the equation for the graphs horizontal asymptote. Give the domain and range.b.
5.3.4
( ) 200(0.4) 25xf x

31
Find the exponential equation that passes through the given points.
a.
5.4.1
(2,150) and (5, 2343.75)

32
Find the exponential equation that passes through the given points.
b.
5.4.1
(1,2240) and (5,57.344)

33
The number of deaths per 100,000 women in the United States from stomach cancer is given in the table.
a. Find an equation for a model for these data.
5.4.2
Year 1930 1940 1950 1960 1970 1980 1990
Stomach Cancer Deaths 28 21 13 9 6 5 4
34
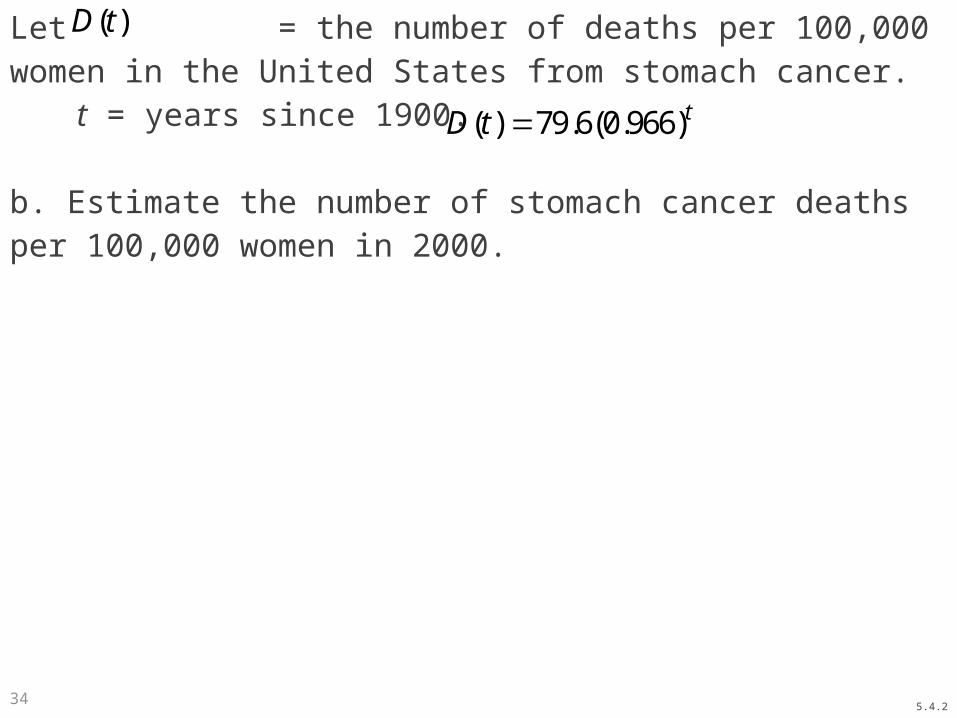
Let = the number of deaths per 100,000 women in the United States from stomach cancer.
t = years since 1900.
b. Estimate the number of stomach cancer deaths per 100,000 women in 2000.
5.4.2
( )D t
( ) 79.6(0.966)tD t

35
The number of deaths per 100,000 women in the United States from stomach cancer is given in the table.
Let = the number of deaths per 100,000 women in the United States from stomach cancer.
t = years since 1900.
What would a reasonable domain and range be for the model?
5.4.3
( ) 79.6(0.966)tD t
Year 1930 1940 1950 1960 1970 1980 1990
Stomach Cancer Deaths 28 21 13 9 6 5 4
( )D t

36
The intensity of light in water is decreased as you go deeper. The intensity at several depths is given in the table.
a. Find an equation for a model for these data.
5.4.4
Depth (meters) 0 1 2 3 4 5
Intensity (as a %) 100 25 6 1.5 0.4 0.1
37
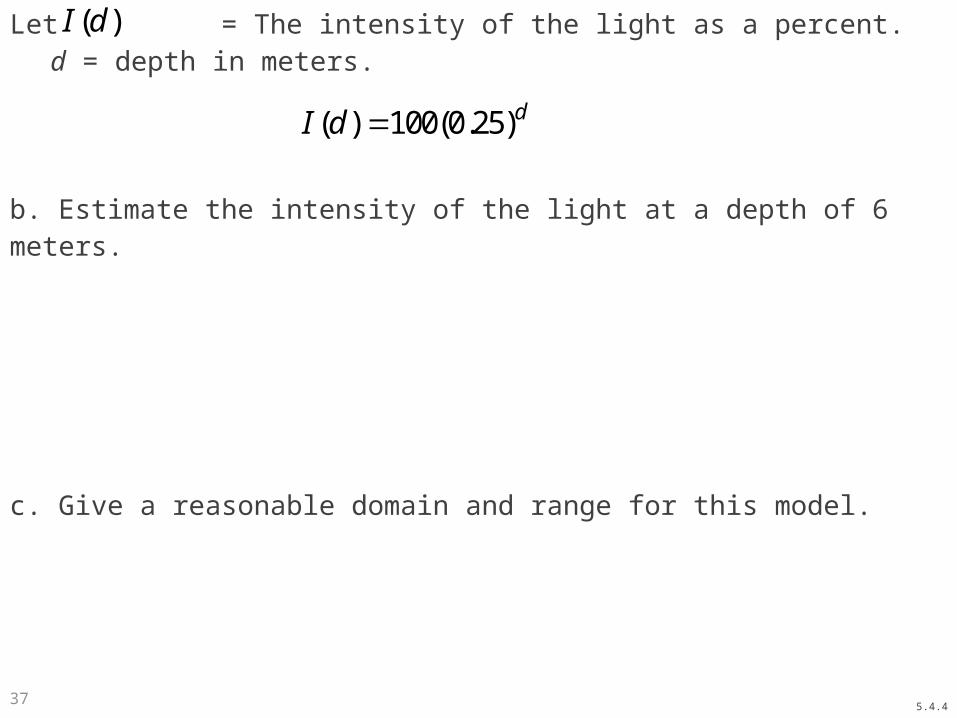
Let = The intensity of the light as a percent.d = depth in meters.
b. Estimate the intensity of the light at a depth of 6 meters.
c. Give a reasonable domain and range for this model.
5.4.4
( )I d
( ) 100(0.25)dI d

38
A swarm of 120 fruit flies in an experiment grows at a rate of about 9.8% per day.a. Find an equation for a model for the number of fruit flies in the swarm.
b. Estimate the number of fruit flies in the swarm after 20 days.
5.5.1

39
According to the CIA World Factbook 2008, the population of Liberia can be modeled by where is the population of Liberia in millions, t years since 2005.a. Use this model to estimate the population of Liberia in 2015.
b. According to this model, what is the growth rate of Liberia’s population?
5.5.2
( )P t( ) 3.1(1.027)tP t

40
The Gross Domestic Product, GDP, of Madagascar in 2005 was approximately 16.9 billion US$ and has been growing by a rate of about 6% per year.a. Find an equation for a model for the GDP of Madagascar.
b. Use your model to estimate the GDP of Madagascar in 2010.
5.5.3
41
In 2009, Serbia had a population of about 7.4million, but that population was estimated to be decreasing by approximately 0.47% per year. Source: CIA World Factbook.a. Find an equation for a model for the population of Serbia.
b. Use your model to estimate the population for Serbia in 2015.
5.5.4

42
If $30,000 is invested in a savings account that pays 4% annual interest compounded daily, what will the account balance be after 6 years?
5.5.5

43
If $4000 is invested in a savings account that pays 2.5% annual interest compounded continuously, what will the account balance be after 9 years?
5.5.6