Chapter 5 Continuous Distributions The Gaussian (Normal) Distribution.
Upload
sylvia-nealCategory
view
224download
0
The Normal Distribution(Gaussian Distribution)
Honors Analysis
Learning Target: I can analyze data using the normal distribution.

Carl Friedrich Gauss (1777-1855)
German mathematicianInfluenced statistics, algebra, number theory, geometry, physics.Child prodigy!Constructed heptadecagonTriangular numbersProved Fundamental Theorem of AlgebraInfluenced development of statistics, including Normal Distribution(Gaussian Distribution)

Imagine you took a test in two different classes.
In the first class, you made a 93%. The class mean was a 96%, and the standard deviation was 3%.
In the second class, you made a 78%. The class mean was a 74%, and the standard deviation was 2%.
Which test performance was better?

Normal Distribution(Gaussian Distribution)

68-95-99.7 Rule
(Approximately) 68% within 1 std dev. of mean
95% within 2 std. deviations of mean
99.7% fall within 3 standard deviations of mean

Labeling a Simple Normal Curve
Calculate the mean (central value on curve)
Each region increases or decreases by one standard deviation from the mean
Ex: Test score mean: 74% Std. dev: 2%

So what happens if you want to calculate a percentage for a value that ISN’T on your normal curve?
Ex: PSAT math test with mean of 48 and a std. deviation of 3. What percent of scores are below 50?
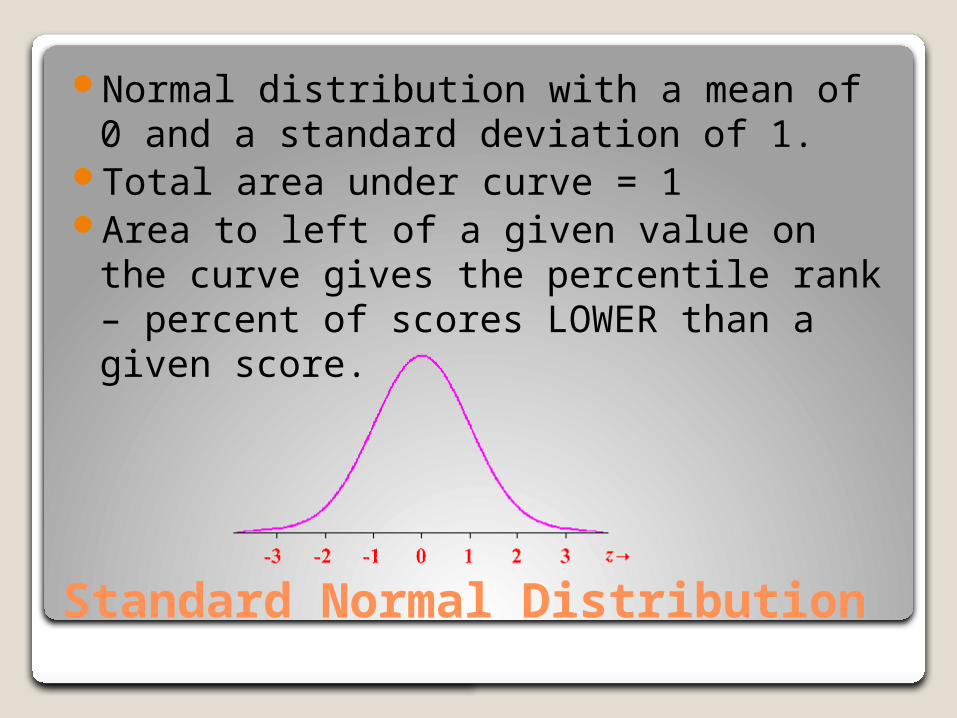
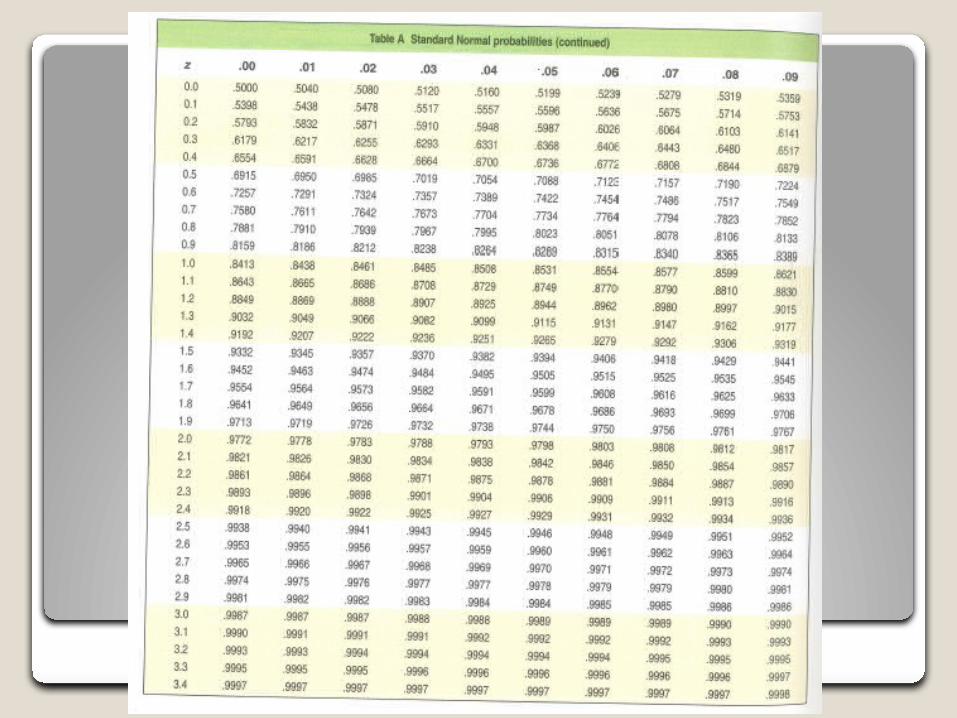
Standard Normal Distribution
Normal distribution with a mean of 0 and a standard deviation of 1.
Total area under curve = 1Area to left of a given value on the curve
gives the percentile rank – percent of scores LOWER than a given score.
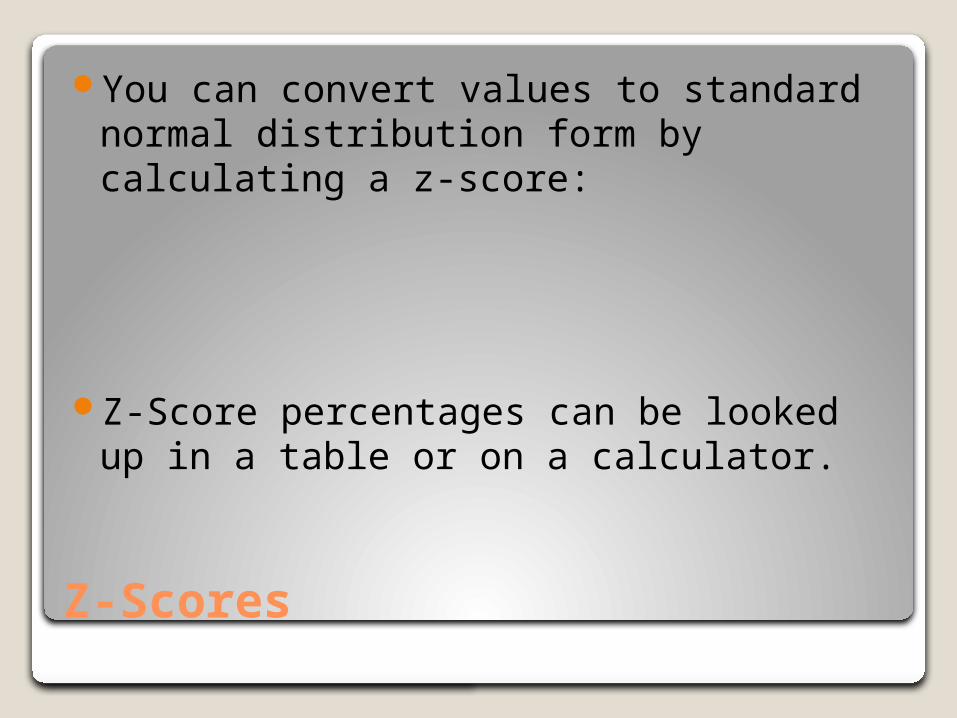
Z-Scores
You can convert values to standard normal distribution form by calculating a z-score:
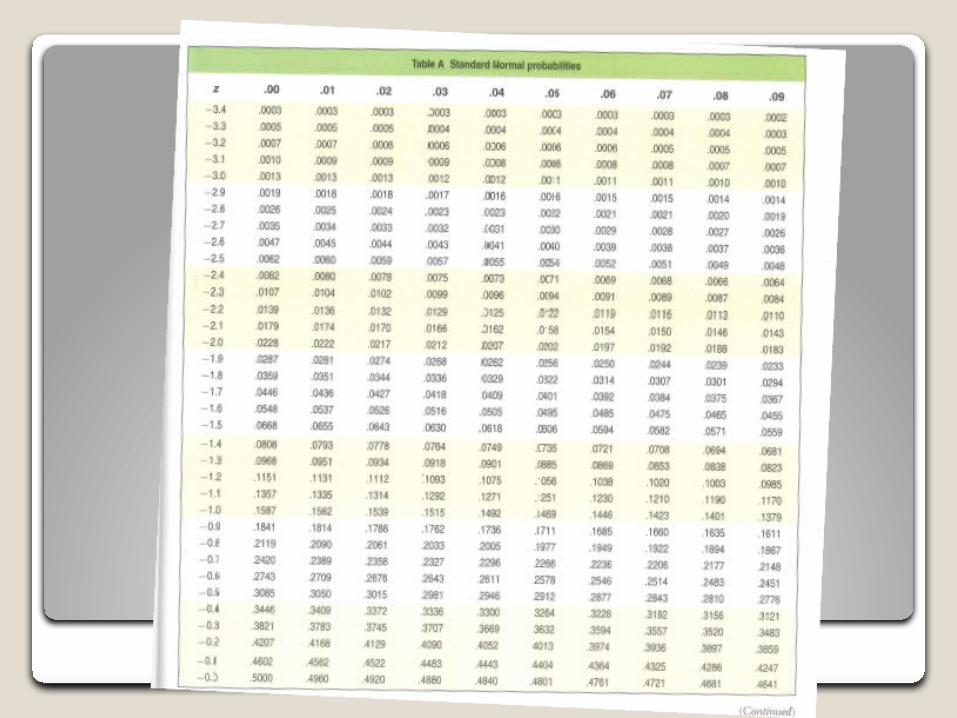
Z-Score percentages can be looked up in a table or on a calculator.

Example


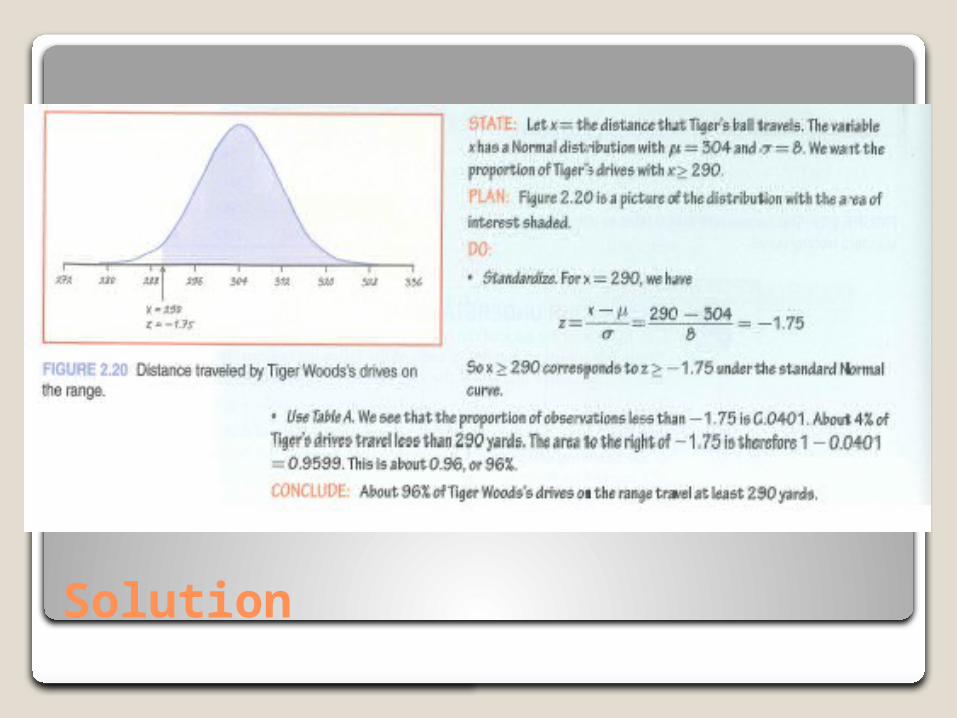
Solution

Example Part II


Types of Bias
Unrepresentative SampleUndercoverage (Convenience sample,
voluntary sample)Non-response BiasVoluntary response Bias
Measurement ErrorResponse Bias (Leading questions, social
desirability)


![arXiv:1804.00891v2 [stat.ML] 26 Sep 2018 · The von Mises-Fisher (vMF) distribution is often seen as the Normal Gaussian distribution on a hypersphere. Analogous to a Gaussian, it](https://static.fdocuments.in/doc/165x107/5f6d13ed4fe28c746a15f07b/arxiv180400891v2-statml-26-sep-2018-the-von-mises-fisher-vmf-distribution.jpg)