The New York City Pedestrian Safety Study & Action Plan ... · New York City Pedestrian Safety...
83
The New York City Pedestrian Safety Study & Action Plan: Technical Supplement August 2010
Transcript of The New York City Pedestrian Safety Study & Action Plan ... · New York City Pedestrian Safety...
The New York City Pedestrian Safety Study & Action Plan: Technical Supplement August 2010
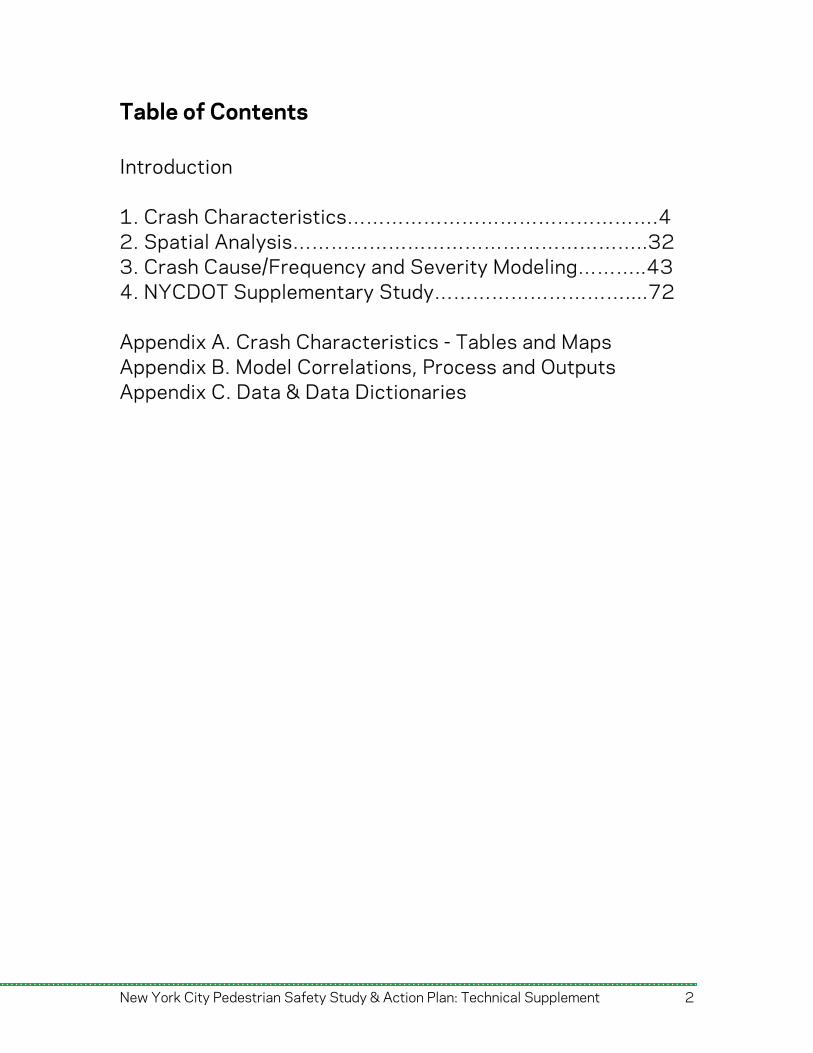
Table of Contents Introduction 1. Crash Characteristics………………………………………….4 2. Spatial Analysis………………………………………………..32 3. Crash Cause/Frequency and Severity Modeling………..43 4. NYCDOT Supplementary Study…………………………....72 Appendix A. Crash Characteristics - Tables and Maps Appendix B. Model Correlations, Process and Outputs Appendix C. Data & Data Dictionaries
New York City Pedestrian Safety Study & Action Plan: Technical Supplement 2
Introduction From 2002 to 2006, 843 pedestrians were killed and 6,784 were seriously injured in motor vehicle crashes in New York City, representing 50% of traffic fatalities and 26% of serious injuries in that five-year period. Vulnerable road users – pedestrians, bicyclists, and motorcyclists – account for three-quarters of traffic fatalities in New York City. Continuing its pedestrian safety effort, NYCDOT’s strategic plan sets a goal of reducing the number of annual traffic fatalities by at least 50% from 274 in 2007, to 137 in 2030. New York City is ahead of schedule – with only 256 total traffic fatalities in 2009, below the year’s target of 258. To identify strategies to reach this goal, NYCDOT initiated a study of safety issues in New York City, with a focus on pedestrians. The Department contracted the New York University Wagner Rudin Center, in conjunction with Rensselaer Polytechnic Institute and the Center for Transportation Injury Research at SUNY-Buffalo, to prepare the Pedestrian Fatality and Severe Injury Study, completed in April 2010, which identified the causes, common factors, and geographic distribution of severe and fatal pedestrian injury crashes. This technical supplement represents the findings of that study and further analysis by NYCDOT, summarized in the New York City Pedestrian Safety Study and Action Plan.
New York City Pedestrian Safety Study & Action Plan: Technical Supplement 3
1. Crash Characteristics This section describes the characteristics of drivers and pedestrians involved in crashes, frequency and location of pedestrian crashes, crash trends, correlations between crashes and intersection/corridor types, and the public health burden of crashes in which pedestrians were killed or severely injured (KSI crashes). The primary datasets used in this chapter include crash data provided by NYSDOT including all New York City fatal and serious injury pedestrian-vehicle crashes during the study period (2002 through 2006), and other supporting datasets (e.g. transportation network-related GIS layers, land use, socioeconomic information, etc.). The objectives of this section are to (1) describe the available information and data for analysis of the fatal and severe injury pedestrian crashes; (2) identify trends and characteristics in the data; and (3) identify opportunities for crash frequency and severity modeling and analyses.
1.1. Summary of Fatal and Severe Injury Pedestrian-Vehicle Crashes 1.1.1. Citywide Trends Total Fatal and Severe Injury Pedestrian Crashes Multiple sources were consulted to obtain accurate summary statistics on the number of pedestrian severe injuries and fatalities, and the number of severe injury and fatality crashes from January 1, 2002 to December 31, 2006. A total of 843 pedestrian fatalities occurred during this period, according to the reconciled NYCDOT/NYPD database of traffic fatalities. NYSDOT data provides information for a total of 7,354 fatal and severe injury pedestrian-vehicle crashes. Of those, 739 crashes resulted in pedestrian fatalities and 6,615 crashes led to 6,784 severe injuries. Other reporting systems include the Fatality Analysis Reporting System (FARS) maintained by NHTSA, and death certificate data maintained by the Office of Vital Statistics of the New York City Department of Health and Mental Hygiene (OVS). The NYCDOT, NYSDOT, FARS, and OVS fatality
New York City Pedestrian Safety Study & Action Plan: Technical Supplement 4
totals differ due to technical differences in reporting methods. Specifically, the NYCDOT/NYPD fatality database includes pedestrians who died of their injuries more than 30 days after the crash, and more rigorously exclude non-traffic-related deaths among pedestrians as well as non-pedestrian traffic deaths. NYCDOT and NYPD reconcile fatality numbers on a biweekly basis, revising older cases when necessary. This is the most consistent source for pedestrian fatality data, and is used for all summary statistics. OVS reports more fatality cases than either the NYCDOT, NYSDOT, or FARS databases. OVS data includes pedestrians who died as a result of co-morbidities and had crash injuries listed as a contributing, but not primary, cause of death. These cases may be categorized as non-traffic pedestrian deaths in the NYCDOT-NYPD reconciliation process. Except where noted (e.g. borough and citywide fatality totals), NYSDOT data is used for all data in this study for depth and consistency. NYSDOT crash data is derived from MV-104AN reports completed by responding police officers at the crash scene. Traffic injuries are categorized by NYSDMV on the basis of victim status, body region injured, and injury type information provided on MV-104AN reports. This study defines severe injuries (or “A” injuries) according to NYSDMV criteria. NYSDMV-categorized severe injuries include all injuries involving an unconscious, semiconscious or incoherent victim, all injuries involving amputation, concussion, internal injuries, severe bleeding, moderate or severe burns, fractures or dislocations, and eye injuries. These injuries typically involve a pedestrian being transported from the scene by ambulance. A comparison of NYSDMV injury categories and Abbreviated Injury Severity codes (used in the medical and public health community) is provided on page 26. Spatial Distribution of Pedestrian-Vehicle Crashes Fatal and severe injury pedestrian-vehicle crashes occurred widely across the five boroughs. The geographic distribution of the 7,354 fatal and severe pedestrian crashes between 2002 and 2006 is shown in Figure 1-2. These maps show fatal and severe pedestrian crashes grouped by zip code and by census tract.
New York City Pedestrian Safety Study & Action Plan: Technical Supplement 5
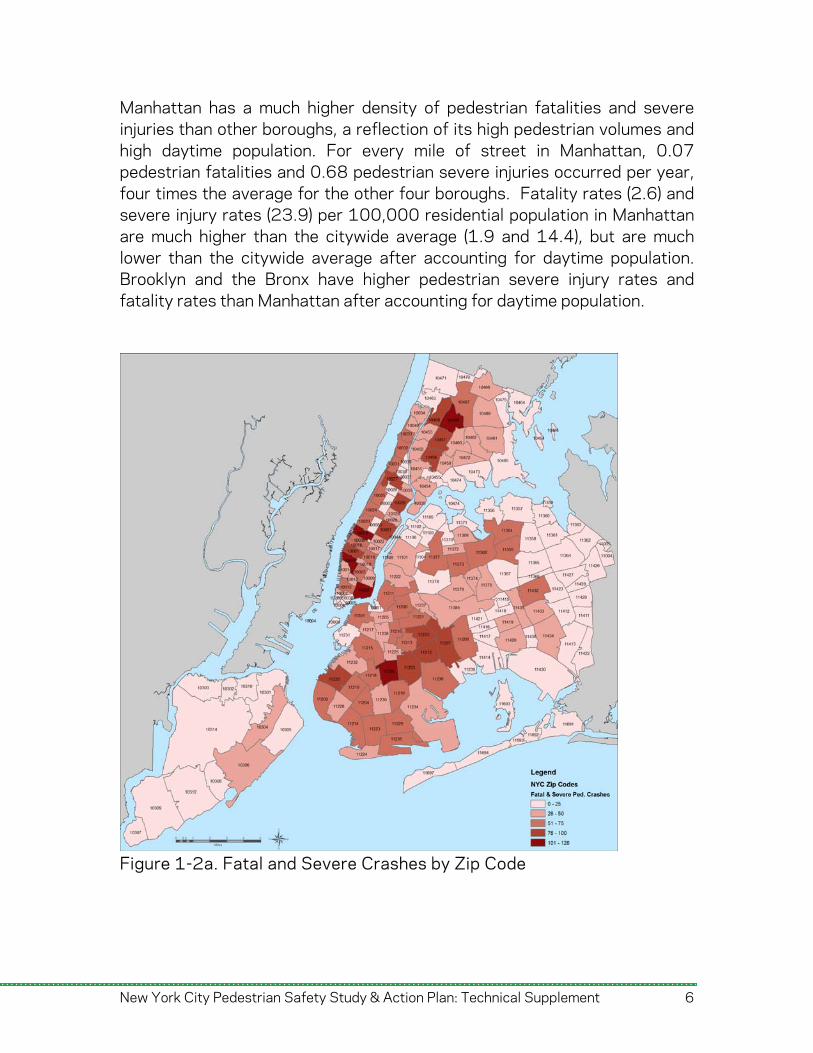
Manhattan has a much higher density of pedestrian fatalities and severe injuries than other boroughs, a reflection of its high pedestrian volumes and high daytime population. For every mile of street in Manhattan, 0.07 pedestrian fatalities and 0.68 pedestrian severe injuries occurred per year, four times the average for the other four boroughs. Fatality rates (2.6) and severe injury rates (23.9) per 100,000 residential population in Manhattan are much higher than the citywide average (1.9 and 14.4), but are much lower than the citywide average after accounting for daytime population. Brooklyn and the Bronx have higher pedestrian severe injury rates and fatality rates than Manhattan after accounting for daytime population.
Figure 1-2a. Fatal and Severe Crashes by Zip Code
New York City Pedestrian Safety Study & Action Plan: Technical Supplement 6
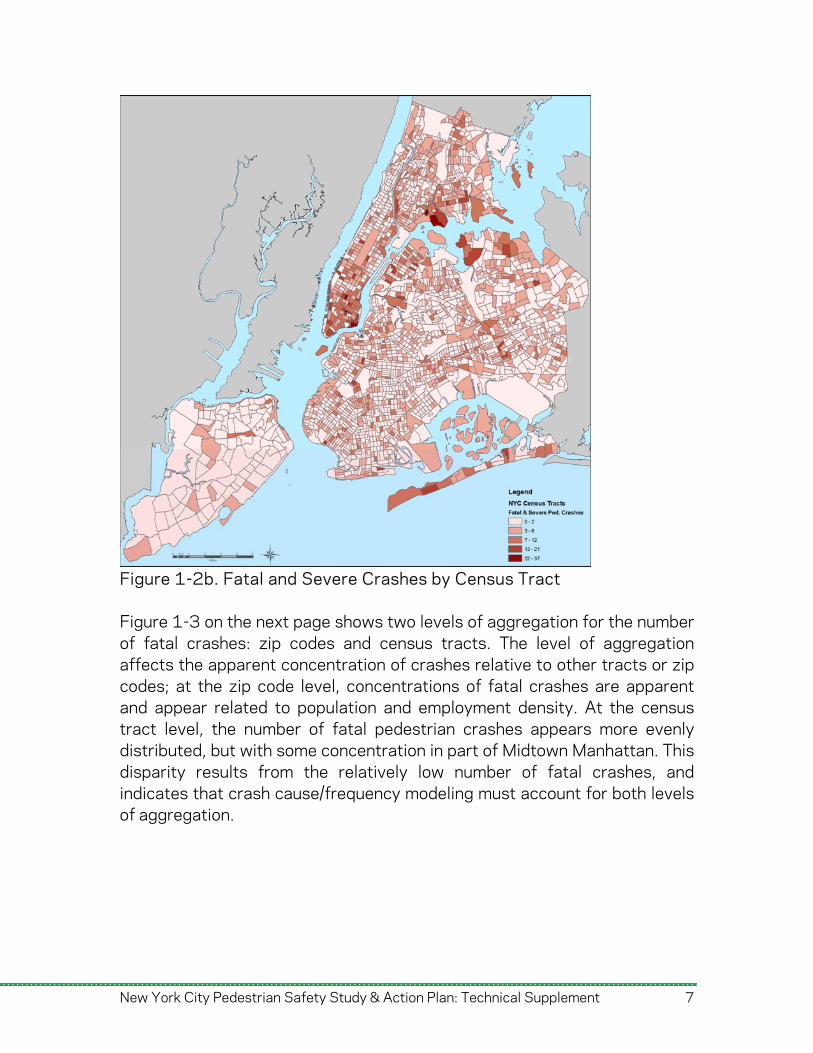
Figure 1-2b. Fatal and Severe Crashes by Census Tract Figure 1-3 on the next page shows two levels of aggregation for the number of fatal crashes: zip codes and census tracts. The level of aggregation affects the apparent concentration of crashes relative to other tracts or zip codes; at the zip code level, concentrations of fatal crashes are apparent and appear related to population and employment density. At the census tract level, the number of fatal pedestrian crashes appears more evenly distributed, but with some concentration in part of Midtown Manhattan. This disparity results from the relatively low number of fatal crashes, and indicates that crash cause/frequency modeling must account for both levels of aggregation.
New York City Pedestrian Safety Study & Action Plan: Technical Supplement 7
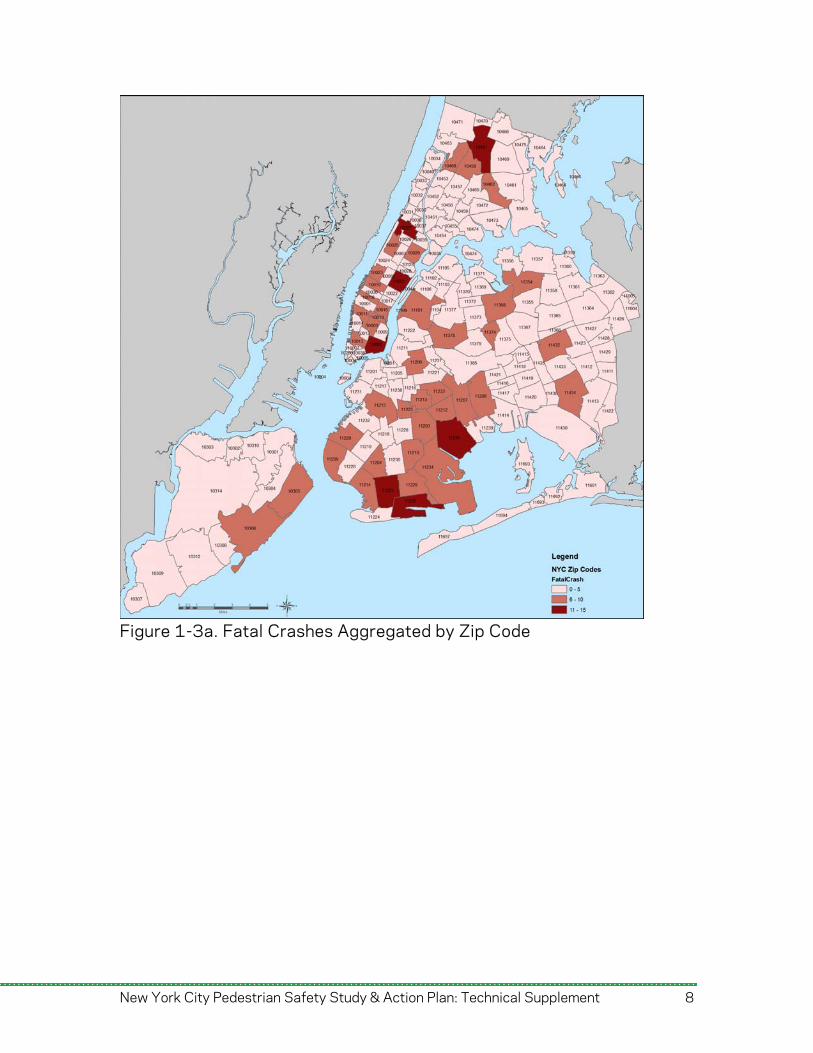
Figure 1-3a. Fatal Crashes Aggregated by Zip Code
New York City Pedestrian Safety Study & Action Plan: Technical Supplement 8
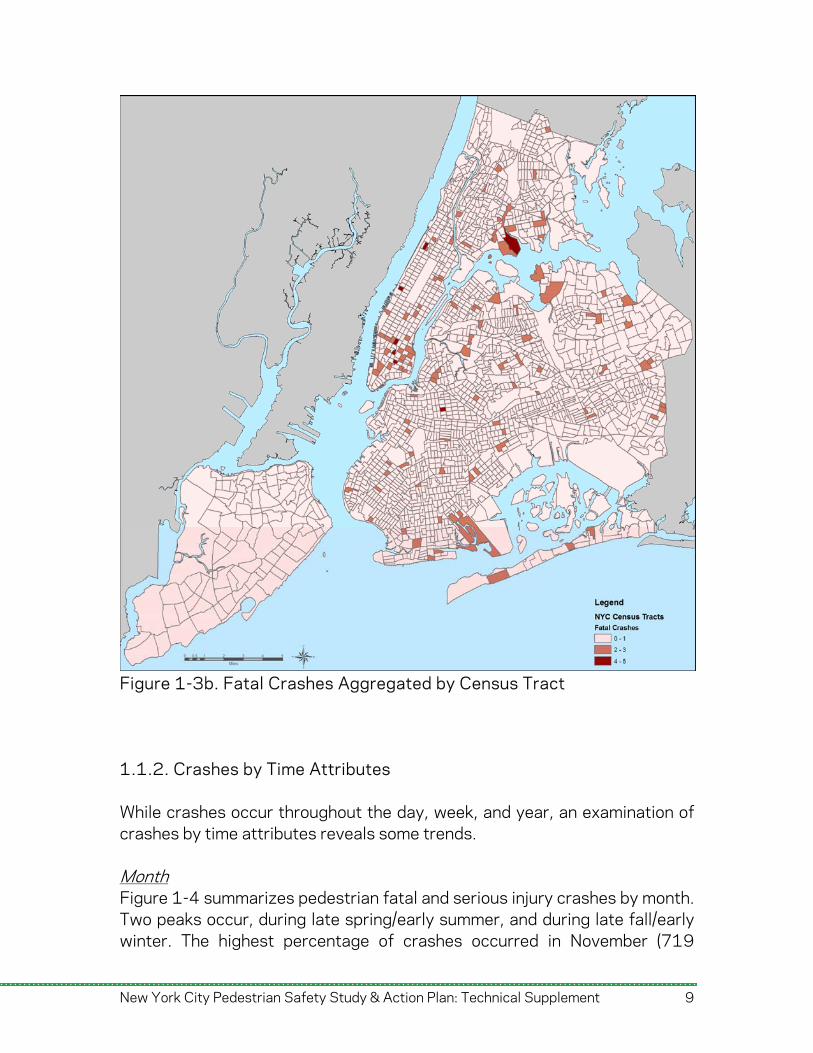
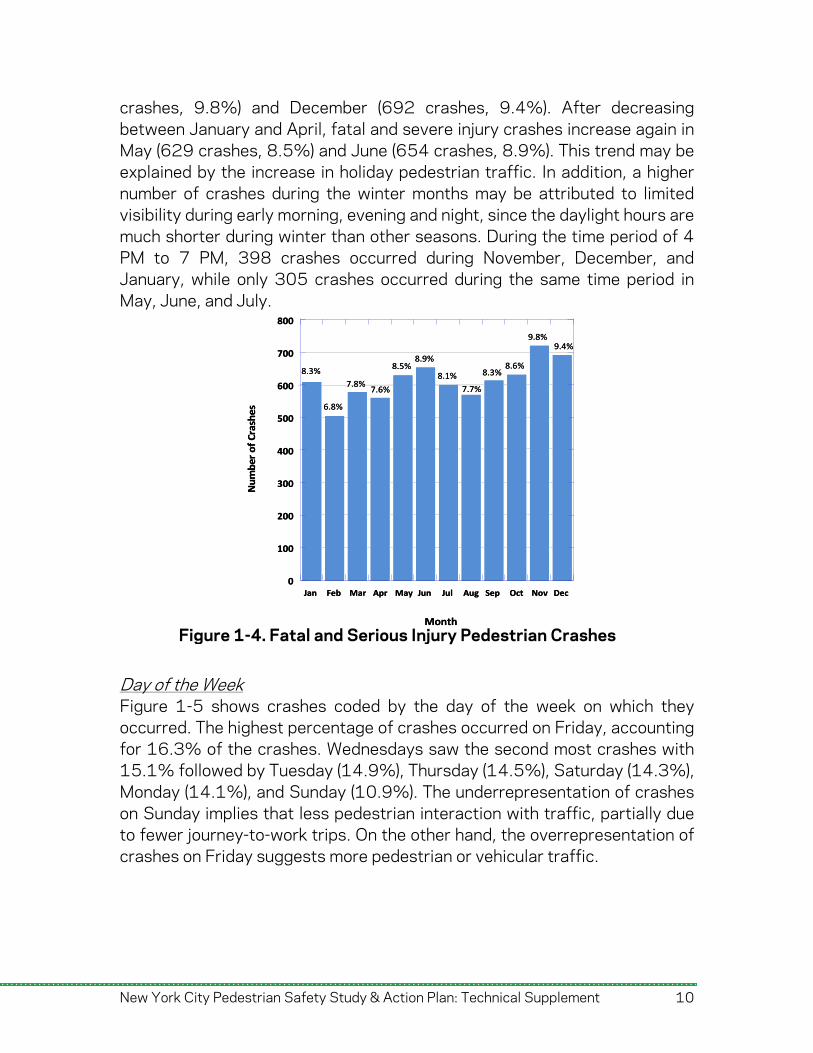
Figure 1-3b. Fatal Crashes Aggregated by Census Tract 1.1.2. Crashes by Time Attributes While crashes occur throughout the day, week, and year, an examination of crashes by time attributes reveals some trends. Month Figure 1-4 summarizes pedestrian fatal and serious injury crashes by month. Two peaks occur, during late spring/early summer, and during late fall/early winter. The highest percentage of crashes occurred in November (719
New York City Pedestrian Safety Study & Action Plan: Technical Supplement 9
New York City Pedestrian Safety Study & Action Plan: Technical Supplement 10
crashes, 9.8%) and December (692 crashes, 9.4%). After decreasing between January and April, fatal and severe injury crashes increase again in May (629 crashes, 8.5%) and June (654 crashes, 8.9%). This trend may be explained by the increase in holiday pedestrian traffic. In addition, a higher number of crashes during the winter months may be attributed to limited visibility during early morning, evening and night, since the daylight hours are much shorter during winter than other seasons. During the time period of 4 PM to 7 PM, 398 crashes occurred during November, December, and January, while only 305 crashes occurred during the same time period in May, June, and July.
Day of the Week Figure 1-5 shows crashes coded by the day of the week on which they occurred. The highest percentage of crashes occurred on Friday, accounting for 16.3% of the crashes. Wednesdays saw the second most crashes with 15.1% followed by Tuesday (14.9%), Thursday (14.5%), Saturday (14.3%), Monday (14.1%), and Sunday (10.9%). The underrepresentation of crashes on Sunday implies that less pedestrian interaction with traffic, partially due to fewer journey-to-work trips. On the other hand, the overrepresentation of crashes on Friday suggests more pedestrian or vehicular traffic.
0
100
200
300
Jan Feb Mar Apr May Jun Jul Aug Sep Oct Nov Dec
Number
8.3%
6.8%
7.8%7.6%
8.5%8.9%
8.1%
7.7%
8.3%8.6%
9.8%9.4%
400
500
600
700
800
of Crashes
Month
0
100
200
300
400
500
600
700
800
Jan Feb Mar Apr May Jun Jul Aug Sep Oct Nov Dec
Number of Crashes
8.3%
6.8%
7.8%7.6%
8.5%8.9%
8.1%
7.7%
8.3%8.6%
9.8%9.4%
Month
Figure 1-4. Fatal and Serious Injury Pedestrian Crashes
New York City Pedestrian Safety Study & Action Plan: Technical Supplement 11
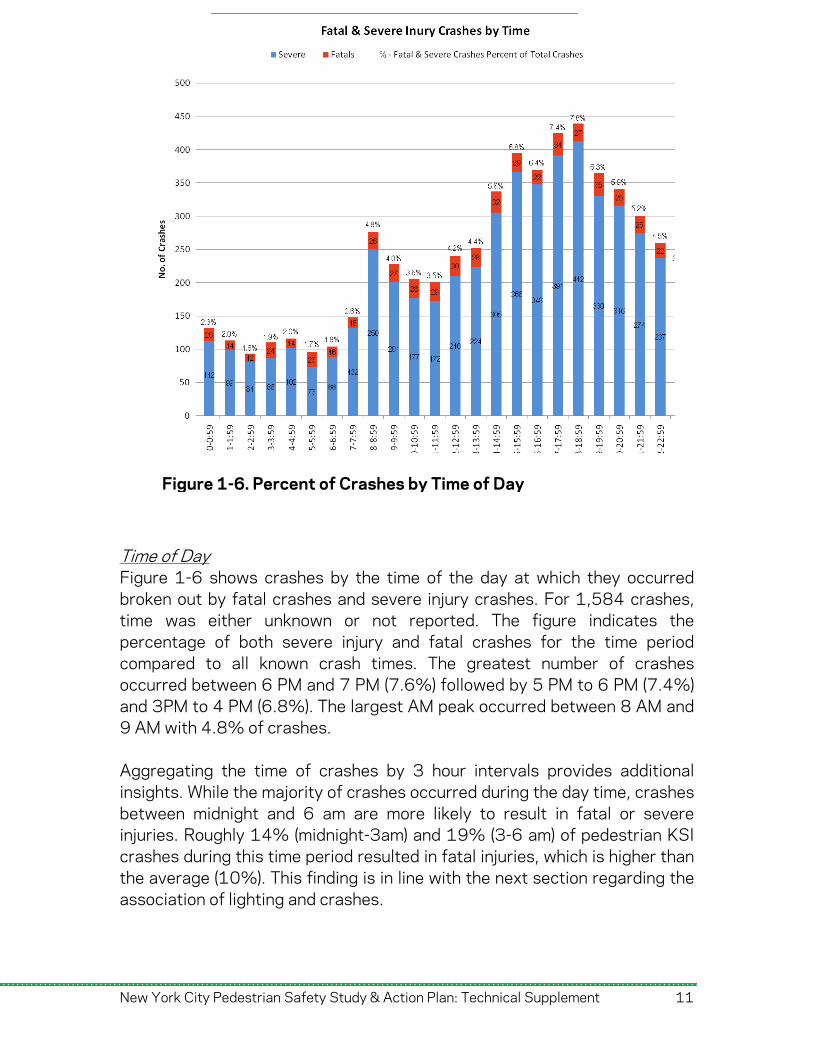
Time of Day Figure 1-6 shows crashes by the time of the day at which they occurred broken out by fatal crashes and severe injury crashes. For 1,584 crashes, time was either unknown or not reported. The figure indicates the percentage of both severe injury and fatal crashes for the time period compared to all known crash times. The greatest number of crashes occurred between 6 PM and 7 PM (7.6%) followed by 5 PM to 6 PM (7.4%) and 3PM to 4 PM (6.8%). The largest AM peak occurred between 8 AM and 9 AM with 4.8% of crashes. Aggregating the time of crashes by 3 hour intervals provides additional insights. While the majority of crashes occurred during the day time, crashes between midnight and 6 am are more likely to result in fatal or severe injuries. Roughly 14% (midnight-3am) and 19% (3-6 am) of pedestrian KSI crashes during this time period resulted in fatal injuries, which is higher than the average (10%). This finding is in line with the next section regarding the association of lighting and crashes.
Figure 1-5. Crashes by Day of the Week
Figure 1-6. Percent of Crashes by Time of Day
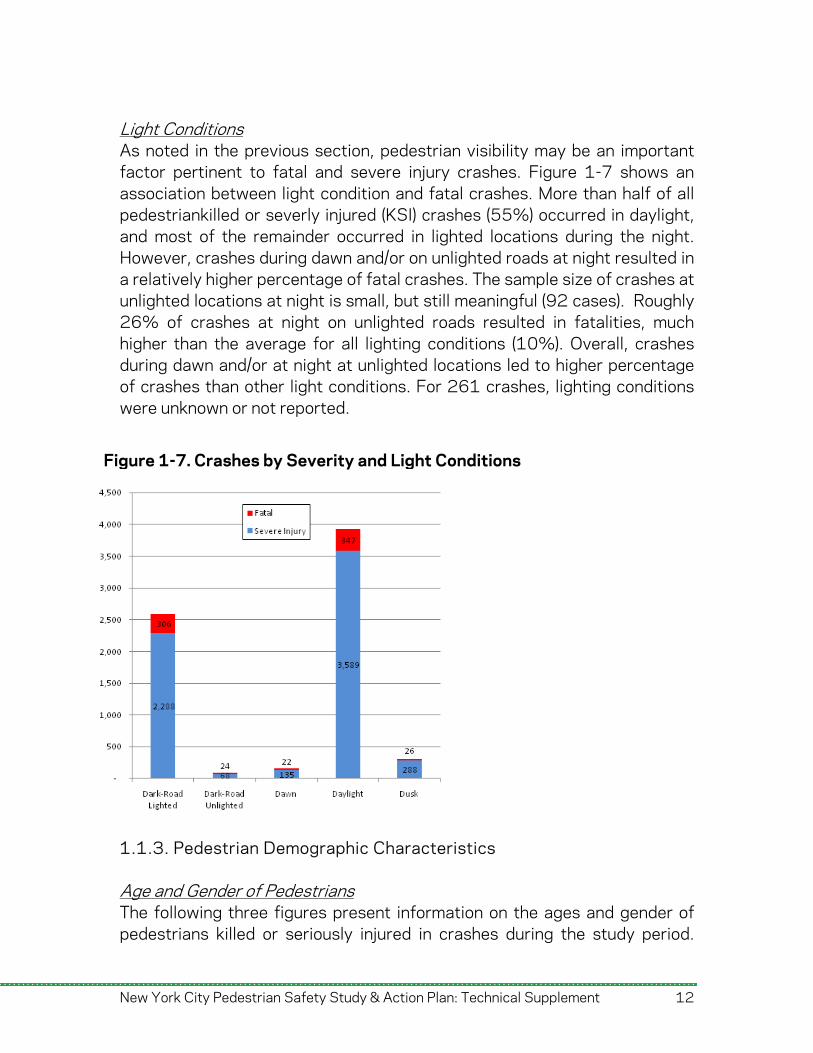
Light Conditions As noted in the previous section, pedestrian visibility may be an important factor pertinent to fatal and severe injury crashes. Figure 1-7 shows an association between light condition and fatal crashes. More than half of all pedestriankilled or severly injured (KSI) crashes (55%) occurred in daylight, and most of the remainder occurred in lighted locations during the night. However, crashes during dawn and/or on unlighted roads at night resulted in a relatively higher percentage of fatal crashes. The sample size of crashes at unlighted locations at night is small, but still meaningful (92 cases). Roughly 26% of crashes at night on unlighted roads resulted in fatalities, much higher than the average for all lighting conditions (10%). Overall, crashes during dawn and/or at night at unlighted locations led to higher percentage of crashes than other light conditions. For 261 crashes, lighting conditions were unknown or not reported.
Figure 1-7. Crashes by Severity and Light Conditions
1.1.3. Pedestrian Demographic Characteristics Age and Gender of Pedestrians The following three figures present information on the ages and gender of pedestrians killed or seriously injured in crashes during the study period.
New York City Pedestrian Safety Study & Action Plan: Technical Supplement 12
New York City Pedestrian Safety Study & Action Plan: Technical Supplement 13
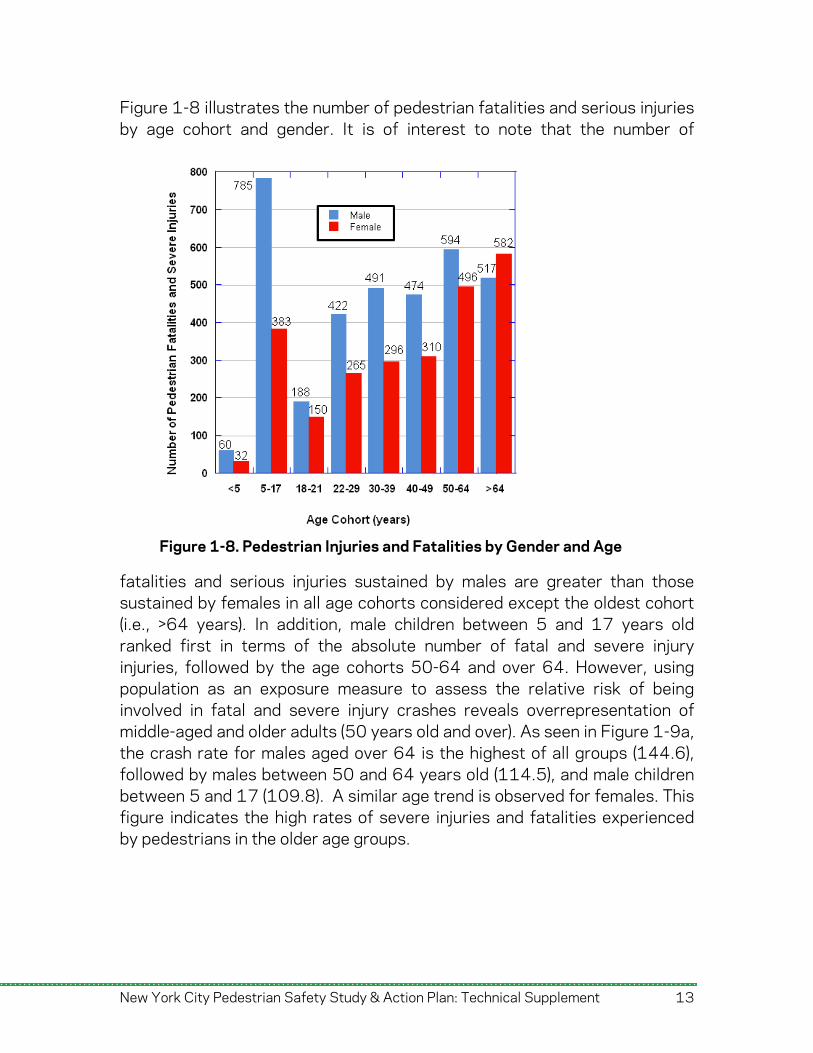
Figure 1-8 illustrates the number of pedestrian fatalities and serious injuries by age cohort and gender. It is of interest to note that the number of
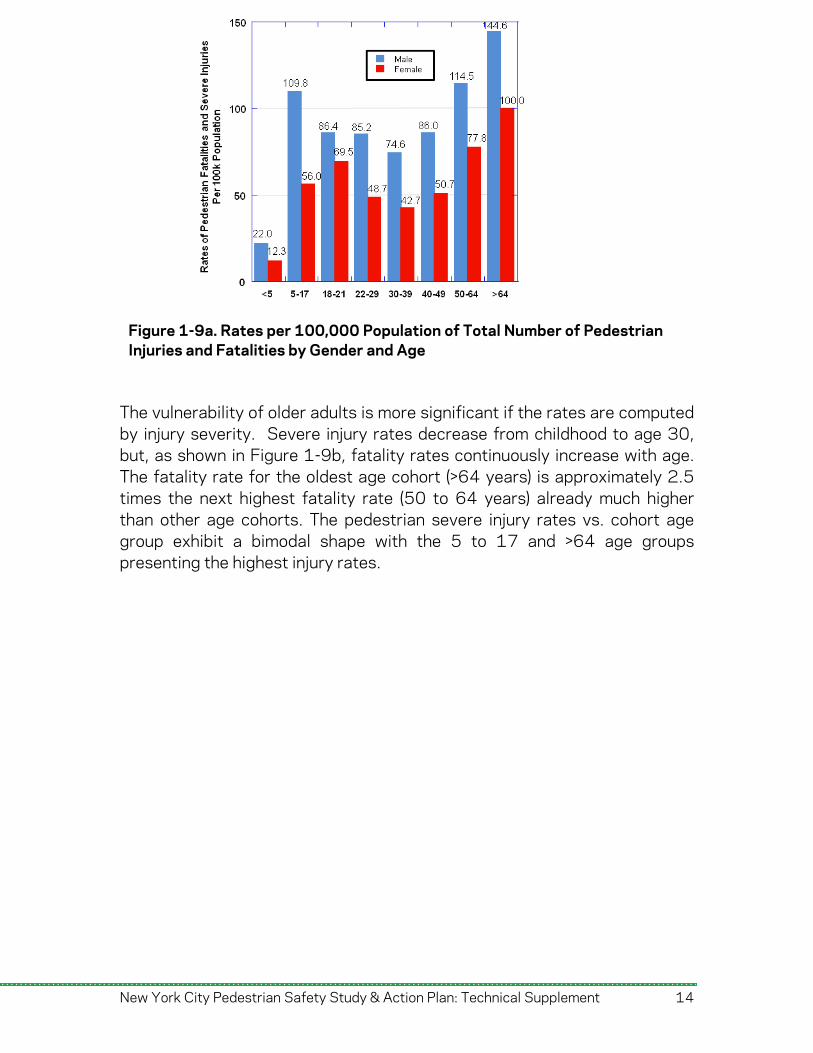
fatalities and serious injuries sustained by males are greater than those sustained by females in all age cohorts considered except the oldest cohort (i.e., >64 years). In addition, male children between 5 and 17 years old ranked first in terms of the absolute number of fatal and severe injury injuries, followed by the age cohorts 50-64 and over 64. However, using population as an exposure measure to assess the relative risk of being involved in fatal and severe injury crashes reveals overrepresentation of middle-aged and older adults (50 years old and over). As seen in Figure 1-9a, the crash rate for males aged over 64 is the highest of all groups (144.6), followed by males between 50 and 64 years old (114.5), and male children between 5 and 17 (109.8). A similar age trend is observed for females. This figure indicates the high rates of severe injuries and fatalities experienced by pedestrians in the older age groups.
Figure 1-8. Pedestrian Injuries and Fatalities by Gender and Age
New York City Pedestrian Safety Study & Action Plan: Technical Supplement 14
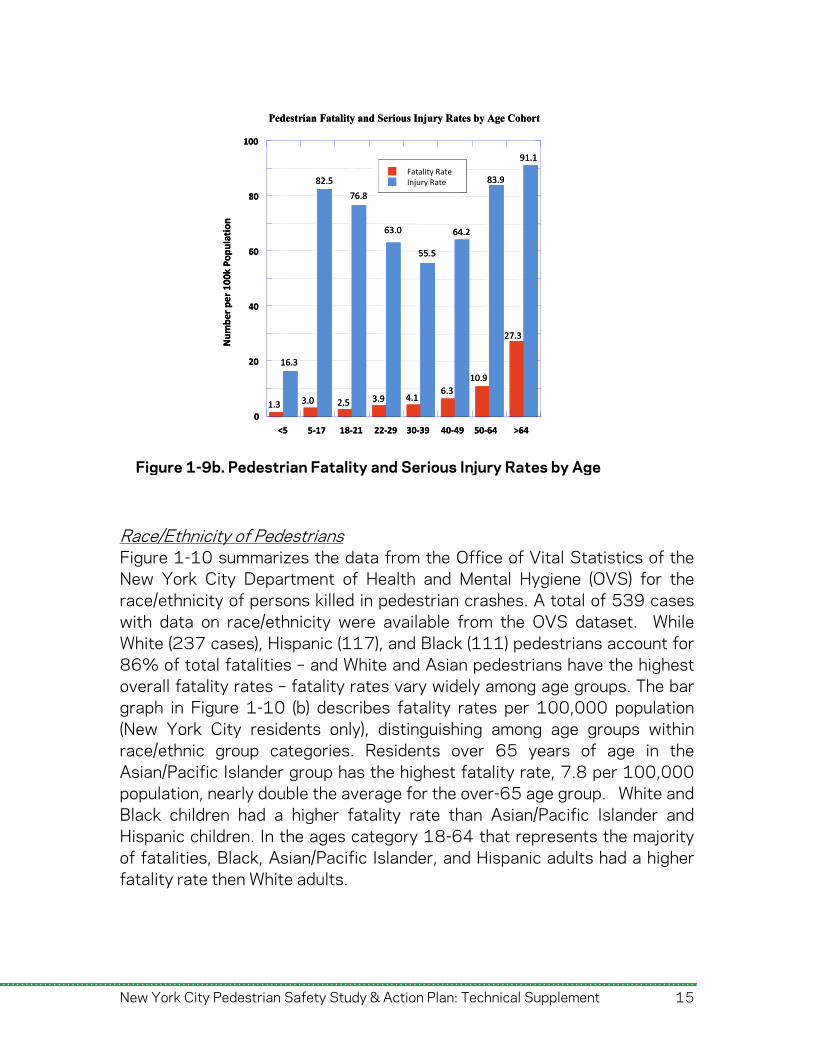
The vulnerability of older adults is more significant if the rates are computed by injury severity. Severe injury rates decrease from childhood to age 30, but, as shown in Figure 1-9b, fatality rates continuously increase with age. The fatality rate for the oldest age cohort (>64 years) is approximately 2.5 times the next highest fatality rate (50 to 64 years) already much higher than other age cohorts. The pedestrian severe injury rates vs. cohort age group exhibit a bimodal shape with the 5 to 17 and >64 age groups presenting the highest injury rates.
Figure 1-9a. Rates per 100,000 Population of Total Number of Pedestrian Injuries and Fatalities by Gender and Age
New York City Pedestrian Safety Study & Action Plan: Technical Supplement 15
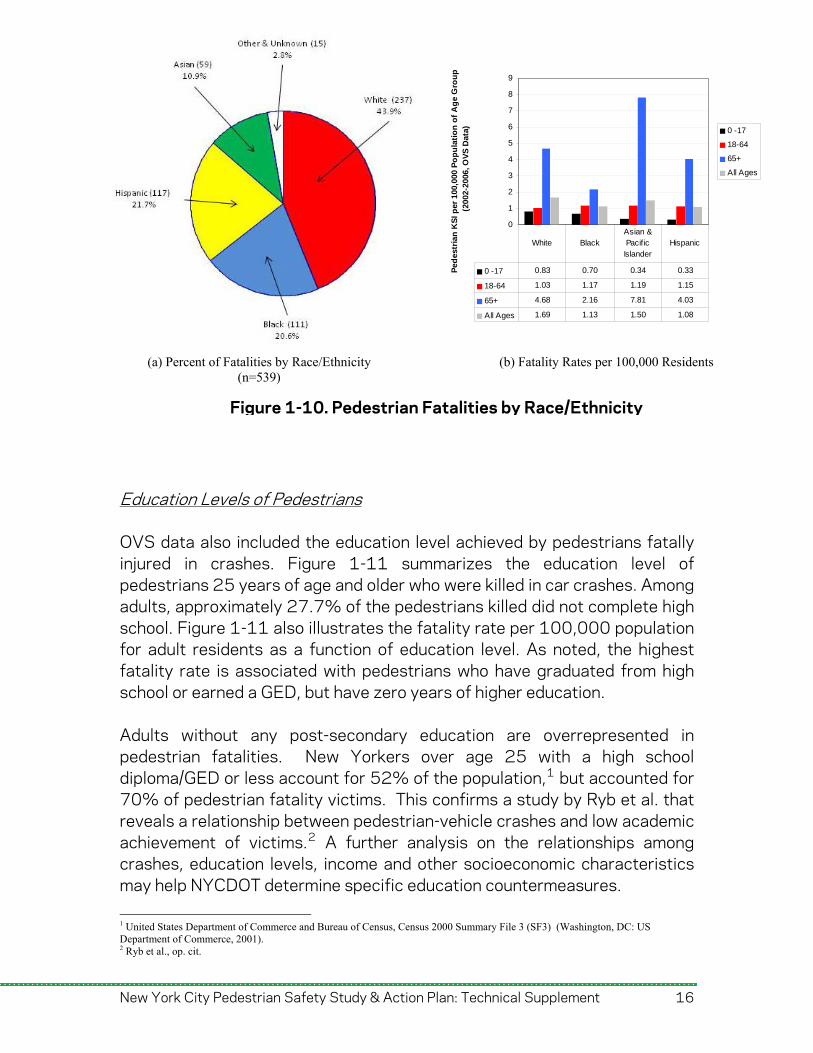
Race/Ethnicity of Pedestrians Figure 1-10 summarizes the data from the Office of Vital Statistics of the New York City Department of Health and Mental Hygiene (OVS) for the race/ethnicity of persons killed in pedestrian crashes. A total of 539 cases with data on race/ethnicity were available from the OVS dataset. While White (237 cases), Hispanic (117), and Black (111) pedestrians account for 86% of total fatalities – and White and Asian pedestrians have the highest overall fatality rates – fatality rates vary widely among age groups. The bar graph in Figure 1-10 (b) describes fatality rates per 100,000 population (New York City residents only), distinguishing among age groups within race/ethnic group categories. Residents over 65 years of age in the Asian/Pacific Islander group has the highest fatality rate, 7.8 per 100,000 population, nearly double the average for the over-65 age group. White and Black children had a higher fatality rate than Asian/Pacific Islander and Hispanic children. In the ages category 18-64 that represents the majority of fatalities, Black, Asian/Pacific Islander, and Hispanic adults had a higher fatality rate then White adults.
<5 5‐17 18‐21 30‐3922‐29 40‐
Number per 100k Population
49 >6450‐64
0
20
40
60
80
100
Fatality RateInjury Rate82.5
76.8
63.0
55.5
16.3
1.3 3.0 2.5 3.9 4.16.3
64.2
83.9
91.1
10.9
27.3
Pedestrian Fatality and Serious Injury Rates by Age Cohort
<5 5‐17 18‐21 30‐3922‐29 40‐
Number per 100k Population
49 >6450‐64
0
20
40
60
80
100
Fatality RateInjury RateFatality RateInjury Rate82.5
76.8
63.0
55.5
16.3
1.3 3.0 2.5 3.9 4.16.3
64.2
83.9
91.1
10.9
27.3
Pedestrian Fatality and Serious Injury Rates by Age Cohort
Figure 1-9b. Pedestrian Fatality and Serious Injury Rates by Age
New York City Pedestrian Safety Study & Action Plan: Technical Supplement 16
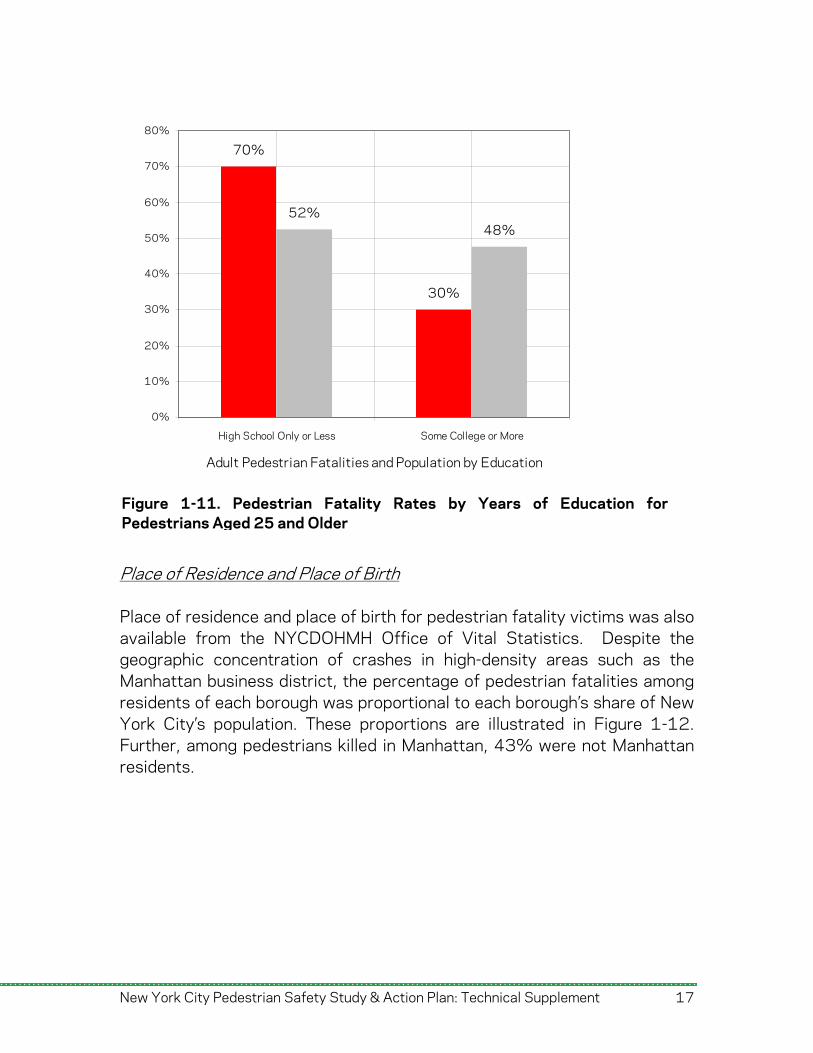
Education Levels of Pedestrians OVS data also included the education level achieved by pedestrians fatally injured in crashes. Figure 1-11 summarizes the education level of pedestrians 25 years of age and older who were killed in car crashes. Among adults, approximately 27.7% of the pedestrians killed did not complete high school. Figure 1-11 also illustrates the fatality rate per 100,000 population for adult residents as a function of education level. As noted, the highest fatality rate is associated with pedestrians who have graduated from high school or earned a GED, but have zero years of higher education. Adults without any post-secondary education are overrepresented in pedestrian fatalities. New Yorkers over age 25 with a high school diploma/GED or less account for 52% of the population,1 but accounted for 70% of pedestrian fatality victims. This confirms a study by Ryb et al. that reveals a relationship between pedestrian-vehicle crashes and low academic achievement of victims.2 A further analysis on the relationships among crashes, education levels, income and other socioeconomic characteristics may help NYCDOT determine specific education countermeasures. 1 United States Department of Commerce and Bureau of Census, Census 2000 Summary File 3 (SF3) (Washington, DC: US Department of Commerce, 2001). 2 Ryb et al., op. cit.
(a) Percent of Fatalities by Race/Ethnicity (n=539)
(b) Fatality Rates per 100,000 Residents
Figure 1-10. Pedestrian Fatalities by Race/Ethnicity
0
1
2
3
4
5
6
7
8
9
Ped
estr
ian
KS
I per
100
,000
Po
pu
lati
on
of
Ag
e G
rou
p
(200
2-20
06, O
VS
Dat
a) 0 -17
18-64
65+
All Ages
0 -17 0.83 0.70 0.34 0.33
18-64 1.03 1.17 1.19 1.15
65+ 4.68 2.16 7.81 4.03
All Ages 1.69 1.13 1.50 1.08
White BlackAsian & Pacif ic Islander
Hispanic
70%
30%
52%48%
0%
10%
20%
30%
40%
50%
60%
70%
80%
High School Only or Less Some College or More
Adult Pedestrian Fatalities and Population by Education
Figure 1-11. Pedestrian Fatality Rates by Years of Education for Pedestrians Aged 25 and Older
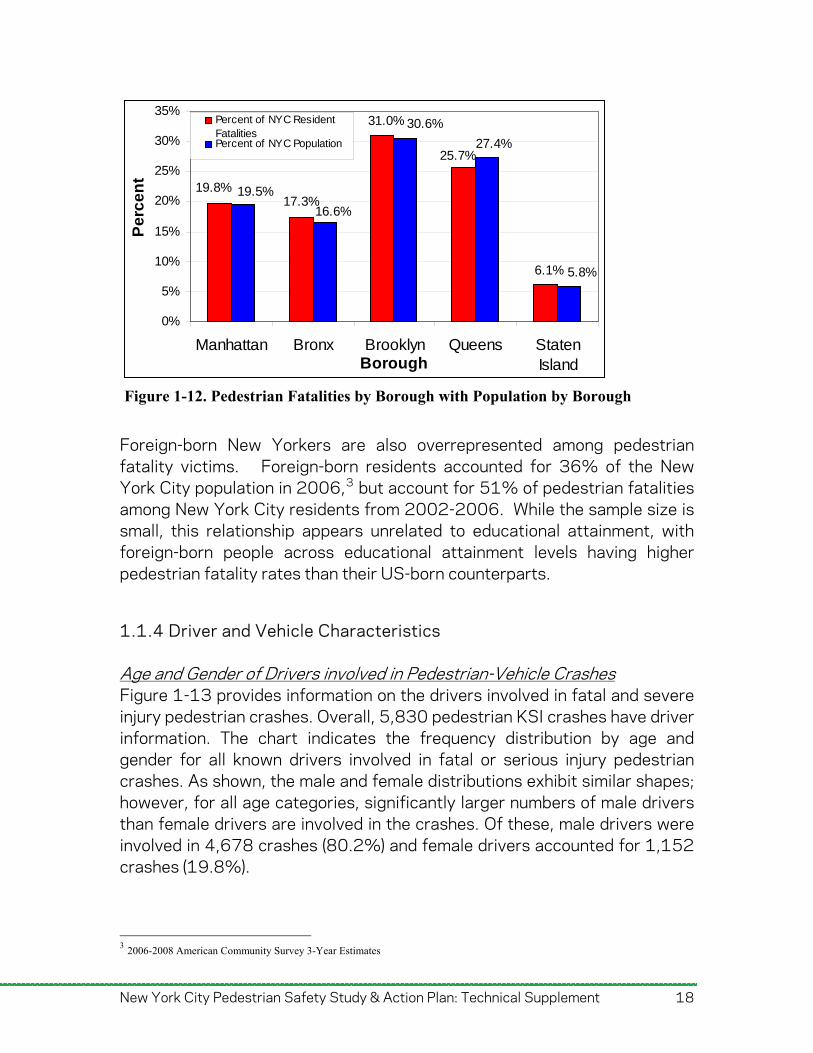
Place of Residence and Place of Birth Place of residence and place of birth for pedestrian fatality victims was also available from the NYCDOHMH Office of Vital Statistics. Despite the geographic concentration of crashes in high-density areas such as the Manhattan business district, the percentage of pedestrian fatalities among residents of each borough was proportional to each borough’s share of New York City’s population. These proportions are illustrated in Figure 1-12. Further, among pedestrians killed in Manhattan, 43% were not Manhattan residents.
New York City Pedestrian Safety Study & Action Plan: Technical Supplement 17
New York City Pedestrian Safety Study & Action Plan: Technical Supplement 18
6.1%
25.7%
31.0%
19.8%17.3%
5.8%
27.4%
30.6%
19.5%
16.6%
0%
5%
10%
15%
20%
25%
30%
35%
Manhattan Bronx Brooklyn Queens StatenIslandBorough
Pe
rce
nt
Percent of NYC ResidentFatalitiesPercent of NYC Population
Foreign-born New Yorkers are also overrepresented among pedestrian fatality victims. Foreign-born residents accounted for 36% of the New York City population in 2006,3 but account for 51% of pedestrian fatalities among New York City residents from 2002-2006. While the sample size is small, this relationship appears unrelated to educational attainment, with foreign-born people across educational attainment levels having higher pedestrian fatality rates than their US-born counterparts.
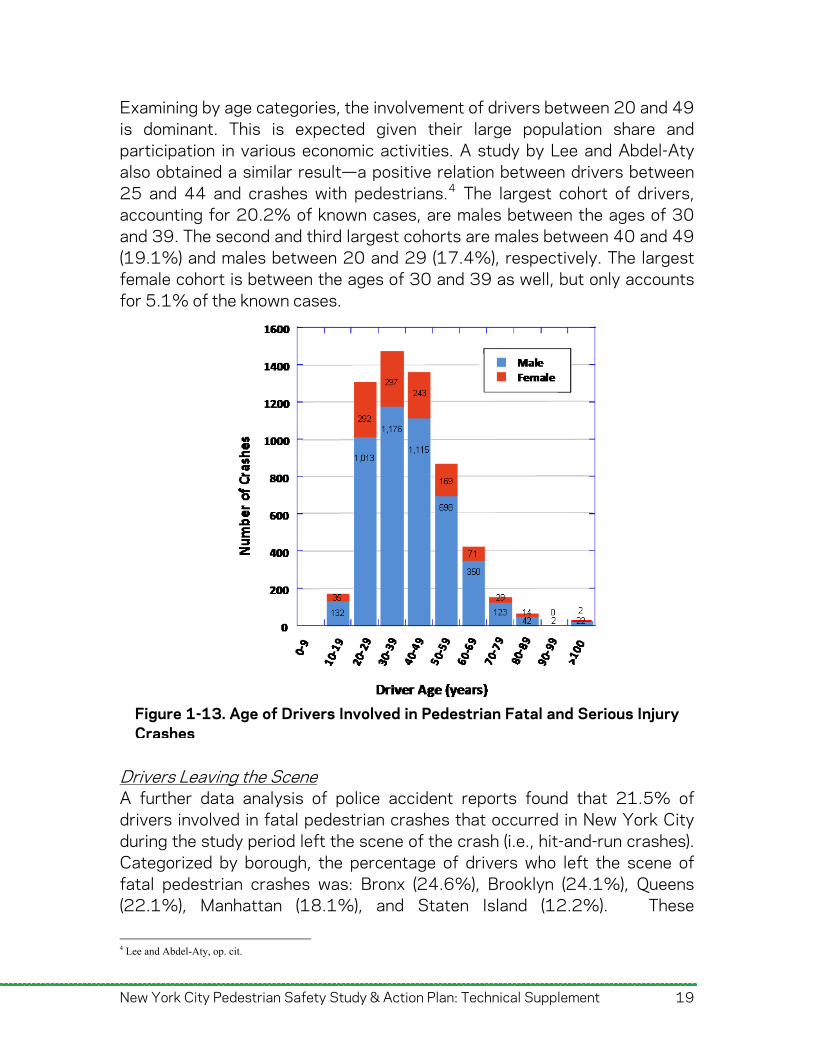
1.1.4 Driver and Vehicle Characteristics Age and Gender of Drivers involved in Pedestrian-Vehicle Crashes Figure 1-13 provides information on the drivers involved in fatal and severe injury pedestrian crashes. Overall, 5,830 pedestrian KSI crashes have driver information. The chart indicates the frequency distribution by age and gender for all known drivers involved in fatal or serious injury pedestrian crashes. As shown, the male and female distributions exhibit similar shapes; however, for all age categories, significantly larger numbers of male drivers than female drivers are involved in the crashes. Of these, male drivers were involved in 4,678 crashes (80.2%) and female drivers accounted for 1,152 crashes (19.8%).
3 2006-2008 American Community Survey 3-Year Estimates
Figure 1-12. Pedestrian Fatalities by Borough with Population by Borough
New York City Pedestrian Safety Study & Action Plan: Technical Supplement 19
Examining by age categories, the involvement of drivers between 20 and 49 is dominant. This is expected given their large population share and participation in various economic activities. A study by Lee and Abdel-Aty also obtained a similar result—a positive relation between drivers between 25 and 44 and crashes with pedestrians.4 The largest cohort of drivers, accounting for 20.2% of known cases, are males between the ages of 30 and 39. The second and third largest cohorts are males between 40 and 49 (19.1%) and males between 20 and 29 (17.4%), respectively. The largest female cohort is between the ages of 30 and 39 as well, but only accounts for 5.1% of the known cases.
Drivers Leaving the Scene A further data analysis of police accident reports found that 21.5% of drivers involved in fatal pedestrian crashes that occurred in New York City during the study period left the scene of the crash (i.e., hit-and-run crashes). Categorized by borough, the percentage of drivers who left the scene of fatal pedestrian crashes was: Bronx (24.6%), Brooklyn (24.1%), Queens (22.1%), Manhattan (18.1%), and Staten Island (12.2%). These
4 Lee and Abdel-Aty, op. cit.
Figure 1-13. Age of Drivers Involved in Pedestrian Fatal and Serious Injury Crashes
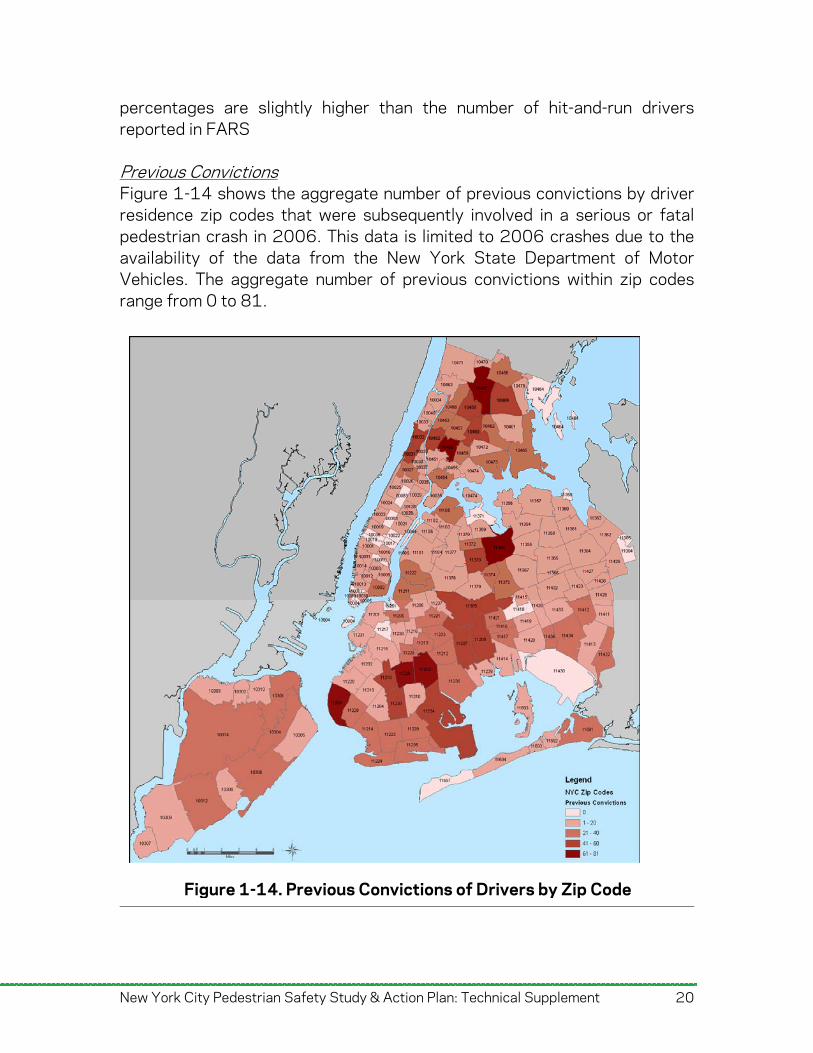
percentages are slightly higher than the number of hit-and-run drivers reported in FARS Previous Convictions Figure 1-14 shows the aggregate number of previous convictions by driver residence zip codes that were subsequently involved in a serious or fatal pedestrian crash in 2006. This data is limited to 2006 crashes due to the availability of the data from the New York State Department of Motor Vehicles. The aggregate number of previous convictions within zip codes range from 0 to 81.
Figure 1-14. Previous Convictions of Drivers by Zip Code
New York City Pedestrian Safety Study & Action Plan: Technical Supplement 20
New York City Pedestrian Safety Study & Action Plan: Technical Supplement 21
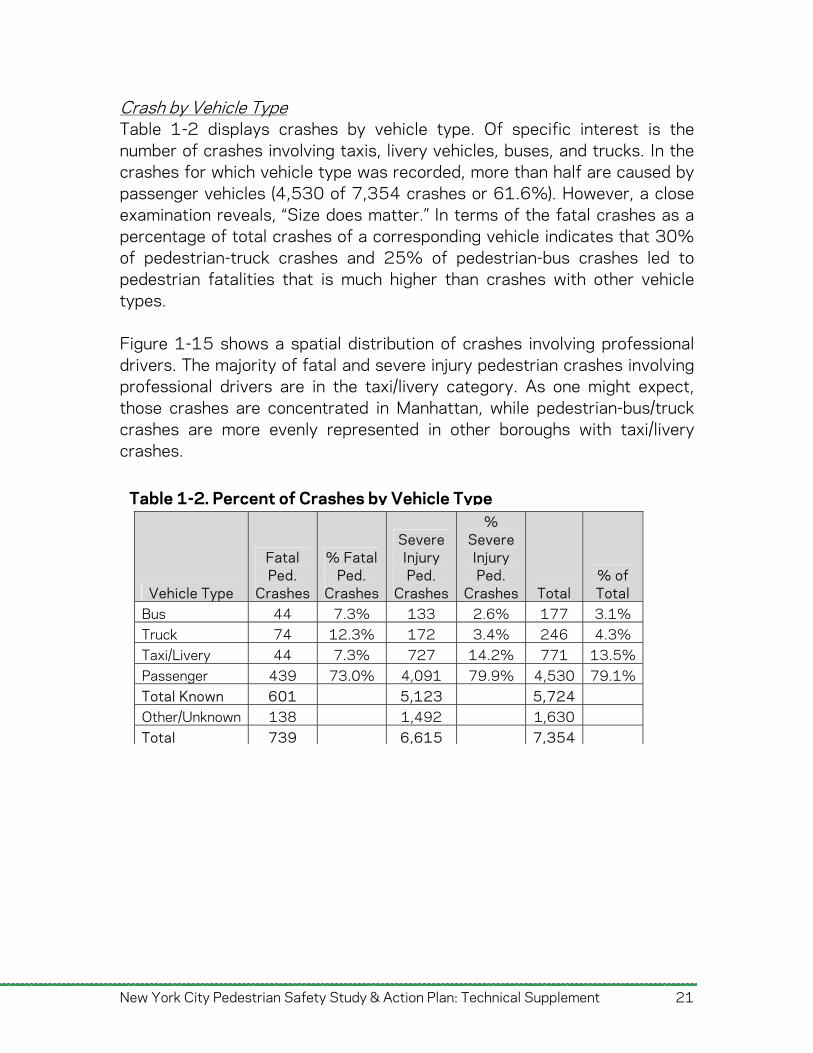
Crash by Vehicle Type Table 1-2 displays crashes by vehicle type. Of specific interest is the number of crashes involving taxis, livery vehicles, buses, and trucks. In the crashes for which vehicle type was recorded, more than half are caused by passenger vehicles (4,530 of 7,354 crashes or 61.6%). However, a close examination reveals, “Size does matter.” In terms of the fatal crashes as a percentage of total crashes of a corresponding vehicle indicates that 30% of pedestrian-truck crashes and 25% of pedestrian-bus crashes led to pedestrian fatalities that is much higher than crashes with other vehicle types. Figure 1-15 shows a spatial distribution of crashes involving professional drivers. The majority of fatal and severe injury pedestrian crashes involving professional drivers are in the taxi/livery category. As one might expect, those crashes are concentrated in Manhattan, while pedestrian-bus/truck crashes are more evenly represented in other boroughs with taxi/livery crashes.
Vehicle Type
Fatal Ped.
Crashes
% Fatal Ped.
Crashes
Severe Injury Ped.
Crashes
% Severe Injury Ped.
Crashes Total % of Total
Bus 44 7.3% 133 2.6% 177 3.1% Truck 74 12.3% 172 3.4% 246 4.3% Taxi/Livery 44 7.3% 727 14.2% 771 13.5% Passenger 439 73.0% 4,091 79.9% 4,530 79.1% Total Known 601 5,123 5,724 Other/Unknown 138 1,492 1,630 Total 739 6,615 7,354
Table 1-2. Percent of Crashes by Vehicle Type
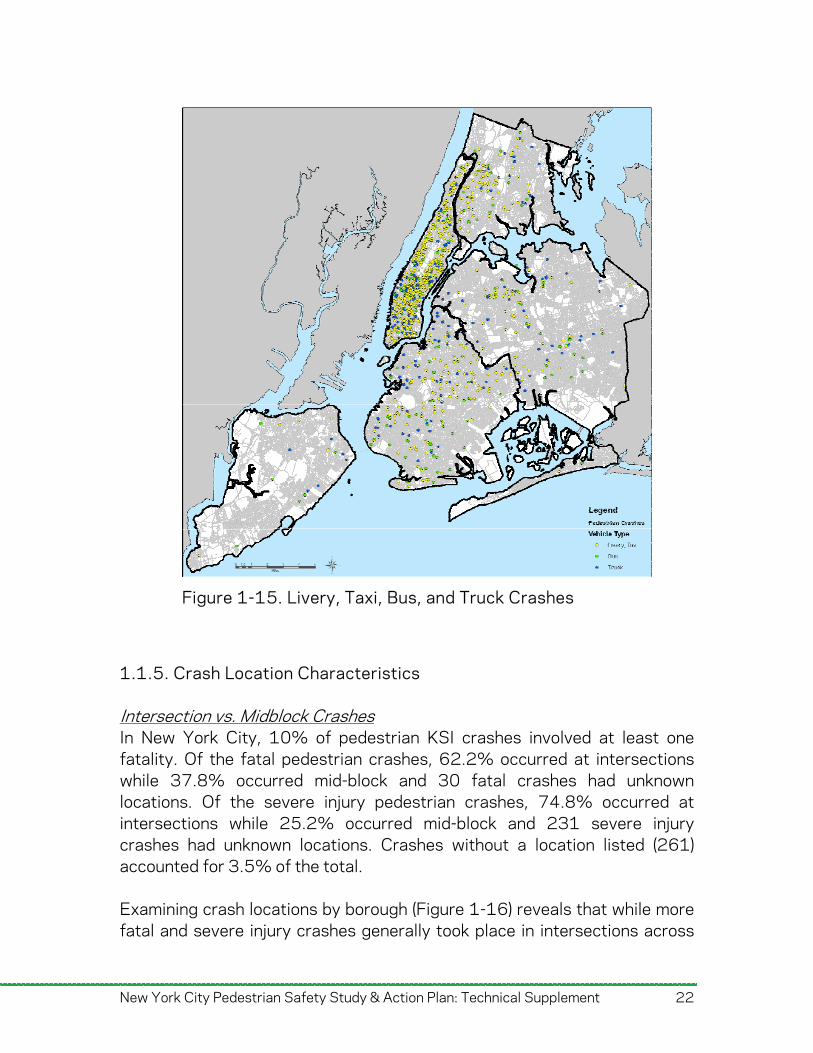
Figure 1-15. Livery, Taxi, Bus, and Truck Crashes
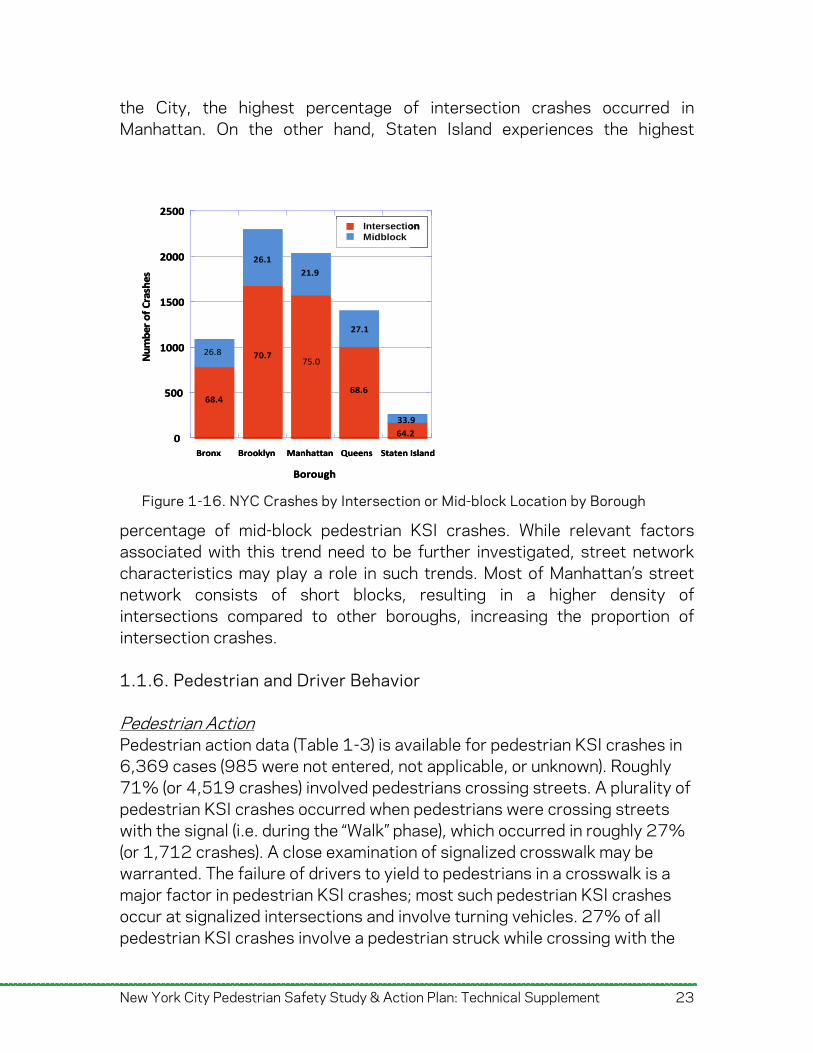
1.1.5. Crash Location Characteristics Intersection vs. Midblock Crashes In New York City, 10% of pedestrian KSI crashes involved at least one fatality. Of the fatal pedestrian crashes, 62.2% occurred at intersections while 37.8% occurred mid-block and 30 fatal crashes had unknown locations. Of the severe injury pedestrian crashes, 74.8% occurred at intersections while 25.2% occurred mid-block and 231 severe injury crashes had unknown locations. Crashes without a location listed (261) accounted for 3.5% of the total. Examining crash locations by borough (Figure 1-16) reveals that while more fatal and severe injury crashes generally took place in intersections across
New York City Pedestrian Safety Study & Action Plan: Technical Supplement 22
New York City Pedestrian Safety Study & Action Plan: Technical Supplement 23
the City, the highest percentage of intersection crashes occurred in Manhattan. On the other hand, Staten Island experiences the highest
percentage of mid-block pedestrian KSI crashes. While relevant factors associated with this trend need to be further investigated, street network characteristics may play a role in such trends. Most of Manhattan’s street network consists of short blocks, resulting in a higher density of intersections compared to other boroughs, increasing the proportion of intersection crashes. 1.1.6. Pedestrian and Driver Behavior Pedestrian Action Pedestrian action data (Table 1-3) is available for pedestrian KSI crashes in 6,369 cases (985 were not entered, not applicable, or unknown). Roughly 71% (or 4,519 crashes) involved pedestrians crossing streets. A plurality of pedestrian KSI crashes occurred when pedestrians were crossing streets with the signal (i.e. during the “Walk” phase), which occurred in roughly 27% (or 1,712 crashes). A close examination of signalized crosswalk may be warranted. The failure of drivers to yield to pedestrians in a crosswalk is a major factor in pedestrian KSI crashes; most such pedestrian KSI crashes occur at signalized intersections and involve turning vehicles. 27% of all pedestrian KSI crashes involve a pedestrian struck while crossing with the
Figure 1-16. NYC Crashes by Intersection or Mid-block Location by Borough
0Bronx Brooklyn Manhattan Queens Staten Island
Borough
500
1000
1500
2000
2500
IntersectionMidblock
Number of Crashes
26.8
68.4
26.1
70.7
21.9
75.0
27.1
68.6
33.9
64.20
Bronx Brooklyn Manhattan Queens Staten Island
Borough
500
1000
1500
2000
2500
IntersectionMidblockIntersectionMidblock
Number of Crashes
26.8
68.4
26.1
70.7
21.9
75.0
27.1
68.6
33.9
64.2
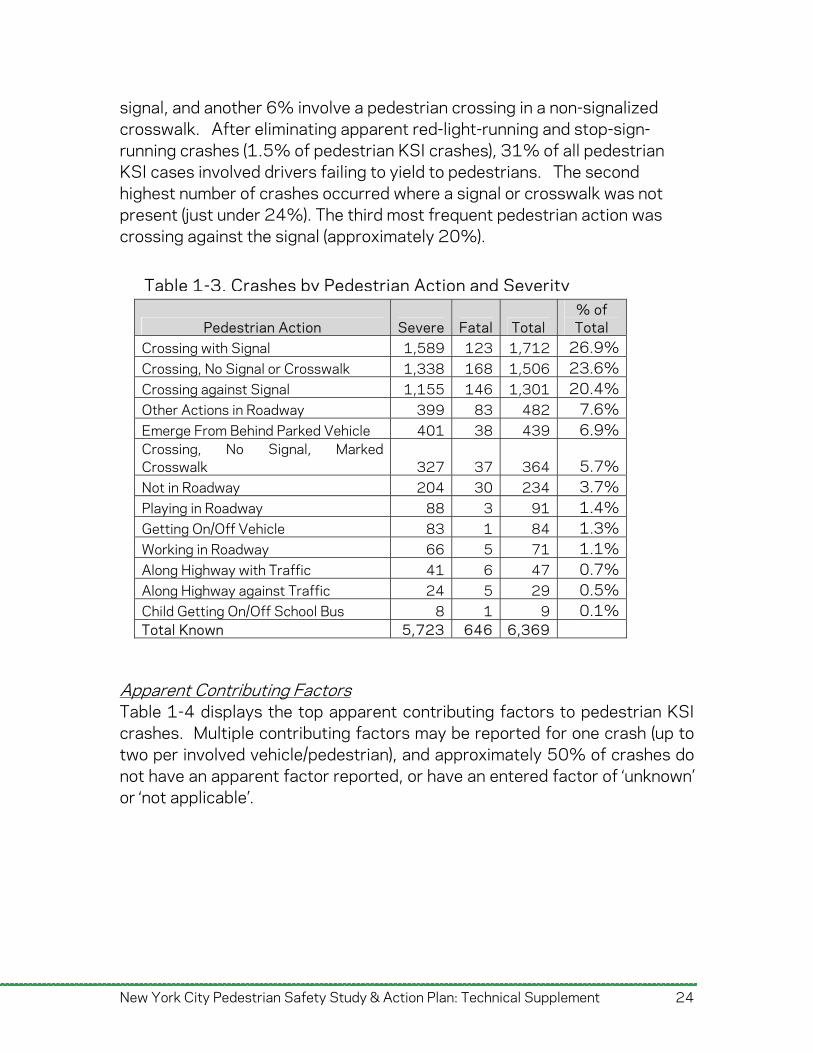
signal, and another 6% involve a pedestrian crossing in a non-signalized crosswalk. After eliminating apparent red-light-running and stop-sign-running crashes (1.5% of pedestrian KSI crashes), 31% of all pedestrian KSI cases involved drivers failing to yield to pedestrians. The second highest number of crashes occurred where a signal or crosswalk was not present (just under 24%). The third most frequent pedestrian action was crossing against the signal (approximately 20%).
Pedestrian Action Severe Fatal Total % of Total
Crossing with Signal 1,712 26.9% 1,589 12323.6% Crossing, No Signal or Crosswalk 1,338 168 1,50620.4% Crossing against Signal 1,155 146 1,301
7.6% Other Actions in Roadway 399 83 4826.9% Emerge From Behind Parked Vehicle 401 38 439
Crossing, No Signal, Marked Crosswalk 327 37 364 5.7%
3.7% Not in Roadway 204 30 2341.4% Playing in Roadway 88 3 911.3% Getting On/Off Vehicle 83 1 841.1% Working in Roadway 66 5 71
Along Highway with Traffic 41 6 47 0.7% Along Highway against Traffic 24 5 29 0.5% Child Getting On/Off School Bus 8 1 9 0.1% Total Known 5,723 646 6,369
Table 1-3. Crashes by Pedestrian Action and Severity
Apparent Contributing Factors Table 1-4 displays the top apparent contributing factors to pedestrian KSI crashes. Multiple contributing factors may be reported for one crash (up to two per involved vehicle/pedestrian), and approximately 50% of crashes do not have an apparent factor reported, or have an entered factor of ‘unknown’ or ‘not applicable’.
New York City Pedestrian Safety Study & Action Plan: Technical Supplement 24
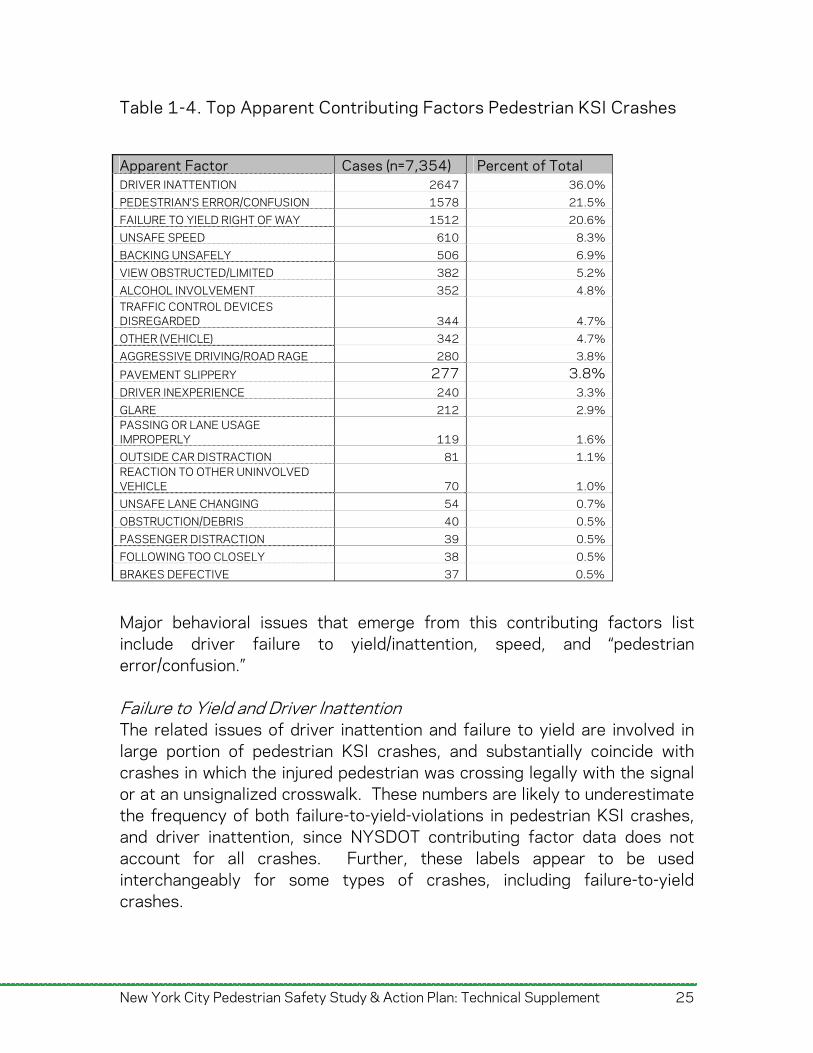
Table 1-4. Top Apparent Contributing Factors Pedestrian KSI Crashes
Apparent Factor Cases (n=7,354) Percent of Total DRIVER INATTENTION 2647 36.0% PEDESTRIAN'S ERROR/CONFUSION 1578 21.5% FAILURE TO YIELD RIGHT OF WAY 1512 20.6% UNSAFE SPEED 610 8.3% BACKING UNSAFELY 506 6.9% VIEW OBSTRUCTED/LIMITED 382 5.2% ALCOHOL INVOLVEMENT 352 4.8% TRAFFIC CONTROL DEVICES DISREGARDED 344 4.7% OTHER (VEHICLE) 342 4.7% AGGRESSIVE DRIVING/ROAD RAGE 280 3.8%
PAVEMENT SLIPPERY 277 3.8% DRIVER INEXPERIENCE 240 3.3% GLARE 212 2.9% PASSING OR LANE USAGE IMPROPERLY 119 1.6% OUTSIDE CAR DISTRACTION 81 1.1% REACTION TO OTHER UNINVOLVED VEHICLE 70 1.0% UNSAFE LANE CHANGING 54 0.7% OBSTRUCTION/DEBRIS 40 0.5% PASSENGER DISTRACTION 39 0.5% FOLLOWING TOO CLOSELY 38 0.5% BRAKES DEFECTIVE 37 0.5%
Major behavioral issues that emerge from this contributing factors list include driver failure to yield/inattention, speed, and “pedestrian error/confusion.” Failure to Yield and Driver Inattention The related issues of driver inattention and failure to yield are involved in large portion of pedestrian KSI crashes, and substantially coincide with crashes in which the injured pedestrian was crossing legally with the signal or at an unsignalized crosswalk. These numbers are likely to underestimate the frequency of both failure-to-yield-violations in pedestrian KSI crashes, and driver inattention, since NYSDOT contributing factor data does not account for all crashes. Further, these labels appear to be used interchangeably for some types of crashes, including failure-to-yield crashes.
New York City Pedestrian Safety Study & Action Plan: Technical Supplement 25
New York City Pedestrian Safety Study & Action Plan: Technical Supplement 26
Pedestrian Behavior Pedestrian error/confusion is reported in 21.5% of cases, and is typically reported in crossing-against-the-signal and midblock-crossing crashes. However, pedestrian action data is a more reliable source for understanding pedestrian behavior as relates to crashes. Speed 21% of all pedestrian KSI crashes were attributed by responding officers to speed-related contributing factors: speeding (8.3%), slippery pavement (i.e. driving too fast to stop under prevailing weather conditions, 3.8%), limited sight distance (i.e. driving too fast for specific geometric conditions, 5.2%), aggressive driving (3.8%), and following too closely (0.5%). These numbers are likely to underestimate the importance of speeding, since NYSDOT contributing factor data does not account for all crashes, and only two contributing factors may be reported for each crash. Many DWI crashes (4.8%) and driver inattention crashes (36%) are also suspected to involve speeding or unsafe speeds. Alcohol Alcohol involvement was reported as a factor in 8.1% of fatal crashes and 3.1% of severe injury crashes. This may also be an underestimate, since other data (discussed above) suggest that drivers leave the scene in about 21% of the fatal and serious injury crashes. Other research indicates that drivers who leave the scene (and are later identified) are more likely to have had a previous arrest for driving while intoxicated than drivers who remain at the scene.5 5 Sara J. Solnick and David Hemenway, “Hit the Bottle and Run: The Role of Alcohol in Hit-and-Run Pedestrian Fatalities,” Journal of Studies on Alcohol and Drugs 55:6 (1994): 679-584.
New York City Pedestrian Safety Study & Action Plan: Technical Supplement 27
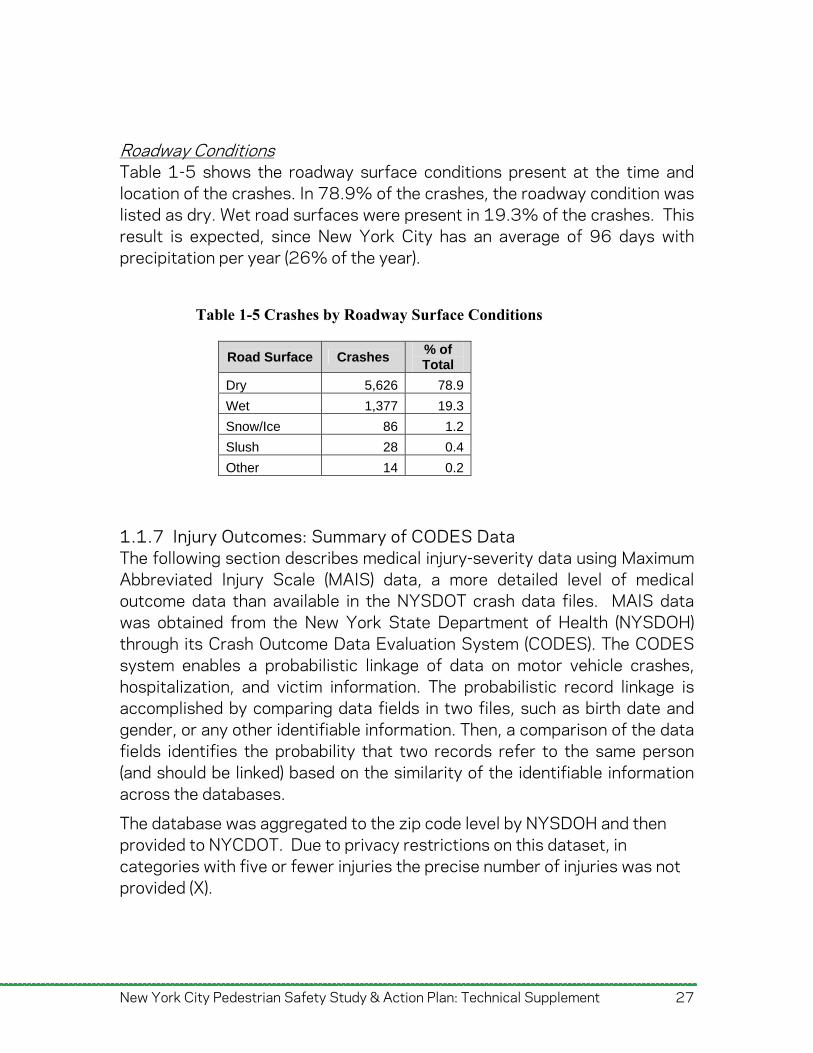
Roadway Conditions Table 1-5 shows the roadway surface conditions present at the time and location of the crashes. In 78.9% of the crashes, the roadway condition was listed as dry. Wet road surfaces were present in 19.3% of the crashes. This result is expected, since New York City has an average of 96 days with precipitation per year (26% of the year). 1.1.7 Injury Outcomes: Summary of CODES Data The following section describes medical injury-severity data using Maximum Abbreviated Injury Scale (MAIS) data, a more detailed level of medical outcome data than available in the NYSDOT crash data files. MAIS data was obtained from the New York State Department of Health (NYSDOH) through its Crash Outcome Data Evaluation System (CODES). The CODES system enables a probabilistic linkage of data on motor vehicle crashes, hospitalization, and victim information. The probabilistic record linkage is accomplished by comparing data fields in two files, such as birth date and gender, or any other identifiable information. Then, a comparison of the data fields identifies the probability that two records refer to the same person (and should be linked) based on the similarity of the identifiable information across the databases.
The database was aggregated to the zip code level by NYSDOH and then provided to NYCDOT. Due to privacy restrictions on this dataset, in categories with five or fewer injuries the precise number of injuries was not provided (X).
Road Surface Crashes % of Total
Dry 5,626 78.9
Wet 1,377 19.3
Snow/Ice 86 1.2
Slush 28 0.4
Other 14 0.2
Table 1-5 Crashes by Roadway Surface Conditions
New York City Pedestrian Safety Study & Action Plan: Technical Supplement 28
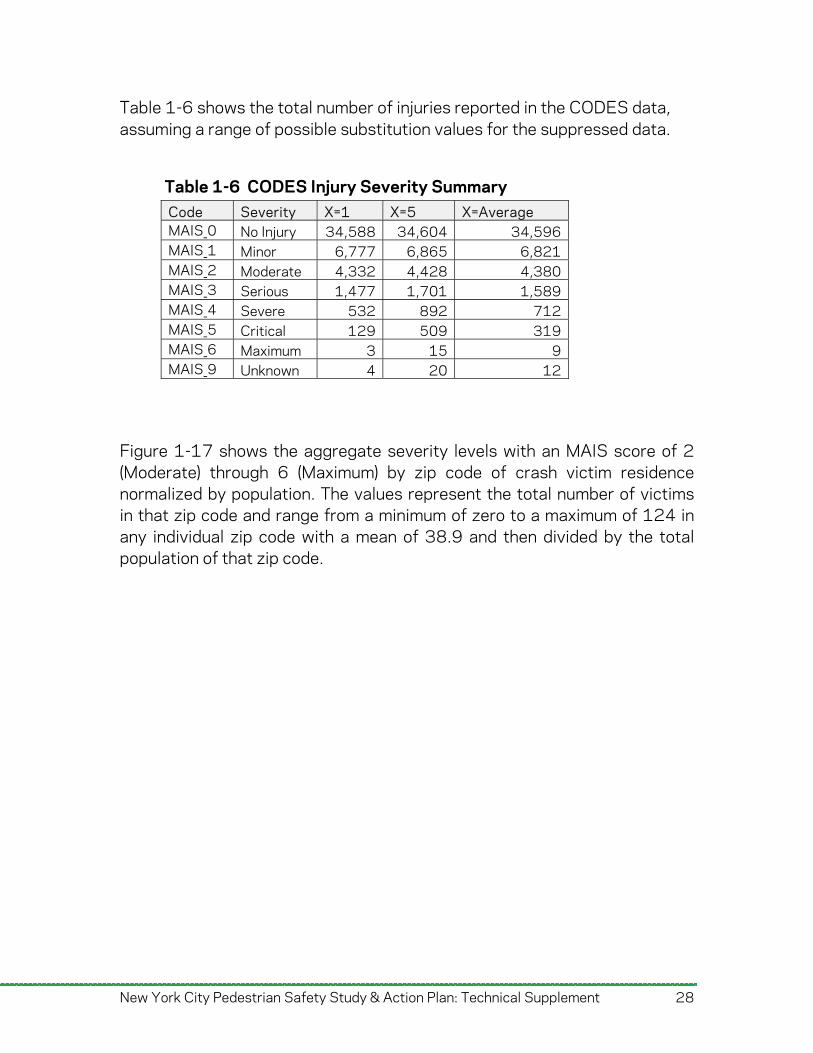
Table 1-6 shows the total number of injuries reported in the CODES data, assuming a range of possible substitution values for the suppressed data.
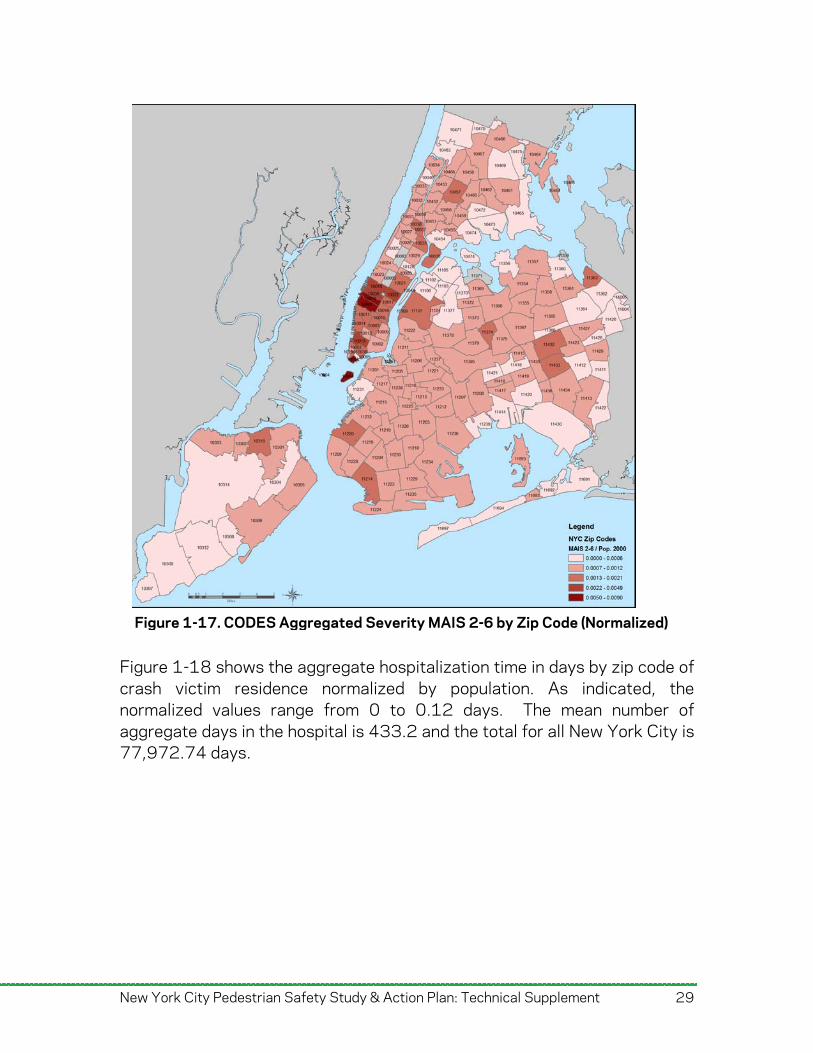
Figure 1-17 shows the aggregate severity levels with an MAIS score of 2 (Moderate) through 6 (Maximum) by zip code of crash victim residence normalized by population. The values represent the total number of victims in that zip code and range from a minimum of zero to a maximum of 124 in any individual zip code with a mean of 38.9 and then divided by the total population of that zip code.
Code Severity X=1 X=5 X=Average MAIS_0 No Injury 34,588 34,604 34,596MAIS_1 Minor 6,777 6,865 6,821MAIS_2 Moderate 4,332 4,428 4,380MAIS_3 Serious 1,477 1,701 1,589MAIS_4 Severe 532 892 712MAIS_5 Critical 129 509 319MAIS_6 Maximum 3 15 9MAIS_9 Unknown 4 20 12
Table 1-6 CODES Injury Severity Summary
New York City Pedestrian Safety Study & Action Plan: Technical Supplement 29
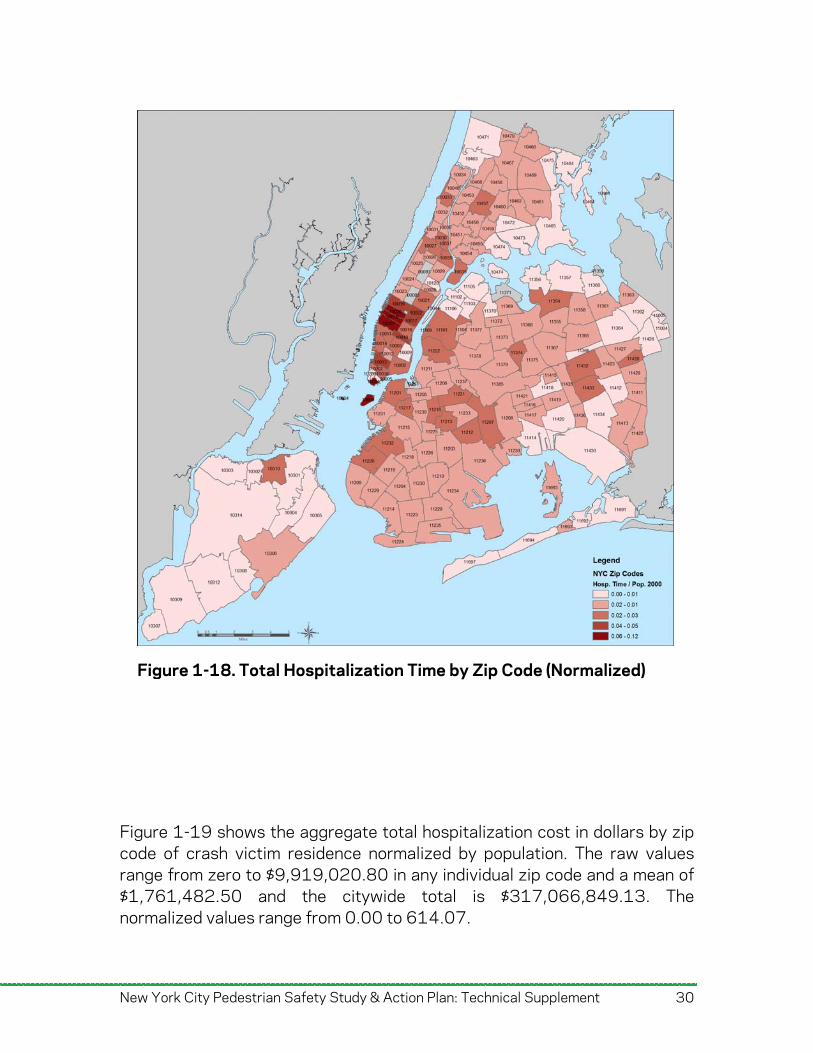
Figure 1-18 shows the aggregate hospitalization time in days by zip code of crash victim residence normalized by population. As indicated, the normalized values range from 0 to 0.12 days. The mean number of aggregate days in the hospital is 433.2 and the total for all New York City is 77,972.74 days.
Figure 1-17. CODES Aggregated Severity MAIS 2-6 by Zip Code (Normalized)
New York City Pedestrian Safety Study & Action Plan: Technical Supplement 30
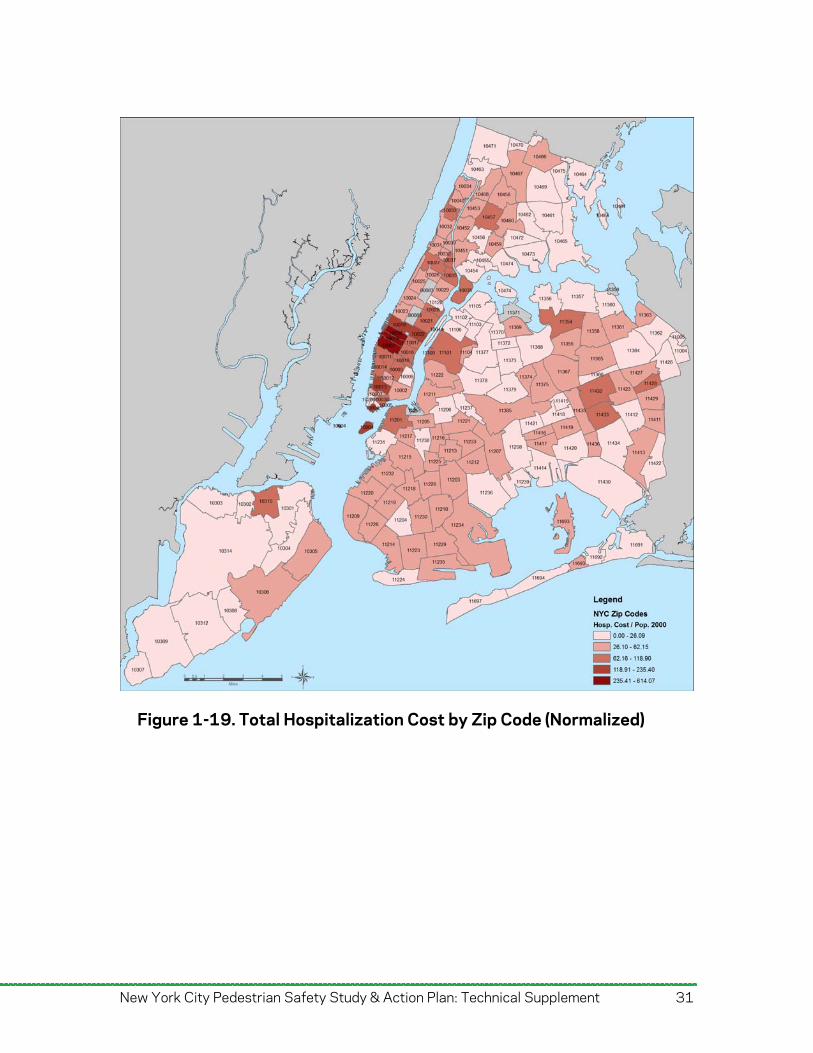
Figure 1-19 shows the aggregate total hospitalization cost in dollars by zip code of crash victim residence normalized by population. The raw values range from zero to $9,919,020.80 in any individual zip code and a mean of $1,761,482.50 and the citywide total is $317,066,849.13. The normalized values range from 0.00 to 614.07.
Figure 1-18. Total Hospitalization Time by Zip Code (Normalized)
New York City Pedestrian Safety Study & Action Plan: Technical Supplement 31
Figure 5-22 by Zip Code
Figure 1-19. Total Hospitalization Cost by Zip Code (Normalized)
New York City Pedestrian Safety Study & Action Plan: Technical Supplement 32
2. Spatial Analysis
Evaluation of Methods for Identification of High Frequency Crash Locations
Spatial analysis of the pedestrian crash distributions is central to this study. This section applies methodologies and strategies that mitigate the influence of the positional error in the source datasets. The purpose of this procedure was to determine if locations exist in which “accident clusters” or specific accident types occur and to evaluate potential techniques for identifying high-crash locations. A cluster is defined as a group of crashes that is in relatively close proximity to a single location (point) or corridor (line). By identifying these clusters, we are able to detect locations (i.e., intersections or corridors) that potentially present the greatest risk for pedestrian safety. Specific strategies are described below.
2.1. Cluster Statistics Two measures of clustering and spatial dependence were employed. They are spatial autocorrelation (Moran’s I) and Hot Spot Analysis (Getis-Ord Gi*). Spatial autocorrelation measures the degree of spatial dependence among observations in space. Spatial autocorrelation that is more positive than expected from random indicates the clustering of similar values across geo-space, while significant negative spatial autocorrelation indicates that neighboring values are more dissimilar than expected by chance. Specifically, Moran’s I compares the spatial weights to the covariance relationship at pairs of locations. Moran’s I is calculated as follows:
2)(
))((
yyw
yyyywn
I
i
n
i
n
jij
n
i
ji
n
jij
n
i
Where there are n regions and is a measure of the spatial proximity between regions i and j, and yi is the value of the variable interest at region i, yj is the value of the variable interest at region j,
ijw
y is the mean value of the variable interest in all regions.
New York City Pedestrian Safety Study & Action Plan: Technical Supplement 33
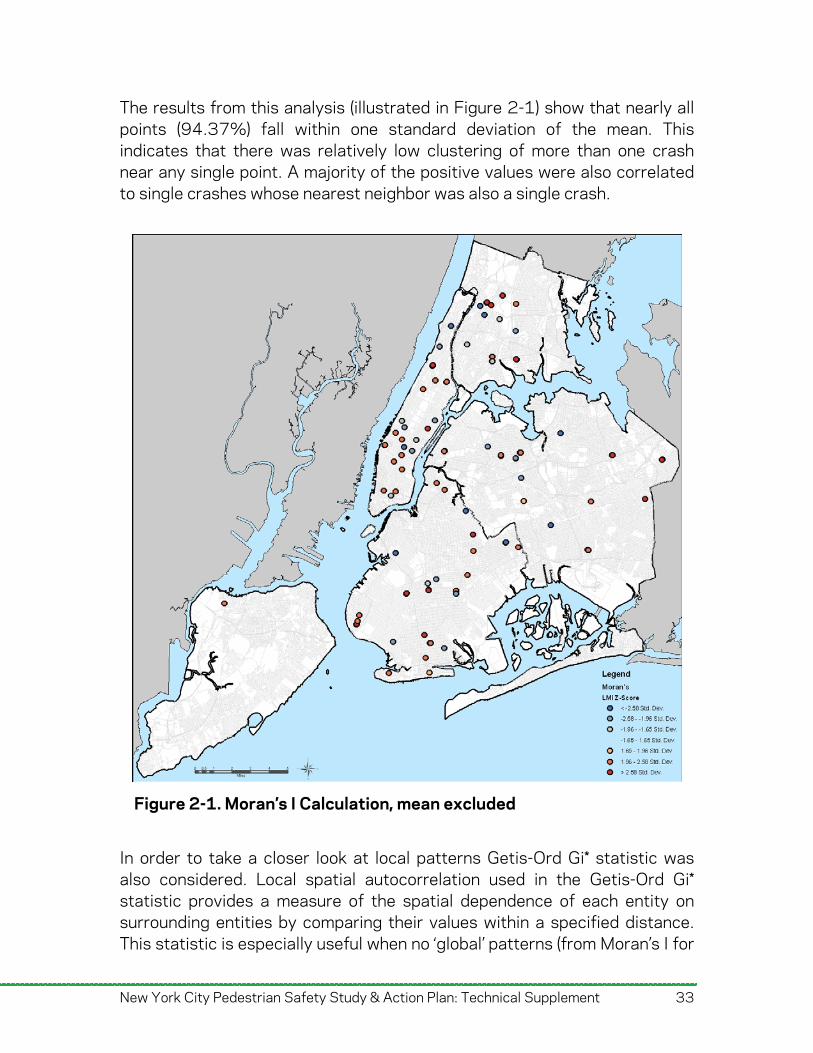
The results from this analysis (illustrated in Figure 2-1) show that nearly all points (94.37%) fall within one standard deviation of the mean. This indicates that there was relatively low clustering of more than one crash near any single point. A majority of the positive values were also correlated to single crashes whose nearest neighbor was also a single crash.
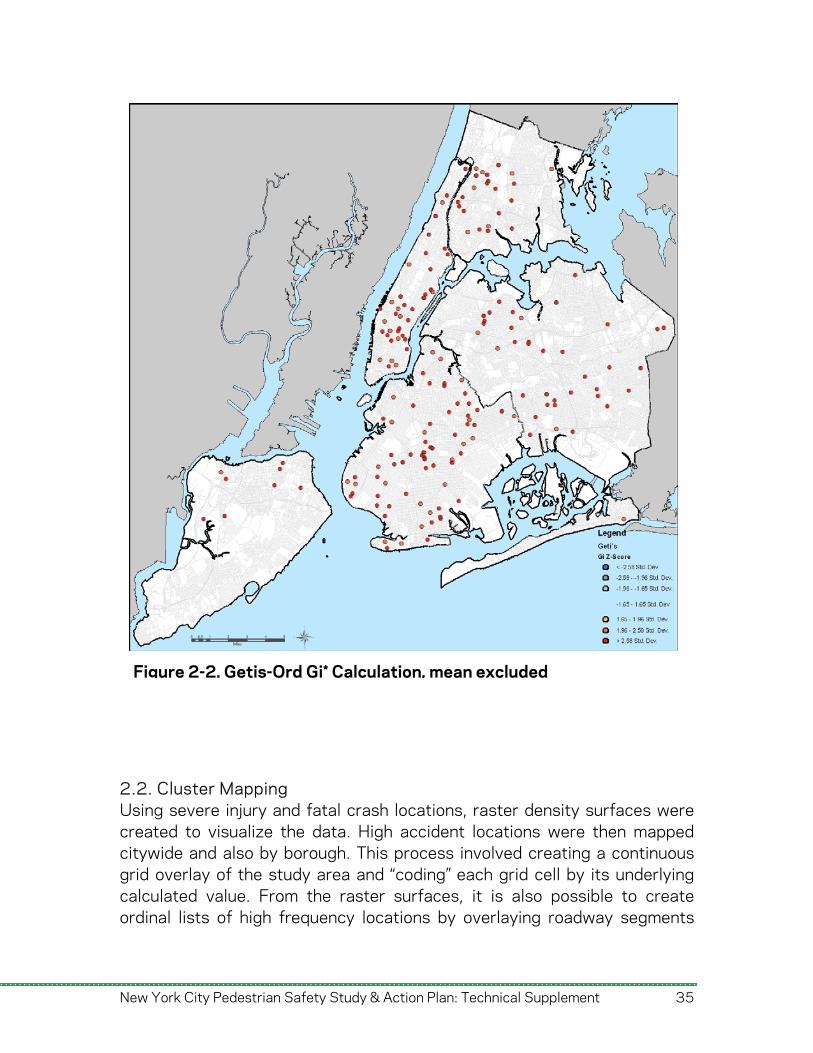
In order to take a closer look at local patterns Getis-Ord Gi* statistic was also considered. Local spatial autocorrelation used in the Getis-Ord Gi* statistic provides a measure of the spatial dependence of each entity on surrounding entities by comparing their values within a specified distance. This statistic is especially useful when no ‘global’ patterns (from Moran’s I for
Figure 2-1. Moran’s I Calculation, mean excluded
New York City Pedestrian Safety Study & Action Plan: Technical Supplement 34
our study) have been found and ‘local’ spikes in incidents may exist. Getis-Ord Gi* is calculated as follows:
2/12**1
*
*
)}1/(]{[
)(
nWnSs
xWxdw
Gii
ijj
ij
i
where x is the variable of interest, x is the mean value of the variable interest in all regions, is the sample standard deviation of the x values, and (d) is equal to one if region j is within a distance of d from region i, and zero otherwise, is the number of regions with weight of zero. The sum is over all regions, including I, and where is the standard deviation of the regions with a weight of zero.
The results from the Getis-Ord Gi* calculation (illustrated in Figure 5-24) indicate that 84.94% of all crashes fall within one standard deviation of the mean. Of the values that fell outside of one standard deviation, all had positive values which are strongly linked to the high number of crashes with a single injury or fatality.
sijw
S
W
New York City Pedestrian Safety Study & Action Plan: Technical Supplement 35
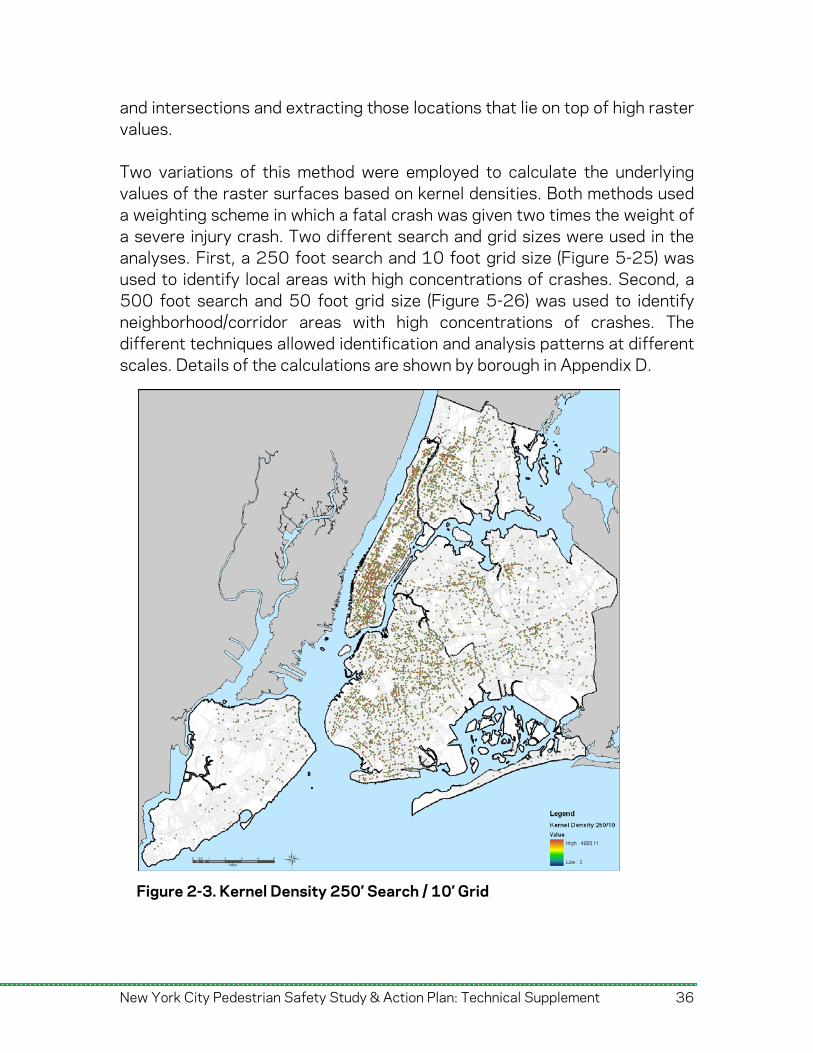
2.2. Cluster Mapping Using severe injury and fatal crash locations, raster density surfaces were created to visualize the data. High accident locations were then mapped citywide and also by borough. This process involved creating a continuous grid overlay of the study area and “coding” each grid cell by its underlying calculated value. From the raster surfaces, it is also possible to create ordinal lists of high frequency locations by overlaying roadway segments
Figure 2-2. Getis-Ord Gi* Calculation, mean excluded
New York City Pedestrian Safety Study & Action Plan: Technical Supplement 36
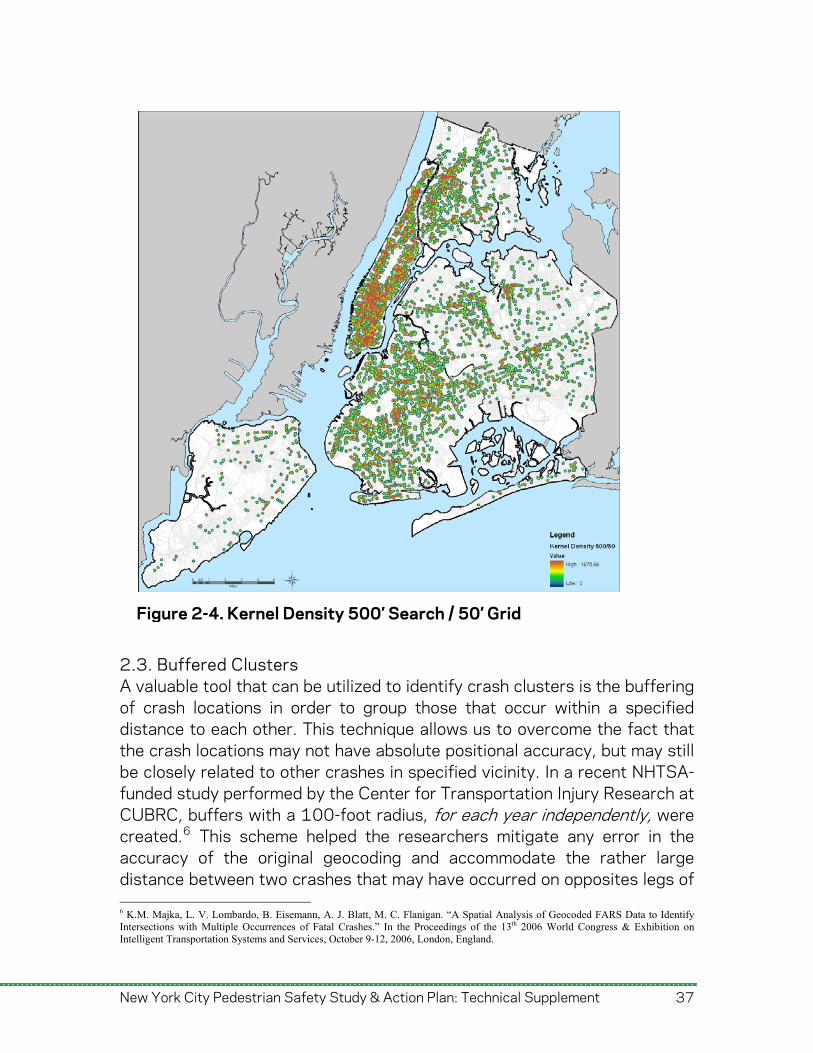
and intersections and extracting those locations that lie on top of high raster values. Two variations of this method were employed to calculate the underlying values of the raster surfaces based on kernel densities. Both methods used a weighting scheme in which a fatal crash was given two times the weight of a severe injury crash. Two different search and grid sizes were used in the analyses. First, a 250 foot search and 10 foot grid size (Figure 5-25) was used to identify local areas with high concentrations of crashes. Second, a 500 foot search and 50 foot grid size (Figure 5-26) was used to identify neighborhood/corridor areas with high concentrations of crashes. The different techniques allowed identification and analysis patterns at different scales. Details of the calculations are shown by borough in Appendix D.
Figure 2-3. Kernel Density 250’ Search / 10’ Grid
New York City Pedestrian Safety Study & Action Plan: Technical Supplement 37
2.3. Buffered Clusters A valuable tool that can be utilized to identify crash clusters is the buffering of crash locations in order to group those that occur within a specified distance to each other. This technique allows us to overcome the fact that the crash locations may not have absolute positional accuracy, but may still be closely related to other crashes in specified vicinity. In a recent NHTSA-funded study performed by the Center for Transportation Injury Research at CUBRC, buffers with a 100-foot radius, for each year independently, were created.6 This scheme helped the researchers mitigate any error in the accuracy of the original geocoding and accommodate the rather large distance between two crashes that may have occurred on opposites legs of 6 K.M. Majka, L. V. Lombardo, B. Eisemann, A. J. Blatt, M. C. Flanigan. “A Spatial Analysis of Geocoded FARS Data to Identify Intersections with Multiple Occurrences of Fatal Crashes.” In the Proceedings of the 13th 2006 World Congress & Exhibition on Intelligent Transportation Systems and Services, October 9-12, 2006, London, England.
Figure 2-4. Kernel Density 500’ Search / 50’ Grid
an intersection. For this study however, we found that using 100-foot radius buffers was too large for the relatively small blocks (meaning intersections are close to each other) in New York City, especially in the borough of Manhattan. We therefore utilized buffers of 50-foot radius (100-foot diameter) to identify clusters. After the buffers are created, the interior boundaries between overlapping buffers were dissolved so that crashes occurring within 100 feet of each other are grouped together in both concentrated areas and also along corridors. The crash locations were then “spatially joined” within the GIS system to the dissolved buffers. This allowed the attributes of the datasets that are associated with each crash to be associated with the dissolved buffers. It also enabled us to obtain the number of crashes within each dissolved buffer and the intersection or corridor most associated with each buffered location. The results of this analysis are presented below. The buffered cluster analysis found that using a 50-foot radius buffer as a surrogate for locating the ‘same’ location resulted in the following clusters of severe and fatal crashes:
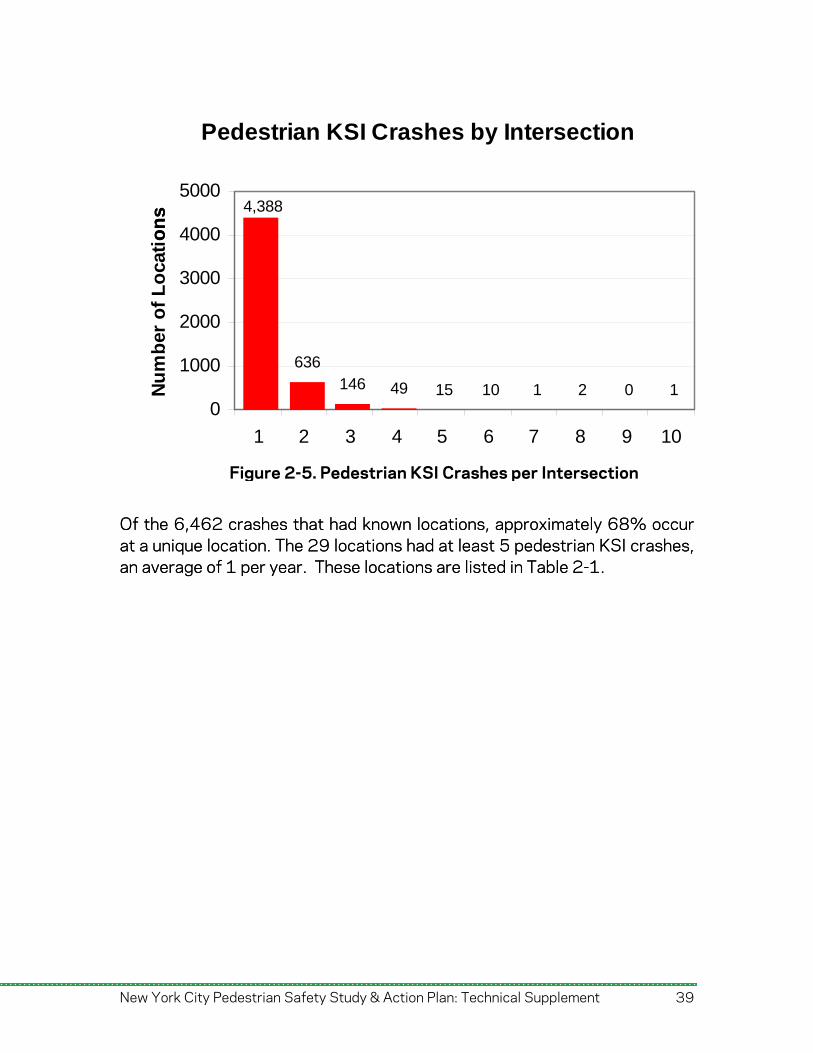
10 crashes – 1 cluster 9 crashes – 0 clusters 8 crashes – 2 clusters 7 crashes – 1 cluster 6 crashes – 10 clusters 5 crashes – 15 clusters 4 crashes – 49 clusters 3 crashes – 146 clusters 2 crashes – 636 clusters 1 crash – 4388 clusters Unknown (non-geocoded) locations – 892 crashes
New York City Pedestrian Safety Study & Action Plan: Technical Supplement 38
New York City Pedestrian Safety Study & Action Plan: Technical Supplement 39
Pedestrian KSI Crashes by Intersection
636146 49 15 10 1 2 0 1
4,388
0
1000
2000
3000
4000
5000
1 2 3 4 5 6 7 8 9 10
Pedestrian KSI Crashes per Intersection
Nu
mb
er o
f L
oca
tio
ns
on
s
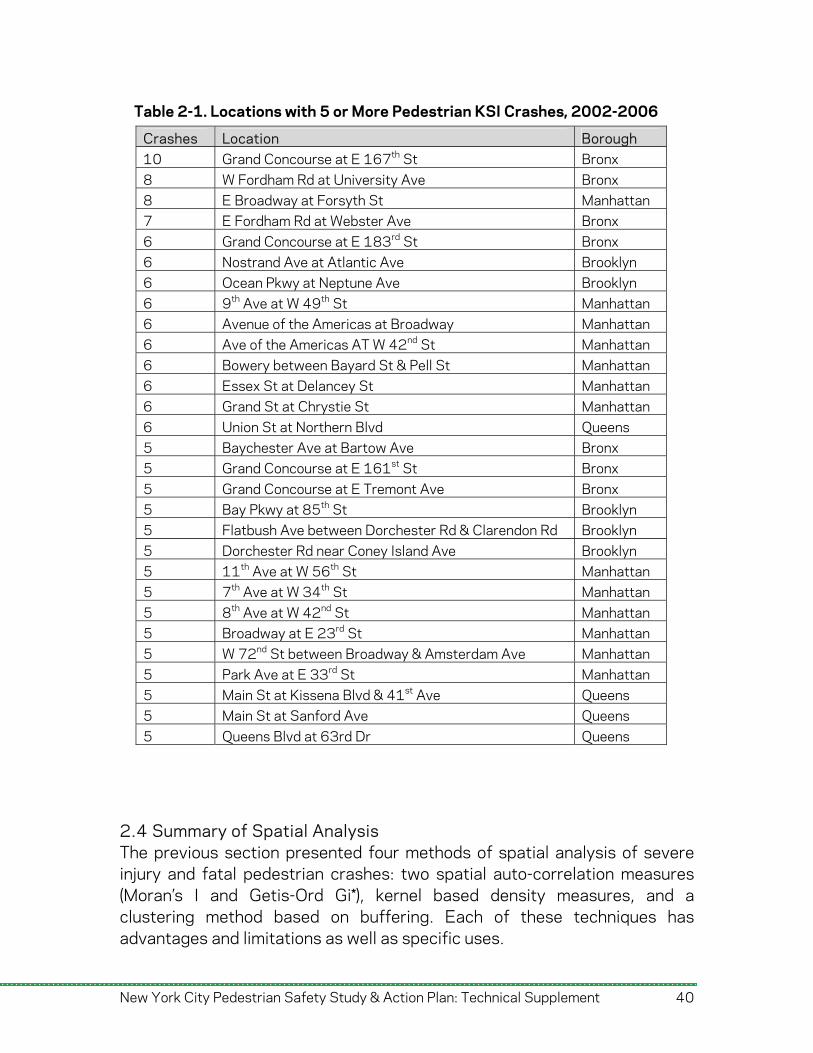
Of the 6,462 crashes that had known locations, approximately 68% occur at a unique location. The 29 locations had at least 5 pedestrian KSI crashes, an average of 1 per year. These locations are listed in Table 2-1.
Of the 6,462 crashes that had known locations, approximately 68% occur at a unique location. The 29 locations had at least 5 pedestrian KSI crashes, an average of 1 per year. These locations are listed in Table 2-1.
Figure 2-5. Pedestrian KSI Crashes per Intersecti on
New York City Pedestrian Safety Study & Action Plan: Technical Supplement 40
2.4 Summary of Spatial Analysis The previous section presented four methods of spatial analysis of severe injury and fatal pedestrian crashes: two spatial auto-correlation measures (Moran’s I and Getis-Ord Gi*), kernel based density measures, and a clustering method based on buffering. Each of these techniques has advantages and limitations as well as specific uses.
Crashes Location Borough 10 Grand Concourse at E 167th St Bronx 8 W Fordham Rd at University Ave Bronx 8 E Broadway at Forsyth St Manhattan 7 E Fordham Rd at Webster Ave Bronx 6 Grand Concourse at E 183rd St Bronx 6 Nostrand Ave at Atlantic Ave Brooklyn 6 Ocean Pkwy at Neptune Ave Brooklyn 6 9th Ave at W 49th St Manhattan 6 Avenue of the Americas at Broadway Manhattan 6 Ave of the Americas AT W 42nd St Manhattan 6 Bowery between Bayard St & Pell St Manhattan 6 Essex St at Delancey St Manhattan 6 Grand St at Chrystie St Manhattan 6 Union St at Northern Blvd Queens 5 Baychester Ave at Bartow Ave Bronx 5 Grand Concourse at E 161st St Bronx 5 Grand Concourse at E Tremont Ave Bronx 5 Bay Pkwy at 85th St Brooklyn 5 Flatbush Ave between Dorchester Rd & Clarendon Rd Brooklyn 5 Dorchester Rd near Coney Island Ave Brooklyn 5 11th Ave at W 56th St Manhattan 5 7th Ave at W 34th St Manhattan 5 8th Ave at W 42nd St Manhattan 5 Broadway at E 23rd St Manhattan 5 W 72nd St between Broadway & Amsterdam Ave Manhattan 5 Park Ave at E 33rd St Manhattan 5 Main St at Kissena Blvd & 41st Ave Queens 5 Main St at Sanford Ave Queens 5 Queens Blvd at 63rd Dr Queens
Table 2-1. Locations with 5 or More Pedestrian KSI Crashes, 2002-2006
New York City Pedestrian Safety Study & Action Plan: Technical Supplement 41
Two methods of spatial auto-correlation, Moran’s I and Getis-Ord Gi* were analyzed for effectiveness in finding areas of high concentrations of crashes and numbers of injuries and or fatalities. It is important to analyze both types of spatial auto-correlation in order to find both small and large scale patterns. For example, a distribution of crash events may seem random when analyzed using Moran’s I at the global level (all New York City pedestrian crashes) but may in fact have a distinct pattern when a smaller area is analyzed (one borough) using Getis-Ord Gi*. Neither of these techniques, however, effectively identified areas of high concentrations of crashes, injuries, or fatalities. Their effectiveness was in large part impacting by the high number of crashes that occur at ‘unique’ locations (i.e. only 1 crash). Using a larger dataset of crashes (all crashes) might be one solution in utilizing these techniques more efficiently. Both kernel density methods presented here, of 250-foot search, 10-foot grid size and 500-foot search, 50-foot grid size, provide an interesting visualization and an effective way of estimating crash values at any particular location. The regular grid pattern of many of New York City’s streets, however, limits the effectiveness to which the results can be displayed. As evident in the 250-foot search, 10-foot grid size map (Figure 2-3) using a relatively small search and grid size practically presents the results at near individual crash levels. Trying to utilize a larger search size of 500-feet and a grid size of 50-feet to overcome the somewhat regular distances between streets and intersections however, creates a large surface of continuous values that cannot be used to identify locations or corridors for analysis (Figure 2-4). This technique is therefore best suited for analyzing neighborhood level areas. A buffered clustering method, developed by the Center for Transportation Injury Research at CUBRC for a NHTSA funded study7 on intersection analysis, was adapted for the unique environment of New York City. The buffered clustering method was effective in discerning locations that had a high number of crashes, severe injuries, and fatalities and also grouping nearby locations. Although a 100-foot diameter buffer was selected for this particular study, the technique can be easily tailored to meet the needs of the desired analysis. Increasing buffer sizes will result in larger 7 K.M. Majka, L. V. Lombardo, B. Eisemann, A. J. Blatt, M. C. Flanigan. “A Spatial Analysis of Geocoded FARS Data to Identify Intersections with Multiple Occurrences of Fatal Crashes.” In the Proceedings of the 13th 2006 World Congress & Exhibition on Intelligent Transportation Systems and Services, October 9-12, 2006, London, England.
New York City Pedestrian Safety Study & Action Plan: Technical Supplement 42
agglomeration of points and can more easily help identify corridors. Conversely, decreasing the buffer size limits the grouping to very similar locations. The buffered clustering method identified 29 locations that had 5 or more crashes that involved fatal or severe injury pedestrian crashes. It is our recommendation that the New York City Department of Transportation utilize this technique along with additional information, such as locations of roadway improvements or changes, to determine and prioritize areas needing additional study. It is also important to note that this technique could easily be expanded beyond the scope of serious injury and fatality pedestrian crashes to include all crashes or any other specific targeted crash category of interest. It would therefore be a valuable tool to calculate NYC’s highest crash locations of any type or total.
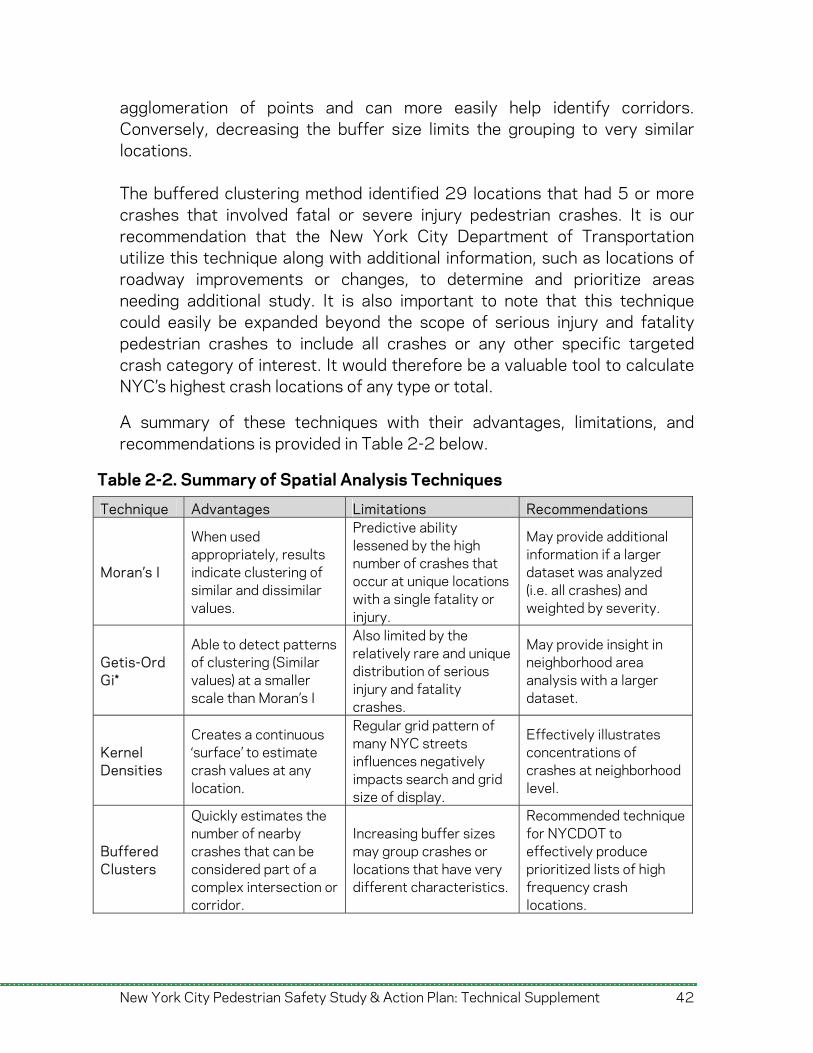
A summary of these techniques with their advantages, limitations, and recommendations is provided in Table 2-2 below.
Technique Advantages Limitations Recommendations
Moran’s I
When used appropriately, results indicate clustering of similar and dissimilar values.
Predictive ability lessened by the high number of crashes that occur at unique locations with a single fatality or injury.
May provide additional information if a larger dataset was analyzed (i.e. all crashes) and weighted by severity.
Getis-Ord Gi*
Able to detect patterns of clustering (Similar values) at a smaller scale than Moran’s I
Also limited by the relatively rare and unique distribution of serious injury and fatality crashes.
May provide insight in neighborhood area analysis with a larger dataset.
Kernel Densities
Creates a continuous ‘surface’ to estimate crash values at any location.
Regular grid pattern of many NYC streets influences negatively impacts search and grid size of display.
Effectively illustrates concentrations of crashes at neighborhood level.
Buffered Clusters
Quickly estimates the number of nearby crashes that can be considered part of a complex intersection or corridor.
Increasing buffer sizes may group crashes or locations that have very different characteristics.
Recommended technique for NYCDOT to effectively produce prioritized lists of high frequency crash locations.
Table 2-2. Summary of Spatial Analysis Techniques
3. Crash Cause/Frequency and Severity Modeling This section describes the results of two models of pedestrian KSI (Killed or Severely Injured) crashes in New York City. The first, crash frequency modeling, uses causal factors to explain the frequency of pedestrian severe injuries and fatalities in geographic areas, and the second, crash severity modeling, examined the effects of these factors in determining whether a crash result was severe or fatal. Crash frequency modeling entailed the examination of pedestrian crash frequency by performing statistical regression analysis of the input data (crash data, roadway and land use characteristics, traffic controls, motor vehicle operator characteristics, etc.) with the aim of identifying factors associated with crash frequency. The analysis was conducted at two different spatial levels of aggregation: zip code and census tract. This allowed the researchers to study the effects of specific roadway and intersection types (more influential at the census tract level) while accounting for neighborhood characteristics (which may be more relevant at the zip code level). At the zip code level, models were developed for pedestrian fatality crashes and pedestrian severe injury crashes. This distinction allowed more robust and accurate models that capture the factors that might differently affect the frequency of these two categories of pedestrian crashes. However, since the number of crashes was few at the census tract level with resulting higher dispersion the researchers developed a single model for all pedestrian KSI crashes at the census tract level, rather than modeling severe injuries and fatalities separately, to ensure a proper model fit. Crash severity models seek to explain why some pedestrian crashes resulted in a severe injury, while others resulted in fatal injuries. A Binary Logit Model was used to determine the severity levels for Pedestrian KSI crashes in New York City and to evaluate the associations between pedestrian injury risk and possible contributing factors. While crash cause/frequency models described in Appendix B were built at the aggregated zip code or census tract geographic level, the severity model analyzes individual crash records to identify the specific characteristics that determined the severity level of a crash.
New York City Pedestrian Safety Study & Action Plan: Technical Supplement 43
New York City Pedestrian Safety Study & Action Plan: Technical Supplement 44
Pedestrian KSI crashes in the NYSDOT database were classified into two categories based on the severity of injury: fatal crashes and severe-injury crashes. The model results identified factors that contribute to the level of severity of pedestrian crashes. These results have implications for engineering, enforcement, and education countermeasures for reducing the severity of pedestrian crashes. 3.1. Frequency Analysis Pedestrian crashes result from the interaction of several factors, including the characteristics of drivers, motor vehicles, and pedestrians, as well as roadway design, weather, and other environmental conditions. Crash frequency models are estimated to determine the factors that affect the frequency of crashes. Different crash frequency models such as standard Negative Binomial (NB), Zero-Inflated NB (ZINB), and NB with heterogeneity (NB+) in dispersion parameter models are estimated here. The latter two account for variability introduced by zero values and variability in dispersion parameter as a function of covariates. The dispersion parameter captures the difference between the mean and the variance. These models (NB, ZINB, and NB+) are used when the data is over-dispersed; that is when the estimated variance is greater than the estimated mean.
The number of pedestrian crashes is expected to increase as pedestrian risk exposure increases. Pedestrian risk exposure is usually defined as a function of population, vehicle and pedestrian volumes or the number of walking trips8 In this study, we utilize population, vehicle registrations, the presence of signalized intersections, and transit usage to control for pedestrian exposure. A review of the modeling approach adopted for crash cause modeling in New York City is presented below. This process was created to follow a comprehensive and parsimonious modeling process that avoids the introduction of bias encountered in more subjective methodologies. Given that, it provides a thorough preliminary analysis of the independent variables to capture their independent effect and correlation. First, we present some preliminary analysis using descriptive statistics, cross tabulation and
8 B.L.Bowman, R.L. Vecellio, J. Miao,”Vehicle and pedestrian models for median locations,” Journal of Transportation Engineering. 121(6) (1994): 531-537; C. Lee and M. Abdel-Aty, “Comprehensive analysis of vehicle–pedestrian crashes at intersections in Florida”, Analysis and Prevention 37 (2006): 775-786; A. Loukaitou-Sideris et al., “Death on the Crosswalk: A Study of Pedestrian-Automobile Collisions in Los Angeles.” Journal of Planning Education and Research 26 (3) (2007): 338-351; S. S. Pulugurtha et al, op. cit.
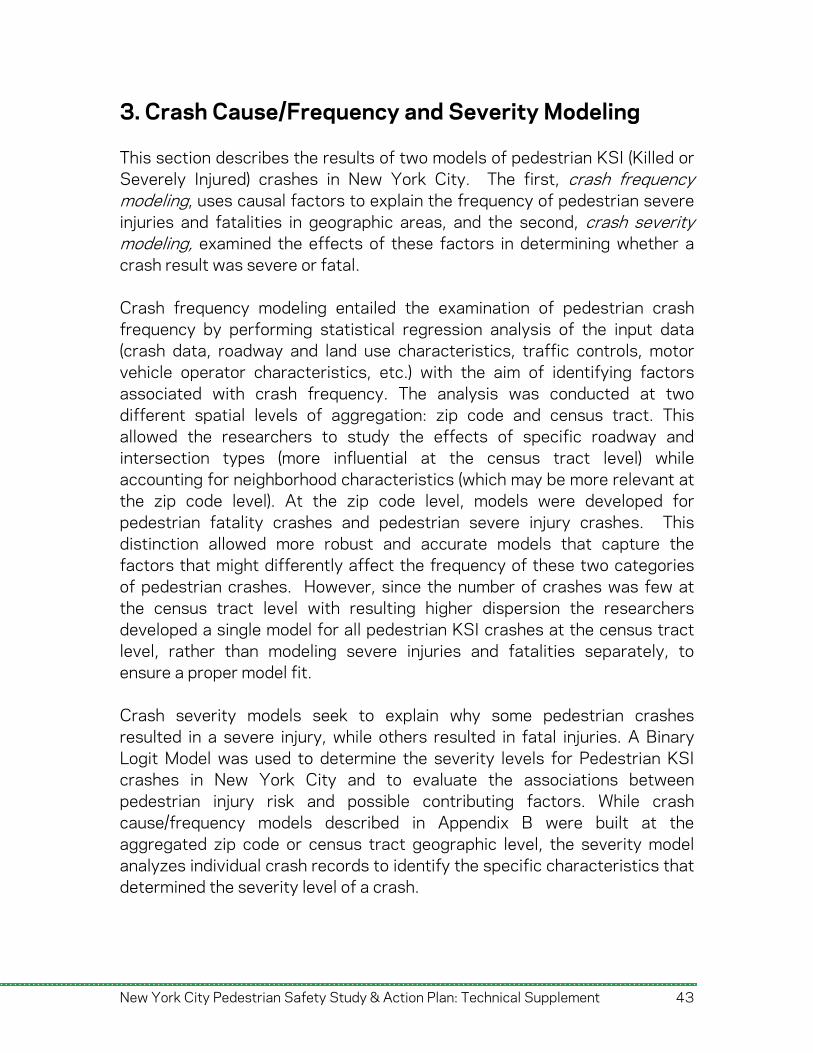
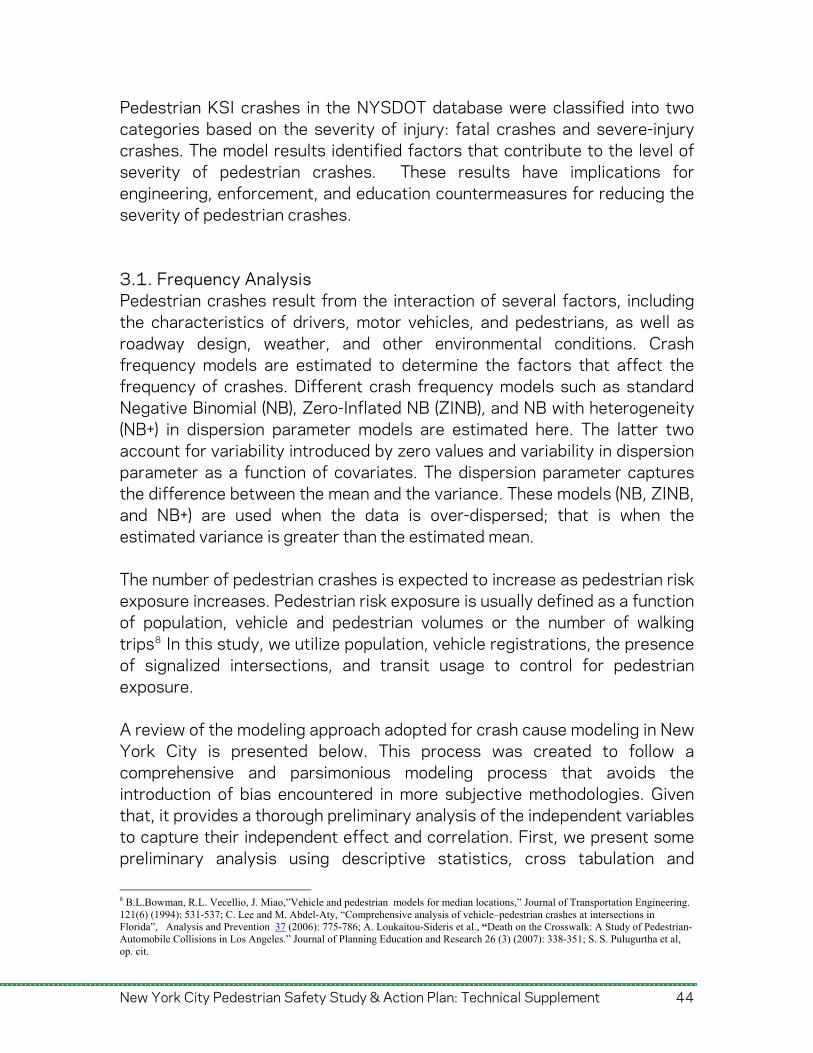
correlation analysis to group variables in subsets. All variables in a subset are such that they each represent a unique characteristic and do not have a high correlation index. Next, each of these subsets is used to run the three different modeling techniques (NB, NB+, and ZINB). The model building process progresses from all the variables in a subset to a few significant variables, with variables eliminated using likelihood ratio tests. Then, we compare these models to select the group of best fit models for both the zip code level (fatal and severe crashes) and census tract level (total crashes) aggregations. Finally, a set of ‘best’ models are presented, with their corresponding statistical parameters, followed by analysis interpretation of the results and implications. 3.1.1. Preliminary Analysis In order to best understand the data, preliminary analysis was performed using descriptive statistics, cross tabulations, and correlation analysis at both zip code and census tract levels for the dependent variables, and for selected important independent variables. Descriptive statistics on independent variables are provided in Appendix B. Figures 3-1 through 3-4 plot the count of fatal and severe crash frequencies that are dependent variables for frequency models. In both cases, several zero values were detected, particularly at the census tract level. This led us to consider Zero Inflated models to account for the possible existence of a two state (zero and non-zero) process, which, as noted earlier, accounts for overdispersion of models as a result of too many zero values at the given unit of analysis.
New York City Pedestrian Safety Study & Action Plan: Technical Supplement 45
Figure 3-1. Histogram of Fatal Crash Count at the Census Tract Level
Figure 3-2. Histogram of Severe Crash Count at the Census Tract Level
New York City Pedestrian Safety Study & Action Plan: Technical Supplement 46
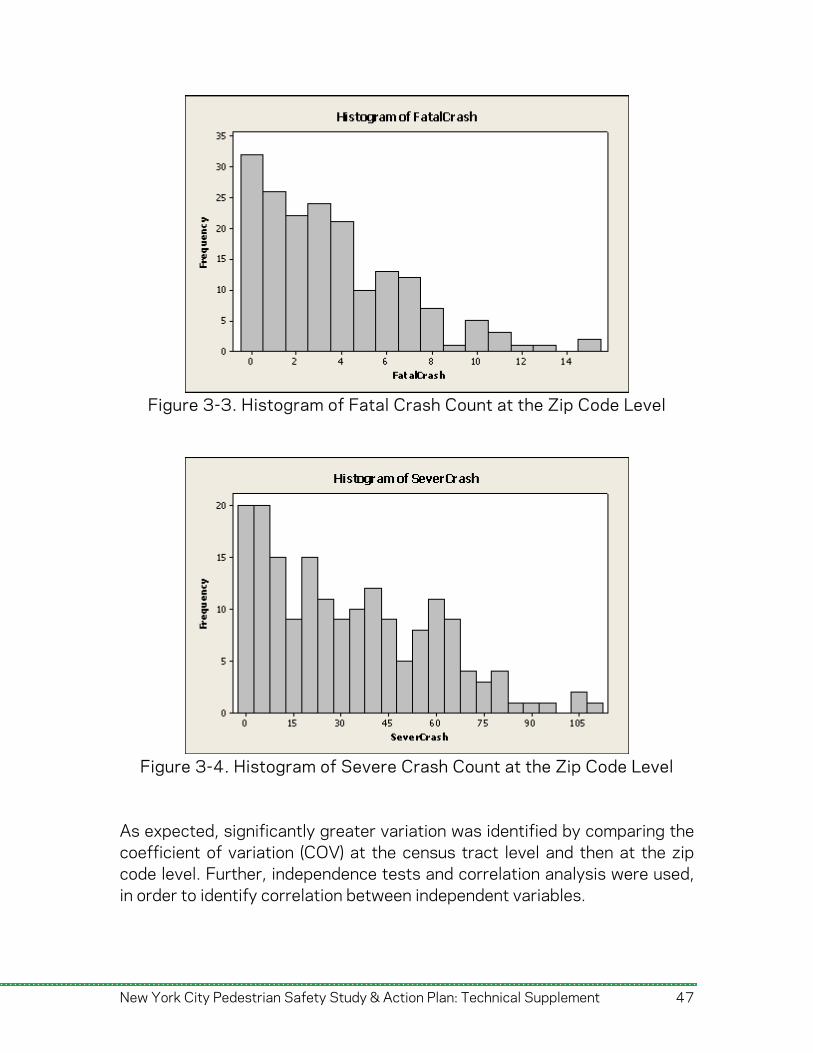
Figure 3-3. Histogram of Fatal Crash Count at the Zip Code Level
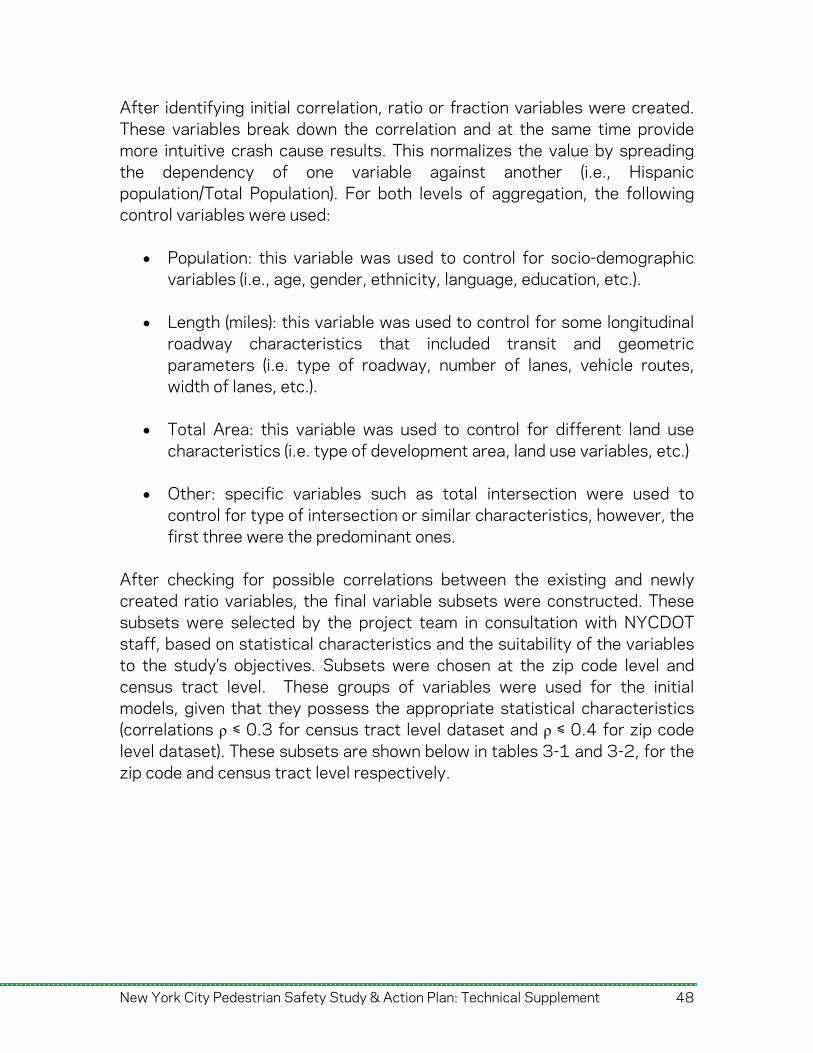
Figure 3-4. Histogram of Severe Crash Count at the Zip Code Level
As expected, significantly greater variation was identified by comparing the coefficient of variation (COV) at the census tract level and then at the zip code level. Further, independence tests and correlation analysis were used, in order to identify correlation between independent variables.
New York City Pedestrian Safety Study & Action Plan: Technical Supplement 47
After identifying initial correlation, ratio or fraction variables were created. These variables break down the correlation and at the same time provide more intuitive crash cause results. This normalizes the value by spreading the dependency of one variable against another (i.e., Hispanic population/Total Population). For both levels of aggregation, the following control variables were used:
Population: this variable was used to control for socio-demographic variables (i.e., age, gender, ethnicity, language, education, etc.).
Length (miles): this variable was used to control for some longitudinal roadway characteristics that included transit and geometric parameters (i.e. type of roadway, number of lanes, vehicle routes, width of lanes, etc.).
Total Area: this variable was used to control for different land use characteristics (i.e. type of development area, land use variables, etc.)
Other: specific variables such as total intersection were used to control for type of intersection or similar characteristics, however, the first three were the predominant ones.
After checking for possible correlations between the existing and newly created ratio variables, the final variable subsets were constructed. These subsets were selected by the project team in consultation with NYCDOT staff, based on statistical characteristics and the suitability of the variables to the study’s objectives. Subsets were chosen at the zip code level and census tract level. These groups of variables were used for the initial models, given that they possess the appropriate statistical characteristics (correlations ρ ≤ 0.3 for census tract level dataset and ρ ≤ 0.4 for zip code level dataset). These subsets are shown below in tables 3-1 and 3-2, for the zip code and census tract level respectively.
New York City Pedestrian Safety Study & Action Plan: Technical Supplement 48
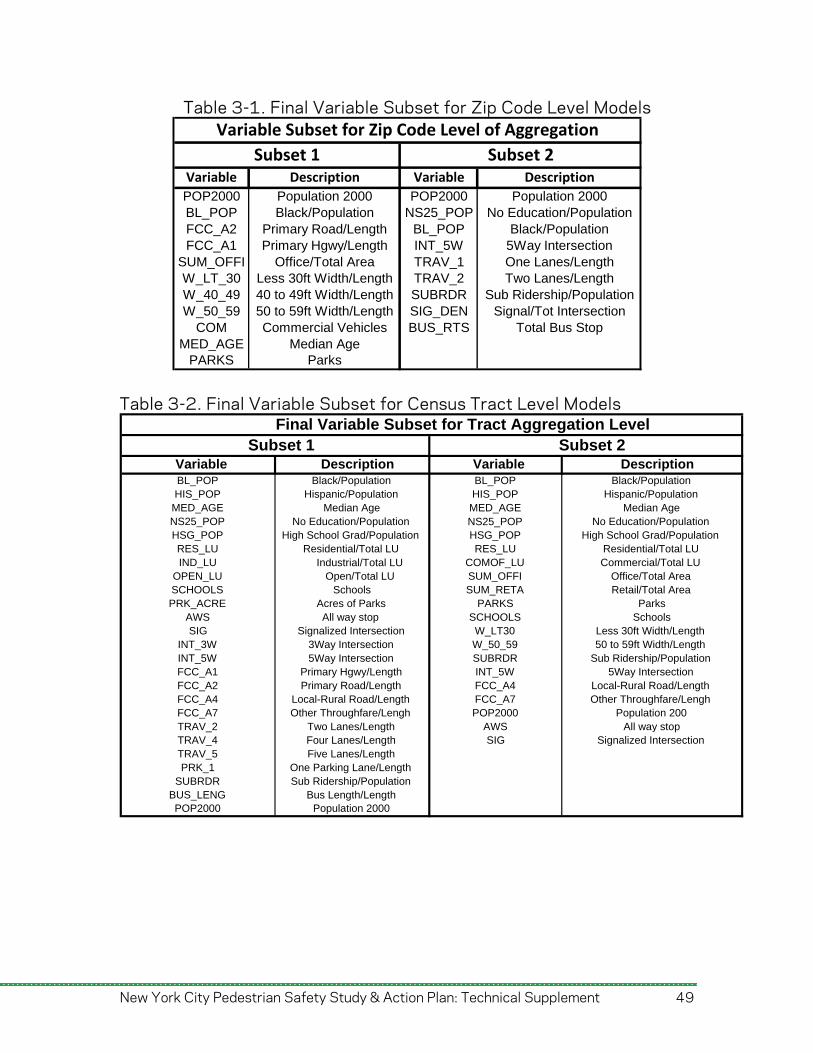
Table 3-1. Final Variable Subset for Zip Code Level Models
Variable Description Variable Description
POP2000 Population 2000 POP2000 Population 2000BL_POP Black/Population NS25_POP No Education/PopulationFCC_A2 Primary Road/Length BL_POP Black/PopulationFCC_A1 Primary Hgwy/Length INT_5W 5Way Intersection
SUM_OFFI Office/Total Area TRAV_1 One Lanes/LengthW_LT_30 Less 30ft Width/Length TRAV_2 Two Lanes/LengthW_40_49 40 to 49ft Width/Length SUBRDR Sub Ridership/PopulationW_50_59 50 to 59ft Width/Length SIG_DEN Signal/Tot Intersection
COM Commercial Vehicles BUS_RTS Total Bus StopMED_AGE Median Age
PARKS Parks
Subset 1 Subset 2
Variable Subset for Zip Code Level of Aggregation
Table 3-2. Final Variable Subset for Census Tract Level Models
Variable Description Variable DescriptionBL_POP Black/Population BL_POP Black/PopulationHIS_POP Hispanic/Population HIS_POP Hispanic/Population
MED_AGE Median Age MED_AGE Median AgeNS25_POP No Education/Population No Education/PopulationNS25_POPHSG_POP High School Grad/Population HSG_POP High School Grad/PopulationRES_LU Residential/Total LU RES_LU Residential/Total LUIND_LU COMOF_LU Commercial/Total LUIndustrial/Total LU
OPEN_LU Open/Total LU SUM_OFFI Office/Total AreaSCHOOLS Schools SUM_RETA Retail/Total AreaPRK_ACRE Acres of Parks PARKS Parks
AWS All way stop SCHOOLS SchoolsSIG Signalized Intersection W_LT30 Less 30ft Width/Length
INT_3W 3Way Intersection W_50_59 50 to 59ft Width/LengthINT_5W 5Way Intersection SUBRDR Sub Ridership/PopulationFCC_A1 Primary Hgwy/Length INT_5W 5Way IntersectionFCC_A2 Primary Road/Length FCC_A4 Local-Rural Road/LengthFCC_A4 Local-Rural Road/Length FCC_A7 Other Throughfare/LenghFCC_A7 Other Throughfare/Lengh POP2000 Population 200TRAV_2 Two Lanes/Length AWS All way stopTRAV_4 Four Lanes/Length SIG Signalized IntersectionTRAV_5 Five Lanes/LengthPRK_1 One Parking Lane/Length
SUBRDR Sub Ridership/PopulationBUS_LENG Bus Length/LengthPOP2000 Population 2000
Subset 1 Subset 2
Final Variable Subset for Tract Aggregation Level
New York City Pedestrian Safety Study & Action Plan: Technical Supplement 49
New York City Pedestrian Safety Study & Action Plan: Technical Supplement 50
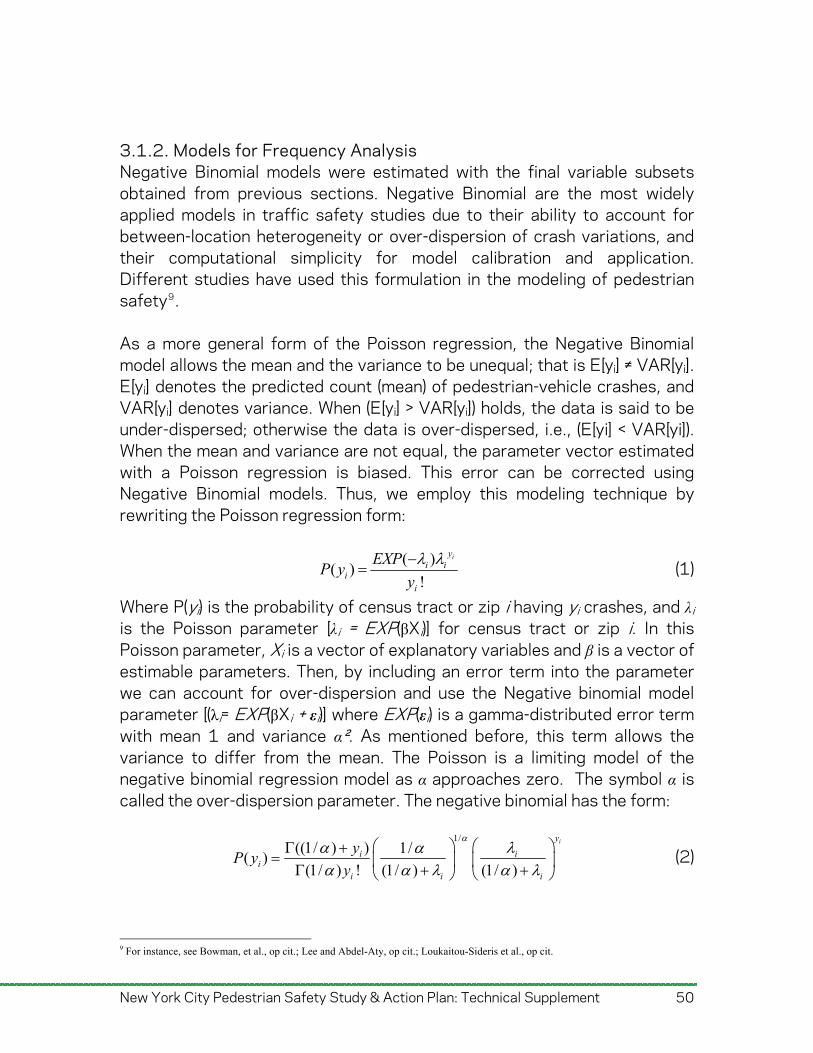
3.1.2. Models for Frequency Analysis Negative Binomial models were estimated with the final variable subsets obtained from previous sections. Negative Binomial are the most widely applied models in traffic safety studies due to their ability to account for between-location heterogeneity or over-dispersion of crash variations, and their computational simplicity for model calibration and application. Different studies have used this formulation in the modeling of pedestrian safety9.
As a more general form of the Poisson regression, the Negative Binomial model allows the mean and the variance to be unequal; that is E[yi] ≠ VAR[yi]. E[yi] denotes the predicted count (mean) of pedestrian-vehicle crashes, and VAR[yi] denotes variance. When (E[yi] > VAR[yi]) holds, the data is said to be under-dispersed; otherwise the data is over-dispersed, i.e., (E[yi] < VAR[yi]). When the mean and variance are not equal, the parameter vector estimated with a Poisson regression is biased. This error can be corrected using Negative Binomial models. Thus, we employ this modeling technique by rewriting the Poisson regression form:
( )
( )!
iyi i
ii
EXPP y
y
(1)
Where P(yi) is the probability of census tract or zip i having yi crashes, and λi is the Poisson parameter [λi = EXP(βXi)] for census tract or zip i. In this Poisson parameter, Xi is a vector of explanatory variables and β is a vector of estimable parameters. Then, by including an error term into the parameter we can account for over-dispersion and use the Negative binomial model parameter [(λi= EXP(βXi + εi)] where EXP(εi) is a gamma-distributed error term with mean 1 and variance α². As mentioned before, this term allows the variance to differ from the mean. The Poisson is a limiting model of the negative binomial regression model as α approaches zero. The symbol α is called the over-dispersion parameter. The negative binomial has the form:
1/((1/ ) ) 1/
( )(1/ ) ! (1/ ) (1/ )
iy
ii
i i
yP y
y
i
i
(2)
9 For instance, see Bowman, et al., op cit.; Lee and Abdel-Aty, op cit.; Loukaitou-Sideris et al., op cit.
New York City Pedestrian Safety Study & Action Plan: Technical Supplement 51
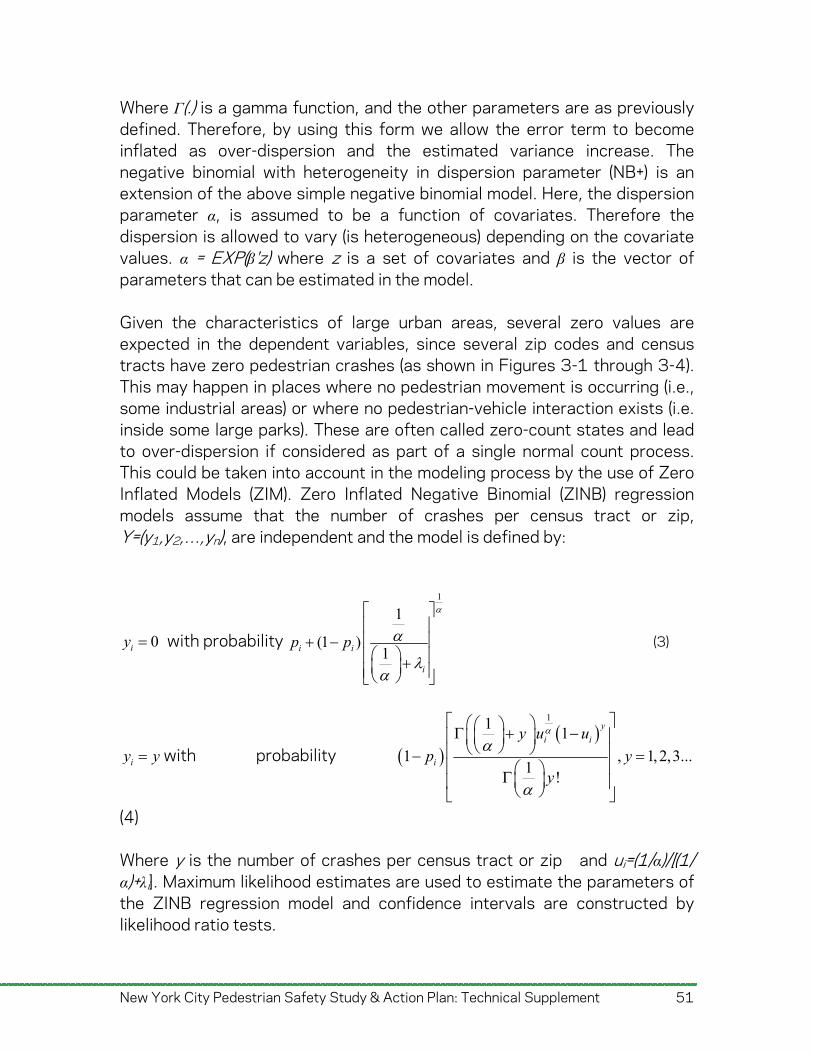
Where Г(.) is a gamma function, and the other parameters are as previously defined. Therefore, by using this form we allow the error term to become inflated as over-dispersion and the estimated variance increase. The negative binomial with heterogeneity in dispersion parameter (NB+) is an extension of the above simple negative binomial model. Here, the dispersion parameter α, is assumed to be a function of covariates. Therefore the dispersion is allowed to vary (is heterogeneous) depending on the covariate values. α = EXP(β'z) where z is a set of covariates and β is the vector of parameters that can be estimated in the model.
Given the characteristics of large urban areas, several zero values are expected in the dependent variables, since several zip codes and census tracts have zero pedestrian crashes (as shown in Figures 3-1 through 3-4). This may happen in places where no pedestrian movement is occurring (i.e., some industrial areas) or where no pedestrian-vehicle interaction exists (i.e. inside some large parks). These are often called zero-count states and lead to over-dispersion if considered as part of a single normal count process. This could be taken into account in the modeling process by the use of Zero Inflated Models (ZIM). Zero Inflated Negative Binomial (ZINB) regression models assume that the number of crashes per census tract or zip, Y=(y1,y2,…,yn), are independent and the model is defined by:
0iy with probability
1
1
(1 )1i i
i
p p
(3)
iy y with probability
111
1 , 1,2,3...1
!
y
i i
i
y u u
p yy
(4) Where y is the number of crashes per census tract or zip and ui=(1/α)/[(1/ α)+λi]. Maximum likelihood estimates are used to estimate the parameters of the ZINB regression model and confidence intervals are constructed by likelihood ratio tests.
Zero-inflated models imply that the underlying data-generating process has a splitting regime that provides for two types of zeros. The splitting process is assumed to follow a logit (logistic) or probit (normal) probability process, or other probability processes. To use this type of model there should be a good understanding of the reasons of the high number of zero values, as identified previously in this report. 3.1.3. Frequency Modeling Results This section presents frequency modeling results. The models were developed at two levels of spatial aggregation: the zip code and census tract levels. Since the number of crashes was few at the census tract level (as shown in Figures 3-1 and 3-2) and, as a result, a higher dispersion (i.e. higher COV shown in Tables B-1 and B-3), the researchers developed a single model for the total number of KSI crashes at the census tract level in order to ensure a good model fit. At the zip code level, on the other hand, separate models were estimated for fatal crash counts and severe injury crash counts. Three different modeling methodologies were employed: a simple negative binomial model (NB), negative binomial model with heterogeneity in dispersion parameter (NB+), and the zero-inflated negative binomial model (ZINB). Each of the models was estimated for the two different subsets. A systematic process of eliminating variables and building a parsimonious model was carried out. Likelihood ratio tests were employed to test hypotheses. The best models for the two subsets of variables were then combined to identify a final model, given that it provided better statistical parameter estimates. The descriptive statistics for the final sets of variables contained in the final models are presented in Table B-11 of Appendix B. Variables in the final model were checked again to avoid correlations (Table B-12). Census Tract Level Models First, the census tract level models are presented. To illustrate the systematic process of model building, the development of the NB model with Subset 1 is shown step-by-step. For the remaining models, only the final modeling results are presented.
New York City Pedestrian Safety Study & Action Plan: Technical Supplement 52
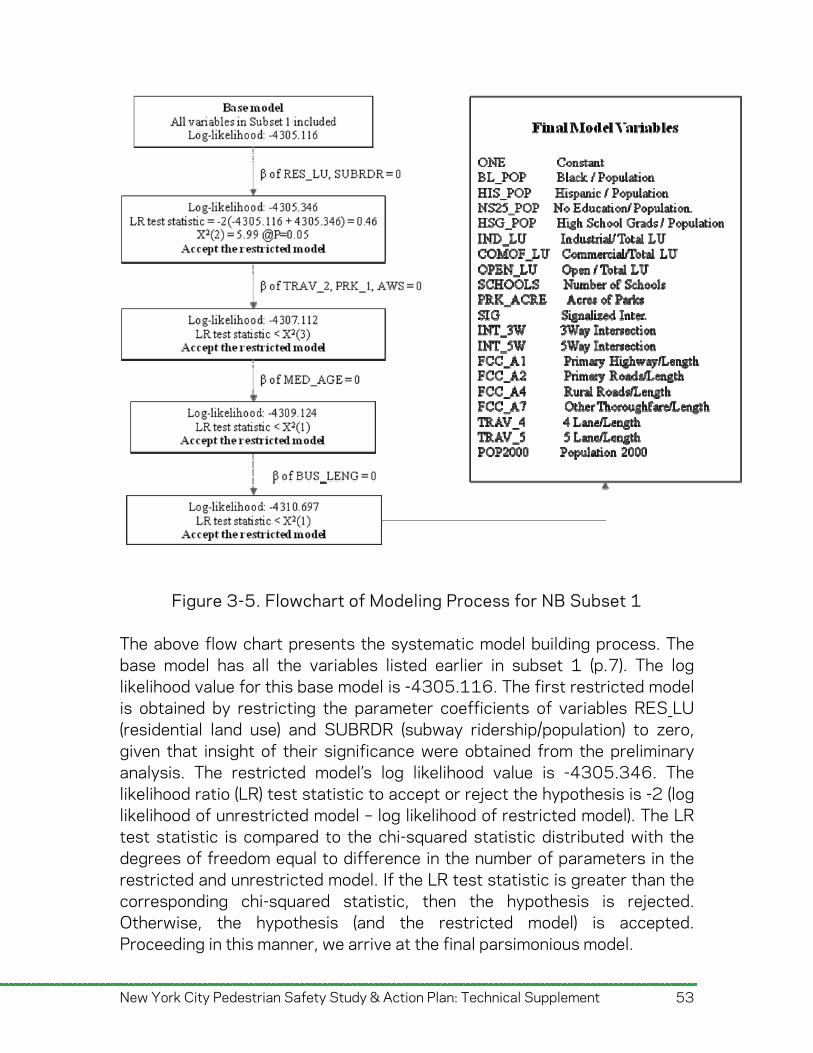
Figure 3-5. Flowchart of Modeling Process for NB Subset 1 The above flow chart presents the systematic model building process. The base model has all the variables listed earlier in subset 1 (p.7). The log likelihood value for this base model is -4305.116. The first restricted model is obtained by restricting the parameter coefficients of variables RES_LU (residential land use) and SUBRDR (subway ridership/population) to zero, given that insight of their significance were obtained from the preliminary analysis. The restricted model’s log likelihood value is -4305.346. The likelihood ratio (LR) test statistic to accept or reject the hypothesis is -2 (log likelihood of unrestricted model – log likelihood of restricted model). The LR test statistic is compared to the chi-squared statistic distributed with the degrees of freedom equal to difference in the number of parameters in the restricted and unrestricted model. If the LR test statistic is greater than the corresponding chi-squared statistic, then the hypothesis is rejected. Otherwise, the hypothesis (and the restricted model) is accepted. Proceeding in this manner, we arrive at the final parsimonious model.
New York City Pedestrian Safety Study & Action Plan: Technical Supplement 53
Table B14 in Appendix B lists the final model estimates for the census tract level model. The dependent variable here is the total number of crashes at the census tract level. The table lists the variable name followed by the parameter estimate (and t-statistic) for the three types of models (NB, NB+, ZINB) for the two different subsets of variables and a final subset which includes significant variables from both subset 1 and 2. Since the census tract level is a smaller level of aggregation than the zip code level, there are more variables available for inclusion in the model. There is greater variability at the census tract level in terms of the independent variable values than at the zip code level. A richer model can therefore be specified at the census tract level. The independent variables can broadly be classified into four categories: exposure, socio-demographic, land-use, and road network and travel characteristics. The exposure variables capture the inherent likelihood of crashes due to greater risk from pedestrian-vehicle interactions. The population (POP2000) and number of signalized intersections (SIG) in a census tract directly affect the number of crashes. Greater population and more signals, which correspond to higher traffic volumes, also correspond to greater exposure and a higher likelihood of crashes. It is important to first control for exposure before interpreting other effects. Both of these exposure variables are highly significant. In terms of socio-demographics, both race and education levels were examined. The variables were modified as fraction variables. For example, the Black population variable (BL_POP) is the fraction of Black population in the census tract. The results show that census tracts with a greater fraction of Black and Hispanic population have a higher likelihood of crashes. In terms of education, a greater fraction of residents whose educational attainment is at the high school graduation level or less increases the likelihood of crashes in the tract. Both the exposure variables and the socio-demographic variables are significant across all models tested indicating the robustness of the estimates. Land use is another important category of factors for explaining crash frequency. The results indicate that tracts with a greater fraction of industrial, commercial/office, and open space land use types have a greater likelihood of crashes while a significantly higher residential land use fraction reduces the likelihood of crashes (this effect was not significant in all
New York City Pedestrian Safety Study & Action Plan: Technical Supplement 54
New York City Pedestrian Safety Study & Action Plan: Technical Supplement 55
models). Residential land use may be associated with lower speed limits as well as fewer pedestrians. Industrial areas, on the other hand, might have more high speed vehicles and therefore have greater risk of pedestrian crashes. Commercial areas are likely to have more pedestrian activity (measured here by transit use); therefore, have greater risk of crashes. Two other land use variables that were significant were number of schools and park areas. A greater number of schools in a census tract are likely to increase the chances of crashes while crash likelihood reduces in tracts with more park coverage. These effects may be linked directly to higher exposure due to the presence of schools and lack of exposure due to less density of roads in parks. The final category of variables analyzed was road network and travel characteristics. In terms of intersection geometry, three-way intersections were associated with reduced likelihood of crashes while the presence of five-way intersections increased crash likelihood. These results may again be attributed to the risk of exposure which is greater in five-way intersections compared to three-way intersections. Several different variables were available to study the type and width of roadway. Census tracts with greater fraction of primary roadways with limited access, local roads, and other thoroughfares had lower likelihood for crashes while a greater fraction of primary roadways without access restriction increased the likelihood of crashes. This finding clearly outlines the importance of traffic calming on high speed, high volume roadways. Further, a greater fraction of roads with four or more lanes also increased the likelihood of crashes, while narrow roads (width less than 30 feet) reduced the likelihood. Finally, a measure of transit density—the fraction of bus route lengths to total roadway length—also increased crash likelihood. In terms of the different modeling methods, the zero-inflated negative binomial (ZINB) model with the final subset of variables performed the best. The Vuong statistic, which measures the appropriateness of using ZINB over traditional count models, for this model is 4.3259. This figure is significant and favors the use of the ZINB model (assuming a 95% confidence level, Vuong statistics > 1.96 means the appropriateness of ZINB)10. Further, the negative binomial model with heterogeneity in dispersion parameter (NB+) performed better than the ordinary negative binomial model. In particular, it was observed that census tracts with a greater fraction of black population 10 Washington, S.P., Karlaftis, M.G., and Mannering, F.L., 2003. Statistical and Econometric Methods for Transportation Data Analysis. Chapman & Hall/CRC.
had less dispersion (variability in terms of number of crashes) while tracts with more length of roadways had greater dispersion. In other words, pedestrian crashes at census tracts with greater black population have less variability than that at census tracts with more length of roadways. There were no major differences both in terms of significance and parameter estimate across the three models indicating the robustness of the estimates. Zip Code Level Models The zip code level model was estimated separately for the two different crash severities: severe injury and fatal. We present the model for severe-injury crash frequencies first (Table B-15 in Appendix B) and then the fatal frequencies model (Table B-16). Since most variables average out at the higher spatial aggregation level of zip codes (as compared to census tracts), the number of independent variables available for model estimation is lesser. Furthermore, as can be observed from table B-15, the model specification affects both the parameter estimates the significance values. The interpretation presented here is for the best model, which is the negative binomial model with heterogeneity in dispersion parameter (NB+). (1) Severe-Injury Crash Frequency Model Population and the number of registered commercial vehicles were used as control variables for capturing risk exposure. With the increase of population, we expect that the pedestrian activities increases and hence the likelihood of pedestrian crashes also increases. On the other hand, with the increase of registered commercial vehicles truck-level traffic activities increase with greater risk for pedestrian crashes. Both of these variables were found highly significant in model results. Another potential risk exposure variable considered in variable selection, the number of registered passenger vehicles per zip code, was not found significant. Given the high use of transit in New York, owning a passenger vehicle does not automatically translate to greater vehicle miles traveled using the vehicle. The remaining categories of variables included are similar to census tract level but fewer in total number of variables. Similar to results at the census tract level, a greater fraction of Black population translates to a greater likelihood of severe-injury crashes. A greater fraction of population without school education also translates to a greater likelihood of severe-injury crashes in both levels of aggregation (zip code and census tract).
New York City Pedestrian Safety Study & Action Plan: Technical Supplement 56
The effects of land use are less prominent at the zip code level compared to the census tract level. This may be an effect of the diversity of land use in New York City at the zip code level; while census tracts typically have one dominant land use, a zip code may encompass multiple land use types. The only land use variable significant across all models is the fraction of industrial land use type; the likelihood of severe-injury crashes increases with an increase in the fraction of industrial land use. There are several road network and travel characteristic variables in the final best-fit model. Zip codes with a greater number of five-way (complex) intersections are more likely to have severe pedestrian crashes. The likelihood of severe pedestrian crashes is also higher in zip codes with a greater fraction of primary roads without access restrictions. Finally, signal density (number of traffic signals divided by area) and number of bus stops, both of which represent the likely exposure of pedestrians to conflicts, have significant effects on the frequency of severe crashes. Greater signal density and larger number of bus stops both correspond to a higher likelihood of severe crashes. Zip codes with a greater fraction of single-lane roads are also correlated with an increased likelihood of severe pedestrian crashes. Signal density, one-lane streets and bus stop density are all associated with higher-density areas with higher pedestrian activities, which may be the root cause of the correlation. Comparing across the models, there is substantial variability in parameter values and significance levels. Therefore, model specification is more of an issue at the zip code level than at the census tract level. All the above interpretations are based on the best-fit model that allowed for heterogeneity in dispersion parameters. In general, a greater fraction of Black population, a higher number of signals, and a greater fraction of residential land use, all translated to lower values of dispersion. (2) Fatal Crash Frequency Model The model for fatal crash frequency at the zip code level has fewer significant independent variables compared to the severe-injury crash frequency model (Table B-16). Once again, the NB+ model is the best fit model. The interpretations are mainly restricted to this model. The control variable is again the population residing in the zip code. None of the other control variables were significant while the total number of signals was highly correlated with several other variables and was therefore not
New York City Pedestrian Safety Study & Action Plan: Technical Supplement 57
included. Contrary to the census tract level result, we find here that zip codes with a greater fraction of Hispanic population are less likely to experience fatal crashes. The effect was reverse for the model at the tract level and was only marginally significant in one of the models for severe crashes at the zip code level. Industrial land use continued to have a similar effect as above (correlated to higher crash frequency) while another variable measuring the area under office land use type had a negative effect; this effect is contradictory to that observed in earlier models.
The results suggest that the causal factors for severe-injury crashes are not always the same for fatal crashes, implying that the two severity types need to be analyzed differently. The road network and travel characteristics results were similar to earlier models: the likelihood of fatal crashes is higher in zip codes with a greater fraction of primary roads without access restrictions (i.e non-expressway arterial streets), higher signal density, and more bus routes. Finally, the heterogeneity in dispersion parameter had only one significant variable – fraction of Black population. Once again, the effect is contrary to the effect observed in severe crashes model – the greater the fraction of Black population is, the greater the dispersion parameter value.
3.1.4. Summary and Conclusions To summarize the frequency models, three different modeling methodologies (negative binomial, NB with heterogeneity in dispersion parameter, and the zero-inflated negative binomial) were estimated for different subsets of variables at both the census tract level and zip code level. The census tract level model treated the total number of severe and fatal pedestrian crashes as the dependent variable while the zip code level models were estimated separately for severe and fatal crashes. The following results were consistent in all the different models estimated:
The greater the fraction of industrial and commercial land use, greater the likelihood of crashes
The greater the number of five way intersections, greater the likelihood of crashes
The greater the fraction of primary roads without access restrictions (non-highway arterial streets), the higher the likelihood of crashes
The greater the transit density (bus routes and stops), the higher the likelihood of crashes
New York City Pedestrian Safety Study & Action Plan: Technical Supplement 58
New York City Pedestrian Safety Study & Action Plan: Technical Supplement 59
The above results make a strong case for focusing on engineering and education efforts in areas with significant commercial and industrial land use, complex intersections, on major arterial streets, and on bus routes. The following results had significant support at the census tract level model and for severe crashes at zip code level:
Areas with a greater fraction of Black population (and to a lesser extent, Hispanic population) have a greater likelihood of crashes
A greater fraction of population without any school education also translates to a higher likelihood of crashes
The above results provide a target population base (Black, Hispanic/Latino, and pedestrians lacking any school education) for education and outreach efforts. 3.2. Severity Analysis The analysis of the severity of pedestrian crashes complements safety studies by targeting investments in locations based upon the number and severity of crashes that occur. Severity analysis can help identify design mitigation issues, such as design of crosswalks and intersections that influence the outcomes of pedestrian crashes. Moreover, severity models can provide additional insight into pedestrian behavior (e.g. impairment by alcohol or drugs) that contributes to the likelihood of a fatality in a crash. While frequency models were built at the aggregated geographic level, the severity models analyzed individual crash records. Thus, we can identify the specific characteristics that made the crash more or less severe. For this reason, previous research has focused on estimating the injury level or severity according to pedestrian risk taking.11 Thus, the analysis of the causal factors that affect the fatality likelihood of pedestrian crashes will help assess the implementation of countermeasures that may improve pedestrian safety in New York City. It is important to note that this study is the first to understand severity modeling using comprehensive factors in an urban area. As such, this study will provide guidance for future studies in New York State and other states in the United States.
11 Preusser, D.F., Wells, J.K., Williams, A.f., Weinstein, H.B., 2002. Pedestrian crashes in Washington, DC and Baltimore. Accident Analysis and Prevention, vol. 34, pp. 703-710.
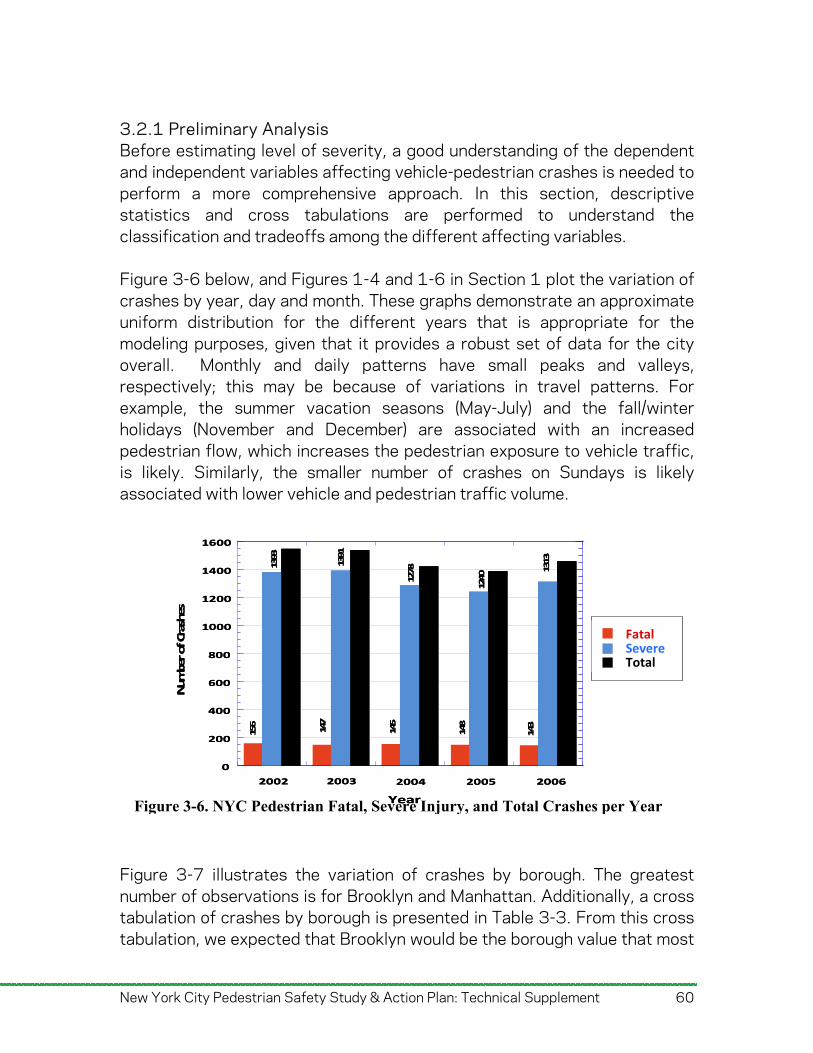
New York City Pedestrian Safety Study & Action Plan: Technical Supplement 60
3.2.1 Preliminary Analysis Before estimating level of severity, a good understanding of the dependent and independent variables affecting vehicle-pedestrian crashes is needed to perform a more comprehensive approach. In this section, descriptive statistics and cross tabulations are performed to understand the classification and tradeoffs among the different affecting variables.
Figure 3-6 below, and Figures 1-4 and 1-6 in Section 1 plot the variation of crashes by year, day and month. These graphs demonstrate an approximate uniform distribution for the different years that is appropriate for the modeling purposes, given that it provides a robust set of data for the city overall. Monthly and daily patterns have small peaks and valleys, respectively; this may be because of variations in travel patterns. For example, the summer vacation seasons (May-July) and the fall/winter holidays (November and December) are associated with an increased pedestrian flow, which increases the pedestrian exposure to vehicle traffic, is likely. Similarly, the smaller number of crashes on Sundays is likely associated with lower vehicle and pedestrian traffic volume.
Figure 3-7 illustrates the variation of crashes by borough. The greatest number of observations is for Brooklyn and Manhattan. Additionally, a cross tabulation of crashes by borough is presented in Table 3-3. From this cross tabulation, we expected that Brooklyn would be the borough value that most
0
200
400
600
800
1000
1200
1400
1600
2002 2003 2004 2005 2006
Number of Crashes
156
1393
147
145
148
143
1391
1278
1240 1313
Year
0
200
400
600
800
1000
1200
1400
1600
2002 2003 2004 2005 2006
Number of Crashes
156
1393
147
145
148
143
1391
1278
1240 1313
Year Figure 3-6. NYC Pedestrian Fatal, Severe Injury, and Total Crashes per Year
FatalSevereTotal
FatalSevereTotal
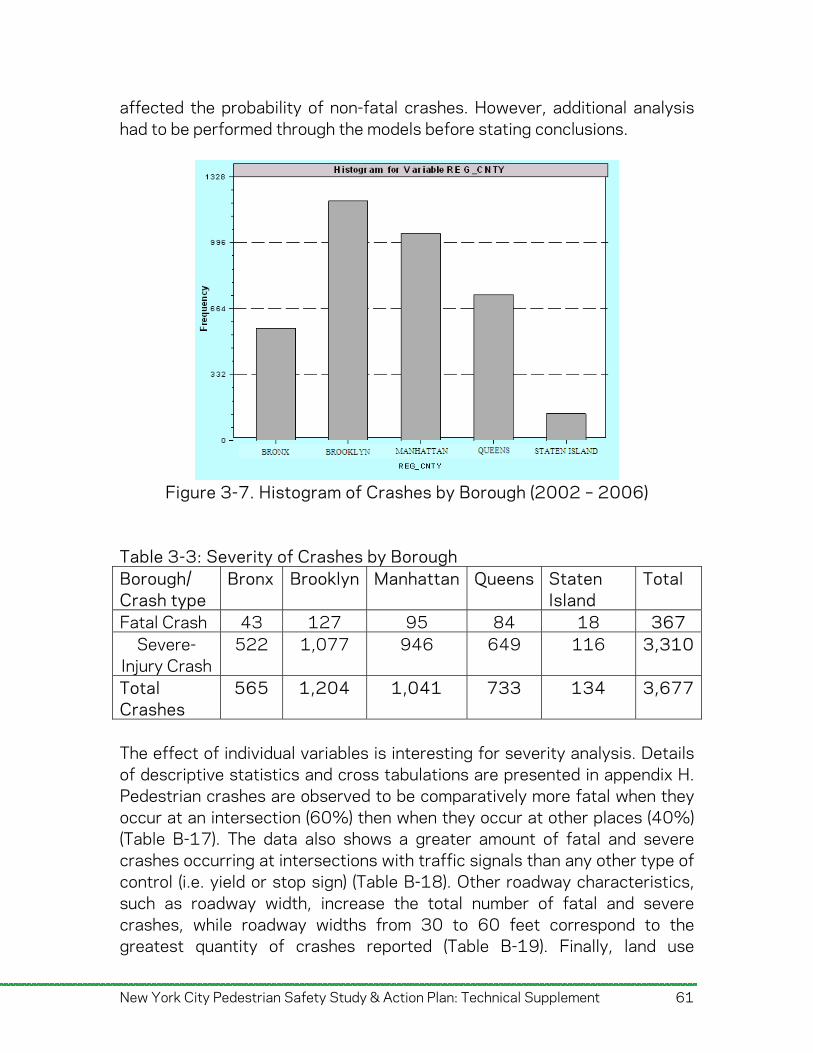
affected the probability of non-fatal crashes. However, additional analysis had to be performed through the models before stating conclusions.
Figure 3-7. Histogram of Crashes by Borough (2002 – 2006)
Table 3-3: Severity of Crashes by Borough Borough/ Crash type
Bronx Brooklyn Manhattan Queens Staten Island
Total
Fatal Crash 43 127 95 84 18 367 Severe-
Injury Crash 522 1,077 946 649 116 3,310
Total Crashes
565 1,204 1,041 733 134 3,677
The effect of individual variables is interesting for severity analysis. Details of descriptive statistics and cross tabulations are presented in appendix H. Pedestrian crashes are observed to be comparatively more fatal when they occur at an intersection (60%) then when they occur at other places (40%) (Table B-17). The data also shows a greater amount of fatal and severe crashes occurring at intersections with traffic signals than any other type of control (i.e. yield or stop sign) (Table B-18). Other roadway characteristics, such as roadway width, increase the total number of fatal and severe crashes, while roadway widths from 30 to 60 feet correspond to the greatest quantity of crashes reported (Table B-19). Finally, land use
New York City Pedestrian Safety Study & Action Plan: Technical Supplement 61
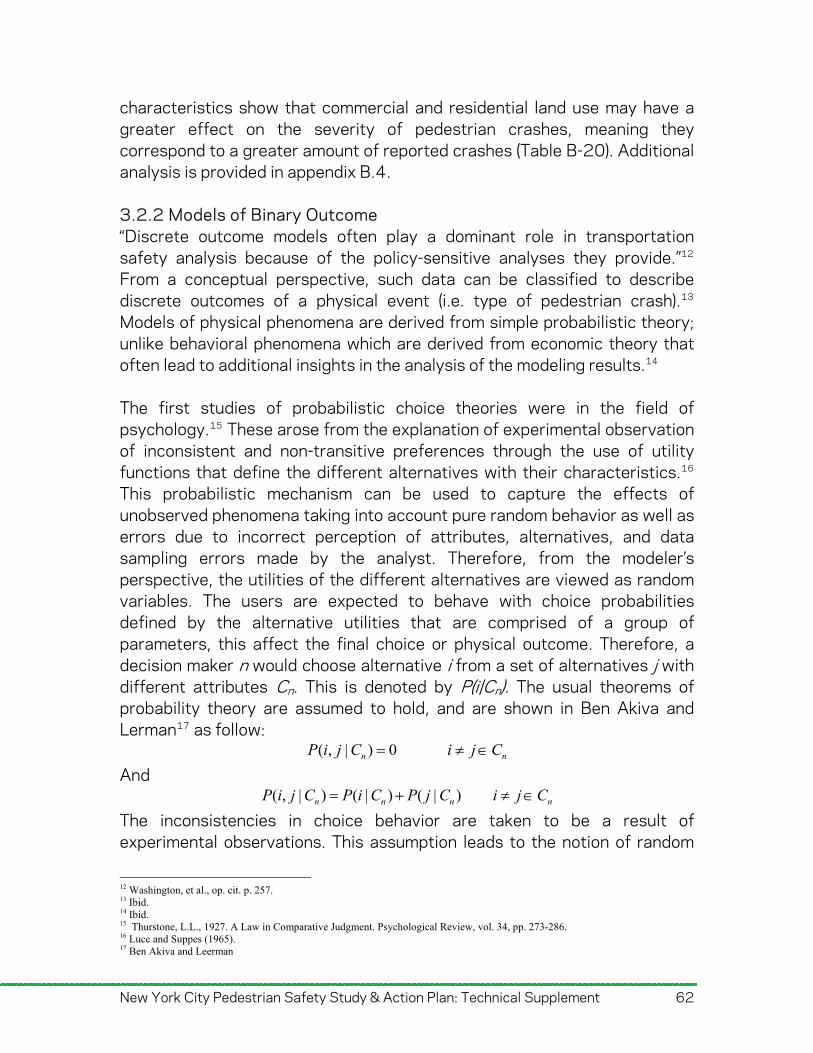
New York City Pedestrian Safety Study & Action Plan: Technical Supplement 62
characteristics show that commercial and residential land use may have a greater effect on the severity of pedestrian crashes, meaning they correspond to a greater amount of reported crashes (Table B-20). Additional analysis is provided in appendix B.4. 3.2.2 Models of Binary Outcome “Discrete outcome models often play a dominant role in transportation safety analysis because of the policy-sensitive analyses they provide.”12 From a conceptual perspective, such data can be classified to describe discrete outcomes of a physical event (i.e. type of pedestrian crash).13 Models of physical phenomena are derived from simple probabilistic theory; unlike behavioral phenomena which are derived from economic theory that often lead to additional insights in the analysis of the modeling results.14 The first studies of probabilistic choice theories were in the field of psychology.15 These arose from the explanation of experimental observation of inconsistent and non-transitive preferences through the use of utility functions that define the different alternatives with their characteristics.16 This probabilistic mechanism can be used to capture the effects of unobserved phenomena taking into account pure random behavior as well as errors due to incorrect perception of attributes, alternatives, and data sampling errors made by the analyst. Therefore, from the modeler’s perspective, the utilities of the different alternatives are viewed as random variables. The users are expected to behave with choice probabilities defined by the alternative utilities that are comprised of a group of parameters, this affect the final choice or physical outcome. Therefore, a decision maker n would choose alternative i from a set of alternatives j with different attributes Cn. This is denoted by P(i|Cn). The usual theorems of probability theory are assumed to hold, and are shown in Ben Akiva and Lerman17 as follow:
( , | ) 0nP i j C ni j C And
( , | ) ( | ) ( | )n nP i j C P i C P j Cn ni j C The inconsistencies in choice behavior are taken to be a result of experimental observations. This assumption leads to the notion of random
12 Washington, et al., op. cit. p. 257. 13 Ibid. 14 Ibid. 15 Thurstone, L.L., 1927. A Law in Comparative Judgment. Psychological Review, vol. 34, pp. 273-286. 16 Luce and Suppes (1965). 17 Ben Akiva and Leerman
New York City Pedestrian Safety Study & Action Plan: Technical Supplement 63
utility theory, defined by Manski (1977). 18 Here, models where the probability of any alternative i being selected by a person n from choice set Cn is given by the following:
( | ) Pr( , )n in jnP i C U U nj C Where the utility of alternative i, Uin, is greater than or equal to the utilities of all other alternatives in the choice set. We ignore the probability that Uin=Ujn for any i and j in the choice set. Formally, if the distribution of Uin and Ujn can be characterized by a probability density function, Pr(Uin=Ujn)=0. For the modeling of severity of pedestrian crashes in New York, we consider the special case: Cn contains exactly two alternatives, fatal and severe crashes. 3.2.3. Models of Binary Logit The estimation of any binary outcome model is conceptually straightforward. The difference between discrete binary outcome models is made by the different assumptions made of the disturbance terms of the respective functions. For the modeling of severity of pedestrian safety, a Binary Logit Model was selected. A complete presentation on this type of model can be found in Ben Akiva and Lerman. The binary logit model arises from the assumption that the data is logistically distributed (defined by a logistic function), namely:
1( ) , 0,
1 nn nlF le
2( )
(1 )
n
n
l
n l
ef
e
Where μ is a positive scale parameter, under the assumption that n is logistically distributed, the choice probability of alternative i is given by:
'( )
1( )
1 in jnn x xP ie
Therefore, the probability of severe crash, Ps, will be given by the previous probability function, and the probability of a fatal crash would be provided by the subtraction of the probability function (Pf = 1-Ps). 3.2.4. Severity Modeling Process The modeling process followed a comprehensive approach that considered the individual and combined effect of variables on the dependent variable. As demonstrated previously, preliminary analysis was performed in order to 18 Manski 1977.
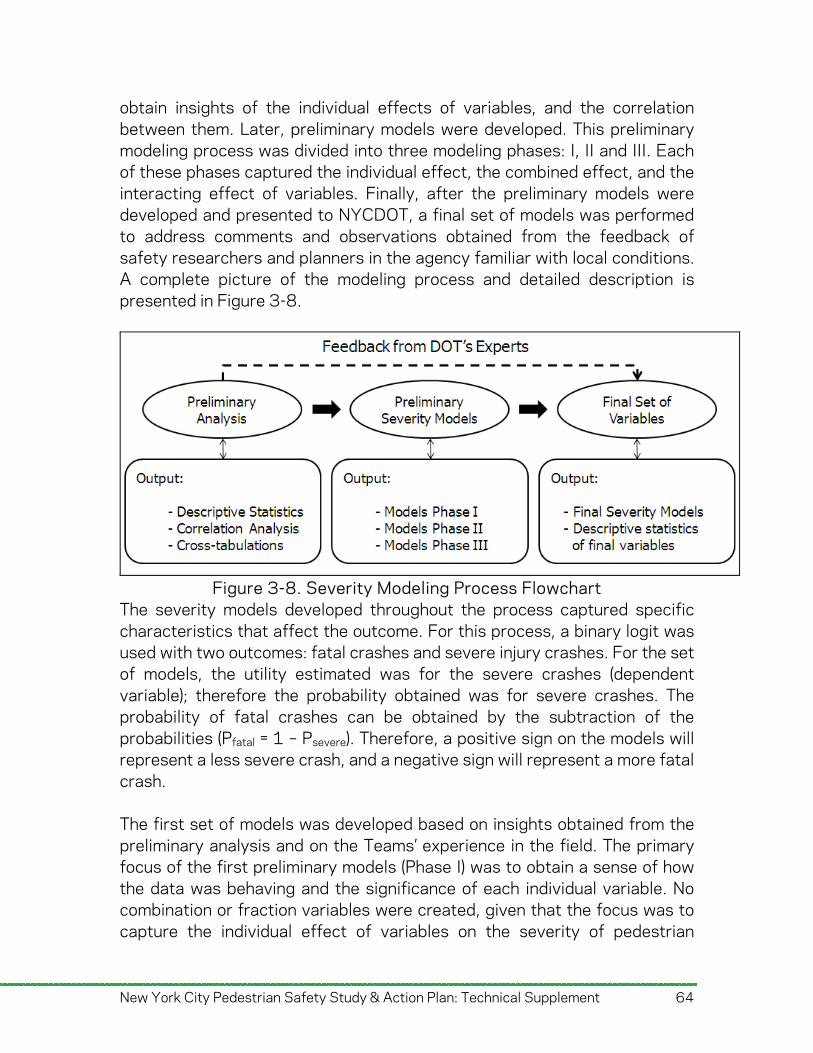
obtain insights of the individual effects of variables, and the correlation between them. Later, preliminary models were developed. This preliminary modeling process was divided into three modeling phases: I, II and III. Each of these phases captured the individual effect, the combined effect, and the interacting effect of variables. Finally, after the preliminary models were developed and presented to NYCDOT, a final set of models was performed to address comments and observations obtained from the feedback of safety researchers and planners in the agency familiar with local conditions. A complete picture of the modeling process and detailed description is presented in Figure 3-8.
Figure 3-8. Severity Modeling Process Flowchart
The severity models developed throughout the process captured specific characteristics that affect the outcome. For this process, a binary logit was used with two outcomes: fatal crashes and severe injury crashes. For the set of models, the utility estimated was for the severe crashes (dependent variable); therefore the probability obtained was for severe crashes. The probability of fatal crashes can be obtained by the subtraction of the probabilities (Pfatal = 1 – Psevere). Therefore, a positive sign on the models will represent a less severe crash, and a negative sign will represent a more fatal crash. The first set of models was developed based on insights obtained from the preliminary analysis and on the Teams’ experience in the field. The primary focus of the first preliminary models (Phase I) was to obtain a sense of how the data was behaving and the significance of each individual variable. No combination or fraction variables were created, given that the focus was to capture the individual effect of variables on the severity of pedestrian
New York City Pedestrian Safety Study & Action Plan: Technical Supplement 64
crashes. Following, the continuing modeling process (Phase II) concentrated on adding some additional characteristics (e.g. pedestrian and vehicle characteristics) by creating new variables (e.g. pedestrian action variables). Finally, the final preliminary models were obtained by creating higher order variables that captured the interactive effect of individual variables (e.g. crossing multilane roads x pedestrians with over 65 years of age). This final set of variables was presented to the NYCDOT in order to obtain some insights on any effect that they were particularly interested in capturing with the severity models. Appendix B.5 contains the set of variables included in the preliminary models (see Tables B-25 through B-31), and the preliminary models for Phase I, II, and III of the severity modeling process (see Tables B-32 through B-35). The final set of models was obtained after addressing the comments made by the NYCDOT. The agency’s interest was on the effect or network characteristics (e.g. roadway width, control type, etc.) on the severity of crashes. Additionally, pedestrian and driver characteristics (e.g. inebriated pedestrian or driver) and the variance by boroughs were of particular interest. The agency’s comments were addressed for the final set of models. Additionally, more restrictive levels of significance were taken (t > |1.3|) in order to increase the accuracy and robustness of the model. 3.2.5. Severity Modeling Results In this section, we present the results for the modeling of severity of pedestrian crashes in the City of New York. The models were estimated using a binary logit model with two outcomes: fatal crashes and severe crashes. In the presented model, the dependent variable is estimated for severe crashes against fatal crashes. The model specification is summarized in Table 3-4.
New York City Pedestrian Safety Study & Action Plan: Technical Supplement 65
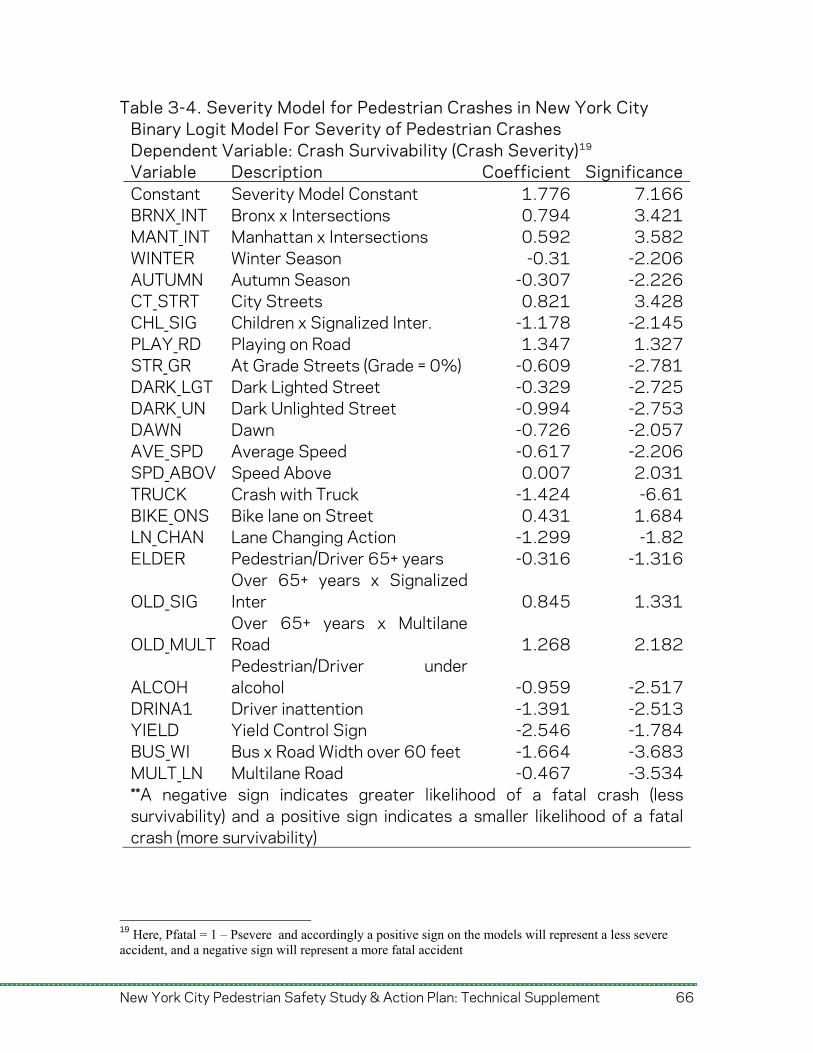
New York City Pedestrian Safety Study & Action Plan: Technical Supplement 66
Table 3-4. Severity Model for Pedestrian Crashes in New York City Binary Logit Model For Severity of Pedestrian Crashes Dependent Variable: Crash Survivability (Crash Severity)19 Variable Description Coefficient SignificanceConstant Severity Model Constant 1.776 7.166BRNX_INT Bronx x Intersections 0.794 3.421MANT_INT Manhattan x Intersections 0.592 3.582WINTER Winter Season -0.31 -2.206AUTUMN Autumn Season -0.307 -2.226CT_STRT City Streets 0.821 3.428CHL_SIG Children x Signalized Inter. -1.178 -2.145PLAY_RD Playing on Road 1.347 1.327STR_GR At Grade Streets (Grade = 0%) -0.609 -2.781DARK_LGT Dark Lighted Street -0.329 -2.725DARK_UN Dark Unlighted Street -0.994 -2.753DAWN Dawn -0.726 -2.057AVE_SPD Average Speed -0.617 -2.206SPD_ABOV Speed Above 0.007 2.031TRUCK Crash with Truck -1.424 -6.61BIKE_ONS Bike lane on Street 0.431 1.684LN_CHAN Lane Changing Action -1.299 -1.82ELDER Pedestrian/Driver 65+ years -0.316 -1.316
OLD_SIG Over 65+ years x Signalized Inter 0.845 1.331
OLD_MULT Over 65+ years x Multilane Road 1.268 2.182
ALCOH Pedestrian/Driver under alcohol -0.959 -2.517
DRINA1 Driver inattention -1.391 -2.513YIELD Yield Control Sign -2.546 -1.784BUS_WI Bus x Road Width over 60 feet -1.664 -3.683MULT_LN Multilane Road -0.467 -3.534**A negative sign indicates greater likelihood of a fatal crash (less survivability) and a positive sign indicates a smaller likelihood of a fatal crash (more survivability)
19 Here, Pfatal = 1 – Psevere and accordingly a positive sign on the models will represent a less severe accident, and a negative sign will represent a more fatal accident
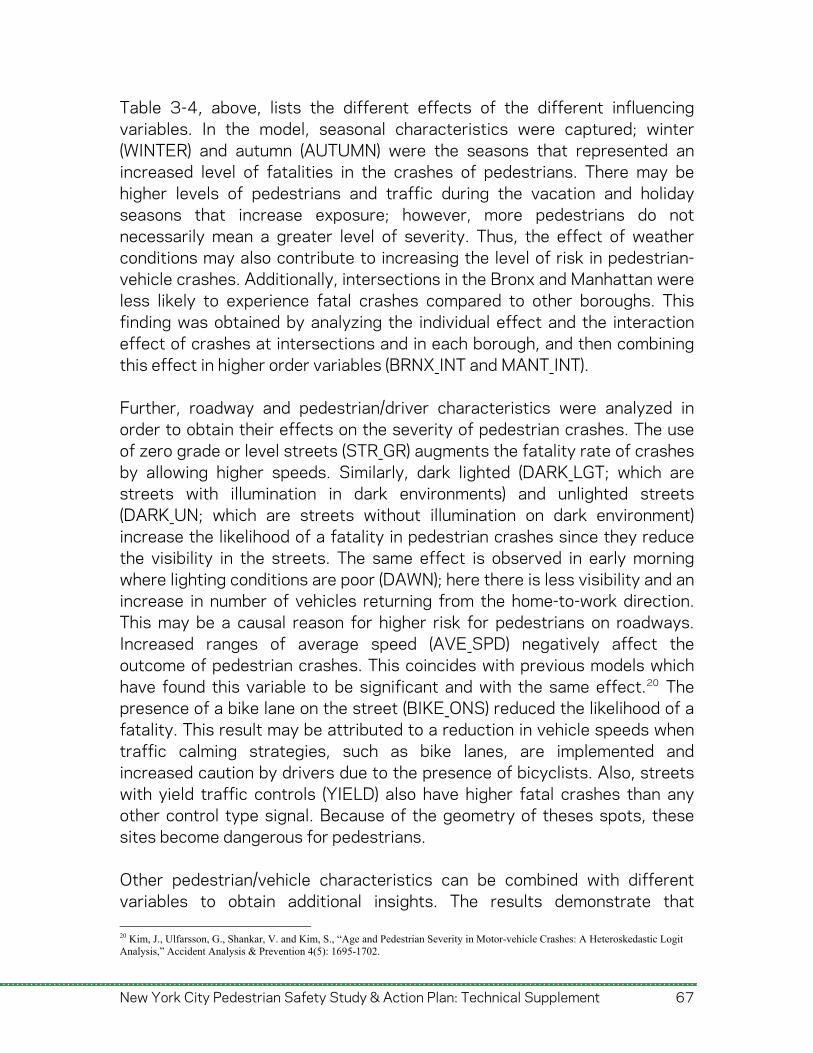
New York City Pedestrian Safety Study & Action Plan: Technical Supplement 67
Table 3-4, above, lists the different effects of the different influencing variables. In the model, seasonal characteristics were captured; winter (WINTER) and autumn (AUTUMN) were the seasons that represented an increased level of fatalities in the crashes of pedestrians. There may be higher levels of pedestrians and traffic during the vacation and holiday seasons that increase exposure; however, more pedestrians do not necessarily mean a greater level of severity. Thus, the effect of weather conditions may also contribute to increasing the level of risk in pedestrian-vehicle crashes. Additionally, intersections in the Bronx and Manhattan were less likely to experience fatal crashes compared to other boroughs. This finding was obtained by analyzing the individual effect and the interaction effect of crashes at intersections and in each borough, and then combining this effect in higher order variables (BRNX_INT and MANT_INT).
Further, roadway and pedestrian/driver characteristics were analyzed in order to obtain their effects on the severity of pedestrian crashes. The use of zero grade or level streets (STR_GR) augments the fatality rate of crashes by allowing higher speeds. Similarly, dark lighted (DARK_LGT; which are streets with illumination in dark environments) and unlighted streets (DARK_UN; which are streets without illumination on dark environment) increase the likelihood of a fatality in pedestrian crashes since they reduce the visibility in the streets. The same effect is observed in early morning where lighting conditions are poor (DAWN); here there is less visibility and an increase in number of vehicles returning from the home-to-work direction. This may be a causal reason for higher risk for pedestrians on roadways. Increased ranges of average speed (AVE_SPD) negatively affect the outcome of pedestrian crashes. This coincides with previous models which have found this variable to be significant and with the same effect.20 The presence of a bike lane on the street (BIKE_ONS) reduced the likelihood of a fatality. This result may be attributed to a reduction in vehicle speeds when traffic calming strategies, such as bike lanes, are implemented and increased caution by drivers due to the presence of bicyclists. Also, streets with yield traffic controls (YIELD) also have higher fatal crashes than any other control type signal. Because of the geometry of theses spots, these sites become dangerous for pedestrians.
Other pedestrian/vehicle characteristics can be combined with different variables to obtain additional insights. The results demonstrate that 20 Kim, J., Ulfarsson, G., Shankar, V. and Kim, S., “Age and Pedestrian Severity in Motor-vehicle Crashes: A Heteroskedastic Logit Analysis,” Accident Analysis & Prevention 4(5): 1695-1702.
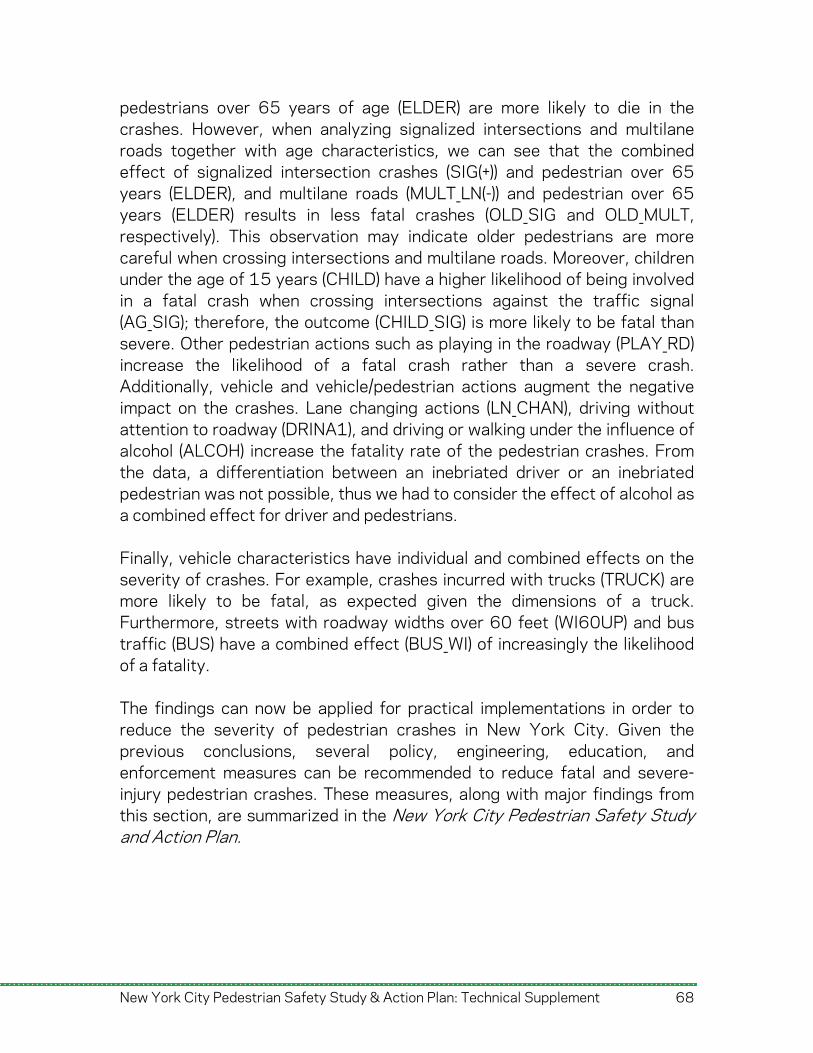
pedestrians over 65 years of age (ELDER) are more likely to die in the crashes. However, when analyzing signalized intersections and multilane roads together with age characteristics, we can see that the combined effect of signalized intersection crashes (SIG(+)) and pedestrian over 65 years (ELDER), and multilane roads (MULT_LN(-)) and pedestrian over 65 years (ELDER) results in less fatal crashes (OLD_SIG and OLD_MULT, respectively). This observation may indicate older pedestrians are more careful when crossing intersections and multilane roads. Moreover, children under the age of 15 years (CHILD) have a higher likelihood of being involved in a fatal crash when crossing intersections against the traffic signal (AG_SIG); therefore, the outcome (CHILD_SIG) is more likely to be fatal than severe. Other pedestrian actions such as playing in the roadway (PLAY_RD) increase the likelihood of a fatal crash rather than a severe crash. Additionally, vehicle and vehicle/pedestrian actions augment the negative impact on the crashes. Lane changing actions (LN_CHAN), driving without attention to roadway (DRINA1), and driving or walking under the influence of alcohol (ALCOH) increase the fatality rate of the pedestrian crashes. From the data, a differentiation between an inebriated driver or an inebriated pedestrian was not possible, thus we had to consider the effect of alcohol as a combined effect for driver and pedestrians.
Finally, vehicle characteristics have individual and combined effects on the severity of crashes. For example, crashes incurred with trucks (TRUCK) are more likely to be fatal, as expected given the dimensions of a truck. Furthermore, streets with roadway widths over 60 feet (WI60UP) and bus traffic (BUS) have a combined effect (BUS_WI) of increasingly the likelihood of a fatality. The findings can now be applied for practical implementations in order to reduce the severity of pedestrian crashes in New York City. Given the previous conclusions, several policy, engineering, education, and enforcement measures can be recommended to reduce fatal and severe-injury pedestrian crashes. These measures, along with major findings from this section, are summarized in the New York City Pedestrian Safety Study and Action Plan.
New York City Pedestrian Safety Study & Action Plan: Technical Supplement 68
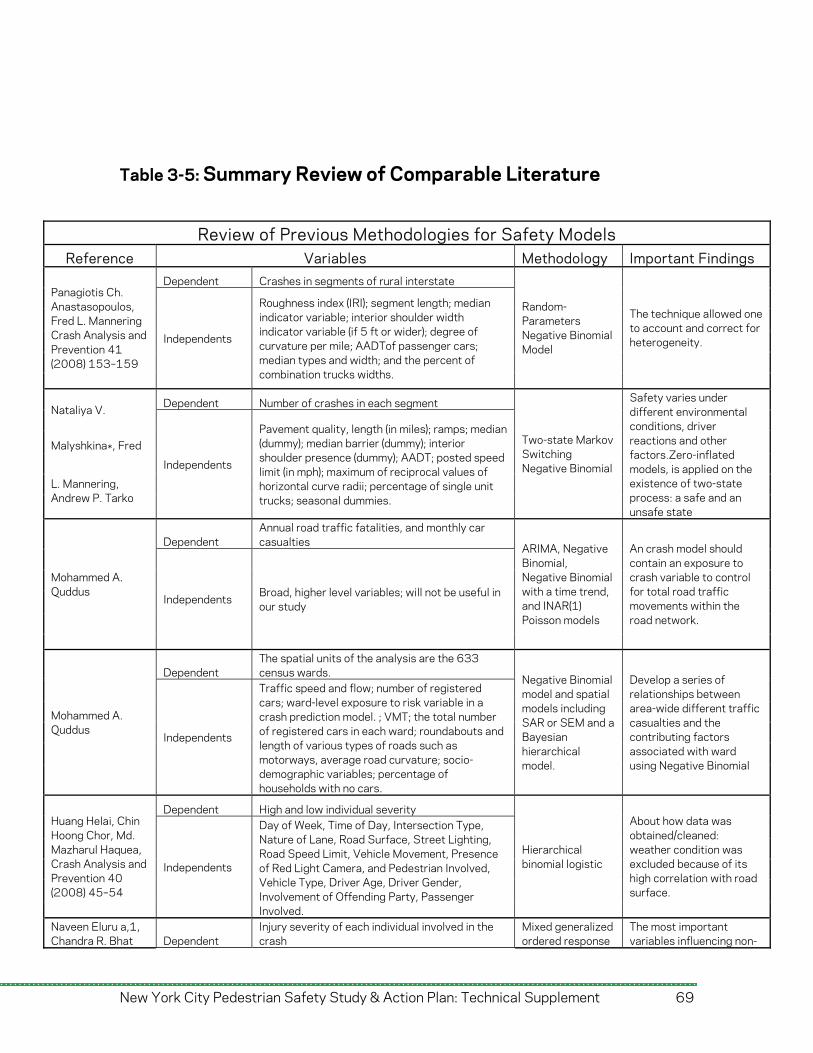
Table 3-5: Summary Review of Comparable Literature
Review of Previous Methodologies for Safety Models Reference Variables Methodology Important Findings
Dependent Crashes in segments of rural interstate Panagiotis Ch. Anastasopoulos, Fred L. Mannering Crash Analysis and Prevention 41 (2008) 153–159
Independents
Roughness index (IRI); segment length; median indicator variable; interior shoulder width indicator variable (if 5 ft or wider); degree of curvature per mile; AADTof passenger cars; median types and width; and the percent of combination trucks widths.
Random-Parameters Negative Binomial Model
The technique allowed one to account and correct for heterogeneity.
Dependent Number of crashes in each segment Nataliya V.
Malyshkina , Fred
L. Mannering, Andrew P. Tarko
Independents
Pavement quality, length (in miles); ramps; median (dummy); median barrier (dummy); interior shoulder presence (dummy); AADT; posted speed limit (in mph); maximum of reciprocal values of horizontal curve radii; percentage of single unit trucks; seasonal dummies.
Two-state Markov Switching Negative Binomial
Safety varies under different environmental conditions, driver reactions and other factors.Zero-inflated models, is applied on the existence of two-state process: a safe and an unsafe state
Dependent Annual road traffic fatalities, and monthly car casualties
Mohammed A. Quddus
Independents Broad, higher level variables; will not be useful in our study
ARIMA, Negative Binomial, Negative Binomial with a time trend, and INAR(1) Poisson models
An crash model should contain an exposure to crash variable to control for total road traffic movements within the road network.
Dependent The spatial units of the analysis are the 633 census wards.
Mohammed A. Quddus
Independents
Traffic speed and flow; number of registered cars; ward-level exposure to risk variable in a crash prediction model. ; VMT; the total number of registered cars in each ward; roundabouts and length of various types of roads such as motorways, average road curvature; socio-demographic variables; percentage of households with no cars.
Negative Binomial model and spatial models including SAR or SEM and a Bayesian hierarchical model.
Develop a series of relationships between area-wide different traffic casualties and the contributing factors associated with ward using Negative Binomial
Dependent High and low individual severity Huang Helai, Chin Hoong Chor, Md. Mazharul Haquea, Crash Analysis and Prevention 40 (2008) 45–54
Independents
Day of Week, Time of Day, Intersection Type, Nature of Lane, Road Surface, Street Lighting, Road Speed Limit, Vehicle Movement, Presence of Red Light Camera, and Pedestrian Involved, Vehicle Type, Driver Age, Driver Gender, Involvement of Offending Party, Passenger Involved.
Hierarchical binomial logistic
About how data was obtained/cleaned: weather condition was excluded because of its high correlation with road surface.
Naveen Eluru a,1, Chandra R. Bhat Dependent
Injury severity of each individual involved in the crash
Mixed generalized ordered response
The most important variables influencing non-
New York City Pedestrian Safety Study & Action Plan: Technical Supplement 69
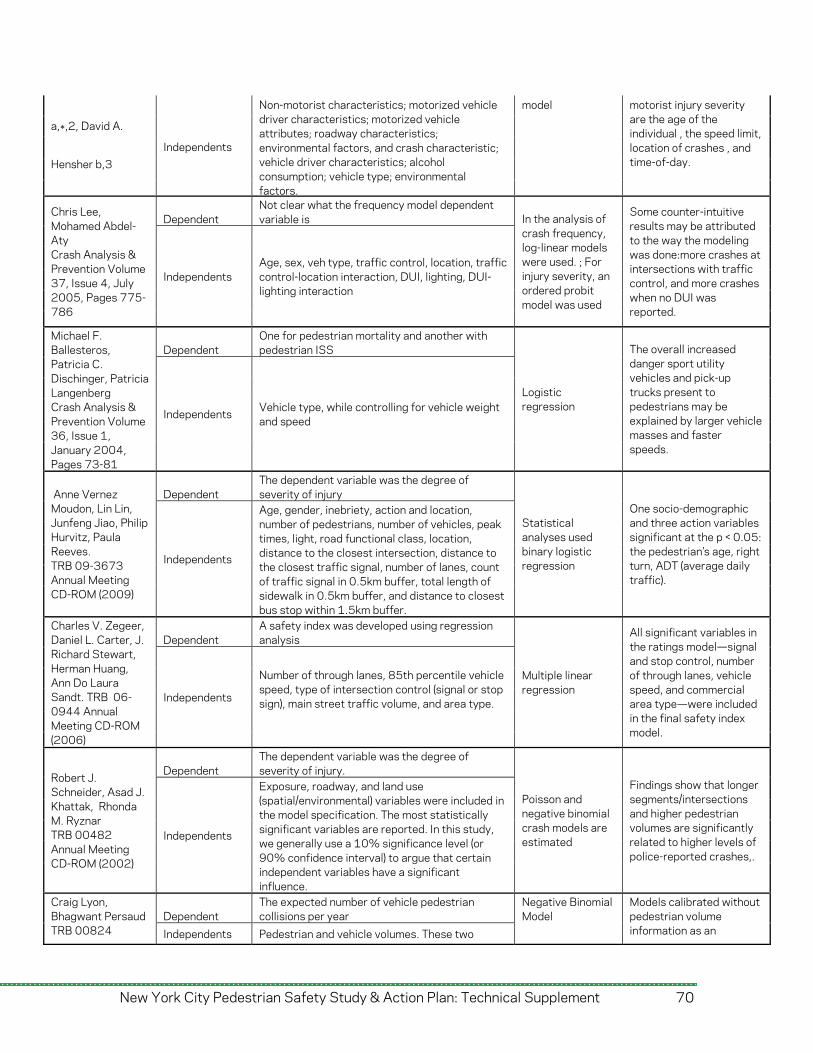
a, ,2, David A.
Hensher b,3 Independents
Non-motorist characteristics; motorized vehicle driver characteristics; motorized vehicle attributes; roadway characteristics; environmental factors, and crash characteristic; vehicle driver characteristics; alcohol consumption; vehicle type; environmental factors.
model motorist injury severity are the age of the individual , the speed limit, location of crashes , and time-of-day.
Dependent Not clear what the frequency model dependent variable is
Chris Lee, Mohamed Abdel-Aty Crash Analysis & Prevention Volume 37, Issue 4, July 2005, Pages 775-786
Independents Age, sex, veh type, traffic control, location, traffic control-location interaction, DUI, lighting, DUI-lighting interaction
In the analysis of crash frequency, log-linear models were used. ; For injury severity, an ordered probit model was used
Some counter-intuitive results may be attributed to the way the modeling was done:more crashes at intersections with traffic control, and more crashes when no DUI was reported.
Dependent One for pedestrian mortality and another with pedestrian ISS
Michael F. Ballesteros, Patricia C. Dischinger, Patricia Langenberg Crash Analysis & Prevention Volume 36, Issue 1, January 2004, Pages 73-81
Independents Vehicle type, while controlling for vehicle weight and speed
Logistic regression
The overall increased danger sport utility vehicles and pick-up trucks present to pedestrians may be explained by larger vehicle masses and faster speeds.
Dependent The dependent variable was the degree of severity of injury Anne Vernez
Moudon, Lin Lin, Junfeng Jiao, Philip Hurvitz, Paula Reeves. TRB 09-3673 Annual Meeting CD-ROM (2009)
Independents
Age, gender, inebriety, action and location, number of pedestrians, number of vehicles, peak times, light, road functional class, location, distance to the closest intersection, distance to the closest traffic signal, number of lanes, count of traffic signal in 0.5km buffer, total length of sidewalk in 0.5km buffer, and distance to closest bus stop within 1.5km buffer.
Statistical analyses used binary logistic regression
One socio-demographic and three action variables significant at the p < 0.05: the pedestrian’s age, right turn, ADT (average daily traffic).
Dependent A safety index was developed using regression analysis
Charles V. Zegeer, Daniel L. Carter, J. Richard Stewart, Herman Huang, Ann Do Laura Sandt. TRB 06-0944 Annual Meeting CD-ROM (2006)
Independents
Number of through lanes, 85th percentile vehicle speed, type of intersection control (signal or stop sign), main street traffic volume, and area type.
Multiple linear regression
All significant variables in the ratings model—signal and stop control, number of through lanes, vehicle speed, and commercial area type—were included in the final safety index model.
Dependent The dependent variable was the degree of severity of injury. Robert J.
Schneider, Asad J. Khattak, Rhonda M. Ryznar TRB 00482 Annual Meeting CD-ROM (2002)
Independents
Exposure, roadway, and land use (spatial/environmental) variables were included in the model specification. The most statistically significant variables are reported. In this study, we generally use a 10% significance level (or 90% confidence interval) to argue that certain independent variables have a significant influence.
Poisson and negative binomial crash models are estimated
Findings show that longer segments/intersections and higher pedestrian volumes are significantly related to higher levels of police-reported crashes,.
Dependent The expected number of vehicle pedestrian collisions per year
Craig Lyon, Bhagwant Persaud TRB 00824 Independents Pedestrian and vehicle volumes. These two
Negative Binomial Model
Models calibrated without pedestrian volume information as an
New York City Pedestrian Safety Study & Action Plan: Technical Supplement 70
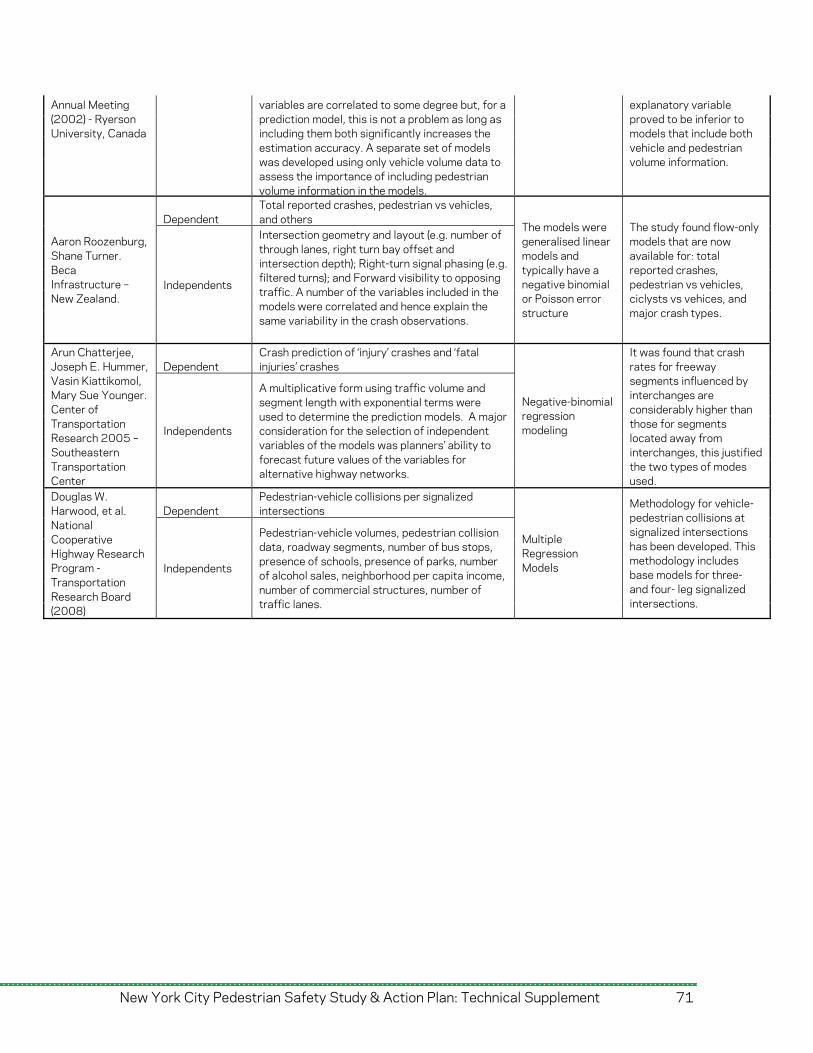
Annual Meeting (2002) - Ryerson University, Canada
variables are correlated to some degree but, for a prediction model, this is not a problem as long as including them both significantly increases the estimation accuracy. A separate set of models was developed using only vehicle volume data to assess the importance of including pedestrian volume information in the models.
explanatory variable proved to be inferior to models that include both vehicle and pedestrian volume information.
Dependent Total reported crashes, pedestrian vs vehicles, and others
Aaron Roozenburg, Shane Turner. Beca Infrastructure – New Zealand.
Independents
Intersection geometry and layout (e.g. number of through lanes, right turn bay offset and intersection depth); Right-turn signal phasing (e.g. filtered turns); and Forward visibility to opposing traffic. A number of the variables included in the models were correlated and hence explain the same variability in the crash observations.
The models were generalised linear models and typically have a negative binomial or Poisson error structure
The study found flow-only models that are now available for: total reported crashes, pedestrian vs vehicles, ciclysts vs vehices, and major crash types.
Dependent Crash prediction of ‘injury’ crashes and ‘fatal injuries’ crashes
Arun Chatterjee, Joseph E. Hummer, Vasin Kiattikomol, Mary Sue Younger. Center of Transportation Research 2005 – Southeastern Transportation Center
Independents
A multiplicative form using traffic volume and segment length with exponential terms were used to determine the prediction models. A major consideration for the selection of independent variables of the models was planners’ ability to forecast future values of the variables for alternative highway networks.
Negative-binomial regression modeling
It was found that crash rates for freeway segments influenced by interchanges are considerably higher than those for segments located away from interchanges, this justified the two types of modes used.
Dependent Pedestrian-vehicle collisions per signalized intersections
Douglas W. Harwood, et al. National Cooperative Highway Research Program - Transportation Research Board (2008)
Independents
Pedestrian-vehicle volumes, pedestrian collision data, roadway segments, number of bus stops, presence of schools, presence of parks, number of alcohol sales, neighborhood per capita income, number of commercial structures, number of traffic lanes.
Multiple Regression Models
Methodology for vehicle-pedestrian collisions at signalized intersections has been developed. This methodology includes base models for three- and four- leg signalized intersections.
New York City Pedestrian Safety Study & Action Plan: Technical Supplement 71
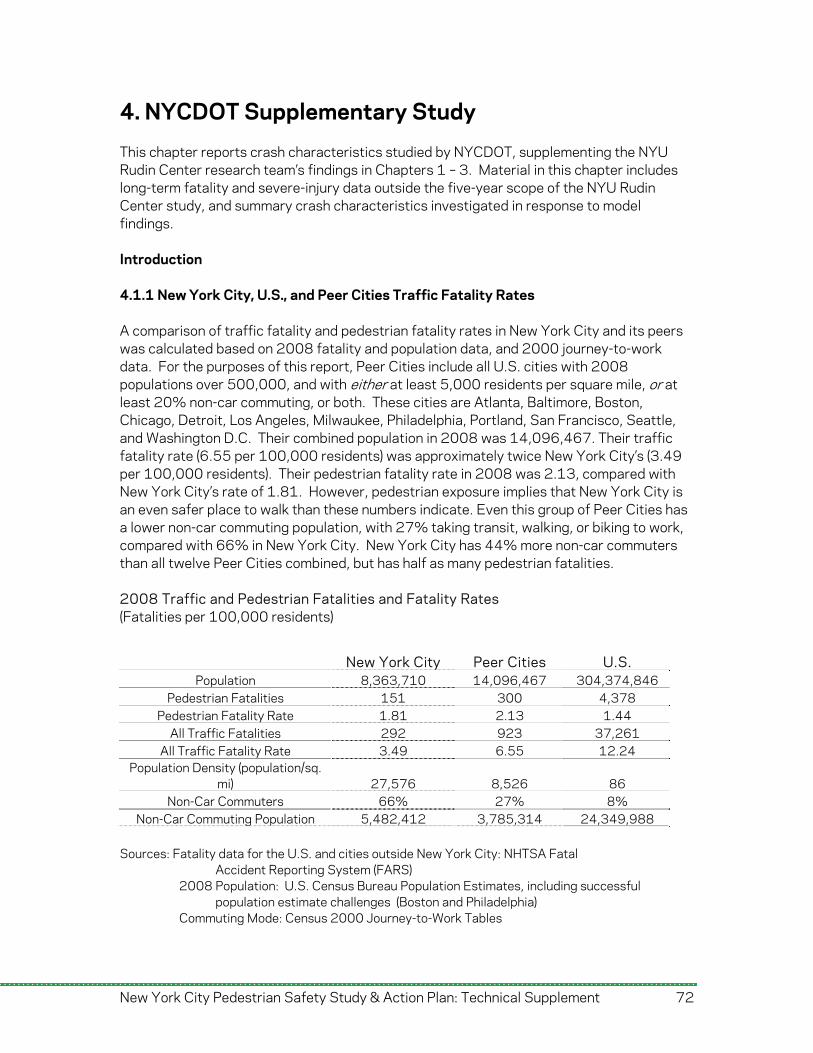
4. NYCDOT Supplementary Study This chapter reports crash characteristics studied by NYCDOT, supplementing the NYU Rudin Center research team’s findings in Chapters 1 – 3. Material in this chapter includes long-term fatality and severe-injury data outside the five-year scope of the NYU Rudin Center study, and summary crash characteristics investigated in response to model findings. Introduction 4.1.1 New York City, U.S., and Peer Cities Traffic Fatality Rates A comparison of traffic fatality and pedestrian fatality rates in New York City and its peers was calculated based on 2008 fatality and population data, and 2000 journey-to-work data. For the purposes of this report, Peer Cities include all U.S. cities with 2008 populations over 500,000, and with either at least 5,000 residents per square mile, or at least 20% non-car commuting, or both. These cities are Atlanta, Baltimore, Boston, Chicago, Detroit, Los Angeles, Milwaukee, Philadelphia, Portland, San Francisco, Seattle, and Washington D.C. Their combined population in 2008 was 14,096,467. Their traffic fatality rate (6.55 per 100,000 residents) was approximately twice New York City’s (3.49 per 100,000 residents). Their pedestrian fatality rate in 2008 was 2.13, compared with New York City’s rate of 1.81. However, pedestrian exposure implies that New York City is an even safer place to walk than these numbers indicate. Even this group of Peer Cities has a lower non-car commuting population, with 27% taking transit, walking, or biking to work, compared with 66% in New York City. New York City has 44% more non-car commuters than all twelve Peer Cities combined, but has half as many pedestrian fatalities. 2008 Traffic and Pedestrian Fatalities and Fatality Rates (Fatalities per 100,000 residents)
New York City Peer Cities U.S. Population 8,363,710 14,096,467 304,374,846
Pedestrian Fatalities 151 300 4,378 Pedestrian Fatality Rate 1.81 2.13 1.44
All Traffic Fatalities 292 923 37,261 All Traffic Fatality Rate 3.49 6.55 12.24
Population Density (population/sq. mi) 27,576 8,526 86
Non-Car Commuters 66% 27% 8% Non-Car Commuting Population 5,482,412 3,785,314 24,349,988
Sources: Fatality data for the U.S. and cities outside New York City: NHTSA Fatal
Accident Reporting System (FARS) 2008 Population: U.S. Census Bureau Population Estimates, including successful population estimate challenges (Boston and Philadelphia) Commuting Mode: Census 2000 Journey-to-Work Tables
New York City Pedestrian Safety Study & Action Plan: Technical Supplement 72
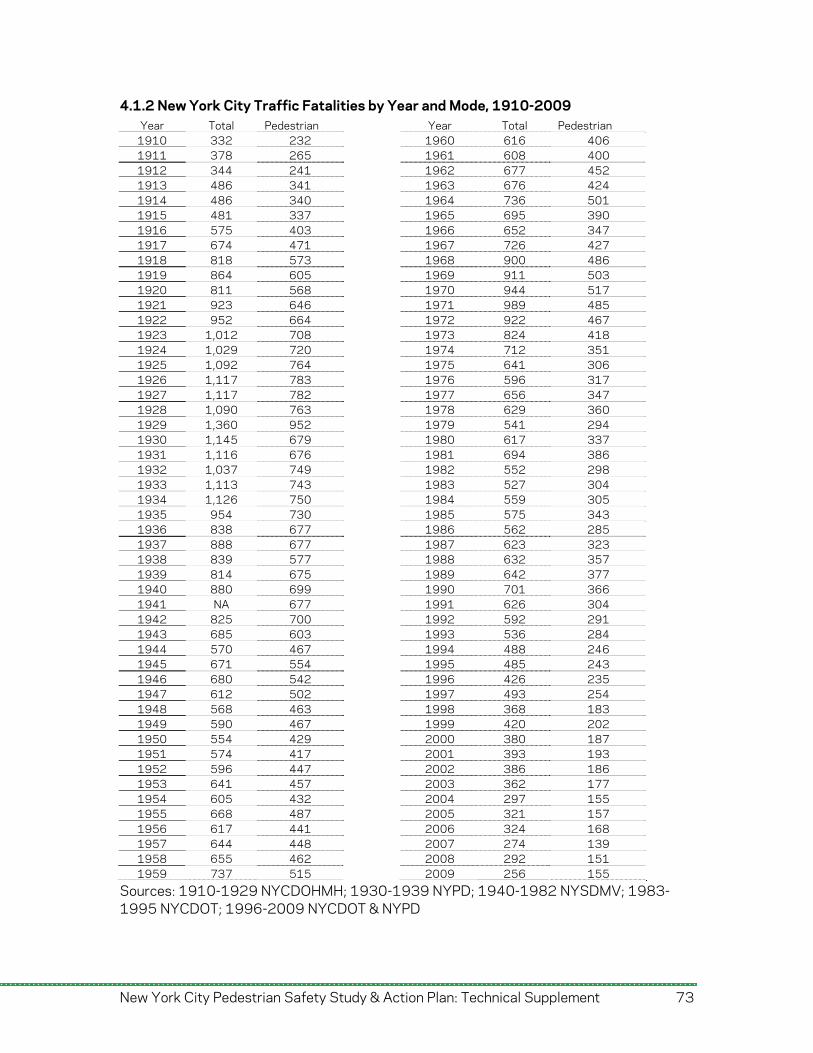
4.1.2 New York City Traffic Fatalities by Year and Mode, 1910-2009 Year Total Pedestrian Year Total Pedestrian
1910 332 232 1960 616 406 1911 378 265 1961 608 400 1912 344 241 1962 677 452 1913 486 341 1963 676 424 1914 486 340 1964 736 501 1915 481 337 1965 695 390 1916 575 403 1966 652 347 1917 674 471 1967 726 427 1918 818 573 1968 900 486 1919 864 605 1969 911 503 1920 811 568 1970 944 517 1921 923 646 1971 989 485 1922 952 664 1972 922 467 1923 1,012 708 1973 824 418 1924 1,029 720 1974 712 351 1925 1,092 764 1975 641 306 1926 1,117 783 1976 596 317 1927 1,117 782 1977 656 347 1928 1,090 763 1978 629 360 1929 1,360 952 1979 541 294 1930 1,145 679 1980 617 337 1931 1,116 676 1981 694 386 1932 1,037 749 1982 552 298 1933 1,113 743 1983 527 304 1934 1,126 750 1984 559 305 1935 954 730 1985 575 343 1936 838 677 1986 562 285 1937 888 677 1987 623 323 1938 839 577 1988 632 357 1939 814 675 1989 642 377 1940 880 699 1990 701 366 1941 NA 677 1991 626 304 1942 825 700 1992 592 291 1943 685 603 1993 536 284 1944 570 467 1994 488 246 1945 671 554 1995 485 243 1946 680 542 1996 426 235 1947 612 502 1997 493 254 1948 568 463 1998 368 183 1949 590 467 1999 420 202 1950 554 429 2000 380 187 1951 574 417 2001 393 193 1952 596 447 2002 386 186 1953 641 457 2003 362 177 1954 605 432 2004 297 155 1955 668 487 2005 321 157 1956 617 441 2006 324 168 1957 644 448 2007 274 139 1958 655 462 2008 292 151 1959 737 515 2009 256 155
Sources: 1910-1929 NYCDOHMH; 1930-1939 NYPD; 1940-1982 NYSDMV; 1983-1995 NYCDOT; 1996-2009 NYCDOT & NYPD
New York City Pedestrian Safety Study & Action Plan: Technical Supplement 73
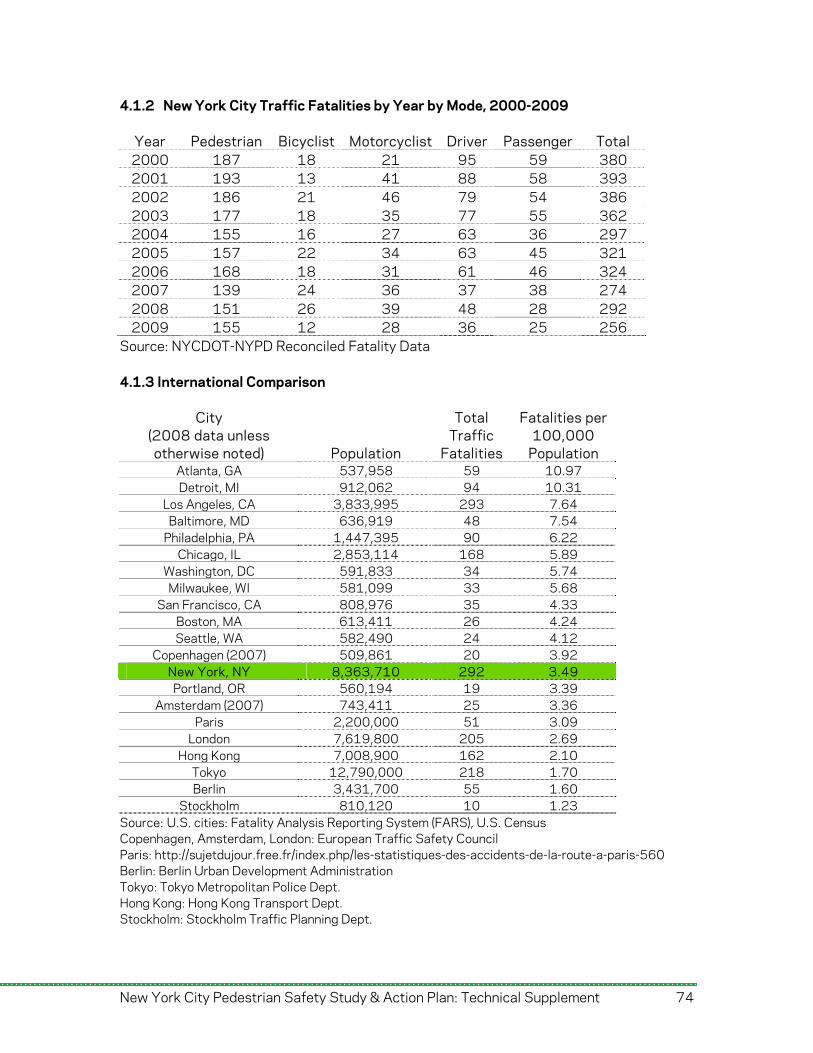
4.1.2 New York City Traffic Fatalities by Year by Mode, 2000-2009
Year Pedestrian Bicyclist Motorcyclist Driver Passenger Total 2000 187 18 21 95 59 380 2001 193 13 41 88 58 393 2002 186 21 46 79 54 386 2003 177 18 35 77 55 362 2004 155 16 27 63 36 297 2005 157 22 34 63 45 321 2006 168 18 31 61 46 324 2007 139 24 36 37 38 274 2008 151 26 39 48 28 292 2009 155 12 28 36 25 256
Source: NYCDOT-NYPD Reconciled Fatality Data 4.1.3 International Comparison
City (2008 data unless otherwise noted) Population
Total Traffic
Fatalities
Fatalities per 100,000
Population Atlanta, GA 537,958 59 10.97 Detroit, MI 912,062 94 10.31
Los Angeles, CA 3,833,995 293 7.64 Baltimore, MD 636,919 48 7.54
Philadelphia, PA 1,447,395 90 6.22 Chicago, IL 2,853,114 168 5.89
Washington, DC 591,833 34 5.74 Milwaukee, WI 581,099 33 5.68
San Francisco, CA 808,976 35 4.33 Boston, MA 613,411 26 4.24 Seattle, WA 582,490 24 4.12
Copenhagen (2007) 509,861 20 3.92 New York, NY 8,363,710 292 3.49 Portland, OR 560,194 19 3.39
Amsterdam (2007) 743,411 25 3.36 Paris 2,200,000 51 3.09
London 7,619,800 205 2.69 Hong Kong 7,008,900 162 2.10
Tokyo 12,790,000 218 1.70 Berlin 3,431,700 55 1.60
Stockholm 810,120 10 1.23 Source: U.S. cities: Fatality Analysis Reporting System (FARS), U.S. Census Copenhagen, Amsterdam, London: European Traffic Safety Council Paris: http://sujetdujour.free.fr/index.php/les-statistiques-des-accidents-de-la-route-a-paris-560 Berlin: Berlin Urban Development Administration Tokyo: Tokyo Metropolitan Police Dept. Hong Kong: Hong Kong Transport Dept. Stockholm: Stockholm Traffic Planning Dept.
New York City Pedestrian Safety Study & Action Plan: Technical Supplement 74
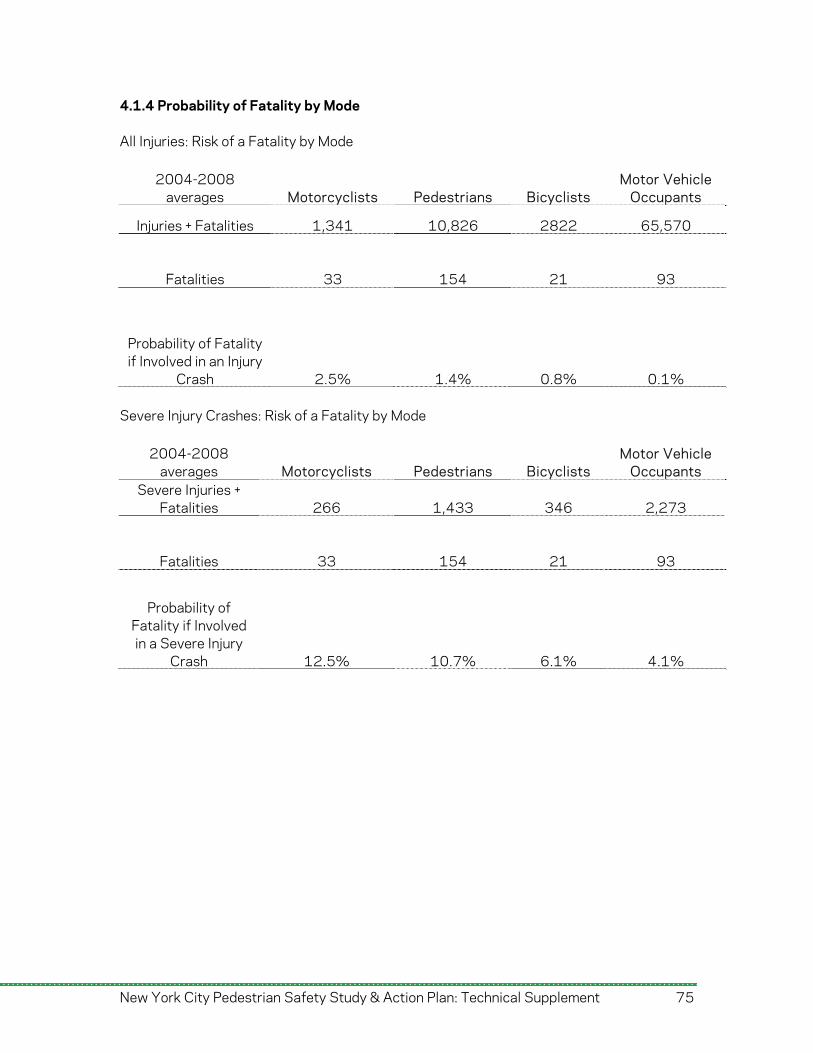
4.1.4 Probability of Fatality by Mode All Injuries: Risk of a Fatality by Mode
2004-2008 averages Motorcyclists Pedestrians Bicyclists
Motor Vehicle Occupants
Injuries + Fatalities 1,341 10,826 2822 65,570
Fatalities 33 154 21 93
Probability of Fatality if Involved in an Injury
Crash 2.5% 1.4% 0.8% 0.1% Severe Injury Crashes: Risk of a Fatality by Mode
2004-2008 averages Motorcyclists Pedestrians Bicyclists
Motor Vehicle Occupants
Severe Injuries + Fatalities 266 1,433 346 2,273
Fatalities 33 154 21 93
Probability of Fatality if Involved in a Severe Injury
Crash 12.5% 10.7% 6.1% 4.1%
New York City Pedestrian Safety Study & Action Plan: Technical Supplement 75
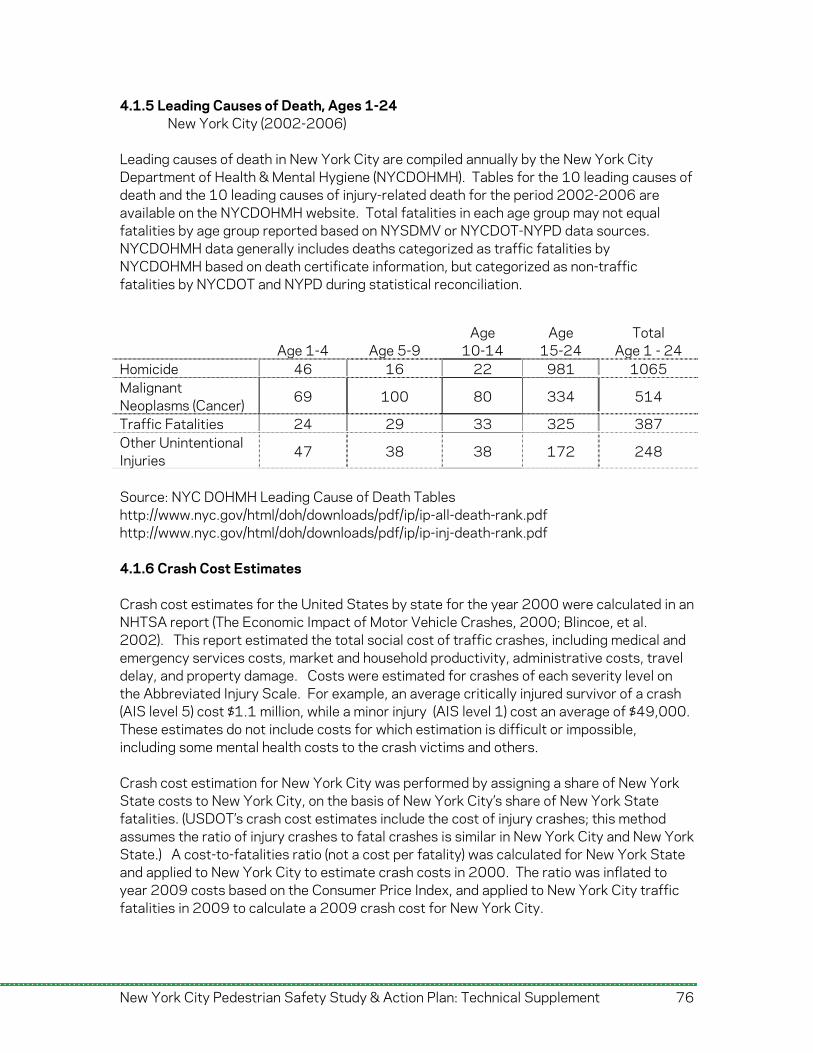
4.1.5 Leading Causes of Death, Ages 1-24 New York City (2002-2006)
Leading causes of death in New York City are compiled annually by the New York City Department of Health & Mental Hygiene (NYCDOHMH). Tables for the 10 leading causes of death and the 10 leading causes of injury-related death for the period 2002-2006 are available on the NYCDOHMH website. Total fatalities in each age group may not equal fatalities by age group reported based on NYSDMV or NYCDOT-NYPD data sources. NYCDOHMH data generally includes deaths categorized as traffic fatalities by NYCDOHMH based on death certificate information, but categorized as non-traffic fatalities by NYCDOT and NYPD during statistical reconciliation.
Age 1-4 Age 5-9 Age
10-14 Age
15-24 Total
Age 1 - 24 Homicide 46 16 22 981 1065 Malignant Neoplasms (Cancer) 69 100 80 334 514
Traffic Fatalities 24 29 33 325 387 Other Unintentional Injuries 47 38 38 172 248
Source: NYC DOHMH Leading Cause of Death Tables http://www.nyc.gov/html/doh/downloads/pdf/ip/ip-all-death-rank.pdf http://www.nyc.gov/html/doh/downloads/pdf/ip/ip-inj-death-rank.pdf 4.1.6 Crash Cost Estimates Crash cost estimates for the United States by state for the year 2000 were calculated in an NHTSA report (The Economic Impact of Motor Vehicle Crashes, 2000; Blincoe, et al. 2002). This report estimated the total social cost of traffic crashes, including medical and emergency services costs, market and household productivity, administrative costs, travel delay, and property damage. Costs were estimated for crashes of each severity level on the Abbreviated Injury Scale. For example, an average critically injured survivor of a crash (AIS level 5) cost $1.1 million, while a minor injury (AIS level 1) cost an average of $49,000. These estimates do not include costs for which estimation is difficult or impossible, including some mental health costs to the crash victims and others. Crash cost estimation for New York City was performed by assigning a share of New York State costs to New York City, on the basis of New York City’s share of New York State fatalities. (USDOT’s crash cost estimates include the cost of injury crashes; this method assumes the ratio of injury crashes to fatal crashes is similar in New York City and New York State.) A cost-to-fatalities ratio (not a cost per fatality) was calculated for New York State and applied to New York City to estimate crash costs in 2000. The ratio was inflated to year 2009 costs based on the Consumer Price Index, and applied to New York City traffic fatalities in 2009 to calculate a 2009 crash cost for New York City.
New York City Pedestrian Safety Study & Action Plan: Technical Supplement 76
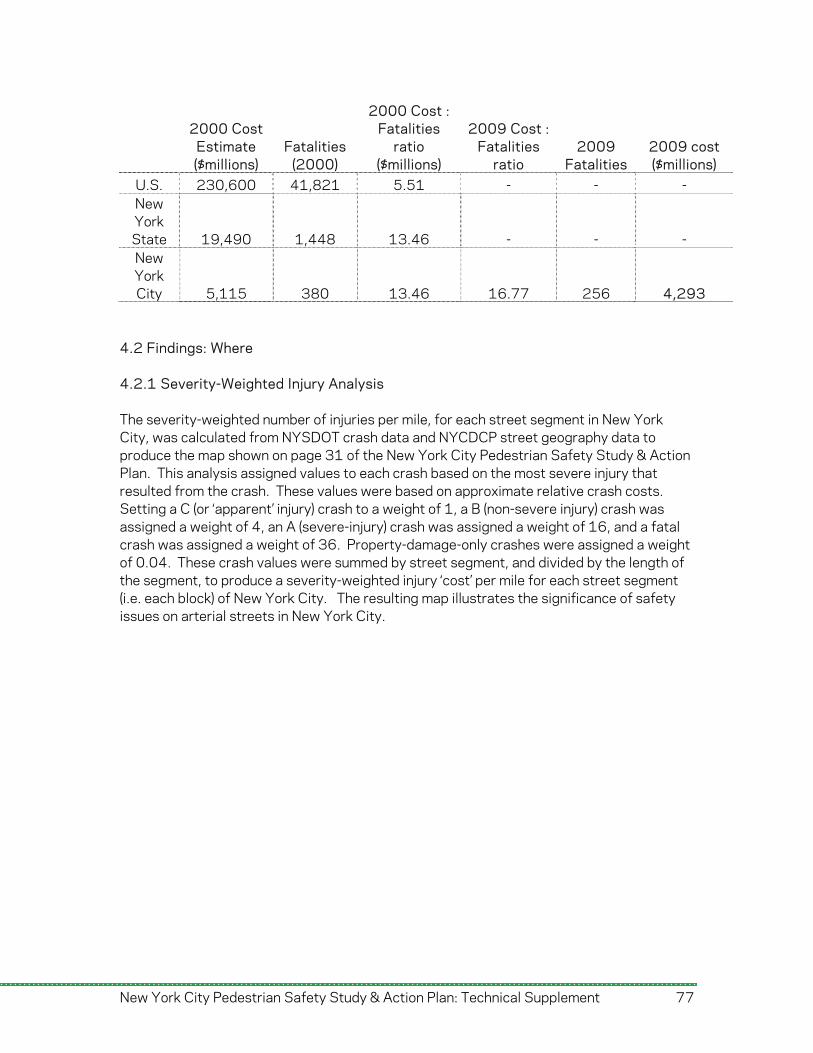
2000 Cost Estimate ($millions)
Fatalities (2000)
2000 Cost : Fatalities
ratio ($millions)
2009 Cost : Fatalities
ratio 2009
Fatalities 2009 cost ($millions)
U.S. 230,600 41,821 5.51 - - - New York State 19,490 1,448 13.46 - - - New York City 5,115 380 13.46 16.77 256 4,293
4.2 Findings: Where 4.2.1 Severity-Weighted Injury Analysis The severity-weighted number of injuries per mile, for each street segment in New York City, was calculated from NYSDOT crash data and NYCDCP street geography data to produce the map shown on page 31 of the New York City Pedestrian Safety Study & Action Plan. This analysis assigned values to each crash based on the most severe injury that resulted from the crash. These values were based on approximate relative crash costs. Setting a C (or ‘apparent’ injury) crash to a weight of 1, a B (non-severe injury) crash was assigned a weight of 4, an A (severe-injury) crash was assigned a weight of 16, and a fatal crash was assigned a weight of 36. Property-damage-only crashes were assigned a weight of 0.04. These crash values were summed by street segment, and divided by the length of the segment, to produce a severity-weighted injury ‘cost’ per mile for each street segment (i.e. each block) of New York City. The resulting map illustrates the significance of safety issues on arterial streets in New York City.
New York City Pedestrian Safety Study & Action Plan: Technical Supplement 77
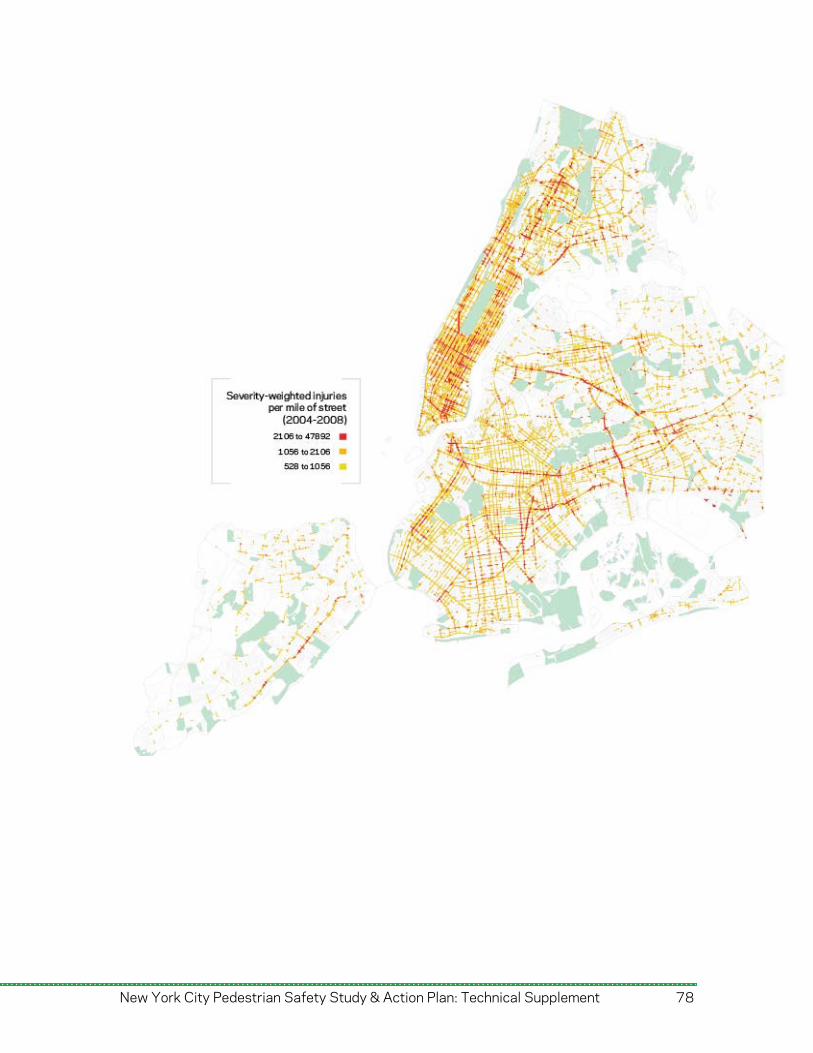
New York City Pedestrian Safety Study & Action Plan: Technical Supplement 78
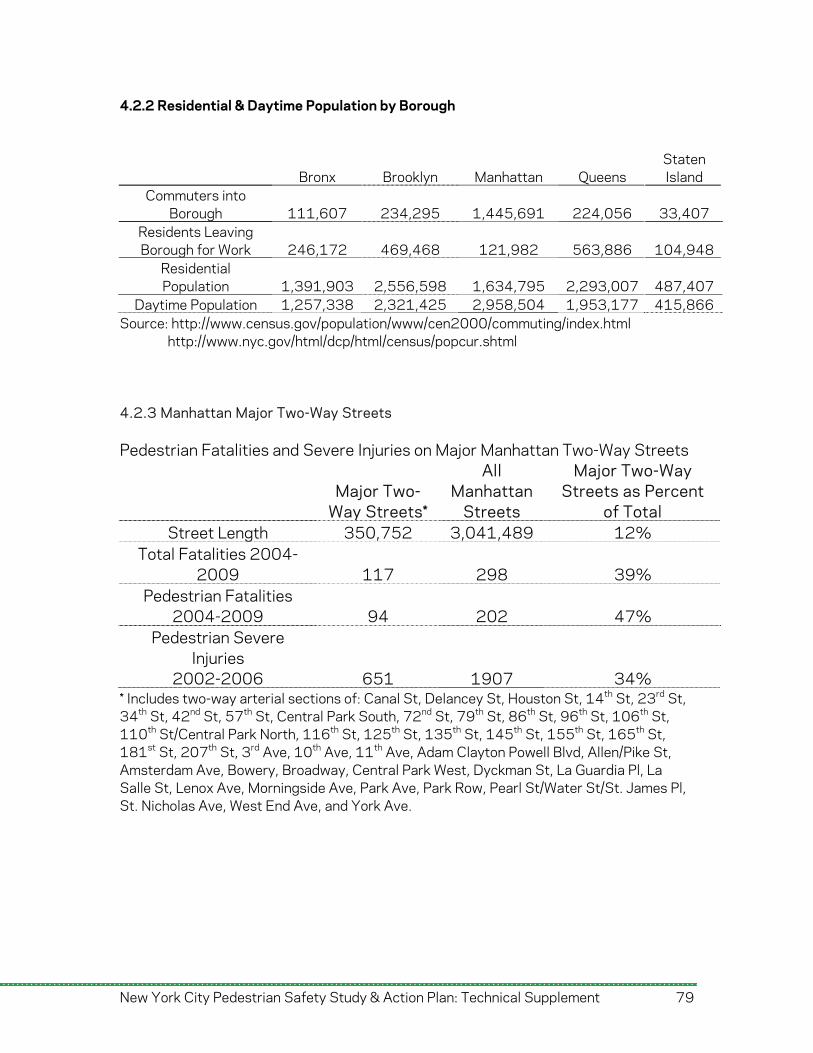
4.2.2 Residential & Daytime Population by Borough
Bronx Brooklyn Manhattan Queens Staten Island
Commuters into Borough 111,607 234,295 1,445,691 224,056 33,407
Residents Leaving Borough for Work 246,172 469,468 121,982 563,886 104,948
Residential Population 1,391,903 2,556,598 1,634,795 2,293,007 487,407
Daytime Population 1,257,338 2,321,425 2,958,504 1,953,177 415,866Source: http://www.census.gov/population/www/cen2000/commuting/index.html http://www.nyc.gov/html/dcp/html/census/popcur.shtml 4.2.3 Manhattan Major Two-Way Streets Pedestrian Fatalities and Severe Injuries on Major Manhattan Two-Way Streets
Major Two-
Way Streets*
All Manhattan
Streets
Major Two-Way Streets as Percent
of Total Street Length 350,752 3,041,489 12%
Total Fatalities 2004-2009 117 298 39%
Pedestrian Fatalities 2004-2009 94 202 47%
Pedestrian Severe Injuries
2002-2006 651 1907 34% * Includes two-way arterial sections of: Canal St, Delancey St, Houston St, 14th St, 23rd St, 34th St, 42nd St, 57th St, Central Park South, 72nd St, 79th St, 86th St, 96th St, 106th St, 110th St/Central Park North, 116th St, 125th St, 135th St, 145th St, 155th St, 165th St, 181st St, 207th St, 3rd Ave, 10th Ave, 11th Ave, Adam Clayton Powell Blvd, Allen/Pike St, Amsterdam Ave, Bowery, Broadway, Central Park West, Dyckman St, La Guardia Pl, La Salle St, Lenox Ave, Morningside Ave, Park Ave, Park Row, Pearl St/Water St/St. James Pl, St. Nicholas Ave, West End Ave, and York Ave.
New York City Pedestrian Safety Study & Action Plan: Technical Supplement 79
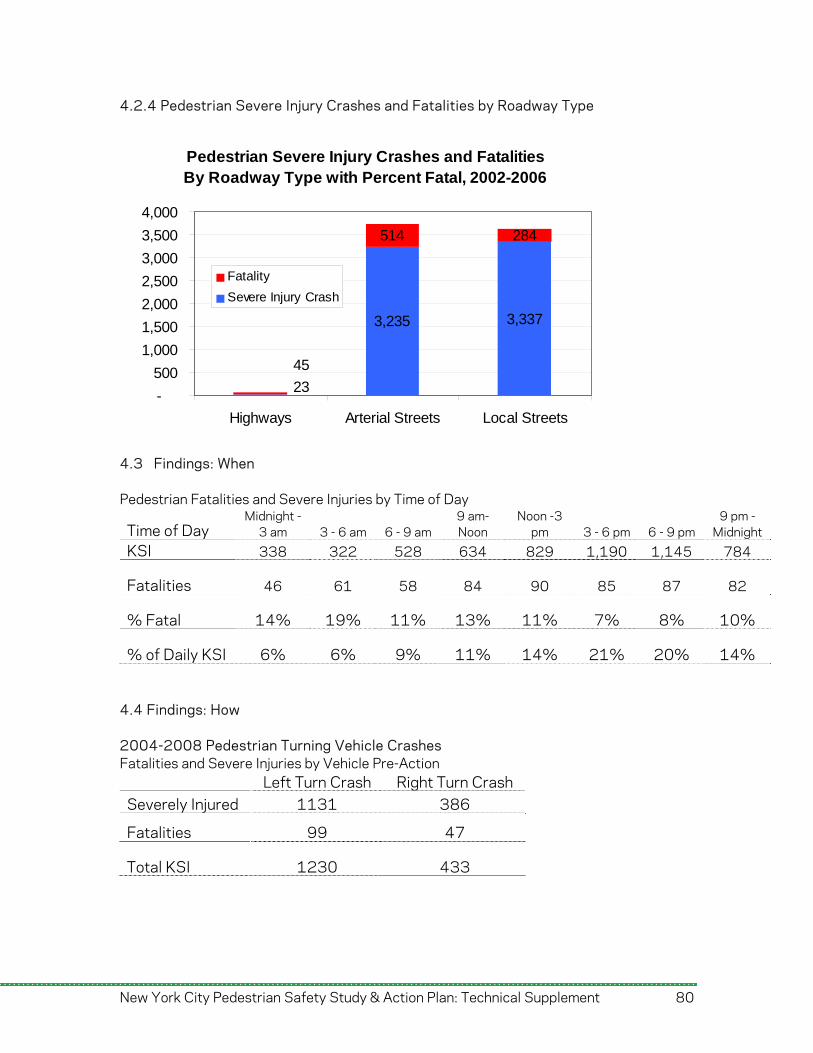
4.2.4 Pedestrian Severe Injury Crashes and Fatalities by Roadway Type
Pedestrian Severe Injury Crashes and FatalitiesBy Roadway Type with Percent Fatal, 2002-2006
3,235 3,337
514 284
23
45
-
500
1,000
1,500
2,000
2,500
3,000
3,500
4,000
Highways Arterial Streets Local Streets
Fatality
Severe Injury Crash
4.3 Findings: When Pedestrian Fatalities and Severe Injuries by Time of Day
Time of Day Midnight -
3 am 3 - 6 am 6 - 9 am 9 am-Noon
Noon -3 pm 3 - 6 pm 6 - 9 pm
9 pm -Midnight
KSI 338 322 528 634 829 1,190 1,145 784
Fatalities 46 61 58 84 90 85 87 82
% Fatal 14% 19% 11% 13% 11% 7% 8% 10%
% of Daily KSI 6% 6% 9% 11% 14% 21% 20% 14% 4.4 Findings: How 2004-2008 Pedestrian Turning Vehicle Crashes Fatalities and Severe Injuries by Vehicle Pre-Action
Left Turn Crash Right Turn Crash Severely Injured 1131 386
Fatalities 99 47
Total KSI 1230 433
New York City Pedestrian Safety Study & Action Plan: Technical Supplement 80
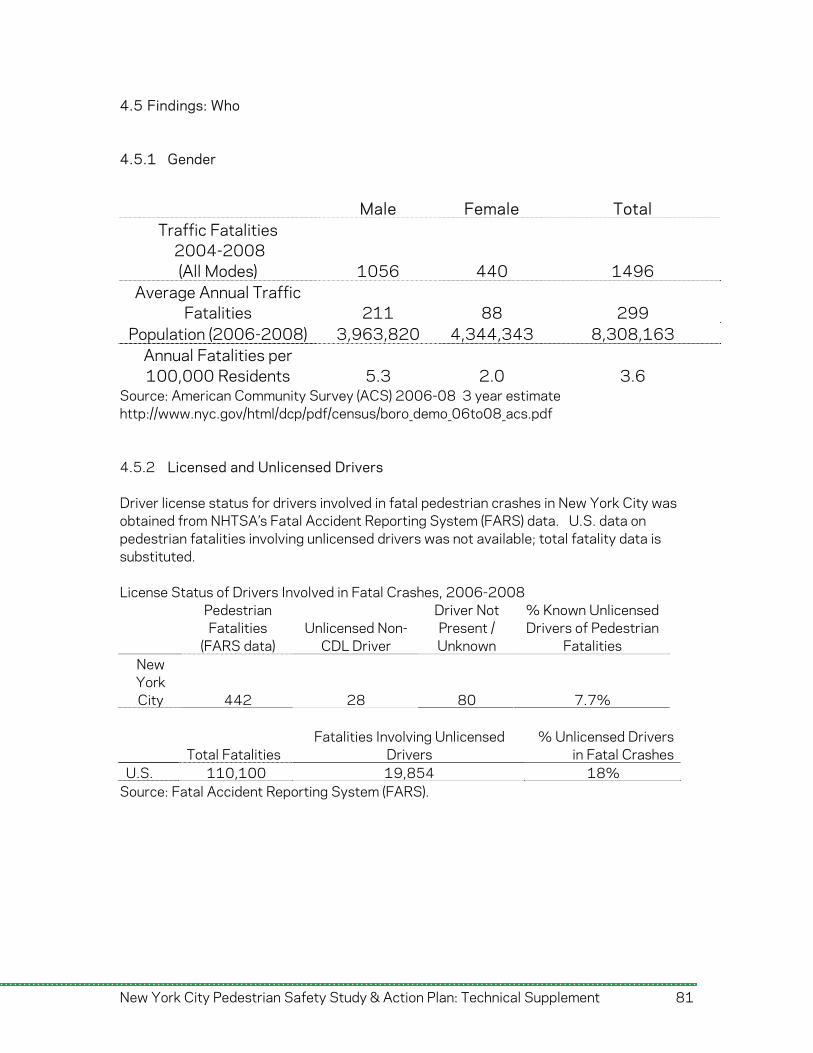
4.5 Findings: Who 4.5.1 Gender
Male Female Total Traffic Fatalities
2004-2008 (All Modes) 1056 440 1496
Average Annual Traffic Fatalities 211 88 299
Population (2006-2008) 3,963,820 4,344,343 8,308,163 Annual Fatalities per 100,000 Residents 5.3 2.0 3.6
Source: American Community Survey (ACS) 2006-08 3 year estimate http://www.nyc.gov/html/dcp/pdf/census/boro_demo_06to08_acs.pdf 4.5.2 Licensed and Unlicensed Drivers Driver license status for drivers involved in fatal pedestrian crashes in New York City was obtained from NHTSA’s Fatal Accident Reporting System (FARS) data. U.S. data on pedestrian fatalities involving unlicensed drivers was not available; total fatality data is substituted. License Status of Drivers Involved in Fatal Crashes, 2006-2008
Pedestrian Fatalities
(FARS data) Unlicensed Non-
CDL Driver
Driver Not Present / Unknown
% Known Unlicensed Drivers of Pedestrian
Fatalities New York City 442 28 80 7.7%
Source: Fatal Accident Reporting System (FARS).
Total Fatalities Fatalities Involving Unlicensed
Drivers % Unlicensed Drivers
in Fatal CrashesU.S. 110,100 19,854 18%
New York City Pedestrian Safety Study & Action Plan: Technical Supplement 81
The New York City
Pedestrian Safety
Study & Action Plan:
Technical Supplement
Unified Planning Work Program
PTDT09D00.T01, PTDT10D00.H24
Study of Pedestrian Fatalities and Severe Injury Accidents in New York City
Contract No. D000642
The preparation of this report has been financed in part through funds from the U.S.
Department of Transportation, Federal Highway Administration under the Federal Highway
Act of 1965, as amended, and the Urban Mass Transportation Act of 1964, as amended.
The New York City Department of Transportation disseminates this document in the
interest of information exchange. It reflects the views of the New York City Department of
Transportation (NYCDOT) which is responsible for the facts and the accuracy of the data
presented. The report does not necessarily reflect any official views or policies of the
Federal Highway Administration, or the State of New York. This report does not constitute
a standard, specification, or regulation.
New York City Pedestrian Safety Study & Action Plan: Technical Supplement 82
New York City Pedestrian Safety Study & Action Plan: Technical Supplement 83
New York City Department of Transportation Janette Sadik-Khan, Commissioner Lori Ardito, First Deputy Commissioner Gerard Soffian, P.E., Deputy Commissioner, Traffic Operations Division Ryan Russo, Assistant Commissioner, Traffic Management Ann Marie Doherty, Chief of Research, Implementation, & Safety Matthew Roe, Office of Research, Implementation, & Safety
Rob Viola, Office of Research, Implementation, & Safety Research Team Principal Investigator: Hyeon-Shic Shin, Ph.D. NYU Wagner Rudin Center for Transportation Policy and Management Co-Principal Investigators:
Alan Blatt, CUBRC Greg Chen, Ph.D., Baruch College Kevin Majka, CUBRC
Anthony Shorris, NYU Wagner Rudin Center Satish Ukkusuri, Purdue University
Contributing Researchers:
Gregory Holisko, NYU Wagner Rudin Center Gitakrishnan Ramadurai, Ph.D. Rensselaer Polytechnic University
Jhael Isa Tavarez, Rensselaer Polytechnic University This report was prepared by the New York City Department of Transportation and the NYU Wagner Rudin Center for Transportation Policy and Management. Additional assistance was provided by Solomon Assefa and the staff of the Office of Safety Education of NYCDOT; the Office of Vital Statistics of the New York City Department of Health and Mental Hygiene, the Office of Modal Safety of the New York State Department of Transportation; the New York State Department of Health; the New York State Department of Motor Vehicles; and the Institute for Traffic Safety Management and Research at the University of Albany. Suggested Citation Roe M., Shin H., Ukkusuri S., Blatt A., Majka K, et al. The New York City Pedestrian Safety Study and Action Plan Technical Supplement. New York City Department of Transportation: August 2010.