The New Millennium · Millennium’s share price was hit by an Ore Reserve impairment in December...
24
The New Millennium Resources Rising Stars Presentation – September 2015 Page: 1 ASX: MOY
Transcript of The New Millennium · Millennium’s share price was hit by an Ore Reserve impairment in December...

The New Millennium Resources Rising Stars Presentation – September 2015
Page: 1
ASX: MOY

Disclaimer
This presentation contains only a brief overview of Millennium Minerals Limited (“Millennium”). The
contents of this presentation, including matters relating to the geology of Millennium’s projects, may
rely on various assumptions and subjective interpretations which it is not possible to detail in this
presentation and which have not been subject to any independent verification.
This presentation contains a number of forward looking statements. Known and unknown risks and
uncertainties, and factors outside of Millennium’s control, may cause the actual results, performance
and achievements of Millennium to differ materially from those expressed or implied in this
presentation.
To the extent permitted by law, Millennium does not warrant the accuracy, currency or completeness
of the information in this presentation, nor the future performance of Millennium, and will not be
responsible for any loss or damage arising from the use of information.
The information contained in this presentation is not suitable for detailed investigation or analysis of
any particular issue. Current and potential investors and shareholders should seek independent
advice before making any investment decision in regard to Millennium or its activities.
Page: 2

The Nullagine Gold Project
► Flagship project located 185 km north of Newman in WA’s Pilbara region
► Strategic landholding of 240 km2 in a highly prospective gold district
► Extensive infrastructure in place including 140-man camp, open pit mines and
near-new 1.5 Mtpa plant:
► Constructed in 2012 for initial capital cost of $89 million
► Currently performing ~25% above nameplate capacity
► 2015 production guidance 80,000 oz-83,000 oz at AISC of $1200/oz-$1250/oz
► Exploration strategy taking shape – significant exploration potential
Page: 3

Page: 4
Corporate Overview
Management
Glenn Dovaston Chief Executive Officer
Richard Hill Chief Financial Officer
Pierre Malherbe Company Secretary
Board
Richard Procter Non Executive Chairman
Michael Chye Non Executive Director
Ross Gillon Non Executive Director
Greg Bittar Executive Director
Corporate Snapshot
ASX Code MOY
Shares on Issue 217 M
Share Price (at 21/09/15) $0.065
Market Capitalisation ~$14.1 M
Cash at 30 June 20151 $3.3 M
Debt at 30 September 2015 $21.8 M
Senior Bank Debt $6.1 M
Subordinated IMC Debt $13.6 M
Finance Lease $2.1 M
Enterprise Value $32.6 M
Major Shareholders
IMC Group 34.6%
David Teoh 5.9%
Other 59.5%
1. Including 751oz Bullion

Share price slumped following operational problems, which have now been rectified
Reconciliation issues at Golden Eagle due to geological complexity and operational problems
Millennium’s share price was hit by an Ore Reserve impairment in December 2014
Glenn Dovaston’s appointment as CEO – launched an immediate cost-cutting campaign covering every aspect of the business
Updated Mineral Resource and Ore Reserve for the Nullagine Gold Project and announcement of asset impairment
Ramped up processing plant productivity – now operating in excess of nameplate capacity at 1.9 Mtpa
Record production in the June 2015 Quarter – 21,664 oz at AISC of $1254/oz
CY 2015 guidance upgraded to 80,000 oz-83,000 oz at AISC $1200/oz-$1250/oz
Bank debt to be reduced to $6.1 M by end of September 2015 – on track to eliminate bank debt by Q1 2016
The Turnaround Story – the Investment Opportunity
Page: 5
Appointment of Glenn Dovaston as CEO
3
Mineral Resource and Ore Reserve update and impairment
4
2015 Production guidance and turnaround underway
5
Record June Quarter Production
6
Production guidance increased
7
2
3
4
5
6
7
8
1
Bank Debt reduced to $6.1M
8
Announcement of Ore Reserve impairment
2
Start of significant production problems
1

The Key Drivers in the Turnaround – what has changed?
Page: 6
► Management restructure
► a new team in place
► Reduction of personnel
► Optimising processing flow
► Reducing costs
► Optimise mining practices
► Improved overall mining fleet
productivity
► Improved understanding of
geological complexities and
mineralisation controls
► Developed a site culture of
inclusion
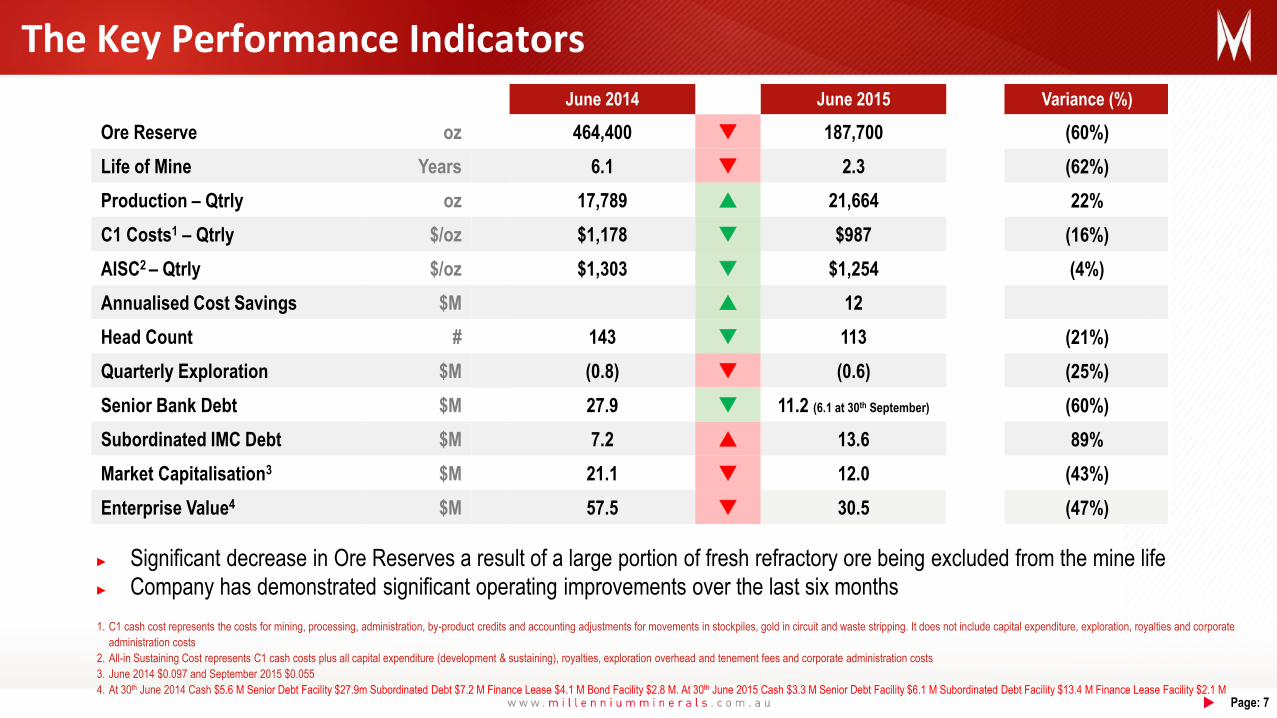
June 2014 June 2015 Variance (%)
Ore Reserve oz 464,400 187,700 (60%)
Life of Mine Years 6.1 2.3 (62%)
Production – Qtrly oz 17,789 21,664 22%
C1 Costs1 – Qtrly $/oz $1,178 $987 (16%)
AISC2 – Qtrly $/oz $1,303 $1,254 (4%)
Annualised Cost Savings $M 12
Head Count # 143 113 (21%)
Quarterly Exploration $M (0.8) (0.6) (25%)
Senior Bank Debt $M 27.9 11.2 (6.1 at 30th September) (60%)
Subordinated IMC Debt $M 7.2 13.6 89%
Market Capitalisation3 $M 21.1 12.0 (43%)
Enterprise Value4 $M 57.5 30.5 (47%)
The Key Performance Indicators
1. C1 cash cost represents the costs for mining, processing, administration, by-product credits and accounting adjustments for movements in stockpiles, gold in circuit and waste stripping. It does not include capital expenditure, exploration, royalties and corporate
administration costs
2. All-in Sustaining Cost represents C1 cash costs plus all capital expenditure (development & sustaining), royalties, exploration overhead and tenement fees and corporate administration costs
3. June 2014 $0.097 and September 2015 $0.055
4. At 30th June 2014 Cash $5.6 M Senior Debt Facility $27.9m Subordinated Debt $7.2 M Finance Lease $4.1 M Bond Facility $2.8 M. At 30th June 2015 Cash $3.3 M Senior Debt Facility $6.1 M Subordinated Debt Facility $13.4 M Finance Lease Facility $2.1 M Page: 7
► Significant decrease in Ore Reserves a result of a large portion of fresh refractory ore being excluded from the mine life
► Company has demonstrated significant operating improvements over the last six months

Key Cash Flows 1 Gold Production and Cash Costs
Cost-cutting and productivity drive resulted in increased operating cash-flow in the March and June 2015 quarters on the
back of increased production and lower costs, putting the turnaround strategy firmly in place.
Page: 8
Operational Turnaround Delivering Benefits
1. Free Cash Flows defined as Operating Cash Flows plus Investing Cash Flows before Financing Payments
► CY 2015 guidance upgraded in August to 80,000 oz-83,000 oz at AISC $1200/oz-$1250/oz

EV/EBITDA FY15¹
FY15 PE¹
Millennium compares favourably to its peers on an PE and EV/ EBITDA basis
1. Source: Bloomberg
Operational Turnaround Not Yet Reflected in Market Valuation
Page: 9
0.0
2.0
4.0
6.0
8.0
10.0
12.0
SAR DRM RRL NST EVN SLR SBM RMS MOY
x
Avg: 6.2x
0.00
1.00
2.00
3.00
4.00
5.00
6.00
EVN RRL SAR SBM NST DRM MOY RMS
x
Avg: 3.1x
Page: 10
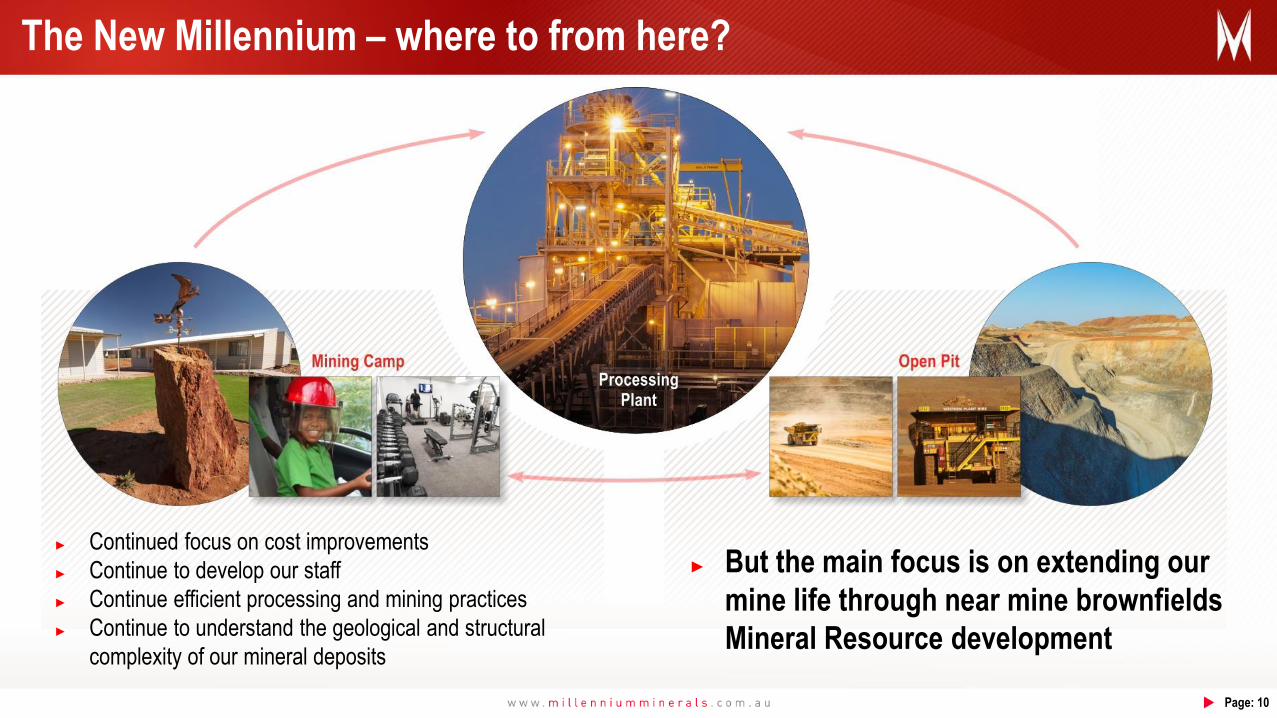
The New Millennium – where to from here?
► Continued focus on cost improvements
► Continue to develop our staff
► Continue efficient processing and mining practices
► Continue to understand the geological and structural
complexity of our mineral deposits
► But the main focus is on extending our
mine life through near mine brownfields
Mineral Resource development

Page: 11
► Limited exploration drilling over
the past five years
► Priority focus on the endowed
Middle Creek Fault
► in areas of structural
complexity
► close to existing
infrastructure
► Multiple targets defined -
advanced resource drill-out
opportunities through to
brownfield targets
► Discoveries can be rapidly
transformed into a mining
operations
► Leveraging existing plant
and infrastructure
The Exploration Opportunity

Nullagine Gold Project Near Mine Targets – Golden Eagle
► Historic production of [email protected]/t Au
for 174koz - located adjacent to the
Processing Plant
► Two targets (GE SW #1 and GE SW #2)
both on very high amplitude (>100 ppb
Au) soil anomalies
► GE SW #1 - interpreted strike extension
of the GE pit main lode
► GE SW #2 is sub-parallel to the Golden
Eagle mineralisation
► Multiple wider but lower grade RAB
intersections along strike from target
areas
Page: 12

Nullagine Gold Project Near-Mine Targets – Au81
► Historic production of 270 kt for 11 k ounces - only 2.5 km from processing plant
► Localised structural complexity associated with MCF with strong geochemical signature
► Two well defined exploration targets in a similar structural and geochemical setting to the
main Au81 zone along strike (N & S) as well as sub-parallel trends to the west.
Page: 13

Nullagine Gold Project Near Mine Targets – Condor
► Limited RAB drilling covering NW extension has returned very
encouraging results (4 m @ 4.6 g/t Au & 8 m @ 1.9 g/t Au).
► Mapping and rock chipping (up to 37.3 g/t Au ) already confirms
additional parallel mineralised lodes
► Located in the Golden Gate camp - south of Blue Spec Fault Zone
► Generally hosts higher grade open pit resources as seen at
nearby Major Crow-ABC Reef-Harrier
► Condor structure is parallel to the Crow-ABC Reef-Harrier trend.
Page: 14

Page: 15
The Pipeline of Opportunity – Middle Creek Mineralised Corridor

► Opportunity for investors to gain low-cost exposure to existing WA gold producer
with significant exploration upside
► Operational and financial turnaround well underway:
► Production of 41,721 oz for 6 months to 30 June
► Forecast 2015 production 80,000 oz-83,000 oz at AISC of $1200-1250/oz1
► Growing operating cash flows due to tight cost control and increasing production
► $6.1 M of senior bank debt by end of September – senior debt retired 31/03/16
► Strategic infrastructure including 1.5 Mtpa CIL plant – only plant in the region
► Aggressive exploration campaign planned to extend mine life – 240 km2 of barely-
explored exploration acreage:
► Pipeline of drill-ready, near-mine exploration targets defined within close proximity to the
plant
► Drilling will target extensions to existing mineralisation as well as several new targets
Page: 16
Summary – The New Millennium
Page: 16
1. All-in Sustaining Cost represents C1 cash costs plus all capital expenditure (development & sustaining), royalties, exploration overhead and tenement fees and corporate administration costs
The New Millennium Resources Rising Stars Presentation – September 2015
Page: 17
ASX: MOY

Page: 18
Appendices – Results Table, JORC 2012 - Table 1, Ore Reserve Estimate
Table containing material drilling information about the historic intersections shown in the presentation.
Prospect Hole Drill Type GDA East (mE)
GDA North (mN)
RL (m)
Azm (deg)
Dip (deg)
Depth (m)
From (m)
To (m)
Length (m)
Au (g/t)
Lower cut-off ( Au g/t)
Comments
Au81 East A01RB04 RAB 206584 7570125 402 120 -60 41 1 4 3 0.91 0.5
Au81 East A01RB04 RAB 206584 7570125 402 120 -60 41 29 37 8 2.31 0.5
Au81 East ARAB08 RAB 206226 7569285 412 90 -60 45 34 38 4 1.30 0.5
Au81 East ARAB09 RAB 206248 7569285 412 92 -60 45 2 10 8 1.14 0.5
Au81 East KCB33 Water Expl. 205711 7569512 401 360 -90 130 40 48 8 0.84 0.5
Au81 East KCB33 Water Expl. 205711 7569512 401 360 -90 130 72 76 4 1.07 0.5
Au81 East KCB33 Water Expl. 205711 7569512 401 360 -90 130 84 92 8 1.44 0.5
Condor NW CORB0035 RAB 232364 7586109 434 230 -60 50 0 8 8 0.92 0.5
Condor NW CORB0036 RAB 232345 7586131 431 235 -60 50
NSA 0.5 No significant assays.
Condor NW CORB0037 RAB 232316 7586179 421 232 -60 50 12 16 4 4.79 0.5
Condor NW CORB0037 RAB 232316 7586179 421 232 -60 50 36 44 8 1.88 0.5
GE SW #1 GERB0664 RAB 201747 7567327 434 155 -60 40 12 20 8 1.27 0.5
GE SW #1 GERB1164 RAB 201015 7566986 398 158 -60 40 0 4 4 0.88 0.5
GE SW #2 GERB0584 RAB 201805 7566907 416 155 -60 40 16 40 24 0.59 0.1
GE SW #2 GERB0594 RAB 201891 7567044 421 155 -60 78 0 8 8 0.29 0.1
GE SW #2 GERB0594 RAB 201891 7567044 421 155 -60 78 28 44 16 0.83 0.1
GE SW #2 GERB0594 RAB 201891 7567044 421 155 -60 78 76 78 2 0.30 0.1
GE SW #2 GERB0629 RAB 201682 7566885 430 155 -60 70 36 60 24 0.42 0.1
*Bold intersections are on maps and/or cross-sections in the presentation.

Page: 19
JORC 2012 Edition - Table 1 Section 1 Sampling Techniques and Data
Criteria JORC Code Explanation Commentary
Sampling techniques
Nature and quality of sampling (e.g. cut channels, random chips, or specific specialised industry standard measurement tools appropriate to the minerals under investigation, such as down hole gamma sondes, or handheld XRF instruments, etc). These examples should not be taken as limiting the broad meaning of sampling.
Include reference to measures taken to ensure sample representatively and the appropriate calibration of any measurement tools or systems used.
Aspects of the determination of mineralisation that are Material to the Public Report.
In cases where ‘industry standard’ work has been done this would be relatively simple (e.g. ‘reverse circulation drilling was used to obtain 1 m samples from which 3 kg was pulverised to produce a 30 g charge for fire assay’). In other cases more explanation may be required, such as where there is coarse gold that has inherent sampling problems. Unusual commodities or mineralisation types (e.g. submarine nodules) may warrant disclosure of detailed information.
Rock chip samples were taken for exploration purposes to define any mineralised zones and not to be used any mineral resource estimate.
Historic Rotary Air Blast (RAB) was often composited to 4m, using the scoop or spear method from which the sample was dried, crushed, pulverised and subsampled at the laboratory to produce a 40 g charge for Aqua Regia, as per industry standard methods.
Drilling techniques
Drill type (e.g. core, reverse circulation, open-hole hammer, rotary air blast, auger, Bangka, sonic, etc) and details (e.g. core diameter, triple or standard tube, depth of diamond tails, face-sampling bit or other type, whether core is oriented and if so, by what method, etc).
Drill information presented is previous RAB drilling conducted by Wedgetail Exploration NL or other parties.
Drill sample recovery
Method of recording and assessing core and chip sample recoveries and results assessed.
Measures taken to maximise sample recovery and ensure representative nature of the samples.
Whether a relationship exists between sample recovery and grade and whether sample bias may have occurred due to preferential loss/gain of fine/coarse material.
For the RAB drilling carried out by Wedgetail Exploration NL the field assistants qualitatively captured the sample recovery and moisture content.
There is no observed correlation between sample recovery and gold grade.
Logging Whether core and chip samples have been geologically and geotechnically logged to a level of detail to support appropriate Mineral Resource estimation, mining studies and metallurgical studies.
Whether logging is qualitative or quantitative in nature. Core (or costean, channel, etc) photography.
The total length and percentage of the relevant intersections logged.
The logging has been validated and is regarded as being comprehensive and of a good quality.
Geological logging is both qualitative and quantitative in nature. Whilst drilling the lithology, colour, grain size, regolith, alteration, weathering, veining and mineralisation were recorded. Sulphide and vein content were logged as a percentage of the interval.

Page: 20
Sub-sampling techniques and sample preparation
If core, whether cut or sawn and whether quarter, half or all core taken.
If non-core, whether riffled, tube sampled, rotary split, etc and whether sampled wet or dry.
For all sample types, the nature, quality and appropriateness of the sample preparation technique.
Quality control procedures adopted for all sub-sampling stages to maximise representivity of samples.
Measures taken to ensure that the sampling is representative of the in situ material collected, including for instance results for field duplicate/second-half sampling.
Whether sample sizes are appropriate to the grain size of the material being sampled.
The RAB drilling was sampled by either using the scoop or spear method to produce four metre composite samples.
The sample preparation followed industry best practice in sample preparation involving oven drying, crushing (core) and pulverisation of the entire subsample (total prep), and LM5 grinding to a grind size of 85% passing 75 micron.
The sample sizes are industry-standard and considered to be appropriate to correctly represent mineralisation at the deposits based on: the style of mineralisation, the thickness and consistency of the intersections, the sampling methodology and assay ranges for gold.
Quality of assay data and laboratory tests
The nature, quality and appropriateness of the assaying and laboratory procedures used and whether the technique is considered partial or total.
For geophysical tools, spectrometers, handheld XRF instruments, etc, the parameters used in determining the analysis including instrument make and model, reading times, calibrations factors applied and their derivation, etc.
Nature of quality control procedures adopted (e.g. standards, blanks, duplicates, external laboratory checks) and whether acceptable levels of accuracy (i.e. lack of bias) and precision have been established.
The majority of the previous RAB drilling was analysed using a 40g assay charge that was digested by an Aqua Regia solution and utilised an Induced Coupled Plasma Mass Spectrometer (ICP-MS) for Au and multi-element determination.
Commercially prepared, predominantly matrix-matched blanks, low, medium & high value certified reference QAQC standard, blanks, assay laboratory and field duplicate samples were inserted at a rate of 1:20 into the sample stream
The QAQC results from this protocol were considered to be acceptable.
No geophysical tools were used to determine any element concentrations used for these results.
Sample preparation checks for fineness were carried out by the laboratory as part of their internal procedures to ensure the grind size of 85% passing 75 micron was being attained. Laboratory QAQC involves the use of internal lab standards using certified reference material, blanks, splits and replicates as part of the in house procedures.
Results highlight that sample assay values are accurate and that contamination has been contained.
Verification of sampling and assaying
The verification of significant intersections by either independent or alternative company personnel.
The use of twinned holes.
Documentation of primary data, data entry procedures, data verification, data storage (physical and electronic) protocols.
Discuss any adjustment to assay data.
No further drilling has been carried out to verify previous drill results.
Assay results were not adjusted.

Page: 21
Location of data points
Accuracy and quality of surveys used to locate drill holes (collar and down-hole surveys), trenches, mine workings and other locations used in Mineral Resource estimation.
Specification of the grid system used.
Quality and adequacy of topographic control.
Previous RAB collars were only located with a handheld GPS and it is expected that a location error of 5 to 10m would exist. These holes will not be used in a mineral resource estimate.
Grid datum is GDA94 51K (East Pilbara).
RAB holes did not have any down hole surveying carried out. These holes will not be used in a mineral resource estimate.
Aerial Photogrammetry± LIDAR was produced by Fugro Surveys (±0.2m vertical & ±0.1m horizontal). Survey control points were marked out by licensed surveyor for the Fugro Survey. An error was noted in early RAB drilling collar RL co-ordinates (ellipsoid not geoid model); these holes were adjusted to the Fugro DTM surface RL and recorded as DTM RL in the SQL database; the original survey RL was retained. Otherwise there was good agreement of surveyed collars and Fugro DTM.
Data spacing and distribution
Data spacing for reporting of Exploration Results.
Whether the data spacing and distribution is sufficient to establish the degree of geological and grade continuity appropriate for the Mineral Resource and Ore Reserve estimation procedure(s) and classifications applied.
Whether sample compositing has been applied.
RAB drill spacing was variable at each of the prospects. The density of drilling is illustrated on the maps in the presentation.
No mineral resource estimates have been carried out at these prospects.
Orientation of data in relation to geological structure
Whether the orientation of sampling achieves unbiased sampling of possible structures and the extent to which this is known, considering the deposit type.
If the relationship between the drilling orientation and the orientation of key mineralised structures is considered to have introduced a sampling bias, this should be assessed and reported if material.
Geological mapping and structural measurements have been taken at the prospects and they confirm the orientation of mineralisation defined by the drilling. Based upon the above information the drilling was largely perpendicular to the mineralisation with some exceptions. This was due to steep and inaccessible terrain that meant holes needed to be drilled slightly oblique to the mineralisation to intersect the desired target.
No significant orientation bias has been identified in the data at this point.
Sample security
The measures taken to ensure sample security. Sample were given an ID, cross checked by field personnel that the interval assigned was matched, packed and then the geologist on the rig will check sample ID. The laboratory assigned the same sample ID to the pulps and checking against geology, alteration and further use of QAQC to confirm data ID.
Samples were collected on completion of each hole and stored in a secure shed prior to dispatch to the assay laboratory.
Monitoring of sample dispatch was undertaken for samples sent from site and to confirm that samples have arrived in their entirety and intact at their destination.
Sample security is managed with dispatch dates noted for each samples by the core technician, this is checked and confirmed at the laboratory on receipt of samples and discrepancies are corrected via telephone link up with laboratory and project geologist
Audits or reviews
The results of any audits or reviews of sampling techniques and data. Internal lab audits conducted by Millennium have shown no material issues.
Sampling and data protocols have been externally audited by CSA Global with no matters that were serious or were likely to impair the validity of the Mineral Resource estimate.

Page: 22
Section 2 Reporting of Exploration Results (Criteria listed in the preceding section also apply to this section.)
Criteria JORC Code Explanation Commentary
Mineral tenement and land tenure status
Type, reference name/number, location and ownership including agreements or material issues with third parties such as joint ventures, partnerships, overriding royalties, native title interests, historical sites, wilderness or national park and environmental settings. The security of the tenure held at the time of reporting along with any known impediments to obtaining a licence to operate in the area.
All the prospects lie within fully granted Mining Leases within the Pilbara Gold Field (46), as detailed below. All the tenements are in good standing with no known impediments.
Golden Eagle SW 1 & 2^ - M46/186 & M46/300 (100% Millennium);
Condor NW*# - M46/200;
Au81 East^ –M46/138 (100% Millennium); ^ These tenements are located within the Palyku title claim (WC99/16). *These tenements are located within the Njamal title claim (WC99/8). #The Golden Gate and Bartons tenements are the subject of a mining licence agreement whereby Millennium has the sole and exclusive right to explore and mine gold and other minerals. Millennium then is required to pay 25% of the net proceeds to the tenement owners (Livestock Marketing Pty Ltd, Duncan Thomas Young, Simba Holdings Pty Ltd and Ronald Lane Swinney) after mining and processing cost deductions.
Exploration done by other parties
Acknowledgment and appraisal of exploration by other parties. Exploration by other parties has been reviewed and taken into account when exploring. Previous parties conducted soil sampling, rock chip sampling, RAB & RC drilling and mapping.
Geology Deposit type, geological setting and style of mineralisation. The Nullagine Project and CC JV deposits are structurally controlled, sediment hosted, lode Au style of deposit. They are all situated in the Mosquito Creek Basin that consists predominantly of Archean aged, turbidite sequences of sandstones, siltstones and shales.

Page: 23
Drill hole Information
A summary of all information material to the understanding of the exploration results including a tabulation of the following information for all Material drill holes: o easting and northing of the drill hole collar o elevation or RL (Reduced Level – elevation above sea level in metres) of the
drill hole collar o dip and azimuth of the hole o down hole length and interception depth o hole length.
If the exclusion of this information is justified on the basis that the information is not Material and this exclusion does not detract from the understanding of the report, the Competent Person should clearly explain why this is the case.
Provided in a table that relates exploration results to the drill hole information including: hole co-ordinates, RL, dip, azimuth, end of hole depth, downhole length, interception depths and lower grade cut-off used to derive significant intersections.
Data aggregation methods
In reporting Exploration Results, weighting averaging techniques, maximum and/or minimum grade truncations (e.g. cutting of high grades) and cut-off grades are usually Material and should be stated.
Where aggregate intercepts incorporate short lengths of high grade results and longer lengths of low grade results, the procedure used for such aggregation should be stated and some typical examples of such aggregations should be shown in detail.
The assumptions used for any reporting of metal equivalent values should be clearly stated.
All of the exploration prospects have their significant intersections reported with a lower cut-off of 0.5g/t Au and maximum of 4m of internal dilution (for 4 metre composited holes) , except for the Golden Eagle SW #2 target, which uses a 0.1g/t Au lower cut-off. This due to the wider and lower grade mineralisation identified to date at this target, which the mineralisation appears to be more diffuse than the other prospects.
No metal equivalents were used.
Relationship between mineralisation widths and intercept lengths
These relationships are particularly important in the reporting of Exploration Results.
If the geometry of the mineralisation with respect to the drill hole angle is known, its nature should be reported.
If it is not known and only the down hole lengths are reported, there should be a clear statement to this effect (e.g. ‘down hole length, true width not known’).
Only selected historic exploration data relating to the included targets and prospects has been presented.
The relationships between the quoted intersections are shown on the relevant cross-sections within the presentation. Most of the drilling is orthogonal to the mineralisation; however, in early exploration the dip direction is sometimes uncertain and thus holes some holes can be drilled sub-parallel to the mineralisation producing longer and higher grade intersection than the true intercept.
The majority drill hole orientations to the ore zones have ensured accurate interpretations and 3D modelling.
Diagrams Appropriate maps and sections (with scales) and tabulations of intercepts should be included for any significant discovery being reported These should include, but not be limited to a plan view of drill hole collar locations and appropriate sectional views.
Significant exploration results are tabulated in the presentation with drill hole plans and sections included in the presentation to show them in context.
A number of representative maps and sections have been included in the presentation along with documentation.

Page: 24
Competent Persons Statement – Exploration Results
Mr Andrew Dunn (MAIG), a geologist employed full-time by Millennium Minerals Limited, compiled the technical aspects of this Report. Mr Dunn is a member
of the Australian Institute of Geoscientists and has sufficient experience that is relevant to this style of mineralization and type of deposit under consideration
and to the activity that is being reported on to qualify as a Competent Person as defined in the 2012 edition of the “Australasian Code for Reporting of
Exploration Results, Mineral Resources and Ore Reserves”. Mr Dunn consents to the inclusion in the report of the matters in the form and context in which it
appears.
Table 2. 2015 Total Ore Reserve Estimate by Reserve Category (delivered to mill)
2014 Reserve Estimate 2015 Reserve Estimate
Description Ore (Mt) Grade (g/t Au) Ounces Ore (Mt)
Grade (g/t Au) Ounces Change
Proved 6.95 1.6 374,600 2.99 1.5 143,200 -61%
Probable 1.28 1.9 78,400 0.54 1.5 25,500 -67%
Stockpiles 0.45 0.8 11,400 0.64 0.9 19,000 +66%
Total 8.7 1.7 464,400 4.16 1.4 187,700 -59%
MOY is not aware of any new information or data that materially affects the information included in the announcement of 27 March 2015 and all material
assumptions and technical parameters underpinning the ore reserves and mineral resources estimates in the announcement of 27 March 2015 continue to
apply and have not materially changed
Balanced reporting
Where comprehensive reporting of all Exploration Results is not practicable, representative reporting of both low and high grades and/or widths should be practiced to avoid misleading reporting of Exploration Results.
Where this table relates to exploration results, all of the relevant historic results related to the prospects are presented in the detailed intersections table.
All of the drill hole collars present are shown on each of the maps.
Other substantive exploration data
Other exploration data, if meaningful and material, should be reported including (but not limited to): geological observations; geophysical survey results; geochemical survey results; bulk samples – size and method of treatment; metallurgical test results; bulk density, groundwater, geotechnical and rock characteristics; potential deleterious or contaminating substances.
The outcrops of quartz veins have been previously mapped at Condor NW and Gambols Hill this shows mineralisation is continuous from surface. Mineralisation is primarily associated with a combination of quartz veining, moderate foliation, strong sericite alteration and strong limonite staining.
Further work The nature and scale of planned further work (e.g. tests for lateral extensions or depth extensions or large-scale step-out drilling).
Diagrams clearly highlighting the areas of possible extensions, including the main geological interpretations and future drilling areas, provided this information is not commercially sensitive.
Further RC drilling is recommended for all of the presented prospects to: define the thickness/ tenor of bedrock mineralisation, define the known extents of economic mineralisation and to delineate a preliminary mineral resource to assess the economics of the most promising prospects.
Diagrams within the presentation show the interpretation of mineralisation including target areas and zones for future exploration.