The New Kraft Foods Group - NASDAQfiles.shareholder.com/downloads/ABEA-3QV6OO/0x0x... · The words...
68
The New Kraft Foods Group September 7, 2012 Investor Day
Transcript of The New Kraft Foods Group - NASDAQfiles.shareholder.com/downloads/ABEA-3QV6OO/0x0x... · The words...
The New Kraft Foods Group
September 7, 2012
Investor Day

Chris Jakubik Vice President, Investor Relations
3
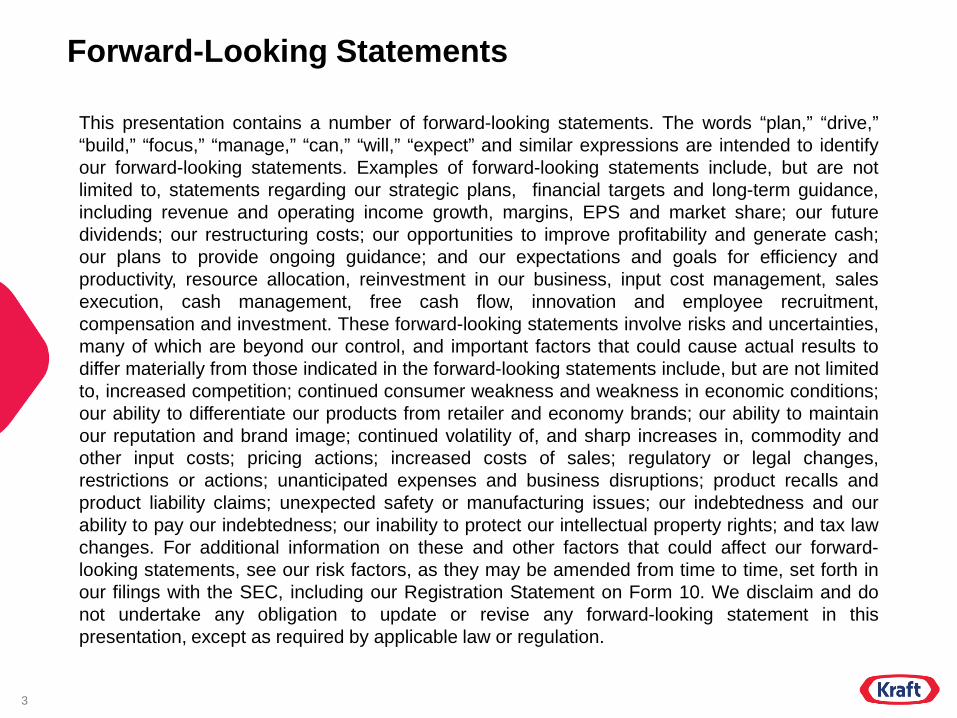
Forward-Looking Statements
This presentation contains a number of forward-looking statements. The words “plan,” “drive,” “build,” “focus,” “manage,” “can,” “will,” “expect” and similar expressions are intended to identify our forward-looking statements. Examples of forward-looking statements include, but are not limited to, statements regarding our strategic plans, financial targets and long-term guidance, including revenue and operating income growth, margins, EPS and market share; our future dividends; our restructuring costs; our opportunities to improve profitability and generate cash; our plans to provide ongoing guidance; and our expectations and goals for efficiency and productivity, resource allocation, reinvestment in our business, input cost management, sales execution, cash management, free cash flow, innovation and employee recruitment, compensation and investment. These forward-looking statements involve risks and uncertainties, many of which are beyond our control, and important factors that could cause actual results to differ materially from those indicated in the forward-looking statements include, but are not limited to, increased competition; continued consumer weakness and weakness in economic conditions; our ability to differentiate our products from retailer and economy brands; our ability to maintain our reputation and brand image; continued volatility of, and sharp increases in, commodity and other input costs; pricing actions; increased costs of sales; regulatory or legal changes, restrictions or actions; unanticipated expenses and business disruptions; product recalls and product liability claims; unexpected safety or manufacturing issues; our indebtedness and our ability to pay our indebtedness; our inability to protect our intellectual property rights; and tax law changes. For additional information on these and other factors that could affect our forward-looking statements, see our risk factors, as they may be amended from time to time, set forth in our filings with the SEC, including our Registration Statement on Form 10. We disclaim and do not undertake any obligation to update or revise any forward-looking statement in this presentation, except as required by applicable law or regulation.
4
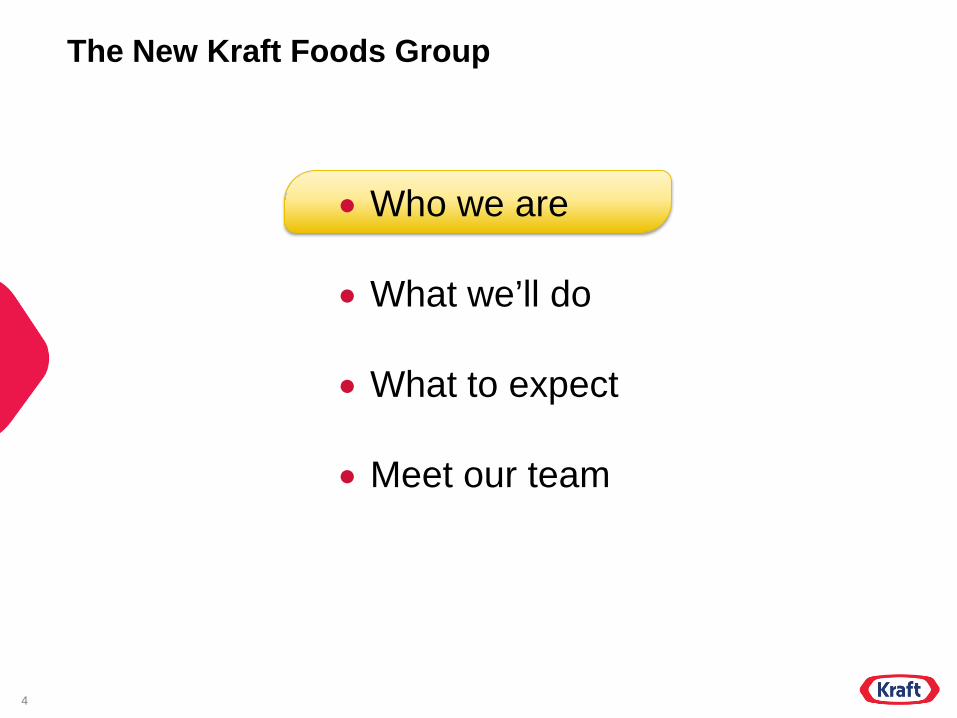
The New Kraft Foods Group
• Who we are
• What we’ll do
• What to expect
• Meet our team
John Cahill Executive Chairman
6
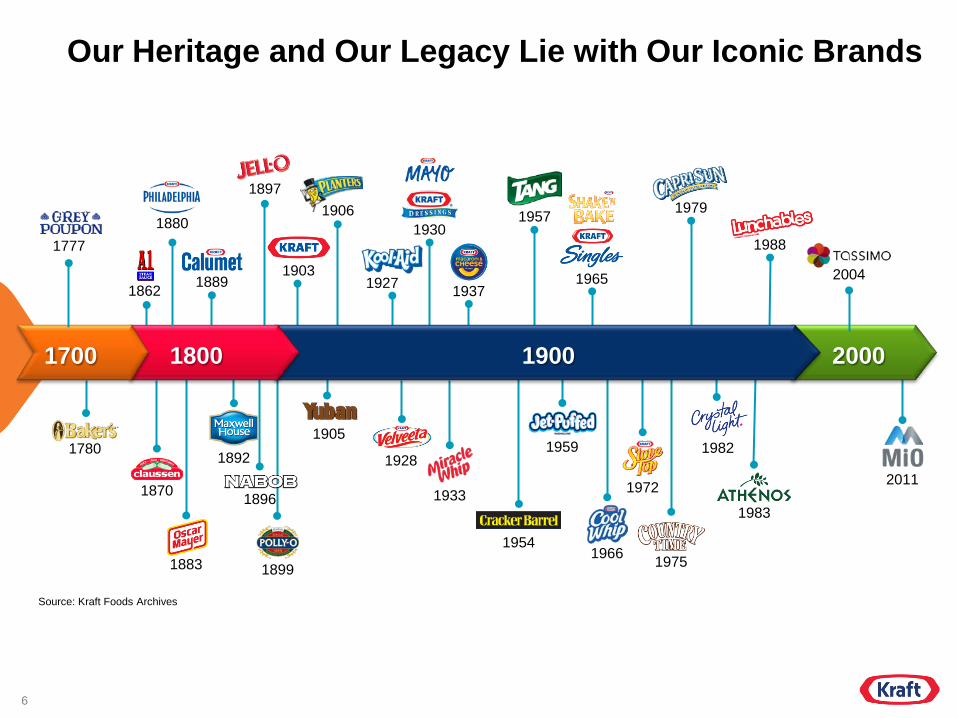
Our Heritage and Our Legacy Lie with Our Iconic Brands
1966
1972
1975
1983
1988
1979
1965
1777
Source: Kraft Foods Archives
1780
1862
1870
1880
1899
1903
1905
1906
1927
1928
1930
1933
1937
1954
1959
1957
1982
2004
2011
1889
1896
1883
1897
1892
1800 1900 1700 2000
7
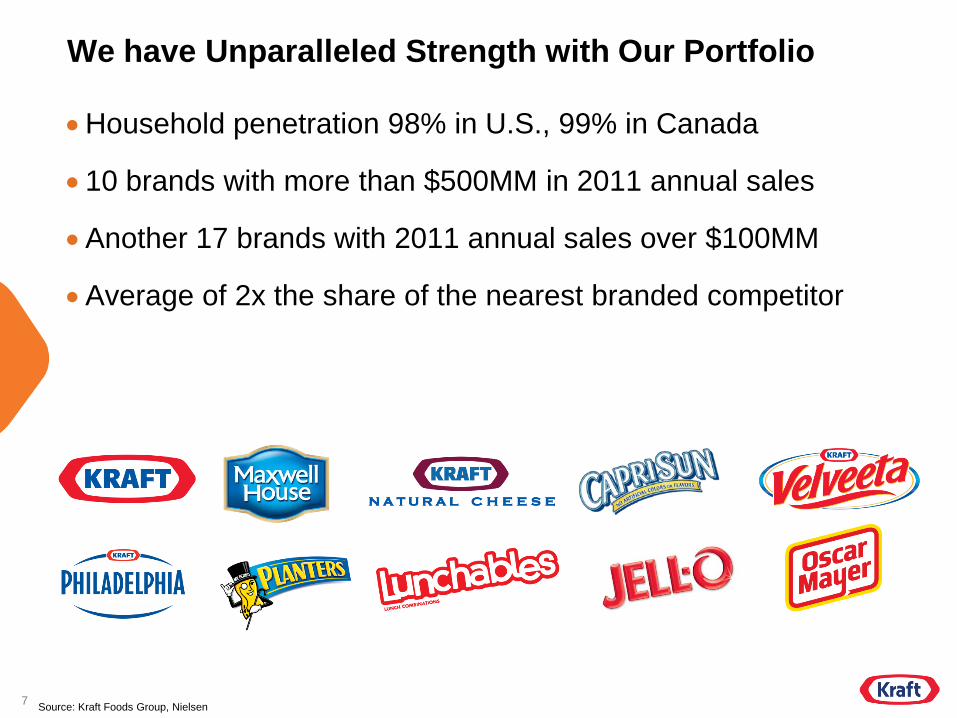
We have Unparalleled Strength with Our Portfolio
•Household penetration 98% in U.S., 99% in Canada
•10 brands with more than $500MM in 2011 annual sales
•Another 17 brands with 2011 annual sales over $100MM
•Average of 2x the share of the nearest branded competitor
Source: Kraft Foods Group, Nielsen
8
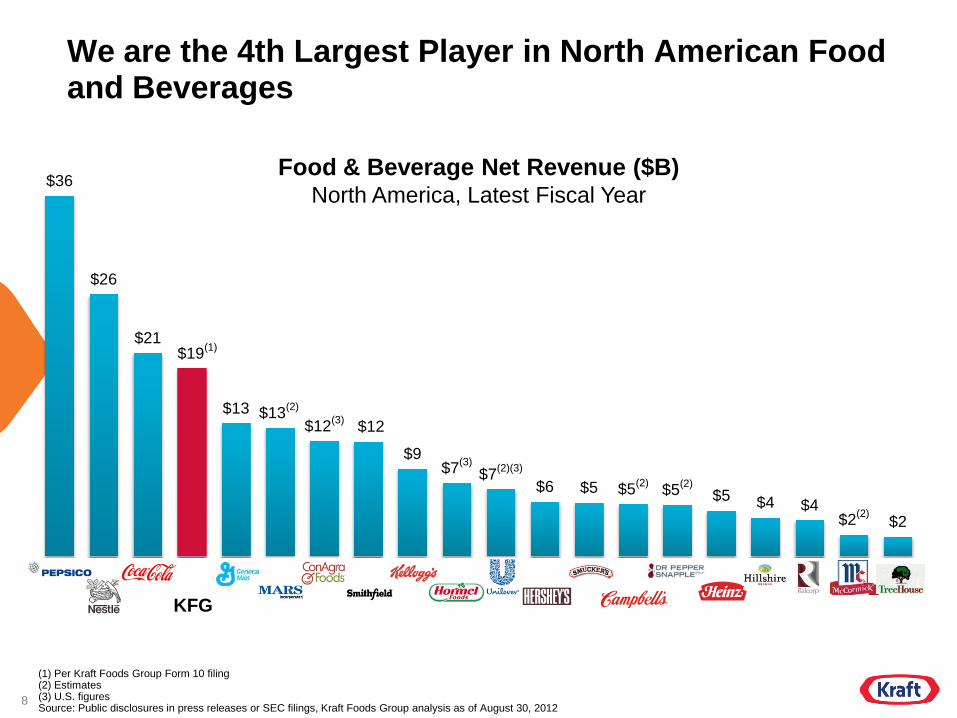
We are the 4th Largest Player in North American Food and Beverages
$36
$26
$21 $19(1)
$13 $13(2)
$12(3) $12
$9 $7(3)
$7(2)(3)
$6 $5 $5(2) $5(2) $5 $4 $4 $2(2) $2
Food & Beverage Net Revenue ($B) North America, Latest Fiscal Year
(1) Per Kraft Foods Group Form 10 filing (2) Estimates (3) U.S. figures Source: Public disclosures in press releases or SEC filings, Kraft Foods Group analysis as of August 30, 2012
KFG
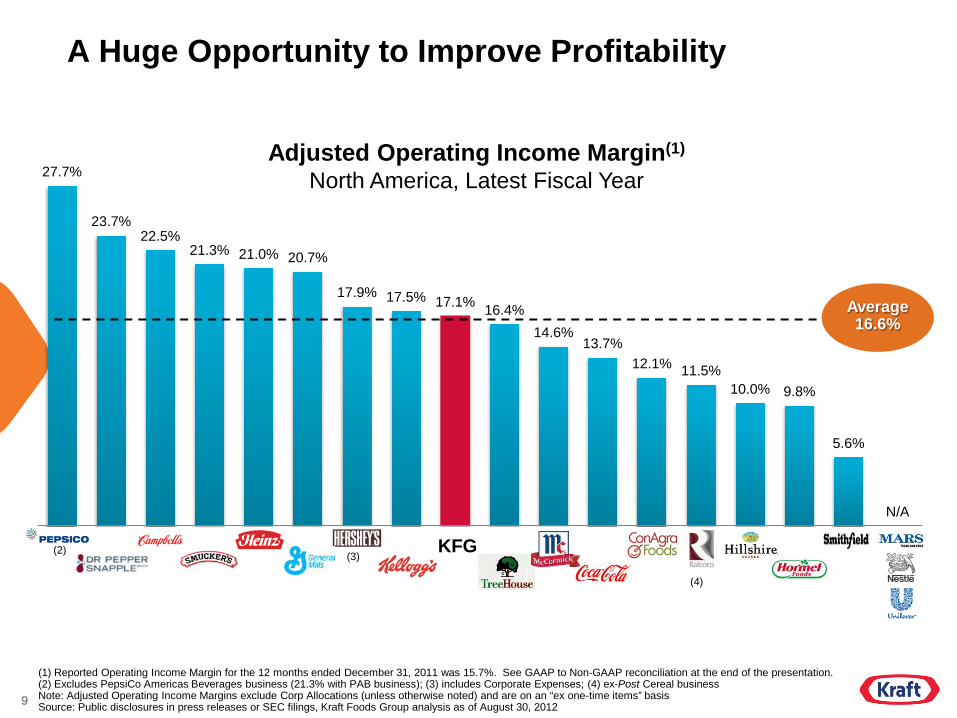
9
27.7%
23.7% 22.5%
21.3% 21.0% 20.7%
17.9% 17.5% 17.1% 16.4% 14.6%
13.7% 12.1% 11.5%
10.0% 9.8%
5.6%
N/A
A Huge Opportunity to Improve Profitability
(1) Reported Operating Income Margin for the 12 months ended December 31, 2011 was 15.7%. See GAAP to Non-GAAP reconciliation at the end of the presentation. (2) Excludes PepsiCo Americas Beverages business (21.3% with PAB business); (3) includes Corporate Expenses; (4) ex-Post Cereal business Note: Adjusted Operating Income Margins exclude Corp Allocations (unless otherwise noted) and are on an “ex one-time items” basis Source: Public disclosures in press releases or SEC filings, Kraft Foods Group analysis as of August 30, 2012
Average 16.6%
Adjusted Operating Income Margin(1)
North America, Latest Fiscal Year
KFG
9
(2) (3)
(4)
10
An Experienced and Diverse Team with the Right Skills
•CEO: 23 years Johnson & Johnson, 3 years private equity
•Leadership Team – Evenly split between proven Kraft personnel and external hires – 195 years of combined Kraft experience – 350 years of combined CPG/Industry experience – Drawing experience from other venerable CPG companies including
Procter & Gamble, Swift & Company, Fonterra Brands, PepsiCo, S.C. Johnson
•Board expertise covering consumer products, retail, supply chain, international, social media
11
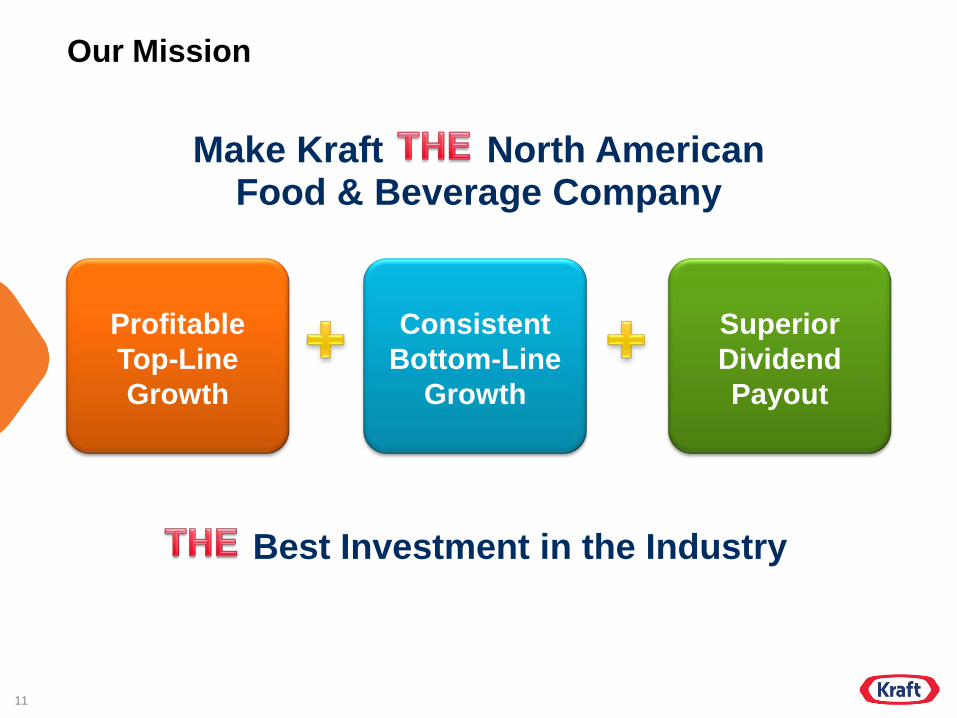
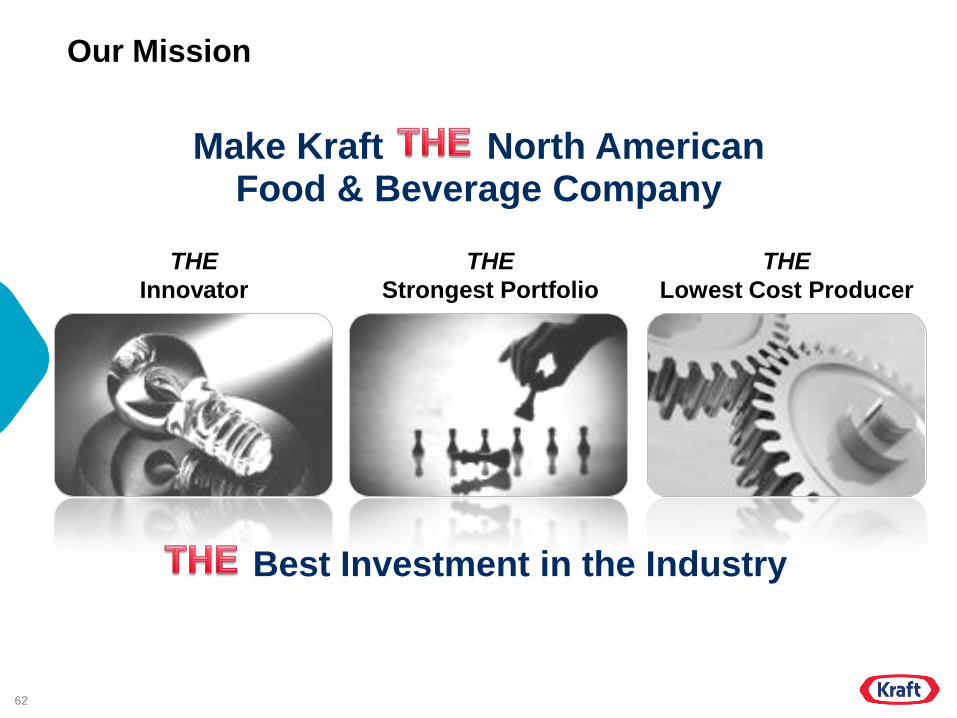
Our Mission
Make Kraft North American Food & Beverage Company
Best Investment in the Industry
Superior Dividend Payout
Profitable Top-Line Growth
Consistent Bottom-Line
Growth

Tony Vernon Chief Executive Officer
13
The New Kraft Foods Group
• Who we are
• What we’ll do
• What to expect
• Meet our team
14
From To
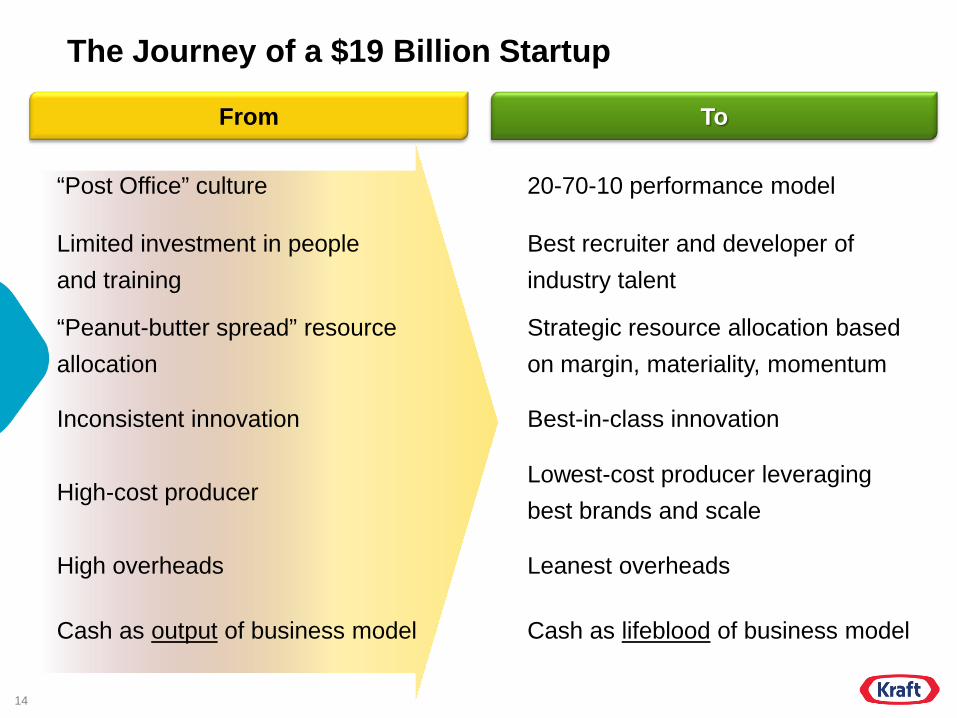
The Journey of a $19 Billion Startup
“Post Office” culture 20 - 70 - 10 performance model
Limited investment in people and training
Best recruiter and developer of industry talent
“Peanut - butter spread” resource allocation
Strategic resource allocation based on margin, materiality, momentum
Inconsistent innovation Best - in - class innovation
High - cost producer Lowest - cost producer leveraging best brands and scale
High overheads Leanest overheads
Cash as output of business model Cash as lifeblood of business model
15
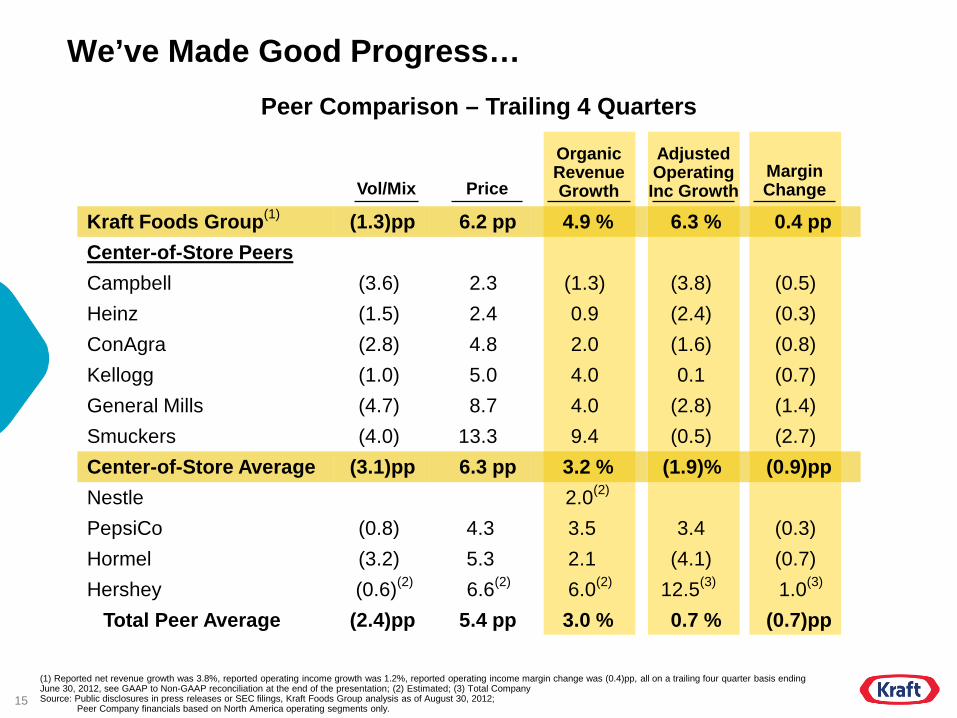
We’ve Made Good Progress…
(1) Reported net revenue growth was 3.8%, reported operating income growth was 1.2%, reported operating income margin change was (0.4)pp, all on a trailing four quarter basis ending June 30, 2012, see GAAP to Non-GAAP reconciliation at the end of the presentation; (2) Estimated; (3) Total Company Source: Public disclosures in press releases or SEC filings, Kraft Foods Group analysis as of August 30, 2012; Peer Company financials based on North America operating segments only.
Peer Comparison – Trailing 4 Quarters
Kraft Foods Group(1) (1.3)pp 6.2 pp 4.9 % 6.3 % 0.4 pp Center-of-Store Peers Campbell (3.6) 2.3 (1.3) (3.8) (0.5) Heinz (1.5) 2.4 0.9 (2.4) (0.3) ConAgra (2.8) 4.8 2.0 (1.6) (0.8) Kellogg (1.0) 5.0 4.0 0.1 (0.7) General Mills (4.7) 8.7 4.0 (2.8) (1.4) Smuckers (4.0) 13.3 9.4 (0.5) (2.7) Center-of-Store Average (3.1)pp 6.3 pp 3.2 % (1.9)% (0.9)pp Nestle 2.0(2)
PepsiCo (0.8) 4.3 3.5 3.4 (0.3) Hormel (3.2) 5.3 2.1 (4.1) (0.7) Hershey (0.6)(2) 6.6(2) 6.0(2) 12.5(3) 1.0(3) Total Peer Average (2.4)pp 5.4 pp 3.0 % 0.7 % (0.7)pp
Vol/Mix Price
Organic Revenue Growth
Adjusted Operating Inc Growth
Margin Change
16
… Despite an Operating Environment that Promises to Remain the Most Difficult in a Generation
•The North American food and beverage market is large, highly profitable but mature and slow growing
•A weak economy with relatively high commodity volatility is the “new normal”
•Private label has achieved a sustained increase across the market since the 2008 recession
•Mutual dependence with our largest retail food customers
•Several major demographic shifts and changing consumer preferences are transforming the market
17
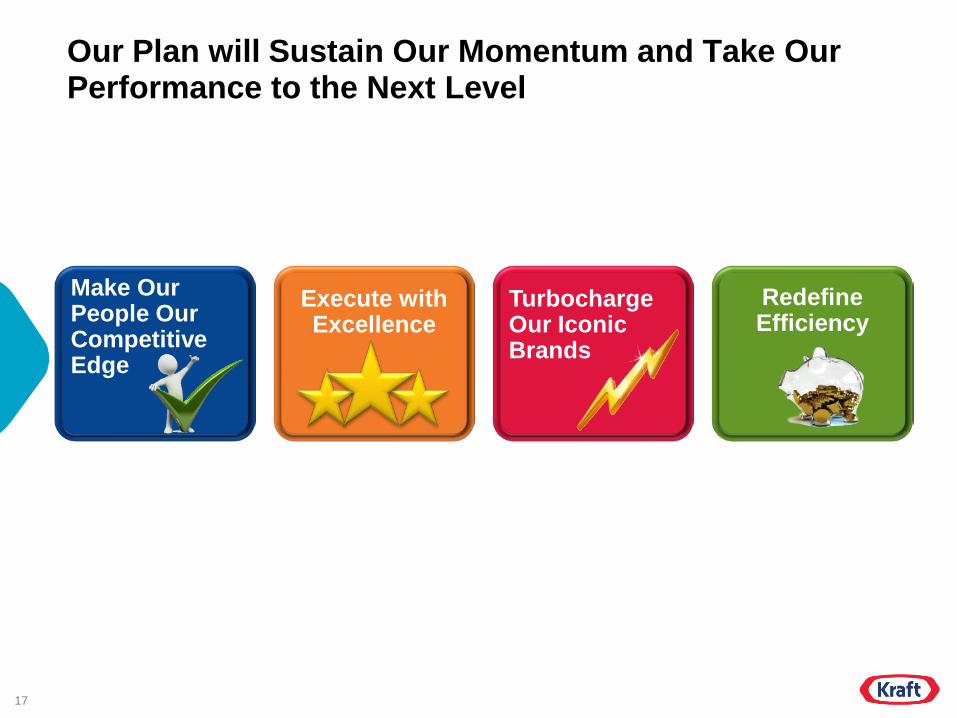
Our Plan will Sustain Our Momentum and Take Our Performance to the Next Level
Redefine Efficiency
Turbocharge Our Iconic Brands
Execute with Excellence
Make Our People Our Competitive Edge

18
Redefine Efficiency
Turbocharge Our Iconic Brands
Execute with Excellence
Make Our People Our Competitive Edge
Our Plan
•Aggressively compensate for performance
• Invest in our people
•Create a lean, horizontal organization
19
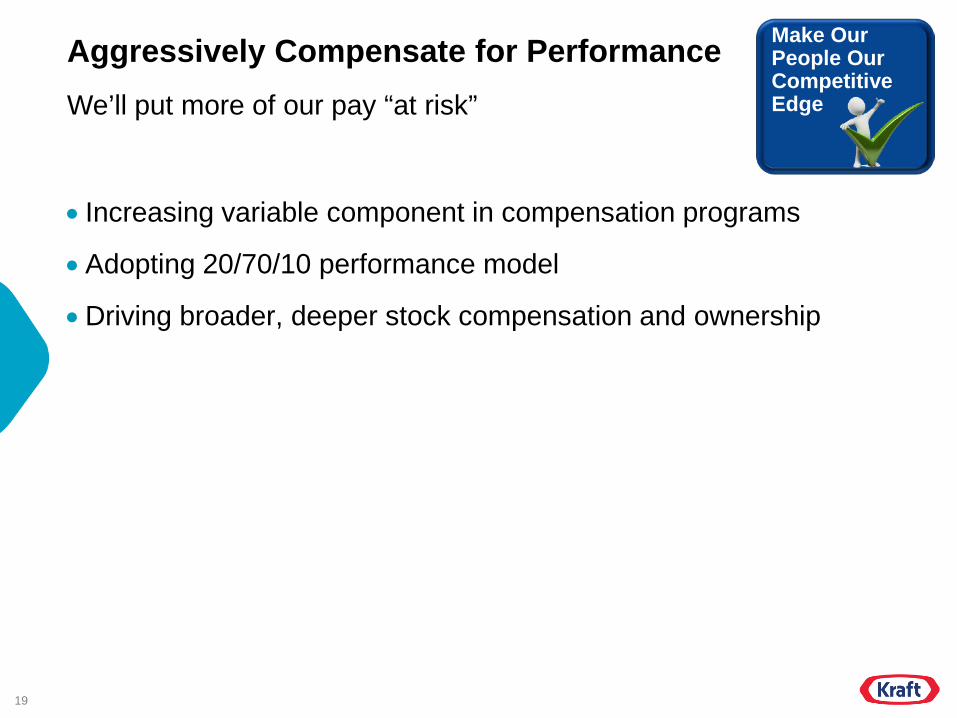
Aggressively Compensate for Performance
• Increasing variable component in compensation programs
•Adopting 20/70/10 performance model
•Driving broader, deeper stock compensation and ownership
We’ll put more of our pay “at risk”
Make Our People Our Competitive Edge
20
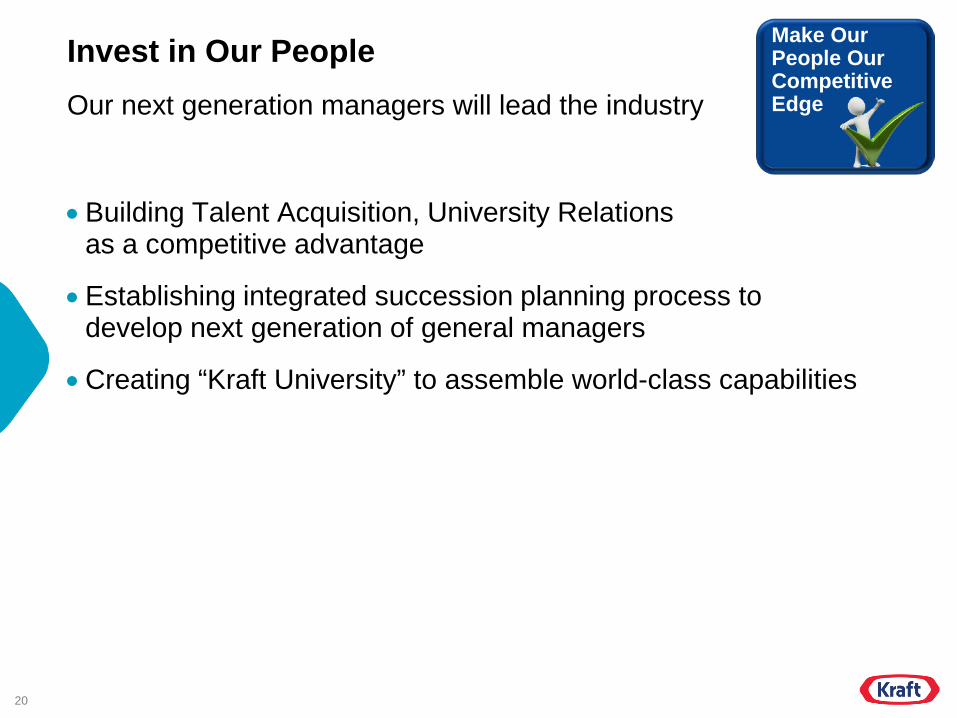
Invest in Our People
•Building Talent Acquisition, University Relations as a competitive advantage
•Establishing integrated succession planning process to develop next generation of general managers
•Creating “Kraft University” to assemble world-class capabilities
Our next generation managers will lead the industry
Make Our People Our Competitive Edge
21
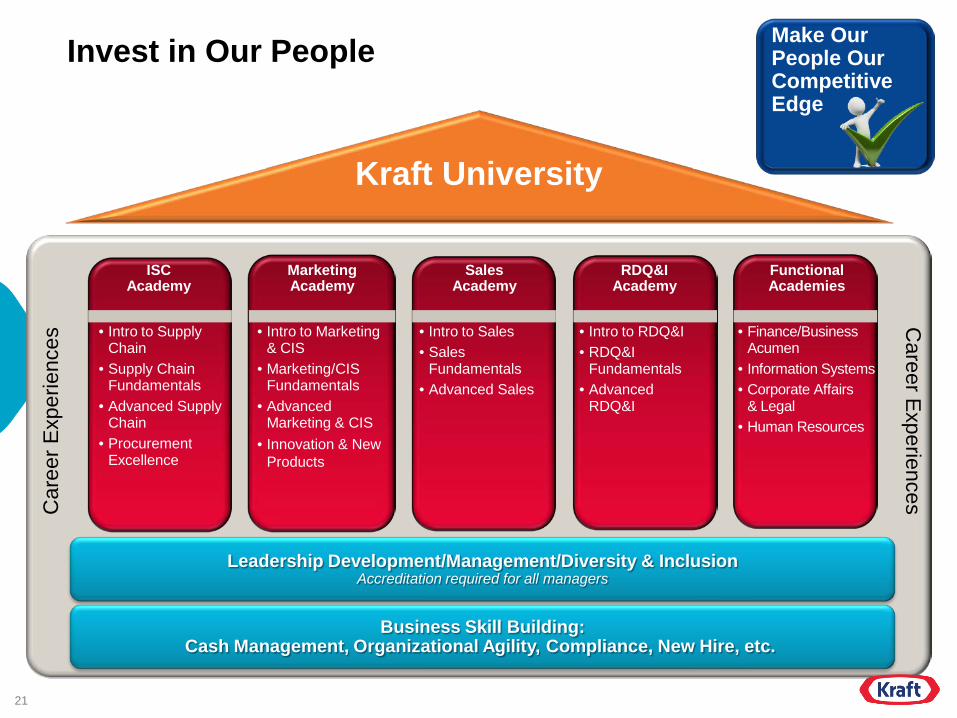
Invest in Our People
ISC Academy
Marketing Academy
Career E
xperiences
Kraft University
• Intro to Marketing & CIS
•Marketing/CIS Fundamentals
•Advanced Marketing & CIS
• Innovation & New Products
Car
eer E
xper
ienc
es
Leadership Development/Management/Diversity & Inclusion Accreditation required for all managers
Sales Academy
• Intro to Sales •Sales
Fundamentals •Advanced Sales
RDQ&I Academy
• Intro to RDQ&I •RDQ&I
Fundamentals •Advanced
RDQ&I
Functional Academies
•Finance/Business Acumen
• Information Systems •Corporate Affairs
& Legal •Human Resources
Business Skill Building: Cash Management, Organizational Agility, Compliance, New Hire, etc.
• Intro to Supply Chain
•Supply Chain Fundamentals
•Advanced Supply Chain
•Procurement Excellence
Make Our People Our Competitive Edge
22
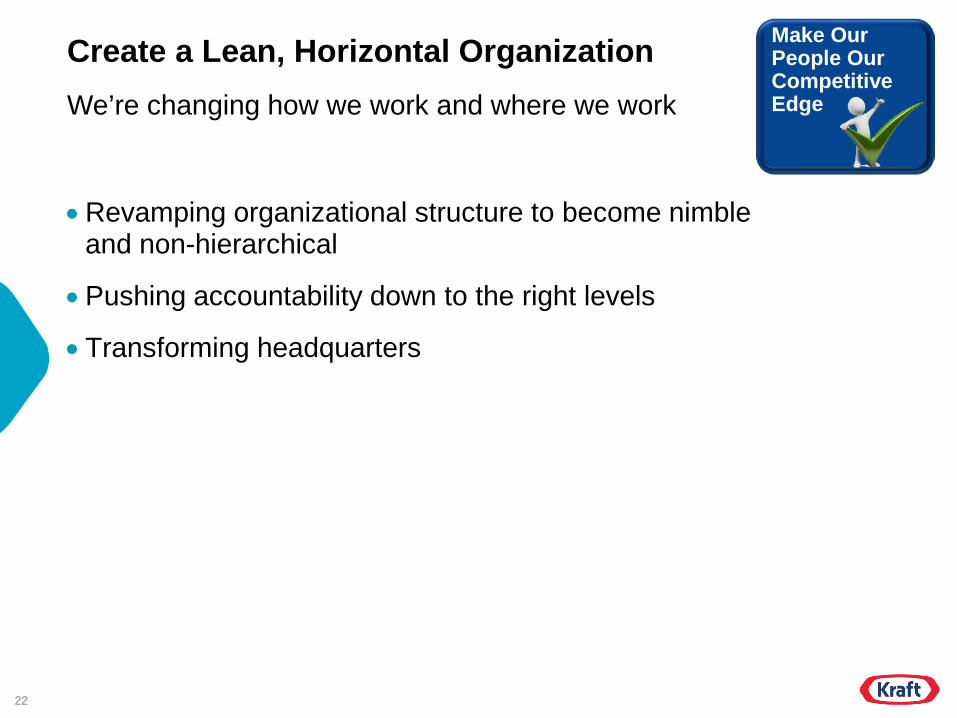
Create a Lean, Horizontal Organization
•Revamping organizational structure to become nimble and non-hierarchical
•Pushing accountability down to the right levels
• Transforming headquarters
We’re changing how we work and where we work
Make Our People Our Competitive Edge

23
Redefine Efficiency
Turbocharge Our Iconic Brands
Execute with Excellence
Make Our People Our Competitive Edge
Our Plan
•Strategically allocate resources
• Leverage our leading sales capability
•Relentlessly focus on cash generation

24
Strategically Allocate Resources Each of our brands can deliver outstanding returns… but not all need the same resources to reach their potential
24
Execute with Excellence
25
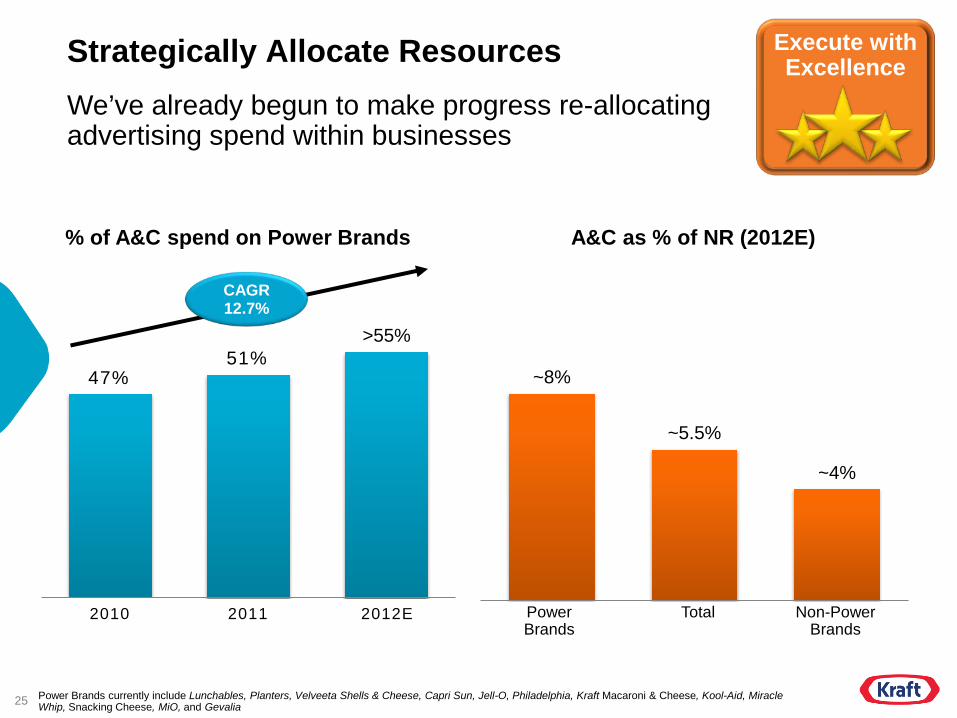
Strategically Allocate Resources We’ve already begun to make progress re-allocating advertising spend within businesses
~8%
~5.5%
~4%
47% 51%
>55%
2010 2011 2012E
% of A&C spend on Power Brands
CAGR 12.7%
A&C as % of NR (2012E)
Power Brands
Total Non-Power Brands
Power Brands currently include Lunchables, Planters, Velveeta Shells & Cheese, Capri Sun, Jell-O, Philadelphia, Kraft Macaroni & Cheese, Kool-Aid, Miracle Whip, Snacking Cheese, MiO, and Gevalia
Execute with Excellence
26
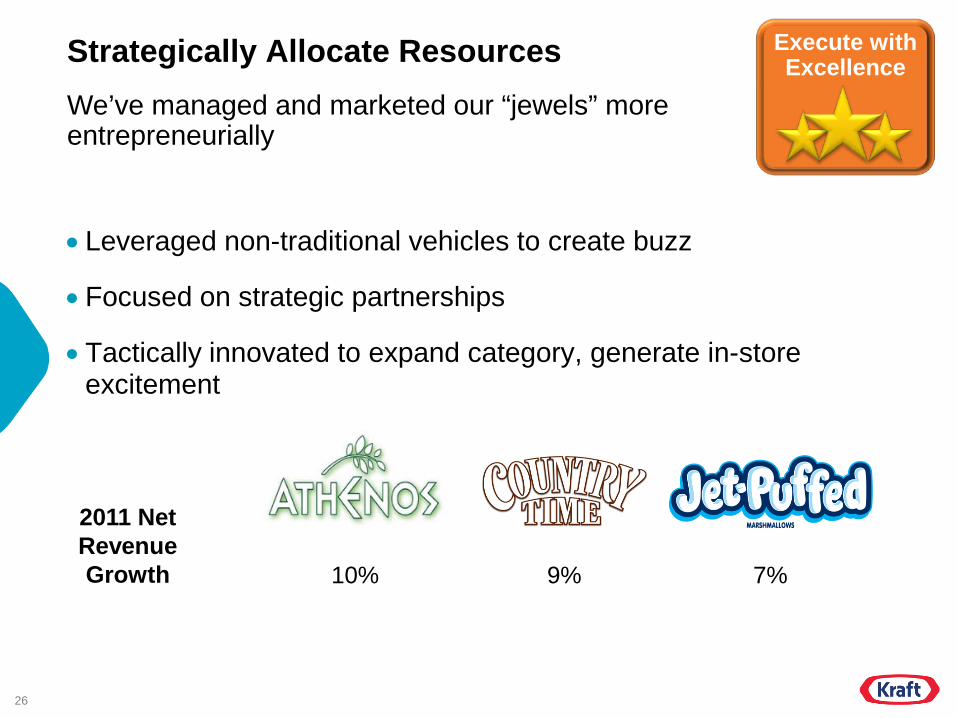
Strategically Allocate Resources
• Leveraged non-traditional vehicles to create buzz
• Focused on strategic partnerships
• Tactically innovated to expand category, generate in-store excitement
We’ve managed and marketed our “jewels” more entrepreneurially
2011 Net Revenue Growth 7% 10% 9%
Execute with Excellence
27
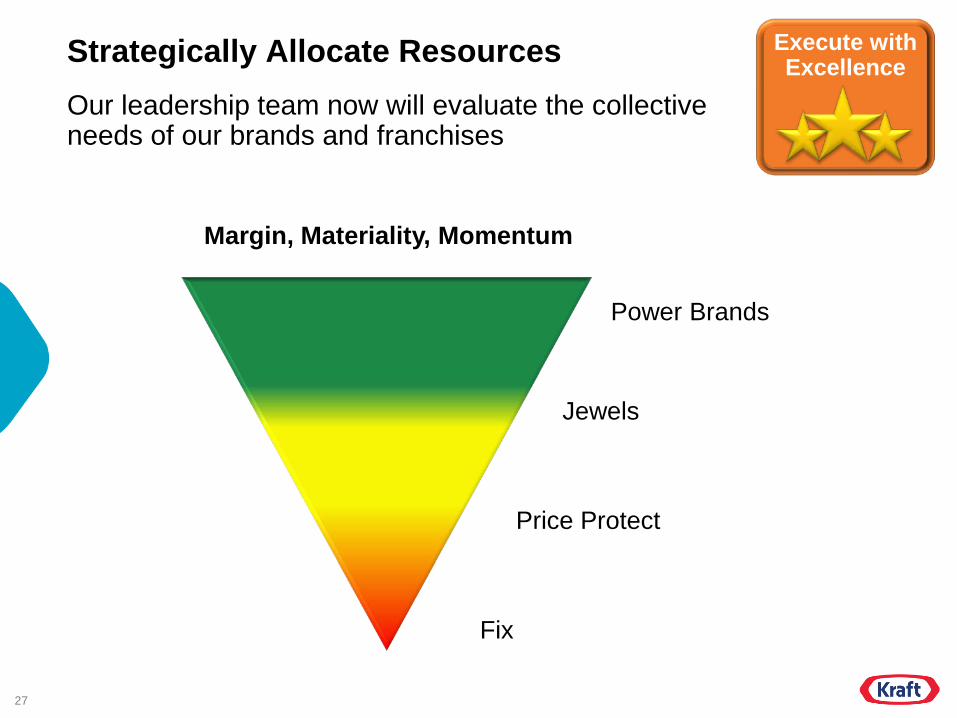
Strategically Allocate Resources Our leadership team now will evaluate the collective needs of our brands and franchises
Margin, Materiality, Momentum
Power Brands
Jewels
Price Protect
Fix
Execute with Excellence
28
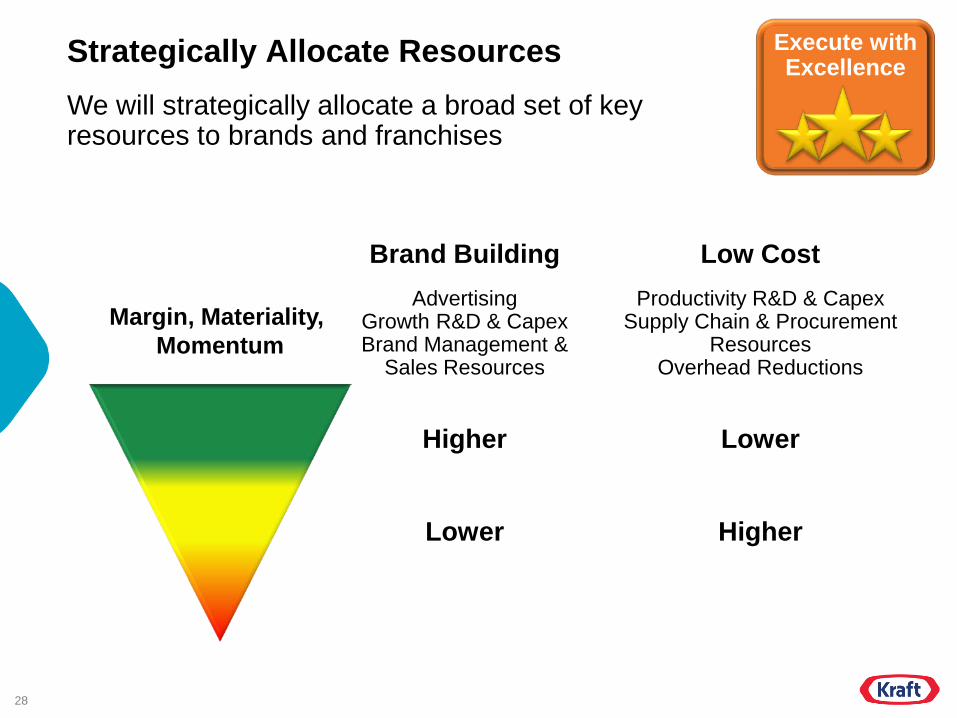
Strategically Allocate Resources We will strategically allocate a broad set of key resources to brands and franchises
Margin, Materiality, Momentum
Brand Building Advertising
Growth R&D & Capex Brand Management &
Sales Resources
Higher
Lower
Low Cost Productivity R&D & Capex
Supply Chain & Procurement Resources
Overhead Reductions
Lower
Higher
Execute with Excellence

29
Leverage Our Leading Sales Capability
Kantar 2011 Power Rankings
Key Sales Force Attributes Rank
• Best Sales Force #1
• Best Shopper Marketing #2
• Best Supply Chain Management #2
• Most Helpful Shopper Insights #2
8.1
8.1
10.5
12.8
13.2
22.6
28.4
32.7
Kelloggs
ConAgra
Coke
Unilever
Nestle
PepsiCo
General Mills
KFG
2011 Overall Rankings
Partnering with Acosta will make us even stronger
Execute with Excellence

30
Leverage Our Leading Sales Capability
• Employing a relentless focus on ROI
•Bringing world-class category leadership to Center Store
• Building strong, sustainable relationships with our customers
Several initiatives will generate higher returns on our investment in sales
Execute with Excellence
31
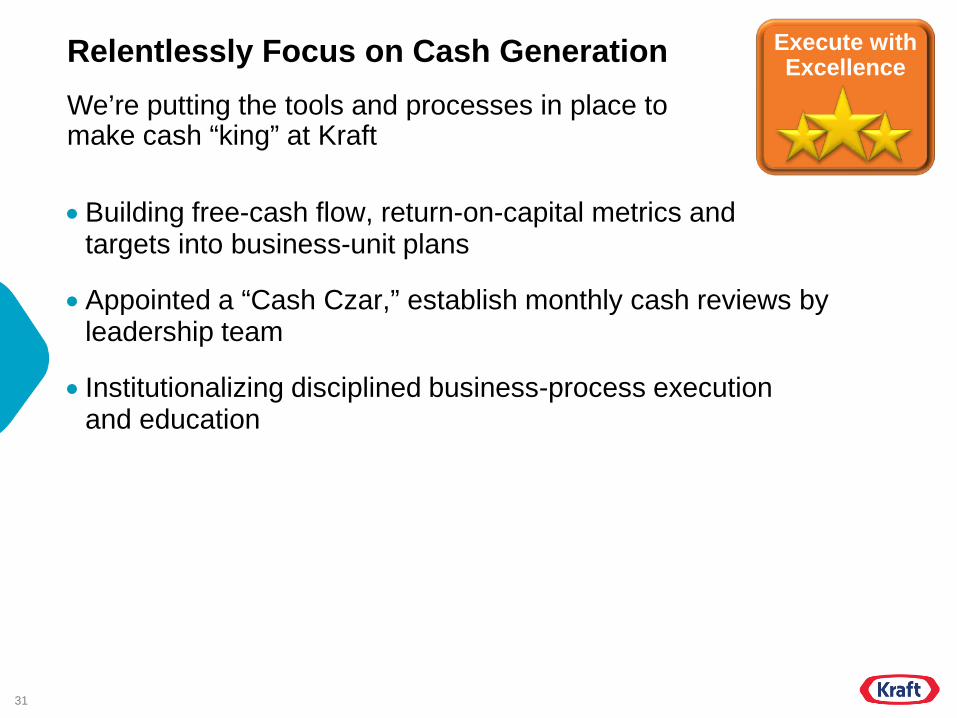
Relentlessly Focus on Cash Generation
•Building free-cash flow, return-on-capital metrics and targets into business-unit plans
•Appointed a “Cash Czar,” establish monthly cash reviews by leadership team
• Institutionalizing disciplined business-process execution and education
We’re putting the tools and processes in place to make cash “king” at Kraft
Execute with Excellence
32
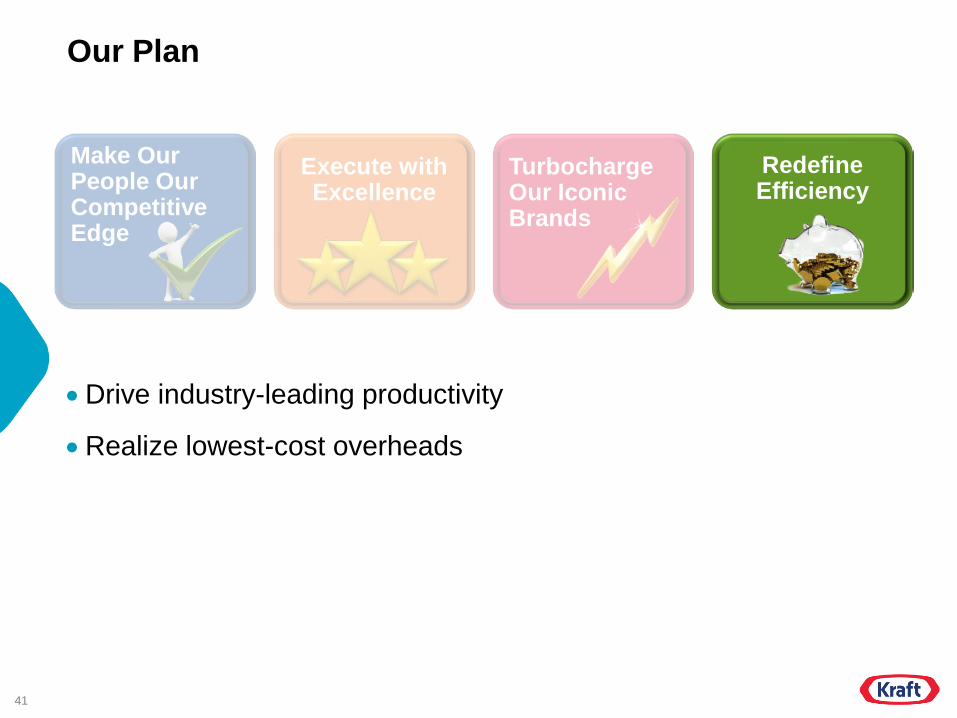
Redefine Efficiency
Turbocharge Our Iconic Brands
Execute with Excellence
Make Our People Our Competitive Edge
Our Plan
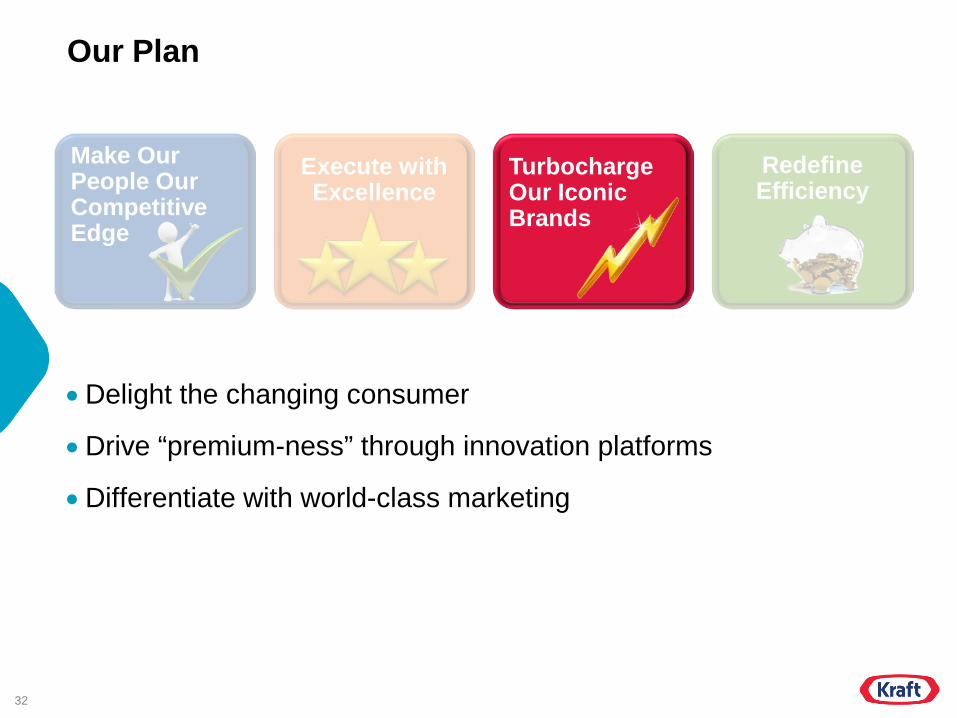
•Delight the changing consumer
•Drive “premium-ness” through innovation platforms
•Differentiate with world-class marketing

33
Delight the Changing Consumer We can delight the consumers more ways, on more brands, in more places than any competitor
Beverages Cheese Enhancers Convenient
Meals Desserts & Snacks
Turbocharge Our Iconic Brands
34
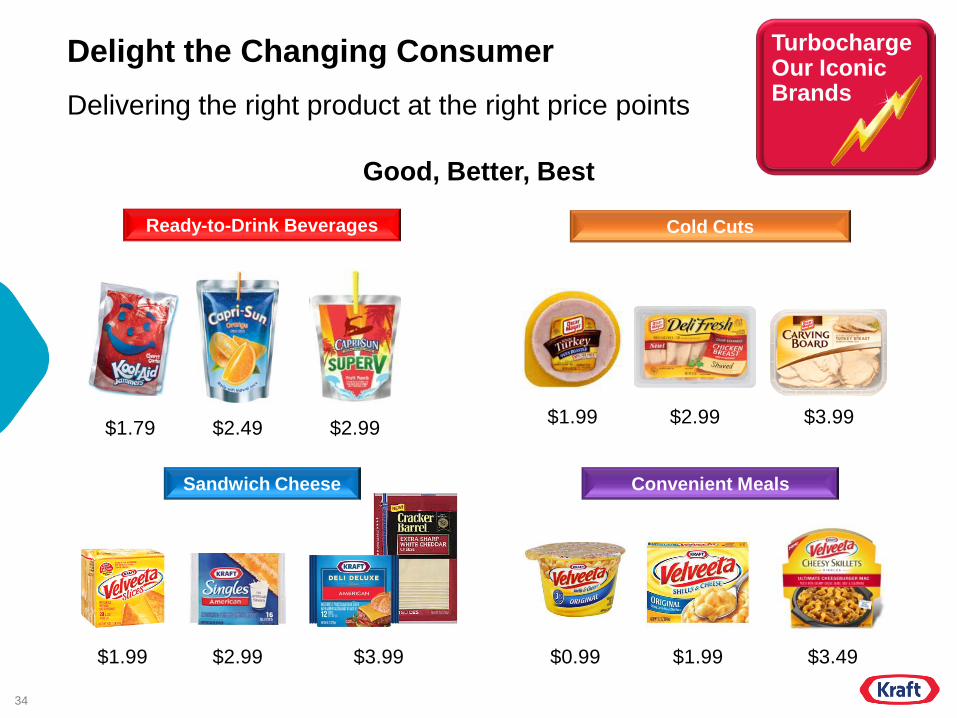
Delight the Changing Consumer
Good, Better, Best
Delivering the right product at the right price points
Ready-to-Drink Beverages
$1.79 $2.49 $2.99
Cold Cuts
$1.99 $2.99 $3.99
Convenient Meals
$0.99 $1.99 $3.49
Sandwich Cheese
$1.99 $2.99 $3.99
Turbocharge Our Iconic Brands
35
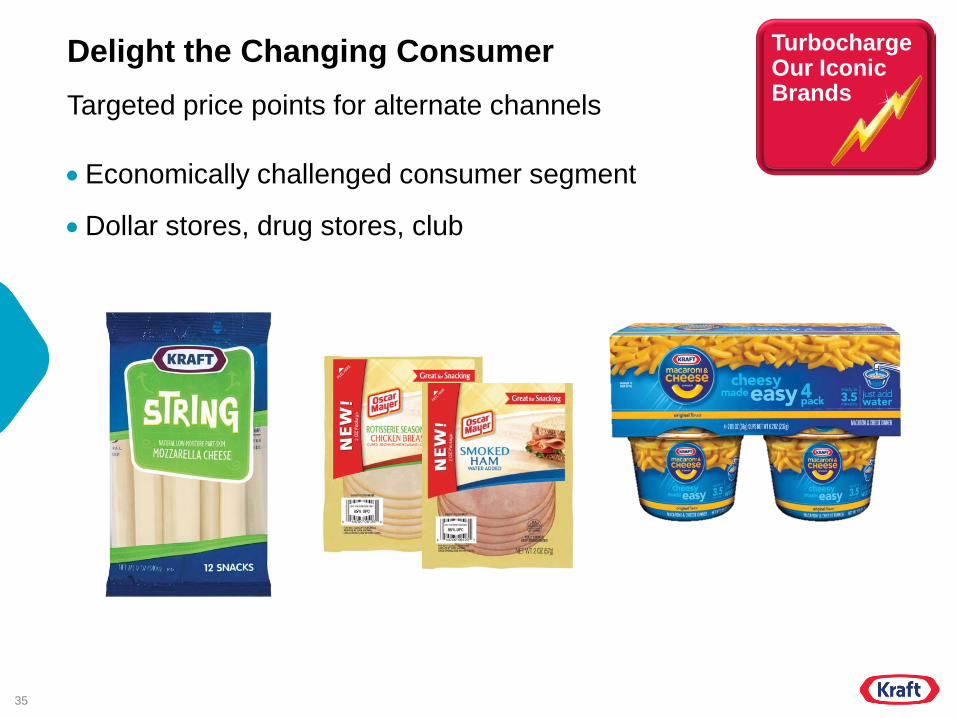
Delight the Changing Consumer
•Economically challenged consumer segment
•Dollar stores, drug stores, club
Targeted price points for alternate channels
Turbocharge Our Iconic Brands

36
Drive “Premium-ness” Through Innovation Platforms
Liquid Concentrates
Lunchables “With”
Premium/One Cup
Convenient Meals
“Aging Up” Capri Sun
Jell-O Reinvention
Fresh Take
Oscar Mayer Selects
Turbocharge Our Iconic Brands

37
Drive “Premium-ness” Through Innovation Platforms
Health & Wellness
% Revenue from Products That Meet “Better Choices” Criteria
~40%
>50%
2011 Baseline 2015 Target
Improved Nutritional Profiles
Beneficial Ingredients
Simplification
Sodium Reduction
Fruits & Vegetables Vitamin Fortified
No Artificial Colors, Preservatives, “Road to Real”
Turbocharge Our Iconic Brands

38
Differentiate with World-Class Marketing
Advertising as % of Net Revenue Latest Fiscal Year
Average 4.5%
2.9%
8.6%
6.4%
5.5%
3.8%
2.8% 2.2% 2.0%
KFG
65% of peer avg
Note: Advertising spend excludes Consumer Promotion spend Source: Company SEC filings, Nielsen 2011 ad spend/US x AOC, Kraft Foods Group analysis
We must do a better job supporting our brands
Turbocharge Our Iconic Brands
39
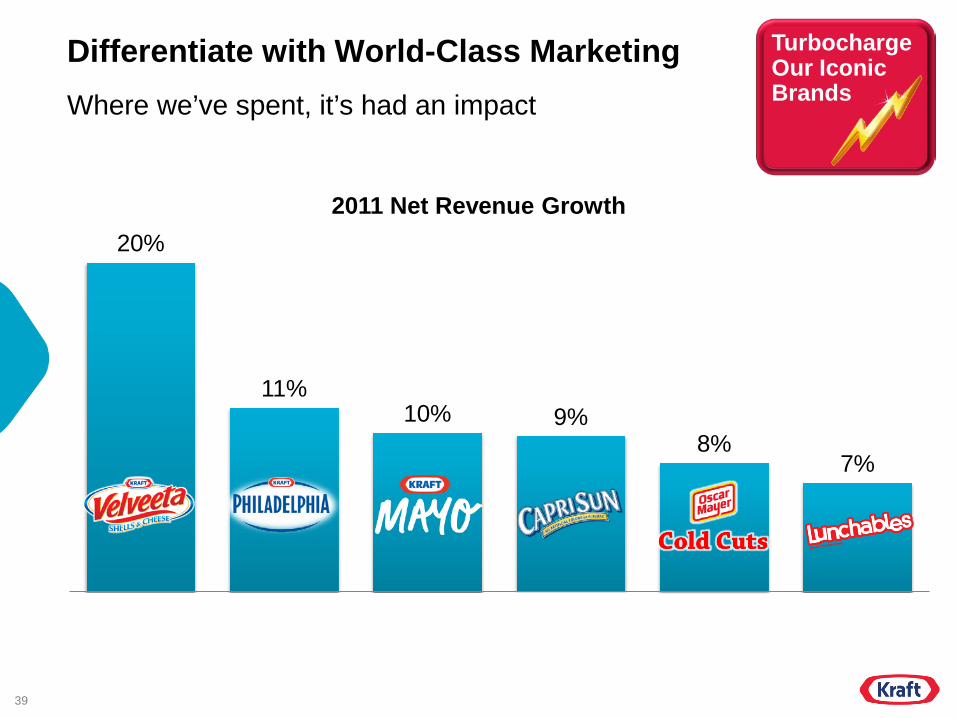
20%
11% 10% 9%
8% 7%
Differentiate with World-Class Marketing
2011 Net Revenue Growth
Where we’ve spent, it’s had an impact
Turbocharge Our Iconic Brands

40
Differentiate with World-Class Marketing
22
35
51 59
1990 2000 2010 2015E
100 100
250
350 400
2011 2012E 2013E 2014E 2015E
U.S. Hispanic Population (MM)
KFG Hispanic A&C Index (2011=100)
Hispanic marketing is a huge opportunity
• Our portfolio of family brands are advantaged with Latina moms
• We have underspent in media and at point of purchase • Will be major focus in new Kraft
Turbocharge Our Iconic Brands
41
Redefine Efficiency
Turbocharge Our Iconic Brands
Execute with Excellence
Make Our People Our Competitive Edge
Our Plan
•Drive industry-leading productivity
•Realize lowest-cost overheads
42
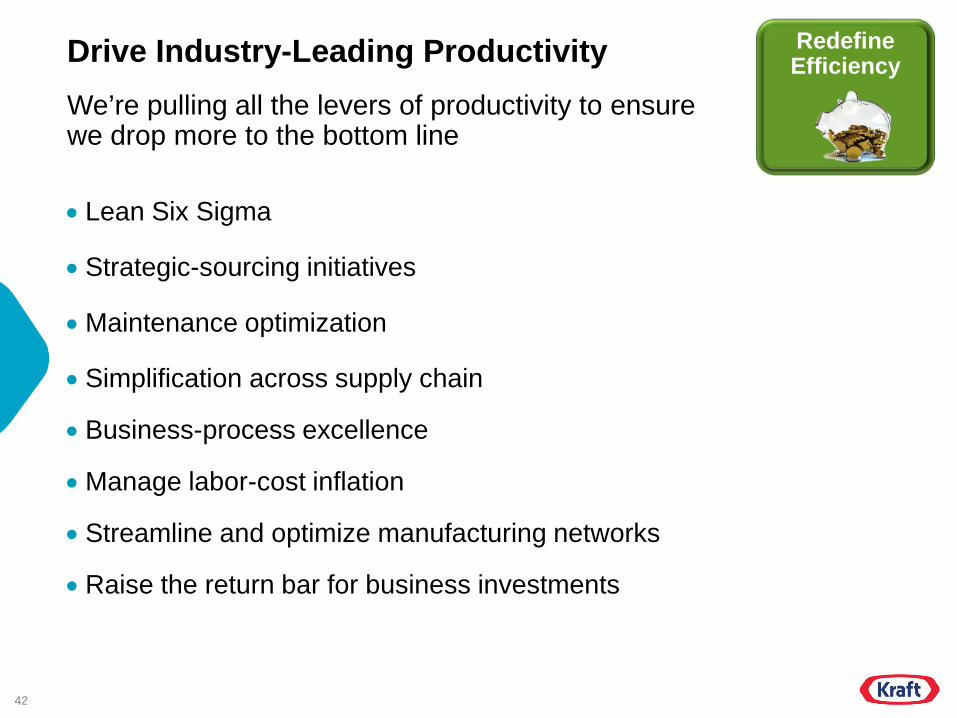
Drive Industry-Leading Productivity
• Lean Six Sigma
• Strategic-sourcing initiatives
• Maintenance optimization
• Simplification across supply chain
• Business-process excellence
• Manage labor-cost inflation
• Streamline and optimize manufacturing networks
• Raise the return bar for business investments
We’re pulling all the levers of productivity to ensure we drop more to the bottom line
Redefine Efficiency

43
1.5%
~2.5%
At least 2.5%
2011 2012E 2013+E
Drive Industry-Leading Productivity We are targeting at least 2.5% net productivity
Productivity as a % of COGS
Redefine Efficiency

44
Realize Lowest-Cost Overheads
• “Clean sheet” approach to purge complex legacy structures, practices
– Business decisions driven by commercial units – Small HQ with efficient shared-service model – Corporate function cost structures to live up to best-in-class external
benchmarks
• Moving to standardize backroom business systems
• Savings expected to more than offset dis-synergies from becoming an independent public company
We’re targeting best-in-class overhead costs
Redefine Efficiency

45
Our Mission
Make Kraft North American Food & Beverage Company
Redefine Efficiency
Turbocharge Our Iconic Brands
Execute with Excellence
Make Our People Our Competitive Edge
Tim McLevish Chief Financial Officer
47
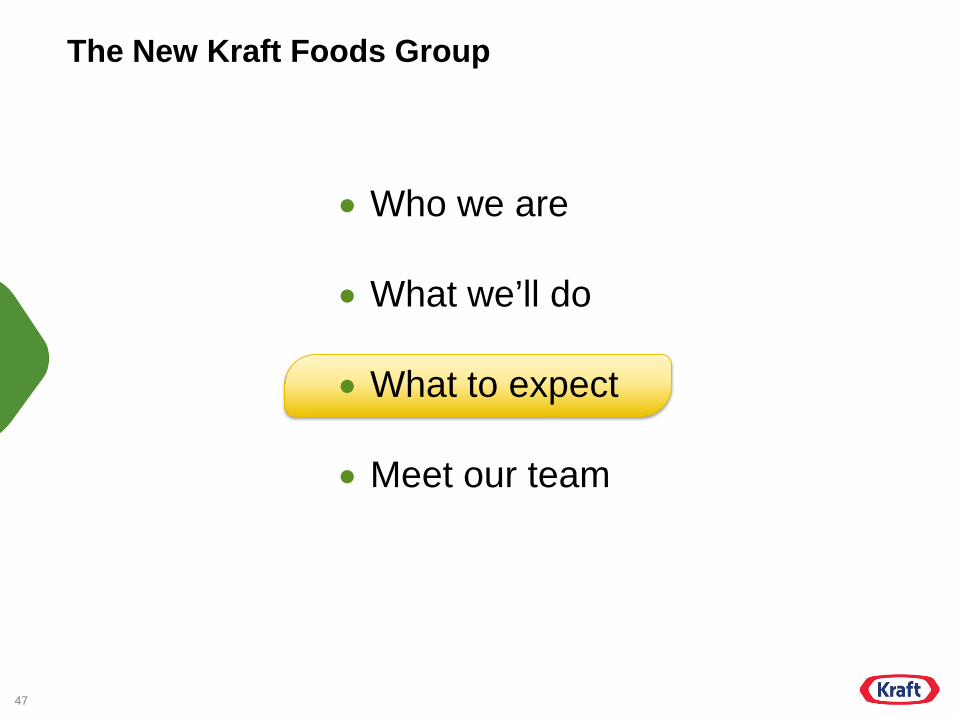
The New Kraft Foods Group
• Who we are
• What we’ll do
• What to expect
• Meet our team
48
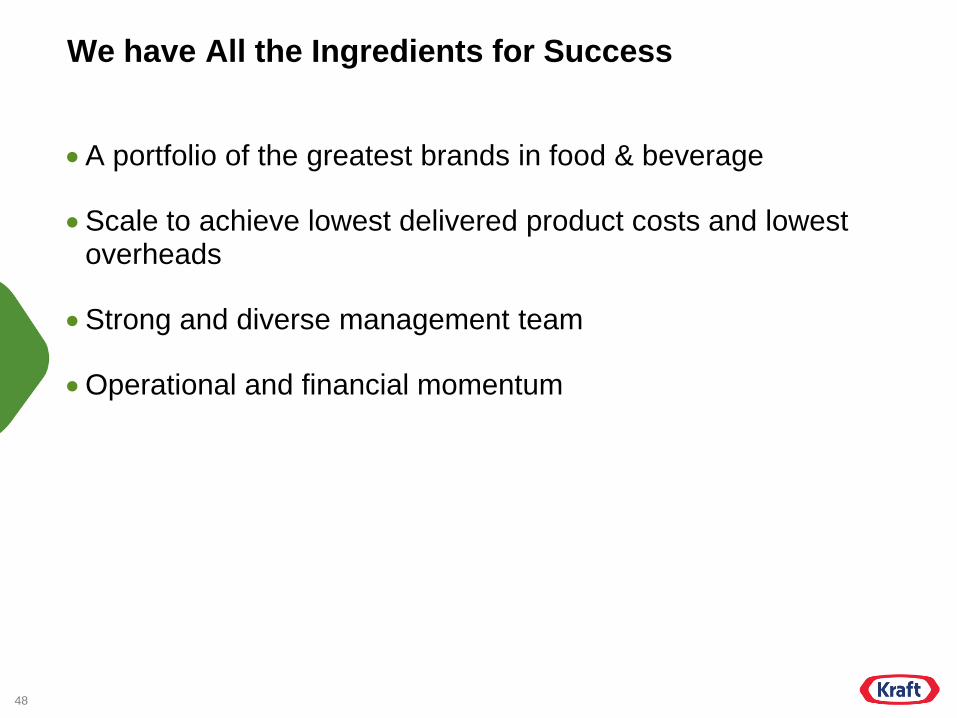
We have All the Ingredients for Success
•A portfolio of the greatest brands in food & beverage
•Scale to achieve lowest delivered product costs and lowest overheads
•Strong and diverse management team
•Operational and financial momentum

49
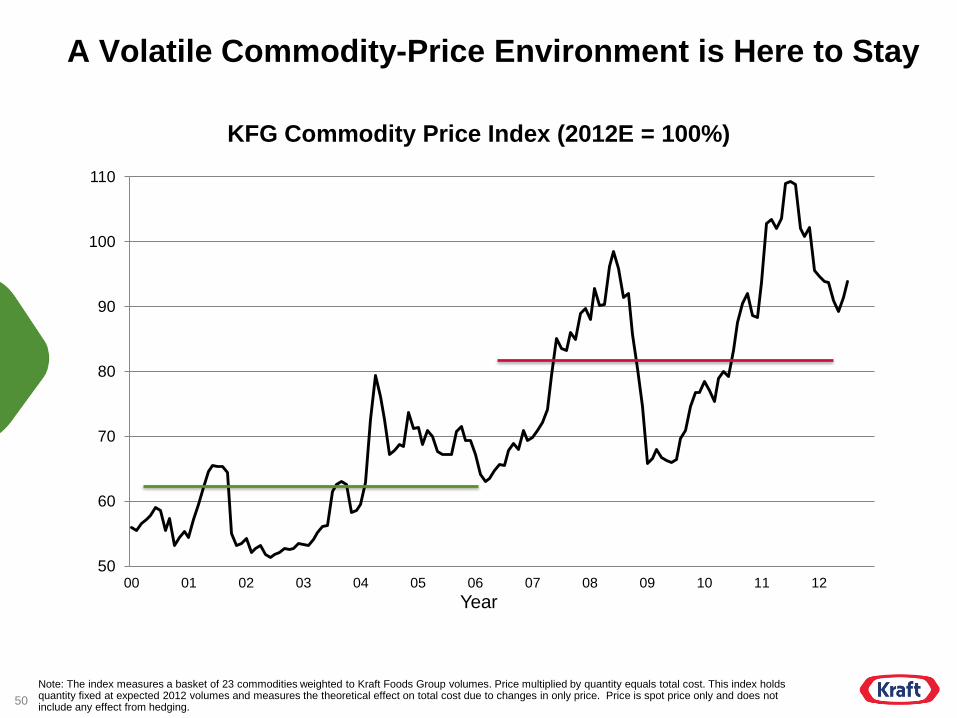
But Our Financial Targets Must Reflect Several Realities
•A volatile commodity-price environment is here to stay
•We must reinvest to deliver sustainable growth
•We put dollars in shareholders’ pockets… not growth rates, not margins
50
A Volatile Commodity-Price Environment is Here to Stay
50
60
70
80
90
100
110
00 01 02 03 04 05 06 07 08 09 10 11 12
KFG Commodity Price Index (2012E = 100%)
Year
Note: The index measures a basket of 23 commodities weighted to Kraft Foods Group volumes. Price multiplied by quantity equals total cost. This index holds quantity fixed at expected 2012 volumes and measures the theoretical effect on total cost due to changes in only price. Price is spot price only and does not include any effect from hedging.
51
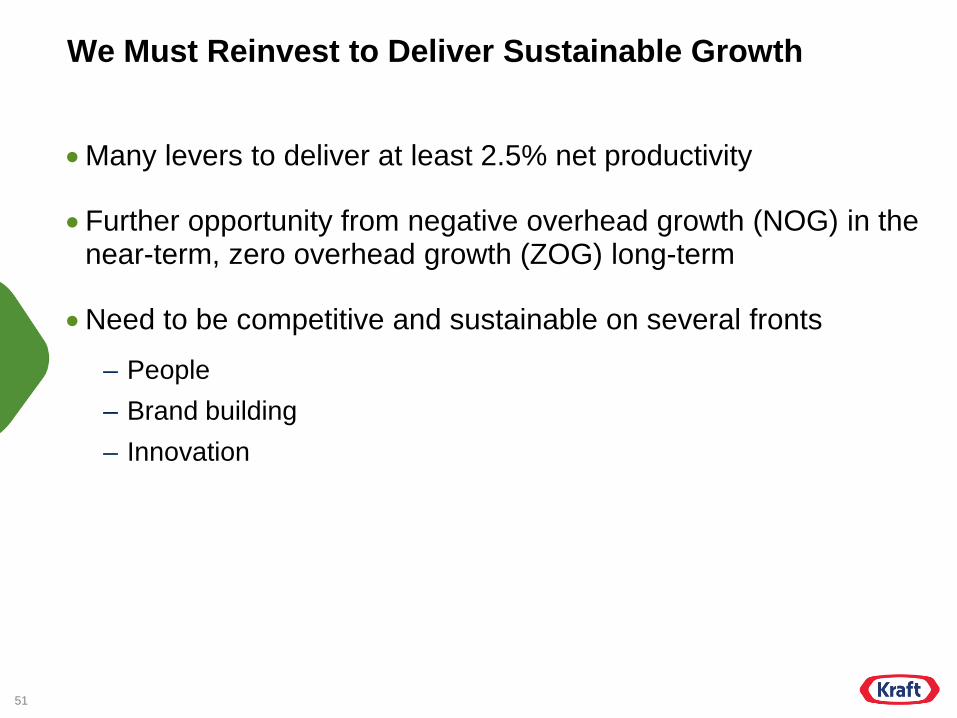
We Must Reinvest to Deliver Sustainable Growth
•Many levers to deliver at least 2.5% net productivity
•Further opportunity from negative overhead growth (NOG) in the near-term, zero overhead growth (ZOG) long-term
•Need to be competitive and sustainable on several fronts
– People – Brand building – Innovation
52
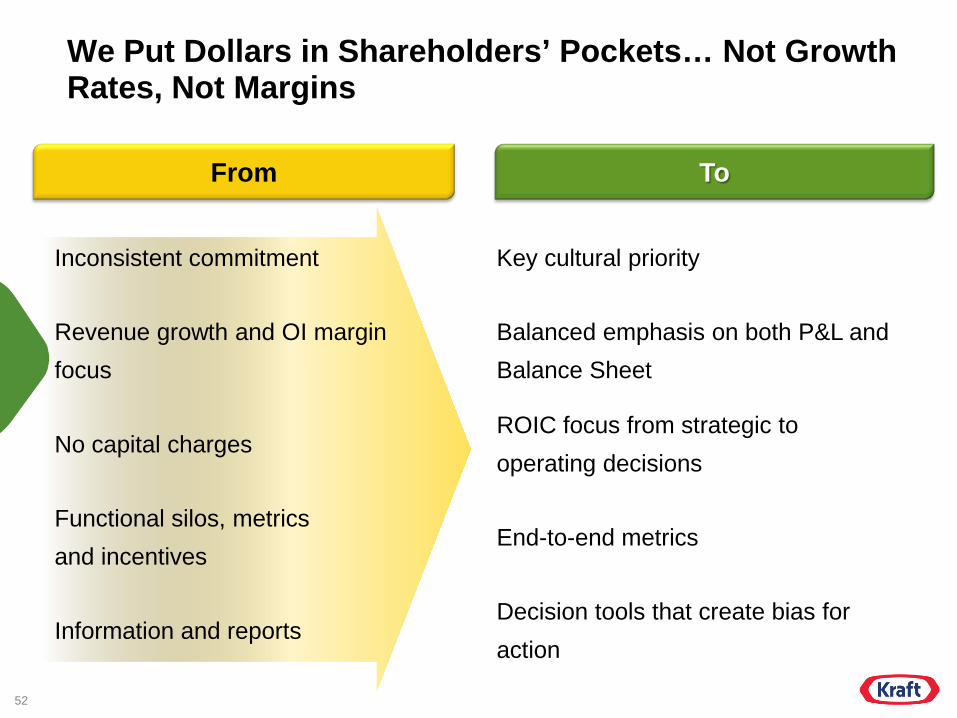
We Put Dollars in Shareholders’ Pockets… Not Growth Rates, Not Margins
From
Inconsistent commitment
Revenue growth and OI margin focus
No capital charges
Functional silos, metrics and incentives
Information and reports
To
Key cultural priority
Balanced emphasis on both P&L and Balance Sheet
ROIC focus from strategic to operating decisions
End - to - end metrics
Decision tools that create bias for action
53
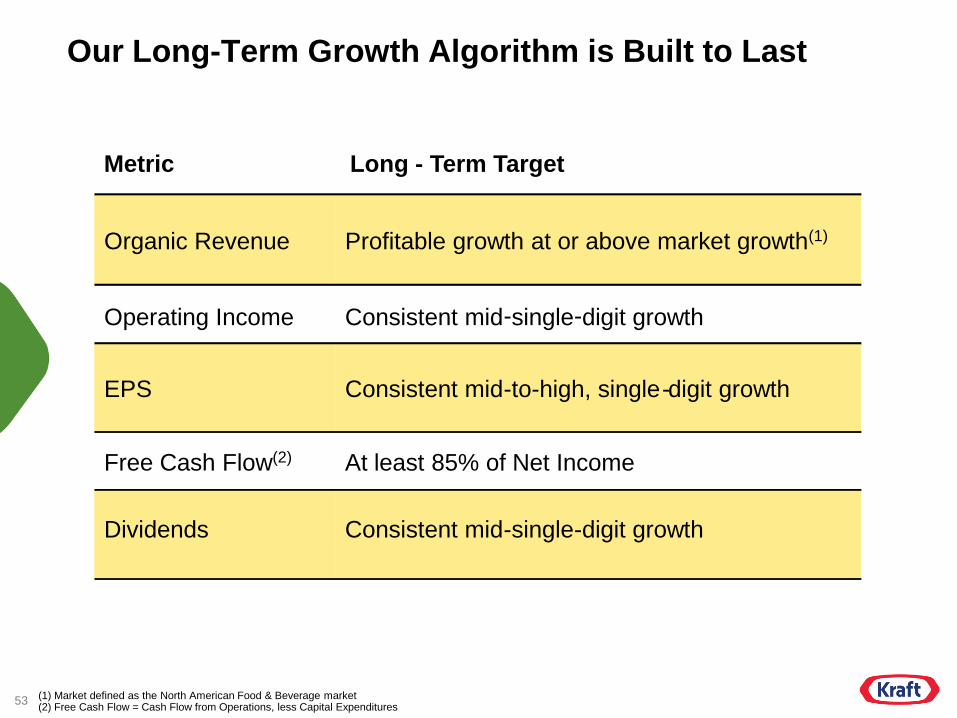
Our Long-Term Growth Algorithm is Built to Last
(1) Market defined as the North American Food & Beverage market (2) Free Cash Flow = Cash Flow from Operations, less Capital Expenditures
Metric Long - Term Target
Organic Revenue Profitable growth at or above market growth (1)
Operating Income Consistent mid single digit growth - -
EPS Consistent mid - to - high, single - digit growth
Free Cash Flow (2) At least 85% of Net Income
Dividends Consistent mid - single - digit growth
54
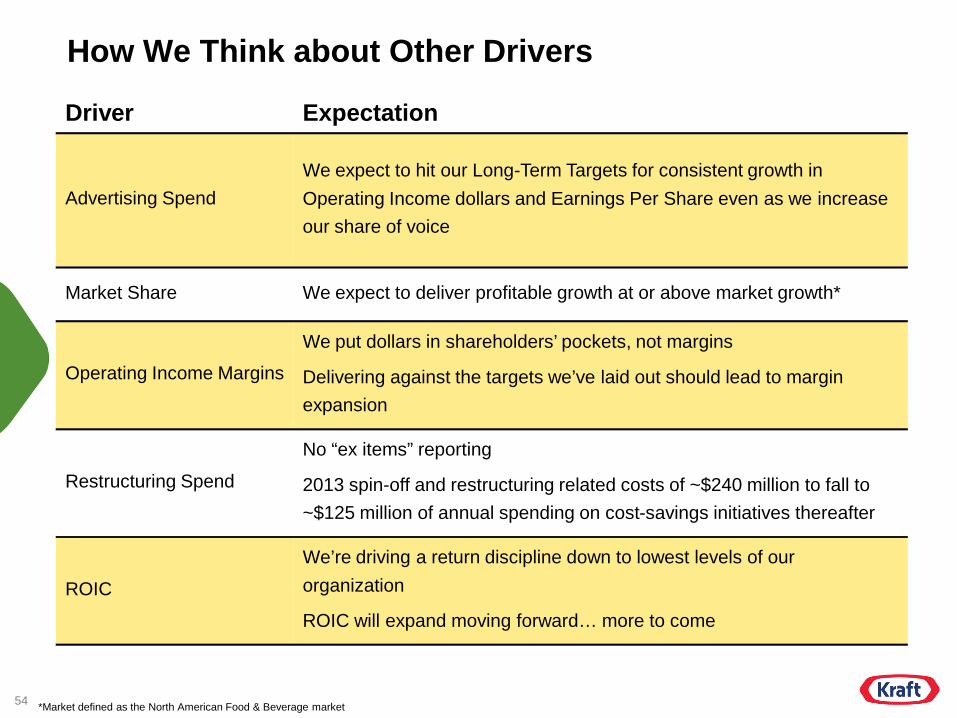
How We Think about Other Drivers
*Market defined as the North American Food & Beverage market
Driver Expectation
Advertising Spend We expect to hit our Long - Term Targets for consistent growth in Operating Income dollars and Earnings Per Share even as we increase our share of voice
Market Share We expect to deliver profitable growth at or above market growth*
Operating Income Margins
We put dollars in shareholders’ pockets, not margins
Delivering against the targets we’ve laid out should lead to margin expansion
Restructuring Spend
No “ex items” reporting
2013 spin - off and restructuring related costs of ~$240 million to fall to ~$125 million of annual spending on cost - savings initiatives thereafter
ROIC
We’re driving a return discipline down to lowest levels of our organization
ROIC will expand moving forward… more to come
55
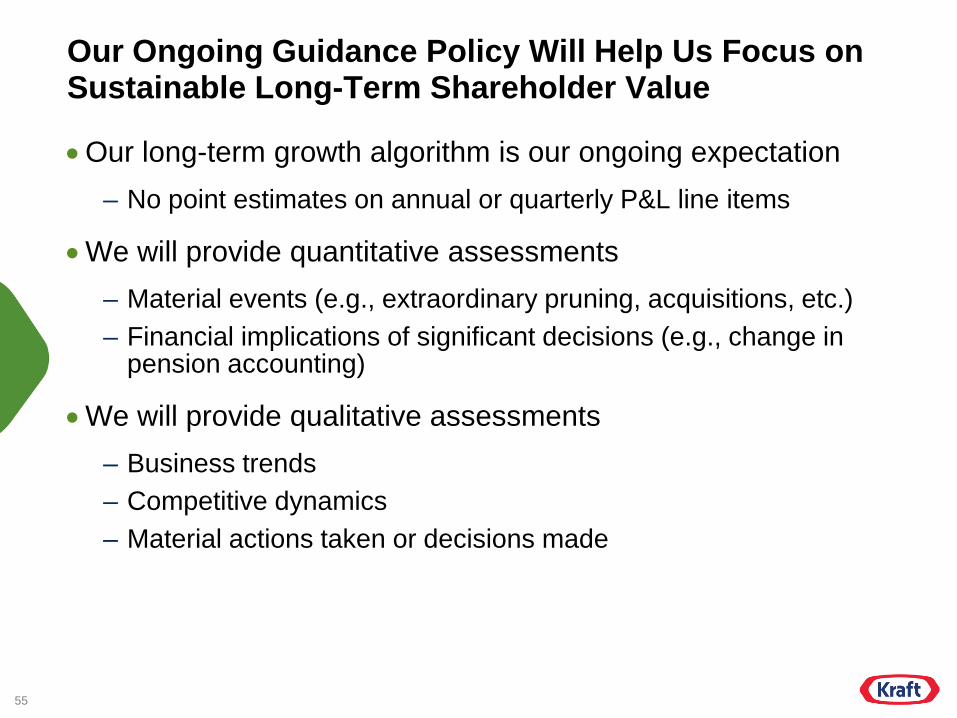
Our Ongoing Guidance Policy Will Help Us Focus on Sustainable Long-Term Shareholder Value
•Our long-term growth algorithm is our ongoing expectation – No point estimates on annual or quarterly P&L line items
•We will provide quantitative assessments – Material events (e.g., extraordinary pruning, acquisitions, etc.) – Financial implications of significant decisions (e.g., change in
pension accounting)
•We will provide qualitative assessments – Business trends – Competitive dynamics – Material actions taken or decisions made
56
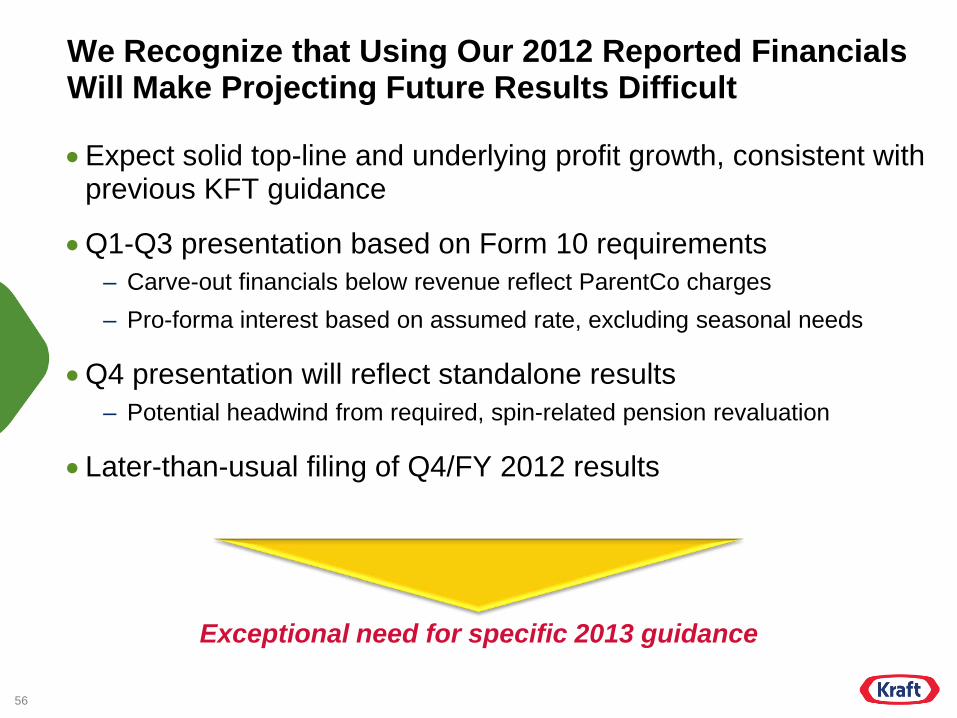
We Recognize that Using Our 2012 Reported Financials Will Make Projecting Future Results Difficult
•Expect solid top-line and underlying profit growth, consistent with previous KFT guidance
•Q1-Q3 presentation based on Form 10 requirements – Carve-out financials below revenue reflect ParentCo charges – Pro-forma interest based on assumed rate, excluding seasonal needs
•Q4 presentation will reflect standalone results – Potential headwind from required, spin-related pension revaluation
•Later-than-usual filing of Q4/FY 2012 results
Exceptional need for specific 2013 guidance

57
2013 Guidance: Continued Momentum, Clean Base
• Organic revenue growth in line with market growth – Including pruning impact of ~(1)pp
• Productivity, overhead savings to drive ~$2.60 GAAP EPS – Interest expense ~$520MM – Tax rate ~35% – Includes restructuring costs of ~$240MM or $0.26 per share versus
expected ongoing costs of ~$125MM or $0.14 per share per annum
• “Typical” seasonality of quarterly sales and earnings – Normally generate ~48% of earnings in H1, ~52% in H2
• Free Cash Flow ~70% of GAAP net income – Below long-term target of at least 85% due to fifth tax payment in 2013
• We expect to recommend an annual dividend of $2.00 per share
58
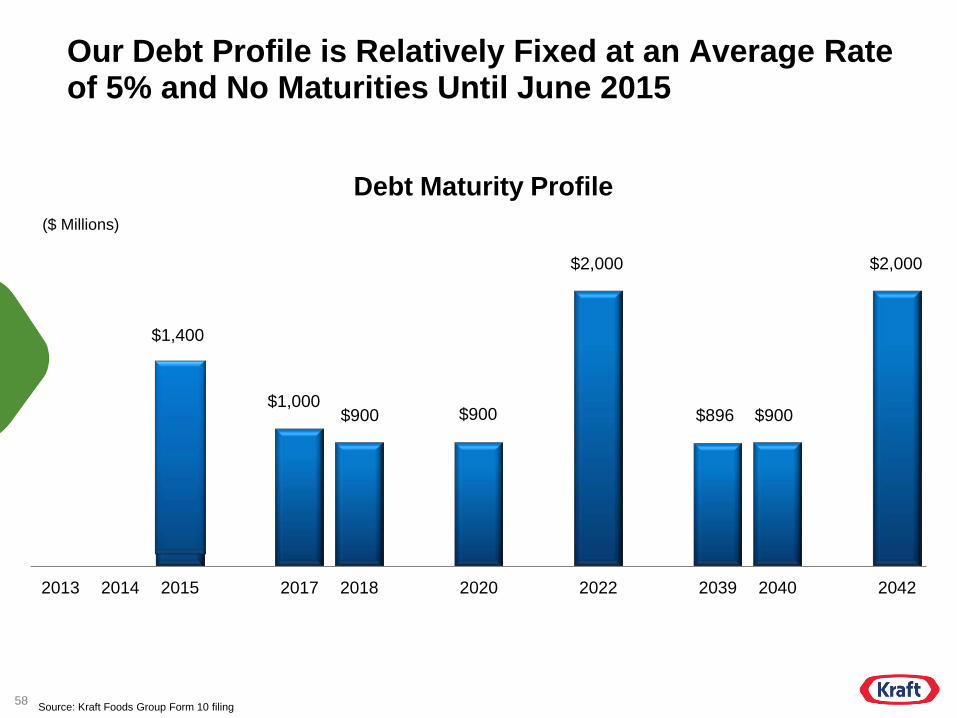
2013 2014 2015 2017 2018 2020 2022 2039 2040 2042
Our Debt Profile is Relatively Fixed at an Average Rate of 5% and No Maturities Until June 2015
($ Millions)
$1,400
$1,000 $900 $900
$2,000
$896 $900
$2,000
Debt Maturity Profile
Source: Kraft Foods Group Form 10 filing
59
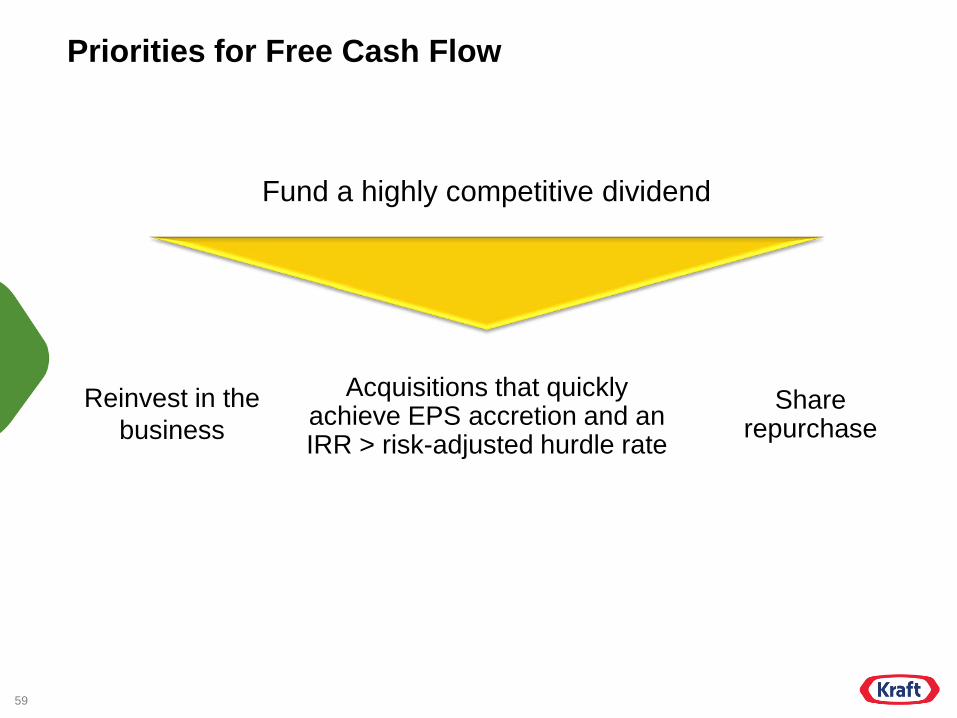
Priorities for Free Cash Flow
Fund a highly competitive dividend
Reinvest in the business
Acquisitions that quickly achieve EPS accretion and an IRR > risk-adjusted hurdle rate
Share repurchase

60
We are Well-Positioned to Deliver Predictable Returns
Superior Dividend Payout
Profitable Top-Line Growth
Consistent Bottom-Line
Growth
Tony Vernon Chief Executive Officer
62
Our Mission
Make Kraft North American Food & Beverage Company
THE Innovator
THE Strongest Portfolio
THE Lowest Cost Producer
Best Investment in the Industry

63
The New Kraft Foods Group
• Who we are
• What we’ll do
• What to expect
• Meet our team

65
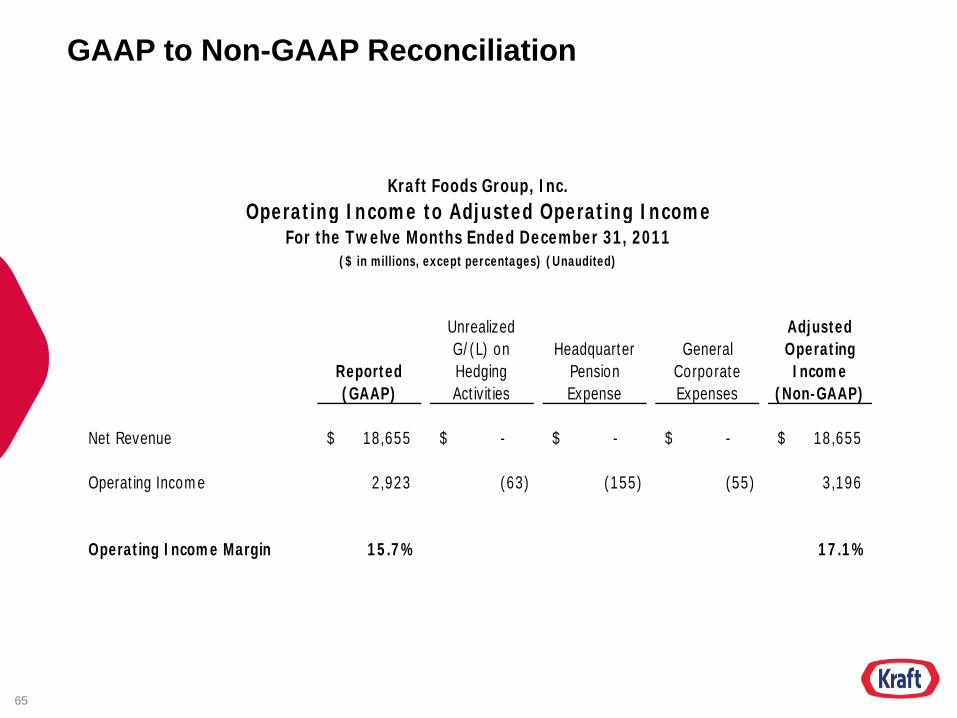
GAAP to Non-GAAP Reconciliation
Reported (GAAP)
Unrealized G/(L) on Hedging Activities
Headquarter Pension Expense
General Corporate Expenses
Adjusted Operating Income
(Non-GAAP)
Net Revenue 18,655$ -$ -$ -$ 18,655$
Operating Income 2,923 (63) (155) (55) 3,196
Operating Income Margin 15.7% 17.1%
Kraft Foods Group, Inc.Operating Income to Adjusted Operating Income
For the Twelve Months Ended December 31, 2011($ in millions, except percentages) (Unaudited)

66
GAAP to Non-GAAP Reconciliation
Reported (GAAP)
Impact of Divestitures
Impact of the 53rd Week of
ShipmentsImpact of Currency
Organic (Non-GAAP)
Reported (GAAP)
Organic(Non-GAAP) Vol / Mix Pricing
June 30, 2012 4,786$ -$ -$ 25$ 4,811$ 0.9% 1.5% (1.4)pp 2.9pp
June 30, 2011 4,741 - - - 4,741
March 31, 2012 4,453 - - 6 4,459 1.1% 3.4% (2.6)pp 6.0pp
March 31, 2011 4,405 (91) - - 4,314
December 31, 2011 5,035 - (225) 4 4,814 9.2% 8.1% (0.2)pp 8.3pp
December 31, 2010 4,611 (159) - - 4,452
September 30, 2011 4,474 - - (33) 4,441 4.1% 6.6% (0.8)pp 7.4pp
September 30, 2010 4,297 (130) - - 4,167
Trailing four quarter average 3.8% 4.9% (1.3)pp 6.2pp
Note: Reported net revenues include intercompany sales with Kraft ParentCo subsidiaries which were $54 million for the six monthsended June 30, 2012 and $100 million for the twelve months ended December 31, 2011.
Organic Growth DriversPercent Change
Kraft Foods Group, Inc.Net Revenue to Organic Net Revenue
For the Three Months Ended,($ in millions, except percentages) (Unaudited)
67
GAAP to Non-GAAP Reconciliation
Reported (GAAP)
Restructuring Costs
Unrealized G/(L) on Hedging Activities
Headquarter Pension Expense
General Corporate Expenses
Adjusted Operating Income
(Non-GAAP)
June 30, 2012 2,963$ (116)$ (26)$ (194)$ (40)$ 3,339$
June 30, 2011 2,929 - 15 (146) (81) 3,141
Trailing four quarter growth 1.2% 6.3%
Kraft Foods Group, Inc.Operating Income to Adjusted Operating Income
For the Trailing Four Quarters Ended,($ in millions, except percentages) (Unaudited)
68
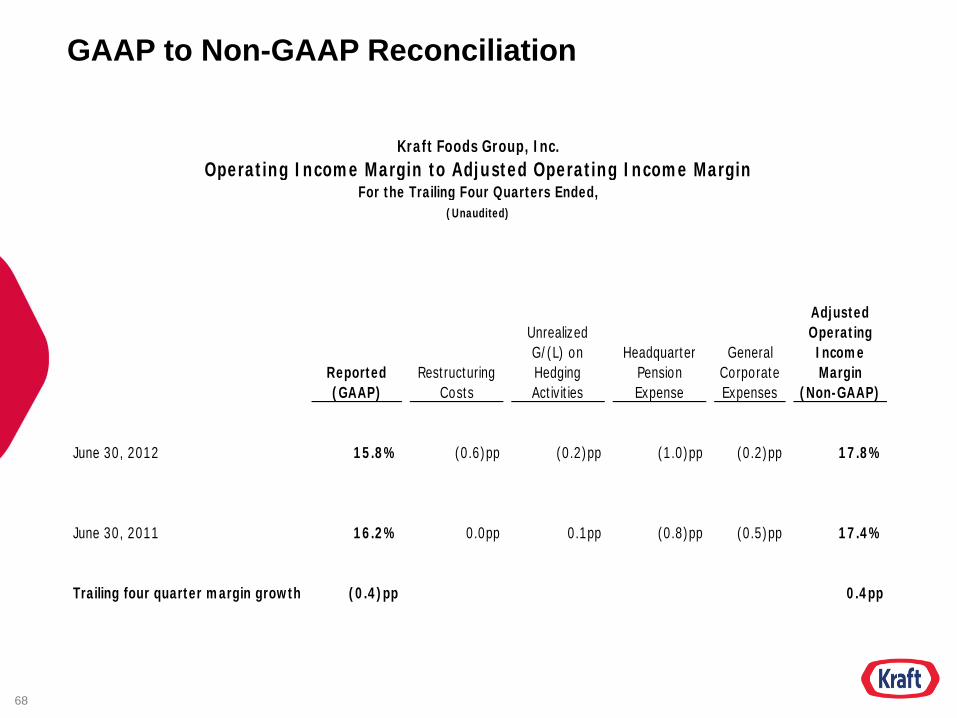
GAAP to Non-GAAP Reconciliation
Reported (GAAP)
Restructuring Costs
Unrealized G/(L) on Hedging Activities
Headquarter Pension Expense
General Corporate Expenses
Adjusted Operating Income Margin
(Non-GAAP)
June 30, 2012 15.8% (0.6)pp (0.2)pp (1.0)pp (0.2)pp 17.8%
June 30, 2011 16.2% 0.0pp 0.1pp (0.8)pp (0.5)pp 17.4%
Trailing four quarter margin growth (0.4)pp 0.4pp
Kraft Foods Group, Inc.Operating Income Margin to Adjusted Operating Income Margin
For the Trailing Four Quarters Ended,(Unaudited)