The Motivation for Renewable Energy and its Comparison ...
19
Copyright © 2019 by Author/s and Licensed by Modestum Ltd., UK. This is an open access article distributed under the Creative Commons Attribution License which permits unrestricted use, distribution, and reproduction in any medium, provided the original work is properly cited. European Journal of Sustainable Development Research 2019, 3(1), em0076 ISSN: 2542-4742 The Motivation for Renewable Energy and its Comparison with Other Energy Sources: A Review Rajvikram Madurai Elavarasan 1* 1 Department of Electrical and Electronics Engineering, Sri Venkateswara College of Engineering, Chennai, Sriperumbudur, INDIA *Corresponding Author: [email protected] Citation: Elavarasan, R. M. (2019). The Motivation for Renewable Energy and its Comparison with Other Energy Sources: A Review. European Journal of Sustainable Development Research, 3(1), em0076. https://doi.org/10.20897/ejosdr/4005 Published: February 6, 2019 ABSTRACT Energy is the backbone of the evolution of humanity, it has assisted mankind to endeavor through various ages of history. The quest to obtain energy with minimal expenditure and pollution is still being worked on and will continue on in the future. Even in this modern age, energy production in several developing countries often falls short of energy requirements which results in frequent power cuts. As the world economy continues to grow, energy consumption is expected to continue to grow. Fossil fuel is limited, so it is important to consider other sources of energy e.g. renewables especially solar to meet the energy demands in the future. The world has diverse solar energy sources which are not yet fully explored. This review sheds light on the solar renewable energy and other non-renewable sources of energy available in the world and a comparative analysis of both the energy resources across the world is also included as a separate section titled ‘Comparative analysis’. It also gives a brief overview of the various techniques employed by different countries to overcome the energy crisis through and also a framework for employing such techniques in countries which are lagging in energy production in order to fully avail the benefits of energy sources, which are abundant in the world. Keywords: energy, power cuts, energy demand, renewable sources, non-renewable resources INTRODUCTION World’s total installed grid-connected power generation capacity stands at over 343,898.39MW as of 31 May 2018 where the power generation is mostly dominated by coal and oil reserves which holds a major share at 66.73% whereas renewable energy from large dam based hydro, biomass, solar and wind contribute 33.27% to the total energy generation. World’s geographical attribute is ideal for renewable energy generation. The world has a total installed of about 114,425.81MW as of 31 May 2018. Further, the potential for solar energy installed is estimated to be 69,022MW as of 31 May 2018 (Renewable energy in India, 2017). It is estimated that the global barrel of crude oil reserves is at 1.688 trillion by the end of 2013, this reserve will last only 53.3 years with the current rate of extraction. Also, there are about 1.1 trillion tons of proven coal reserves worldwide, which will last around 150 years. The gas reserves will last up to 52 years. There is a question that one should ask - what is to be done once all the fossil fuel reserves depleted? Compared to fossil fuels, not much renewable energy sources are used for power generation, as renewables require higher operating costs and efficiency is not high when compared to fossil fuels. The worlds energy resources are represented in the form of a pie chart (Figure 1).
Transcript of The Motivation for Renewable Energy and its Comparison ...
Copyright © 2019 by Author/s and Licensed by Modestum Ltd., UK. This is an open access article distributed under the Creative Commons Attribution License which permits unrestricted use, distribution, and reproduction in any medium, provided the original work is properly cited.
European Journal of Sustainable Development Research 2019, 3(1), em0076 ISSN: 2542-4742
The Motivation for Renewable Energy and its Comparison with Other Energy Sources: A Review
Rajvikram Madurai Elavarasan 1*
1 Department of Electrical and Electronics Engineering, Sri Venkateswara College of Engineering, Chennai, Sriperumbudur, INDIA *Corresponding Author: [email protected] Citation: Elavarasan, R. M. (2019). The Motivation for Renewable Energy and its Comparison with Other Energy Sources: A Review. European Journal of Sustainable Development Research, 3(1), em0076. https://doi.org/10.20897/ejosdr/4005 Published: February 6, 2019 ABSTRACT Energy is the backbone of the evolution of humanity, it has assisted mankind to endeavor through various ages of history. The quest to obtain energy with minimal expenditure and pollution is still being worked on and will continue on in the future. Even in this modern age, energy production in several developing countries often falls short of energy requirements which results in frequent power cuts. As the world economy continues to grow, energy consumption is expected to continue to grow. Fossil fuel is limited, so it is important to consider other sources of energy e.g. renewables especially solar to meet the energy demands in the future. The world has diverse solar energy sources which are not yet fully explored. This review sheds light on the solar renewable energy and other non-renewable sources of energy available in the world and a comparative analysis of both the energy resources across the world is also included as a separate section titled ‘Comparative analysis’. It also gives a brief overview of the various techniques employed by different countries to overcome the energy crisis through and also a framework for employing such techniques in countries which are lagging in energy production in order to fully avail the benefits of energy sources, which are abundant in the world.
Keywords: energy, power cuts, energy demand, renewable sources, non-renewable resources
INTRODUCTION
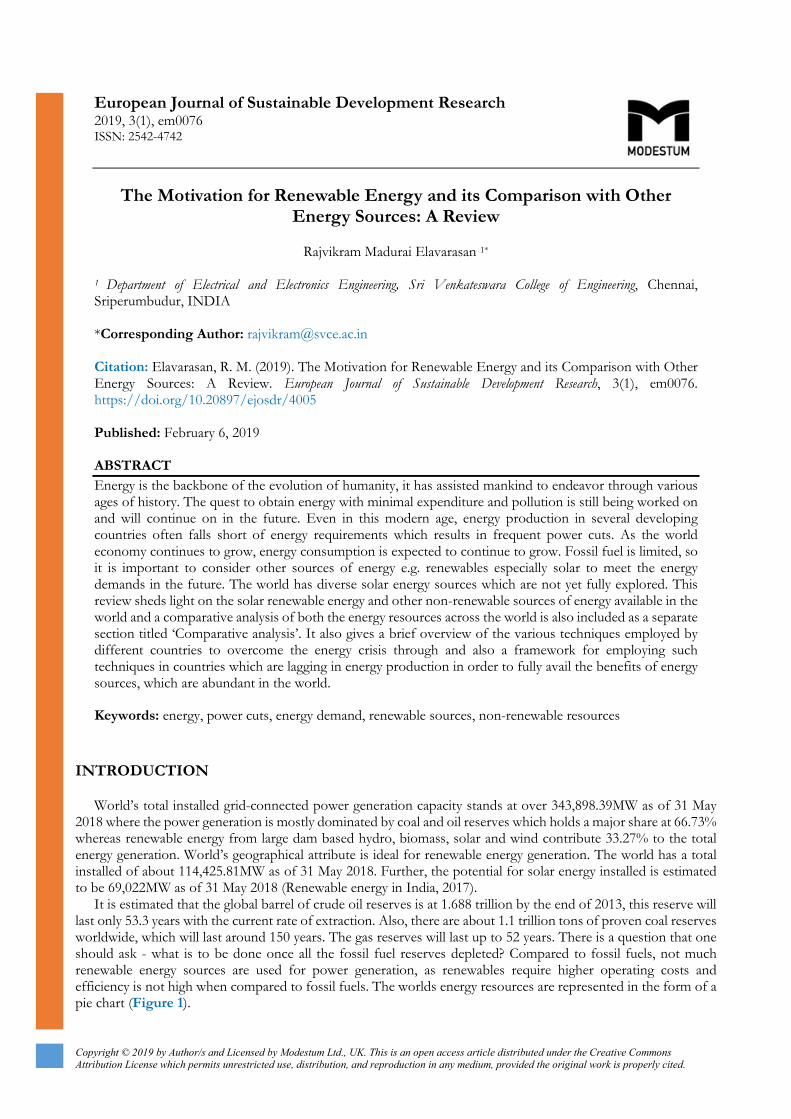
World’s total installed grid-connected power generation capacity stands at over 343,898.39MW as of 31 May 2018 where the power generation is mostly dominated by coal and oil reserves which holds a major share at 66.73% whereas renewable energy from large dam based hydro, biomass, solar and wind contribute 33.27% to the total energy generation. World’s geographical attribute is ideal for renewable energy generation. The world has a total installed of about 114,425.81MW as of 31 May 2018. Further, the potential for solar energy installed is estimated to be 69,022MW as of 31 May 2018 (Renewable energy in India, 2017).
It is estimated that the global barrel of crude oil reserves is at 1.688 trillion by the end of 2013, this reserve will last only 53.3 years with the current rate of extraction. Also, there are about 1.1 trillion tons of proven coal reserves worldwide, which will last around 150 years. The gas reserves will last up to 52 years. There is a question that one should ask - what is to be done once all the fossil fuel reserves depleted? Compared to fossil fuels, not much renewable energy sources are used for power generation, as renewables require higher operating costs and efficiency is not high when compared to fossil fuels. The worlds energy resources are represented in the form of a pie chart (Figure 1).
Elavarasan / The Motivation for Renewable Energy
2 / 19 © 2019 by Author/s
Technological advancements made on renewable energy resources shows that the efficiency of renewable energy resources has been increased and they can serve as a replacement for the non-renewable energy resources in the future. Also, these renewable energy resources are friendly to the environment and they do not pollute the surroundings. Thus, apart from serving as alternative energy resources, these energy resources are also environmental friendly in nature. This work clearly shows the importance of renewable energy resources and also suggests countries which are lagging in energy production to use renewable energy resources to satisfy their energy demand.
This work first illustrates the classification of energy resources and the various kinds of available energy resources across the world. Also, the research progresses on solar and wind energy resources along with their technological advancements are highlighted. A comparative analysis of non-renewable energy resources and renewable energy resources is also included as a separate section.
METHODOLOGY
This paper mainly focuses on the comparison of the renewable and non-renewable sources of energy. This study was done in order to gather the information and to conclude the importance of renewable energy sources than non-renewable sources of energy. The study was not restricted to a particular state or a particular country rather made with a wider focus including all the countries across the globe. In order to get reliable data, a literature review was performed in various steps. A countries major energy production and the availability of the resources in various other countries were discussed. The number of articles that have met the search criteria was around 150. The search narrowed down to 94 taking into account only the major producers of renewable and non-renewable resources. Most of these articles were dated between 2006 and 2018.
In the first step, the abstract was constructed and the details about various non-renewable energy resources were assessed. Various developed techniques and recent advancements in this stream were described. 25 articles included concern about non-renewable sources of energy. Similar details about renewable energy resources were the core of the second step of the study. 59 articles included provides details on the renewable sources of energy.
The third step deals with the recent progress of these energy resources and the main focus was attributed to the solar energy and the wind energy. The materials collected were screened thoroughly and a comparative analysis has been made on the solar energy and the non-renewable energy resources. This comparison plotted has been included in a separate section to emphasize the use of solar energy. Real-time data for the solar energy source were included dated between 2011 and 2018.
ENERGY CLASSIFICATION IN THE WORLD
The world has a wide selection of energy resources i.e. (both renewable and non - renewable) which can be readily benefited for power generation and consumption (Energy classification, 2018). Energy is broadly classified
Figure 1. Pie chart representing non-renewable resources (World population clock, 2017)

European Journal of Sustainable Development Research, 3(1), em0076
© 2019 by Author/s 3 / 19
into two types i.e. renewable and non – renewable. Non- renewable energy is again divided into four types as coal, crude oil, natural gas and nuclear. Renewable sources are also classified as wind, solar, hydro, geothermal and biogas. A flow graph of the proposed review work is also added (Figure 2).
NON–RENEWABLE ENERGY SOURCES RESEARCHES AND OUTCOMES
Non–renewable energy sources refer to the energy source whose economic value cannot be replaced by other natural means on an equal level of consumption i.e. energy sources which are used cannot be used again. Generally, the formation of such non–renewable sources takes billions of years. Their use is generally not sustainable. Generally, most researches were based on obtaining maximum energy output, while using as minimum energy source required (Ming et al., 2018). The impact of consumption of renewable and non-renewable energy on economic growth have also been compared. A research was done on long-run relationship exists between energy utilization and commercial improvement in 30 sub–Saharan African countries, it could be seen that a 10% hike in non-renewable energy utilization leads to a hike of about 2.11% in economic growth rate (Samuel et al., 2018). The world’s energy consumption is presented as a figure (Figure 3).
Figure 2. Flowgraph of the review paper
Figure 3. World’s energy consumption (Today energy, 2018)
Renewable Energy Resources
Non-Renewable Energy Resources
Solar
Hydro Energy
Tidal Energy
Petroleum Nuclear
Geothermal Energy Coal
Energy
Natural Gas
Biomass
Wind

Elavarasan / The Motivation for Renewable Energy
4 / 19 © 2019 by Author/s
Coal
Coal is the most widely used fossil fuel all over the world. Coal is mainly used as a fuel because of its readily available nature. In order to develop the efficiency of coal production, the National Coal Development Corporation was set up (Quing and Guihuan, 2017). For about the last three decades China stands first in the coal production globally (Coal production, 2018). Several kinds of researches were done in order to improve coal quality in recent times. One such research focused on fine-tuning of various combustion parameters of boilers in order to get best-optimized combustion possible (Quing and Guihuan, 2017). Incomplete combustion of fossil fuels often leads to NOX emission which is a crucial atmospheric pollutant, so in order to reduce NOX emission special prediction and optimization algorithms have been developed. Other such research focused on determining the coal quality by the use of a multivariable data analysis algorithm (Ming et al., 2018; Binzhong and Graham, 2016). This method is superior to the traditional methods of determining coal constituents such as ash, moisture, fixed carbon content etc., which is determined via lab samples from various expedition holes.
Petroleum
Petroleum is a dark colored liquid (oil) found deep in the earth’s crust it is generally separated into various components by a fractional distillation which separates out various components of petroleum at the various boiling point. The fractionating column consists of tall cylindrical vessels with a number of levels where different components are separated. Various researches are carried out in order to mitigate the effect of petroleum pollutants by physical, chemical and biological methods (Qaderi and Azizi, 2018). One such biological process is the moving bed biofilm reactor. It is observed that under optimal conditions the efficiency of the reactor was high and can be used for petroleum wastewater treatment (Qaderi and Azizi, 2018).
Also, till date, it has been quite challenging to understand the energy efficiency and greenhouse gas (GHG) emissions in the refineries because of their complexity and different variables within the refineries (Jeongwoo and Vincent, 2015). The categories of refineries were simplified and were broadly classified based on crude density (API gravity) and heavy product (HP) yields. The results show the effect of (GHG) emissions on refineries.
Natural Gas
Natural gas is a fossil fuel handled as a source of heating, cooking and electricity generation. It could also be benefited as a source of fuel for vehicles. It is a naturally occurring mixture of hydrocarbon in the form of a gas primarily subsist of CH4 and some fluctuating number of other higher alkanes and small amounts of CO2, N2, H2S or He (Saurabh et al., 2011). It is set up due to the decomposition of plant and animal matter under intense heat and pressure over millions of years. The energy obtained from sunlight in plants is stored as chemical bonds in the gas. Switching from coal burnt to natural gas burnt energy generators are considered to be a step towards emission reduction. It could be seen that Natural gas can also be used for energy production (Saurabh et al., 2011).
Nuclear
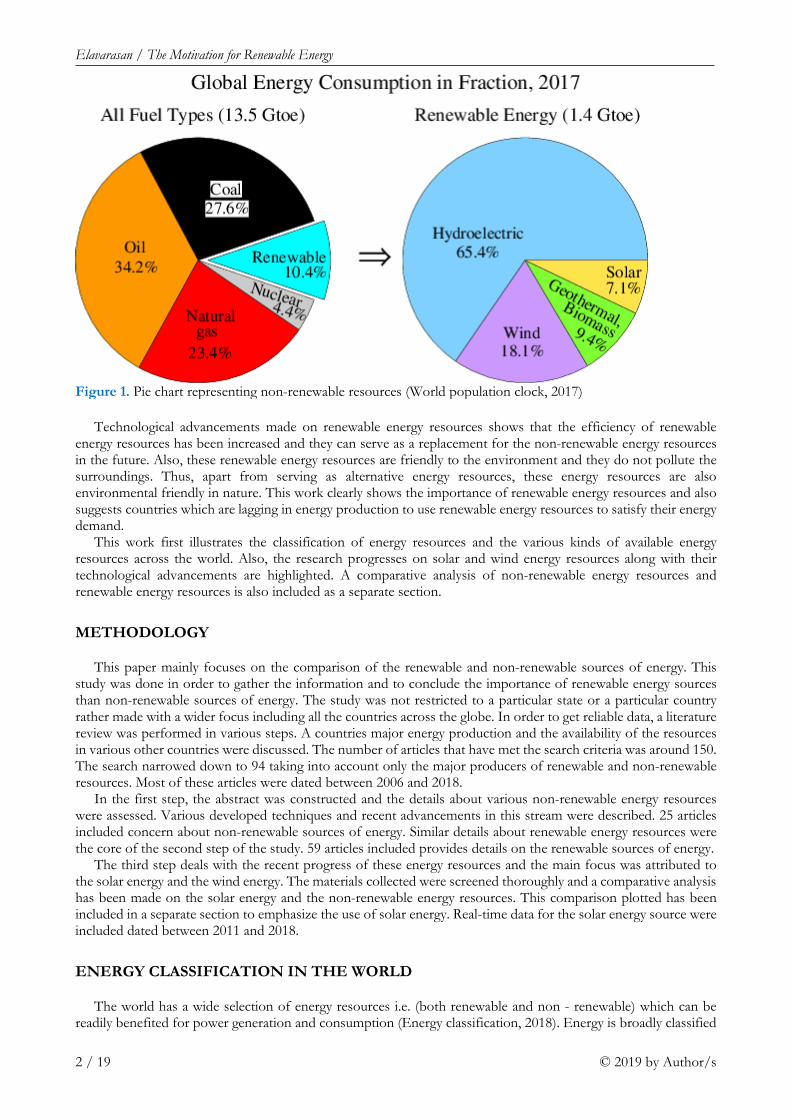
Global warming is currently considered as one of the greatest threat in which the Greenhouse Gas (GHG) emission is the leading problem today (Charikleia et al., 2013). With the demand to satisfy energy needs and to reduce GHG emission has encouraged the usage of Nuclear energy. It is seen that without Nuclear power the European countries CO2 emission would be one-third time higher (Charikleia et al., 2013). Figure 4 shows the contribution of nuclear energy to the world’s energy consumption. The top three countries in nuclear production are the USA, Germany and Japan with the production of 24.34%, 11.04%, and 10.87% respectively (Zhang et al., 2017; Parinya and Somchai, 2013; Qiang et al., 2018).
Lithuania is currently focussing on constructing a Nuclear power plant in order to reduce CO2 emission (Dalia, 2012; Dalia and Asta, 2010). Recent researchers in China has now been focussed on nuclear H2 generation through iodine-sulfur for the past 10 years (Chuan et al., 2016). Also, the Chinese government has started to promote nuclear irrespective of public opinion to reduce the environmental pollution after the Fukushima disaster (Xiaopeng and Xiaodan, 2016; Ming et al., 2016). Table 1 shows the three major nuclear accidents.
Nuclear power is mostly not preferred due to the risk factor and an example of it is the accidents that have happened in Fukushima. The nuclear plant was damaged by a tsunami after an earthquake (Qiang et al., 2013). Also, countries like Germany and other’s energy policy has been influenced by the Fukushima disaster (Mariangela and Renato, 2016). But some countries generate their maximum electricity from nuclear. Countries like France derives about 75% of its electricity from Nuclear. Thus, nuclear energy has its own advantages and disadvantages.
European Journal of Sustainable Development Research, 3(1), em0076
© 2019 by Author/s 5 / 19
RENEWABLE ENERGY RESOURCE
Renewable energy resources are now replacing non-renewable energy resource as they are environmentally clean and found abundant in nature (Iñaki et al., 2018; Claudia and Cinzia, 2017). In order to reduce the greenhouse gas effect, countries are now focussing on renewable energy resources (João and Victor, 2016). Also, hybrid systems such as the combination of two systems are also made for better output (Shaopeng et al., 2018).
Solar Energy
Solar Energy is an emerging technology trend in the world and the leading countries in solar production are presented as Table 2 (Jessica et al., 2018). Its installation increased from 1790MW in 2001 to 1, 37,000 MW in 2013, which is an average increase of 40% every year (Yawen et al., 2018). The energy conversion efficiency is about 15%-20% on an average. Though there are some fluctuations in the output power developed technological advancements show that stable and reliable power can be developed. Various researchers have been processing in this field as it is environmentally friendly and the cost of production is also being reduced (Stephen et al., 2018; Alexandre and Dorel, 2018). The development of solar power in recent years is presented as a bar chart in Figure 5. The United States has set up a National Solar Radiation Database to record the regions consisting of solar radiation and meteorological data for the last 23 years (Manjit et al., 2018). This data has been given open access for researchers and it hopes to be a promising technology.
Roof Top is a specific approach to receive solar energy and it is an emerging technique in Queensland, Australia (Shafiullah et al., 2014). Low voltage network in the place of Rockhampton and Yeppoon are now replaced by roof-top in-order to cut down fossil fuel and greenhouse gas emission. Since the last 23 years, the United States has set up a National Solar Radiation Database to record the regions consisting of solar radiation and
Figure 4. Worlds electricity generation
Table 1. Three major nuclear accidents (Ming et al., 2016) Nuclear accidents INES levels 1979-Three Mile Island (TMI) nuclear accident INES 5 2011-Fukushima nuclear accident INES 7 2011-Fukushima nuclear accident INES 4+
Table 2. Top 10 Solar Producing Countries in the world (Top solar energy producing countries, 2018) Rank Country Total Capacity GW, 2016 1 China 78.07 2 Japan 42.75 3 Germany 41.22 4 United States 40.3 5 Italy 19.28 6 United Kingdom 11.63 7 India 9.01 8 France 7.13 9 Australia 5.9 10 Spain 5.49
21%
18%
14%5%
42%
Natural Gas Renewable Nuclear Liquids Coal

Elavarasan / The Motivation for Renewable Energy
6 / 19 © 2019 by Author/s
meteorological data (Manjit et al., 2018). This data has been given open access for researchers and it hopes to be a promising technology.
Solar energy is very much essential to avoid climatic change due to global warming. A survey conducted shows that the desert in Western Iraq has the extreme solar electricity generation of about 1776 MJ/m2. Also, it shows that the sites with 7200 MJ/m2/year for CSP and 7400 MJ/m2/year for PV are equivalent to 1-2 barrels of fuel oil/m2 annually (Douri and Fayadh, 2016). Some of the recent developments in solar are thin film solar cell technology and Hafnium and Tantalum Carbides as solar receivers (Viresh, 2012; Elisa et al., 2011). Hafnium and Tantalum has very poor optical properties so they are used in high-temperature appliances. They also have good optical properties, highest melting point, highest strength and high thermal and electrical conductivities. Hence, they can be used as receivers to absorb sun rays (Mahdis et al., 2016).
Roof Top is a specific approach to receive solar energy and it is an emerging technique in Queensland, Australia (Shafiullah et al., 2014). Low voltage network in the place of Rockhampton and Yeppoon are now replaced by roof-top in-order to cut down fossil fuel and greenhouse gas emission. Another advancement is the direct solar thermal power generation. The demand on military and deep-space exploration for system stableness, high-maintenance and quietness have opened the path for direct solar thermal power generation (Yue and Jing, 2009).
Wind Energy
Wind energy is one of the promising technology that is developing and promising to satisfy our future energy needs (Changzheng et al., 2013; Benjamin, 2017). China ranks 1st in the production of wind energy across the world, with the capacity of wind power 68.7GW which reports for 34.7% of globally equipped capacity at the end of 2016 (Lingyue et al., 2018; Bikash, 2017). Nowadays renewable energy resources play a major role in power production and so numerous researches are being carried out for the better usage of such resources (Farah and Eltamaly, 2013). Wind Turbine play the major role in deciding the power produced, efficiency, output etc. The renewable resources provide 8.4% of the world’s power requirement. Now India is much focusing on a huge growth in wind energy utilization and production as well.
Greenhouse gas emission has been reduced by using renewable energy resources which in-turn reduces global warming (Jensen et al., 2013). The wind farms for large-scale production are situated at Jaisalmer wind park, Rajasthan and Brahmanvel wind farm, Maharastra and Muppandal windfarm, Kanyakumari, Tamil Nadu. These are the major wind farms in India.
Apart from India, about 200GW power has been produced and utilized by 83 countries around the world in 2011 (Dewei et al., 2013). In Lithuania according to the report at 2016 shows that the capacity of the installed wind power plant is about 507MW (Audrius et al., 2018). Since the requirement for renewable energy resources increases, the progress on renewable resources gets increased every year (Erik, 2017). At the end of 2016, 467GW has generated and of it, 16GW was produced as offshore. Other advancements in wind are using a fuzzy logic controller for managing the capacity of a hybrid system and the system satisfied the peak power demands (Mahdi et al., 2013). High-efficiency values can be obtained by using this hybrid system. For better output windmills are placed offshore than on land. A remote monitoring system is designed based on ZigBee WSN and GPRS which resulted in less maintenance and construction cost (Yongduan et al., 2013).
Figure 5. Development of solar over the past few years (Alexandre and Dorel, 2018)
European Journal of Sustainable Development Research, 3(1), em0076
© 2019 by Author/s 7 / 19
Hydro Energy
Hydropower designated to the transformation of energy from flowing water i.e., kinetic energy, into Electricity. It contributes about 16% of electricity generation worldwide (Gláucia et al., 2018). The Hydropower plant in early ages was used in mechanical milling such as grinding grains. At present, hydro plants generate electricity using Turbines and Generators, thus mechanical energy is produced by the steady flow of water which spins the rotor on the Turbine. This turbine is in turn linked to an Electromagnetic Generator, producing electricity on rotation of the rotor in the turbine (Vineet and Singal, 2017; Jawahar and Prawin, 2017). Since it gives low output, hybrid combinations can also be made to satisfy the power needs. In Bangladesh, a hybrid system of micro-hydro and diesel is installed (Himadry et al., 2016). Hydropower plants are categorized into three main types, they are
Impoundment Facilities In this technology, dams are used to build a large reservoir of water. Electricity is produced when water flows
through the turbines in the dam.
Pumped Storage Facilities This type has a second reservoir beneath the Dam, where water is moved from the lower Reservoir to the upper
reservoir, thus energy is gathered for future needs.
Run-of-river Facilities This depends further on flow rates of natural water by diverting only a fraction of river water through the
turbines, in some cases even without the usage of a dam or reservoirs. Since this type is subjected to availability of natural water and also is affected by its variability, thus electricity production in this method is more intermittent compared to the dammed hydropower plant.
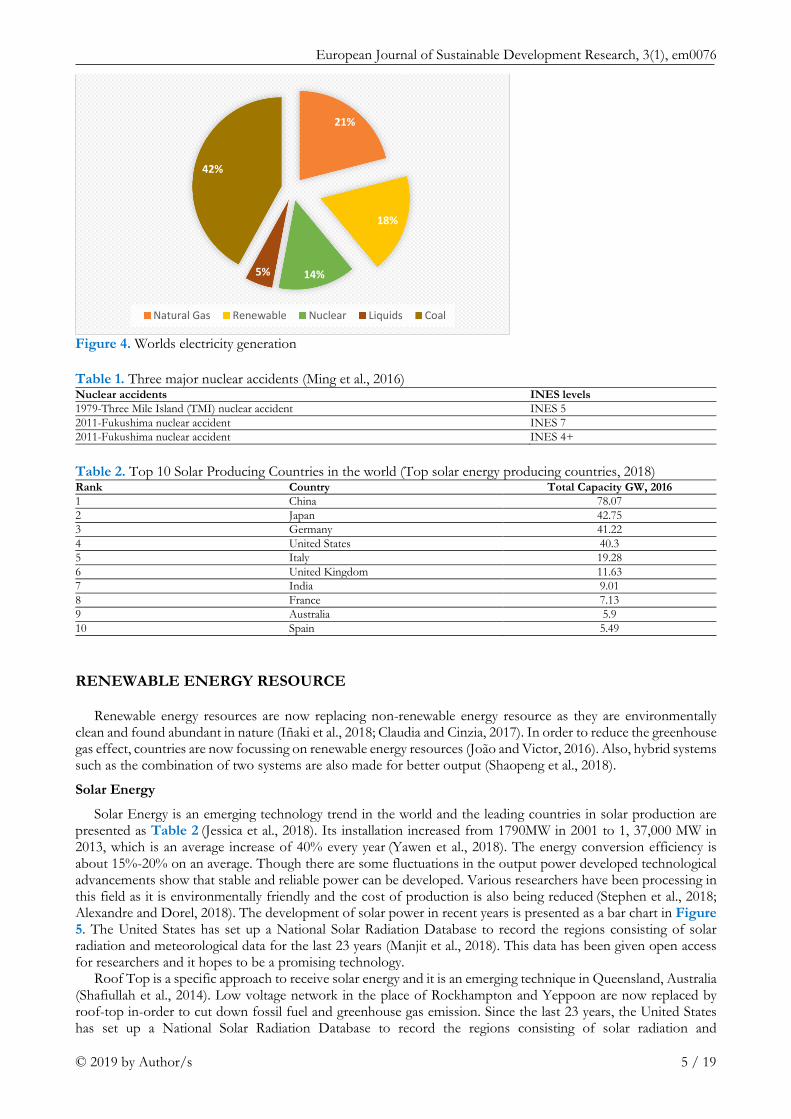
Hydropower presently is the largest renewable energy resource that has been deployed in the world. In the year 2009, hydro energy based electricity production was 3,329 TWh accounting to an interest of around 16.5 % of the world’s electricity production (Dolf, 2012). It is the greatest sources of energy to produce power which is being utilized in many countries. According to the World Energy Council 2010 Report, around 160 countries in the world use hydropower in their national electricity production. However, actual global utilization of hydropower is focused in the following ten countries (sharing about 70% of total electricity production) (Jain, 2010). The top four countries, being China, Brazil, Canada, and the USA, use hydropower to produce half of their total electricity generation, as shown in Table 3.
Though this power is utilized in copious countries, hydropower contribution is naturally less compared to the worldwide total primary energy supply. In 2009, it shared only 2.3% of the total 12,150 Mote of primary energy supply worldwide. Even with sharing nearly lesser energy compared to the other nonrenewable sources of energy production, the average global hydropower potential in future is relatively huge. In 2009, the World Commission on Dams predicted that the total worldwide confirmed technical potential for ordinary hydropower was 14,576 TWh/yr, as shown in Table 3. If hydropower potential from small-scale hydropower sites and from nonconventional sources are considered, the world’s hydropower potential is huge considering the availability of numerous small hydropower potential sites in many countries and their potential of water current from rivers and canals. From Figure 6, it can be shown that Asia has the highest contribution (over 53%) of hydropower global potential, followed by Latin America (20%) and North America (11%). Asia has the largest contribution (43%) of the worldwide equipped quantity. Africa, even though having relatively the same technical potential (installed capacity) with Europe, the rearmost i.e., Africa has a higher contribution (19%) of the total worldwide equipped quantity than the aforesaid i.e., Europe (only 3%). It is also essential to note from Table 4 that greatest contribution of the world’s determined technical generation potential is still undeveloped (76%). Africa has the highest
Table 3. World’s electricity share (Hindawi, 2018) Country Electricity production (TWh) The share of the world total electricity generation (%) China 615 18.4 Brazil 390 11.6 Canada 366 10.8 USA 297 9.1 Russia 175 5.5 Norway 129 3.7 India 106 3.1 Venezuela 93 2.8 Japan 81 2.4 Sweden 65 2.1 Rest of the world 1011 30.5 World 3,329 100

Elavarasan / The Motivation for Renewable Energy
8 / 19 © 2019 by Author/s
underdeveloped potential (92%) followed by Asia and Australasia /Oceania (80% for both regions). In India, Jammu and Kashmir have the best resources for the operation of hydropower plant (Ameesh and Thakur, 2017). Therefore, hydropower fits very well in the context of providing sustainable electricity for development in Africa where most of the rural regions are deprived of it. Challenges faced are lack of financing for renewable power generation which is stated to be one of the main reason for the undeveloped of hydropower in that regions. Table 4 represents the regional capacity factor of different regions.
The top ten hydropower producing countries as of 2010 are listed in Table 5 along with their present equipped quantity. It is viewed that some of the advanced and upcoming countries namely Norway, Canada, Sweden, and Brazil rely mostly on hydropower as their source of electricity production. The United Nations Intergovernmental Panel on Climate Change (IPCC) states that the foremost logic for these advanced countries to massively spend in hydropower energy systems is to concentrate their electricity supply base so as to establish energy security and trade. The actual capacity of renewable energy (hydropower) to be used for substantial industrial applications and for that of energy security is demonstrated through the overdependence on hydropower for generation of electricity in these nations. This results also highlight the fact that hydropower is a mature and determined technology.
Further, it is also seen that China and USA, despite being on the first and third positions in the list of countries with greatest hydropower equipped quantity, hydropower does not even supply up to 10% of their national production capacity (Hindawi, 2018). In Africa, though they have small levels of equipped quantity, utmost all the countries in the region have hydropower in their electricity generation mix. Hydropower constituted for about 70% of the total electricity produced in the sub-Saharan African region, ignoring South Africa in the year 2008. In 2010, 32% of Africa’s electricity generation needs were supplied from hydropower.
Also, advancement in this Technology is achievable, though most of the countries have previously advanced profitable spots. Although the high upfront building costs, hydropower is a copious low-cost source of power (where applicable). It is also a malleable and dependable source of electricity related to other renewable sources, as its energy may be saved and utilized for use at a later time. Dammed reservoirs also provide flood control, in addition to it being a dependable water supply, and be used for recreation purposes. However, there are many concerns with hydropower, particularly for setting up large dam facilities. In addition, dam failures can be disastrous, further disturbing Landscapes and insists on the lives of people and animals living downstream.
Table 4. The Regional capacity factor of different regions (Hindawi, 2018)
World region
Technical potential-annual
generation (TWh/yr)
Technical potential-installed
capacity (GW)
2009, Total generation (TWh/yr)
2009, installed capacity (GW)
Undeveloped potential (%)
Average regional
capacity factor (%)
North America 1,658 387 627 154 61 46 Latin America 2,855 607 731 155 73 53 Europe 1,020 337 541 178 46 34 Africa 1,173 282 97 22 91 46 Asia 7,680 2,036 1,513 402 81 42 Australasia/Oceania 184 65 36 12 81 30 World 14,575 3,721 3,550 925 75 43
Figure 6. Hydropower in different regions (Hindawi, 2018)
European Journal of Sustainable Development Research, 3(1), em0076
© 2019 by Author/s 9 / 19
In addition to it, hydropower plants are not perfectly free of greenhouse gas emissions. As with most forms of energy, carbon dioxide emissions occur at times of development, especially as a result of the usage of large quantities of cement. Also, the loss of vegetation’s in the flooded areas produces methane, another greenhouse gas as matter decays underwater.
Tidal Energy
Tidal power is a form of hydropower where electrical energy is obtained from the potential of tides. The first extensive-scale tidal power plant (the Rance Tidal Power Station) started its operation in the year 1966. Though it is not yet extensively benefitted, tidal power has a great impact on future electricity production. Tides are more certain compared to that of other sources such as wind energy and solar power. Tidal power suffers from high capital cost compared to availability of other renewable sources of energy. Various technological improvements in the case of design and turbine technology indicate that the total possibility of tidal power may be much more than the presently assumed potential and that the commercial and environmental costs could be brought down to a competitive level. Tidal power involves the cost of erecting a dam across the opening of a tidal basin. The dam has channel included in its structure that is opened to allow the flow of tide into the basin; the sluice is then closed, and when sea level drops, traditional hydropower technologies can be benefitted for generation of electricity from the high water level in the basin (Joao, 2007).
Generation of Tidal Energy
Tidal power can be classified into three generating methods based on the generating methods (Michael, 2003; Anna, 2015) they are:
1. Tidal stream generator, 2. Tidal barrage, 3. Dynamic tidal power.
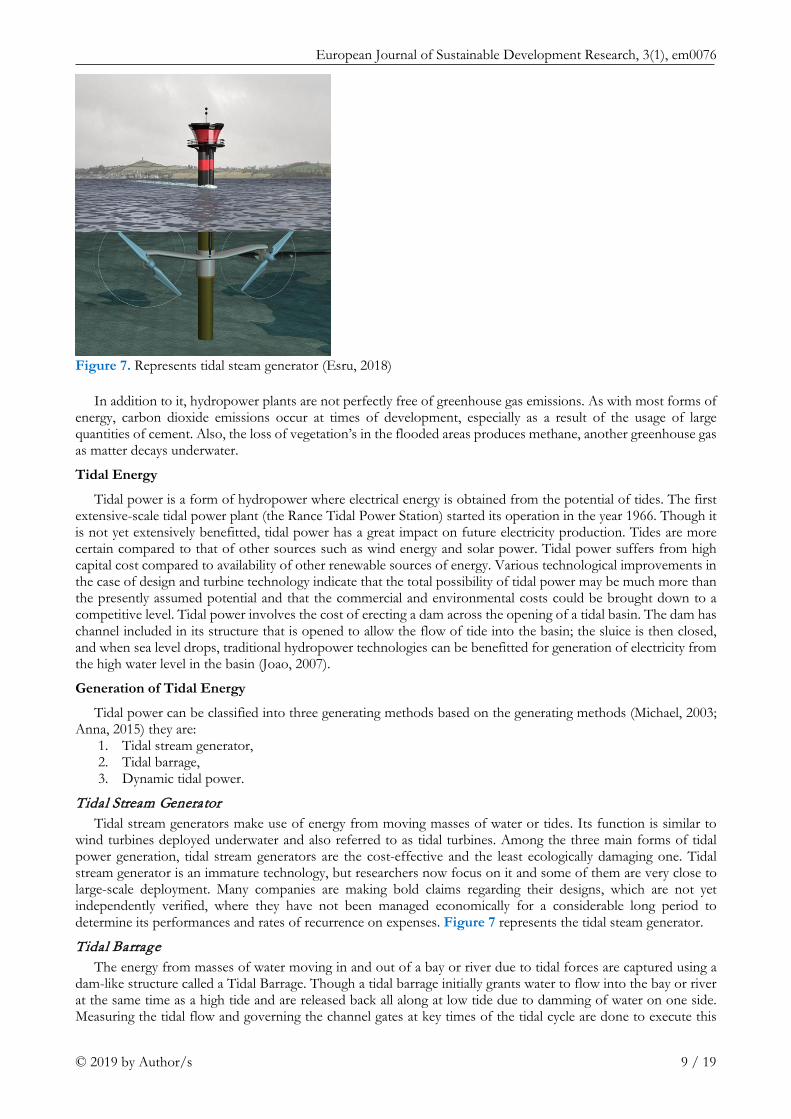
Tidal Stream Generator Tidal stream generators make use of energy from moving masses of water or tides. Its function is similar to
wind turbines deployed underwater and also referred to as tidal turbines. Among the three main forms of tidal power generation, tidal stream generators are the cost-effective and the least ecologically damaging one. Tidal stream generator is an immature technology, but researchers now focus on it and some of them are very close to large-scale deployment. Many companies are making bold claims regarding their designs, which are not yet independently verified, where they have not been managed economically for a considerable long period to determine its performances and rates of recurrence on expenses. Figure 7 represents the tidal steam generator.
Tidal Barrage The energy from masses of water moving in and out of a bay or river due to tidal forces are captured using a
dam-like structure called a Tidal Barrage. Though a tidal barrage initially grants water to flow into the bay or river at the same time as a high tide and are released back all along at low tide due to damming of water on one side. Measuring the tidal flow and governing the channel gates at key times of the tidal cycle are done to execute this
Figure 7. Represents tidal steam generator (Esru, 2018)

Elavarasan / The Motivation for Renewable Energy
10 / 19 © 2019 by Author/s
process. The energy due to water flow in and out is captured using turbines provided at the sluices. Figure 8 represents a tidal barrage.
Dynamic Tidal Power A different and unproven technique of tidal power generation is DTP (Dynamic Tidal Power). Coast-parallel
oscillating tidal waves which rush along the coasts of continental shelves interfere with this long T-dam, which contains powerful hydraulic current enough to produce a considerable amount of energy to produce electricity.
Geothermal Energy
Geothermal energy is a renewable energy which is independent of the sun. It is produced due to the heat generated under the earth surface (Morton, 1974; Yong and Wen, 2018). It also promises on reducing the greenhouse gas emission (Diego et al., 2018; Eagri, 2018).
As Indonesia’s oil production decreased, other alternative resources were considered. Indonesia lies on the “ring of fire” and has many volcanos surrounding it. It has the largest source of geothermal energy in the world and provides 40% of the world geothermal energy resources (Saeid et al., 2018; Eddy, 2013). Another geothermal energy-rich region is the Java Island consisting of more than 20 geothermal sites (Bella and Sintia, 2013). Bulgaria is a place prosperous in thermal water with the temperature in the range of 20°C-100°C (Klara et al., 2013). Another thermal site is Ciudad Constitution to Los Cabos in Baja California Sur (Cristina and Rosa, 2014). The recent developments in California by using geothermal power for reducing CO2 emission resulted in some difference in the emission levels. The CO2 emission is reduced to about 20% by using geothermal power (Sullivan and Wang, 2013). Now Egypt and Poland are also focusing on promoting geothermal energy (Anna, 2017; Elbarbar, 2018).
The waste heat from the geothermal power plant can be used as a source of electrical energy. With this system shown in Figure 9, about 75% of the original power is converted into electrical energy (Cukup et al., 2016).
To know the effect of temperature on the lifetime of the plant a test was conducted at Lahendong geothermal area. The brine temperature dropped from 180.02°C to 154.92°C on the 30th of the operated organic Rankine cycle. Also, it produced a power output of 1.3MW (Didit et al., 2016).
Biomass Energy
The fundamental source of biomass energy is the sun. Biomass is the major source of energy in many households for cooking and water heating (Wasajja and Daniel, 2017). A systematic diagram of biomass energy (Figure 10) and its applications is accompanied.
Chile is focusing on developing biomass for electricity generation as a replacement for non-renewable resources (Carlos et al., 2018). Bangladesh is the prominent producer of biomass energy and it has used this resource to solve its energy crisis problem. It is the largest producer of biomass energy as it has a large amount of cattle dung (Jitu and Adharaa, 2017).
A Cogeneration plant for generation of electricity and heat in wool drying facility is first present in Slovenia. Though the cogeneration plant consumes 245kW of power for its use, it is the first plant in the world to produce 1.5MW power (Simon and Milan, 2017). The biomass boiler is situated around Alaska and these boilers are installed domestically. The Capital cost and maintenance cost varies with the type of boiler. The boilers have a lifetime of 20-30yrs (Erin et al., 2017). The biomass conversion technique based on application is given in Figure 11.
Figure 8. Represents tidal barrage (Esru, 2018)

European Journal of Sustainable Development Research, 3(1), em0076
© 2019 by Author/s 11 / 19
Another advantage of Biomass is that it can be used as a fuel. Acetic acid can be obtained from organic waste such as cellulose and lignocellulose with a yield of 11-13% using a direct oxidation method. Also, formic acid is obtained from the hydrothermal oxidation of glucose (Fangming et al., 2010). The steps involved in the conversion of biomass to biogas is shown in Figure 12.
Another system developed using biomass energy is the Combined Cooling and Heating Power (CCHP). The CCHP is usually adopted in agriculturally rich countries. As China is an agriculturally rich country it opted to develop CCHP with biomass energy (Harbin et al., 1864). The biomass generation at different locations of the world is shown in Table 5.
Figure 9. Schematic view of the geothermal power plant (Didit et al., 2016)
Figure 10. Bio-gasifier and solid oxide fuel cell hybrid system as a combined heat and power application (Muhammad et al., 2016)

Elavarasan / The Motivation for Renewable Energy
12 / 19 © 2019 by Author/s
RESEARCH PROGRESS AND OUTCOMES IN SOLAR AND WIND RENEWABLE ENERGY SOURCES
The main focus of Spain is the renewable energy resources of which their main concern is solar. Researchers review that the large grid-connected PV system is less cost-effective as it is static. The research also reveals that the maintenance and operation cost is 0.5% of the capital investment. There has been a serious hike in the installation of the solar panel after 2005. Annual Spain’s national renewable energy plan is shown in Table 6 (Sana and Syed, 2012).
A survey was conducted on the salt possibility in Turkey and its potential use in solar ponds (Tasdemiroglu, 1987). In Turkey sunshine, land, water and salt are abundant. Salt is the utmost significant and overpriced element, it constitutes about 15-20% of the initial investment in setting up a solar pond. During operation of the system, the salt needs to be continuously replenished as it is regarded as an equivalent fuel for a solar pond.
Figure 11. Biomass conversion technique based on their applications (Jitu and Adharaa, 2017)
Figure 12. Conversion of Biomass to Biogas (Jitu and Adharaa, 2017)
European Journal of Sustainable Development Research, 3(1), em0076
© 2019 by Author/s 13 / 19
For the past decades, China is the biggest energy consumer with industry covering about 70% of its total energy utilization (Teng et al., 2018). To meet this demands and to have favorable conditions for solar, China has turned its side towards using solar energy. Statistical data shows that by 2020, 39.40 million of coal and 98.22 million of CO2 emission is planned to be reduced.
A large wind power station is situated on Shark El-Ouinat City in Egypt. Researchers show that if 60 wind turbines of ''Fuhrländer FL2500–104'' arranged in a 150 MW could be built at Shark El-Ouinat City, then an annual gain of 730,791 MWh/year could be found with a high capacity of 56% (Kuldeep and Kalpesh, 2018).
Recently, Nigeria has shifted its interest towards solar and has started to develop it to satisfy the power demands (Ahmed, 2018). At the end of 2016, it was observed that the total installed operational CSPs (Concentrated Solar Panel) has reached 4,926 MW. Also, an additional power of 2,056MW is expected after the constructions are completed in the upcoming years (Olumide and Edmund, 2018).
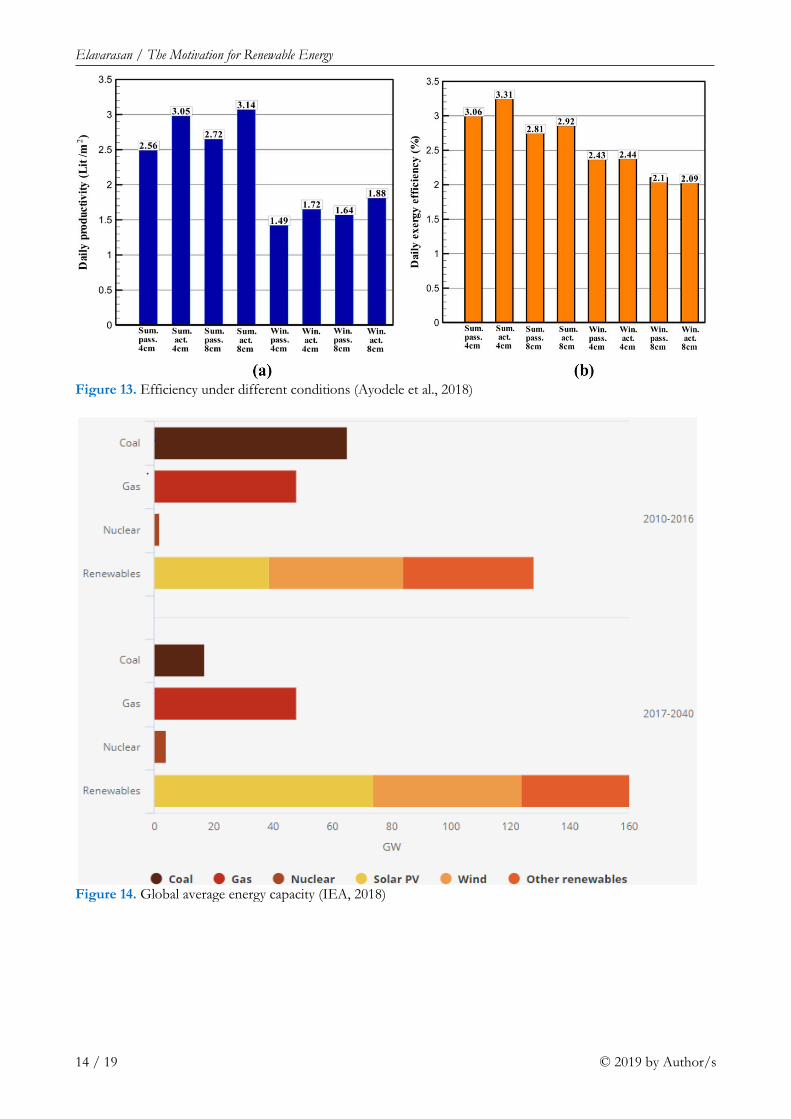
Another advancement made in the solar field is the usage of pyramid solar still instead of conventional solar still (Ayodele et al., 2018). The performance of pyramid solar is better than the conventional solar and its efficiency under different conditions is presented as Figure 13.
Another emerging technology in solar is the perovskite solar cell (Khalaji et al., 2017). This resulted in better efficiency compared to conventional silicon solar cell and the various tests conducted using different perovskite cells. The highest efficiency was obtained by using LBSO (Lanthanum (La)–doped BaSnO3) and methylammonium lead diode and the power conversion efficiency was recorded to be 21.2%. With high efficiency and low working temperature, resulting in a significant reduction in the price of the photovoltaic panel.
COMPARATIVE ANALYSIS
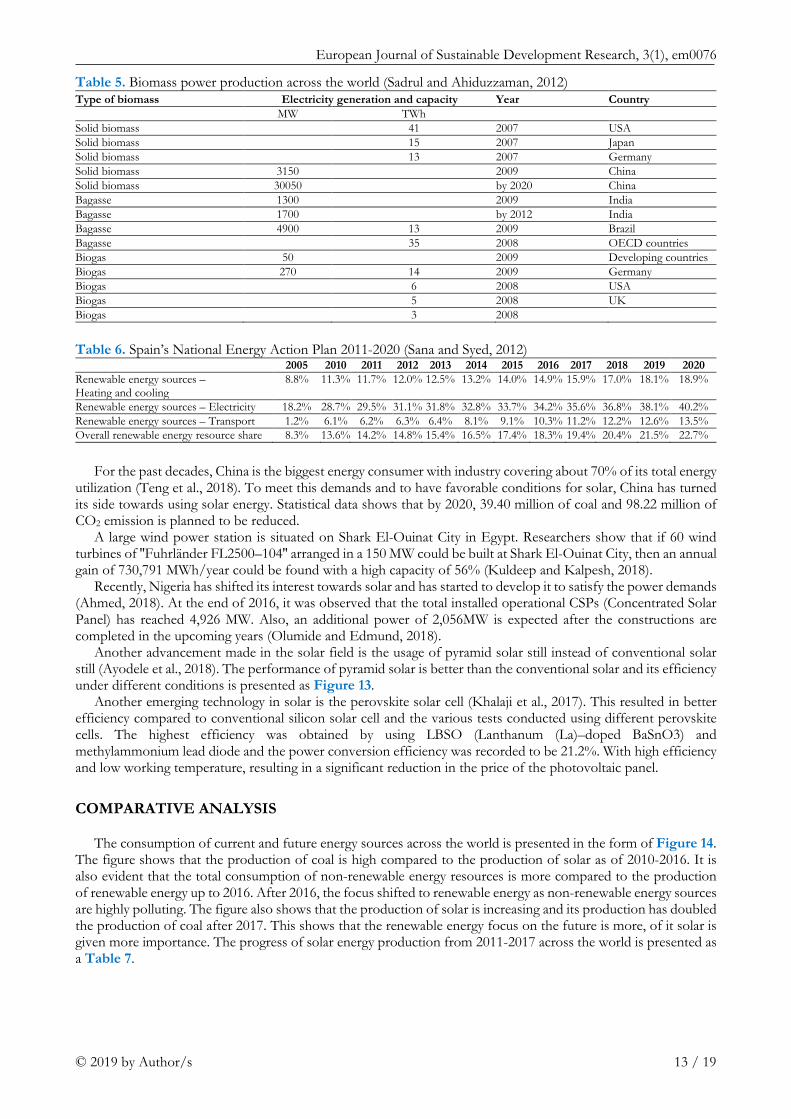
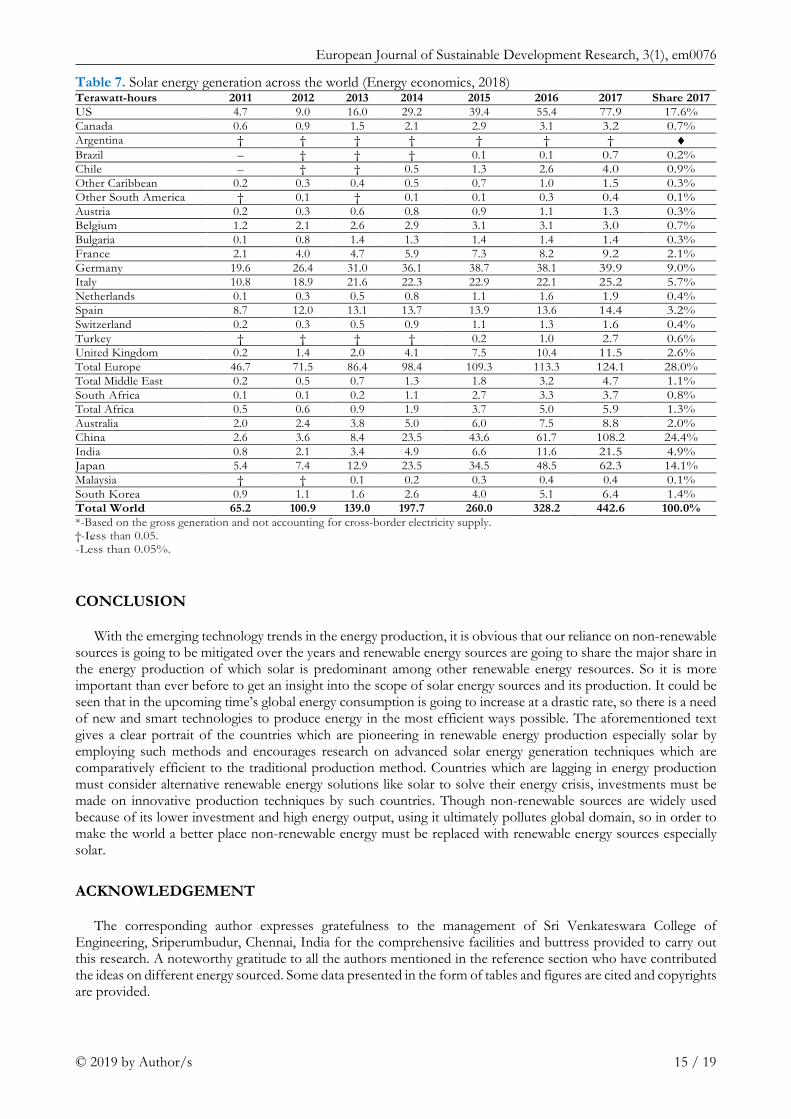
The consumption of current and future energy sources across the world is presented in the form of Figure 14. The figure shows that the production of coal is high compared to the production of solar as of 2010-2016. It is also evident that the total consumption of non-renewable energy resources is more compared to the production of renewable energy up to 2016. After 2016, the focus shifted to renewable energy as non-renewable energy sources are highly polluting. The figure also shows that the production of solar is increasing and its production has doubled the production of coal after 2017. This shows that the renewable energy focus on the future is more, of it solar is given more importance. The progress of solar energy production from 2011-2017 across the world is presented as a Table 7.
Table 5. Biomass power production across the world (Sadrul and Ahiduzzaman, 2012) Type of biomass Electricity generation and capacity Year Country MW TWh Solid biomass 41 2007 USA Solid biomass 15 2007 Japan Solid biomass 13 2007 Germany Solid biomass 3150 2009 China Solid biomass 30050 by 2020 China Bagasse 1300 2009 India Bagasse 1700 by 2012 India Bagasse 4900 13 2009 Brazil Bagasse 35 2008 OECD countries Biogas 50 2009 Developing countries Biogas 270 14 2009 Germany Biogas 6 2008 USA Biogas 5 2008 UK Biogas 3 2008
Table 6. Spain’s National Energy Action Plan 2011-2020 (Sana and Syed, 2012) 2005 2010 2011 2012 2013 2014 2015 2016 2017 2018 2019 2020 Renewable energy sources – Heating and cooling
8.8% 11.3% 11.7% 12.0% 12.5% 13.2% 14.0% 14.9% 15.9% 17.0% 18.1% 18.9%
Renewable energy sources – Electricity 18.2% 28.7% 29.5% 31.1% 31.8% 32.8% 33.7% 34.2% 35.6% 36.8% 38.1% 40.2% Renewable energy sources – Transport 1.2% 6.1% 6.2% 6.3% 6.4% 8.1% 9.1% 10.3% 11.2% 12.2% 12.6% 13.5% Overall renewable energy resource share 8.3% 13.6% 14.2% 14.8% 15.4% 16.5% 17.4% 18.3% 19.4% 20.4% 21.5% 22.7%
Elavarasan / The Motivation for Renewable Energy
14 / 19 © 2019 by Author/s
Figure 13. Efficiency under different conditions (Ayodele et al., 2018)
Figure 14. Global average energy capacity (IEA, 2018)
European Journal of Sustainable Development Research, 3(1), em0076
© 2019 by Author/s 15 / 19
CONCLUSION
With the emerging technology trends in the energy production, it is obvious that our reliance on non-renewable sources is going to be mitigated over the years and renewable energy sources are going to share the major share in the energy production of which solar is predominant among other renewable energy resources. So it is more important than ever before to get an insight into the scope of solar energy sources and its production. It could be seen that in the upcoming time’s global energy consumption is going to increase at a drastic rate, so there is a need of new and smart technologies to produce energy in the most efficient ways possible. The aforementioned text gives a clear portrait of the countries which are pioneering in renewable energy production especially solar by employing such methods and encourages research on advanced solar energy generation techniques which are comparatively efficient to the traditional production method. Countries which are lagging in energy production must consider alternative renewable energy solutions like solar to solve their energy crisis, investments must be made on innovative production techniques by such countries. Though non-renewable sources are widely used because of its lower investment and high energy output, using it ultimately pollutes global domain, so in order to make the world a better place non-renewable energy must be replaced with renewable energy sources especially solar.
ACKNOWLEDGEMENT
The corresponding author expresses gratefulness to the management of Sri Venkateswara College of Engineering, Sriperumbudur, Chennai, India for the comprehensive facilities and buttress provided to carry out this research. A noteworthy gratitude to all the authors mentioned in the reference section who have contributed the ideas on different energy sourced. Some data presented in the form of tables and figures are cited and copyrights are provided.
Table 7. Solar energy generation across the world (Energy economics, 2018) Terawatt-hours 2011 2012 2013 2014 2015 2016 2017 Share 2017 US 4.7 9.0 16.0 29.2 39.4 55.4 77.9 17.6% Canada 0.6 0.9 1.5 2.1 2.9 3.1 3.2 0.7% Argentina † † † † † † † ◆ Brazil – † † † 0.1 0.1 0.7 0.2% Chile – † † 0.5 1.3 2.6 4.0 0.9% Other Caribbean 0.2 0.3 0.4 0.5 0.7 1.0 1.5 0.3% Other South America † 0.1 † 0.1 0.1 0.3 0.4 0.1% Austria 0.2 0.3 0.6 0.8 0.9 1.1 1.3 0.3% Belgium 1.2 2.1 2.6 2.9 3.1 3.1 3.0 0.7% Bulgaria 0.1 0.8 1.4 1.3 1.4 1.4 1.4 0.3% France 2.1 4.0 4.7 5.9 7.3 8.2 9.2 2.1% Germany 19.6 26.4 31.0 36.1 38.7 38.1 39.9 9.0% Italy 10.8 18.9 21.6 22.3 22.9 22.1 25.2 5.7% Netherlands 0.1 0.3 0.5 0.8 1.1 1.6 1.9 0.4% Spain 8.7 12.0 13.1 13.7 13.9 13.6 14.4 3.2% Switzerland 0.2 0.3 0.5 0.9 1.1 1.3 1.6 0.4% Turkey † † † † 0.2 1.0 2.7 0.6% United Kingdom 0.2 1.4 2.0 4.1 7.5 10.4 11.5 2.6% Total Europe 46.7 71.5 86.4 98.4 109.3 113.3 124.1 28.0% Total Middle East 0.2 0.5 0.7 1.3 1.8 3.2 4.7 1.1% South Africa 0.1 0.1 0.2 1.1 2.7 3.3 3.7 0.8% Total Africa 0.5 0.6 0.9 1.9 3.7 5.0 5.9 1.3% Australia 2.0 2.4 3.8 5.0 6.0 7.5 8.8 2.0% China 2.6 3.6 8.4 23.5 43.6 61.7 108.2 24.4% India 0.8 2.1 3.4 4.9 6.6 11.6 21.5 4.9% Japan 5.4 7.4 12.9 23.5 34.5 48.5 62.3 14.1% Malaysia † † 0.1 0.2 0.3 0.4 0.4 0.1% South Korea 0.9 1.1 1.6 2.6 4.0 5.1 6.4 1.4% Total World 65.2 100.9 139.0 197.7 260.0 328.2 442.6 100.0% *-Based on the gross generation and not accounting for cross-border electricity supply. †-Less than 0.05. -Less than 0.05%.
Elavarasan / The Motivation for Renewable Energy
16 / 19 © 2019 by Author/s
REFERENCES
Ahmed, A. (2018). Wind energy characteristics and wind park installation in Shark El-Quimet, Egypt. Renewable and Sustainable Energy Reviews, 82, 734–742. https://doi.org/10.1016/j.rser.2017.09.031
Alexandre, G. and Dorel, S. (2018). Outcomes from the first large-scale solar PV auction in Brazil. Renewable and Sustainable Energy Reviews, 91, 219–228. https://doi.org/10.1016/j.rser.2018.04.003
Ameesh, S. and Thakur, N. (2017). Hydropower projects in Jammu and Kashmir: India. Renewable and Sustainable Energy Reviews, 78, 233–251.
Anna, S. (2017). Geothermal energy resources in Poland – Overview of the current state of Knowledge. Renewable and Sustainable Energy Reviews, 1-8.
Anna, Y. (2015). Romain Guion. Measuring Turbulent Structures in Tidal Channels. 4th Oxford Tidal Energy Workshop, 1-62.
Audrius, J., Saulius, G., Alfonsas, M., Mindaugas, A., Inga, K., Audrius, B. and Vidmantas, T. (2018). Challenges of integrating wind power plants into the electric power system: Lithuanian case. Renewable and Sustainable Energy Reviews, 94, 468–475. https://doi.org/10.1016/j.rser.2018.06.032
Ayodele, T., Ogunjuyigbe, A. and Amusan, T. (2018). Wind energy for water pumping in some selected communities of Oyo State, Nigeria. Renewable and Sustainable Energy Reviews, 91, 335–343. https://doi.org/10.1016/j.rser.2018.03.026
Bella, R. and Sintia, N. (2013). Geothermal Exploration Using Geochemical Data; Study Case: Parang Wedang Geothermal Field, Indonesia. AIP Conf. Proc, 1755, 1-4.
Benjamin, B. (2017). Experience with auctions for wind power in Brazil. Renewable and Sustainable Energy Reviews, 1-15.
Bikash, K. (2017). Wind energy developments and policies in China: A short review. Renewable and Sustainable Energy Reviews, 1-12.
Binzhong, Z. and Graham, B. (2016). Improving coal quality estimation through multiple geophysical log analysis. International J. of Coal Geology, 1-23.
Carlos, R., Gloria, M. and Gabriel, N. (2018). Non-conventional renewable energy sources – A focus on biomass. Renewable and Sustainable Energy Reviews, 81, 937–945. https://doi.org/10.1016/j.rser.2017.08.059
Changzheng, C., Xianming, S., Quan, G., Bo, Z. and Yanling, G. (2013). Wavelet-based multifractal analysis of large-scale wind turbine main bearing. J. of renewable and sustainable energy, 5, 1-7.
Charikleia, K., Vangelis, M. and John P. (2013). Characteristics and prospects: Renewable energy and nuclear power towards sustainable development. Renewable and Sustainable Energy Reviews, 22, 187–197. https://doi.org/10.1016/j.rser.2013.01.035
Chuan, S., Xiting, Z. and Xiaochun, M. (2016). Post-Fukushima public acceptance on resuming the nuclear power program in China. Renewable and Sustainable Energy Reviews, 62, 685–694. https://doi.org/10.1016/j.rser.2016.05.041
Claudia, F. and Cinzia, M. (2017). Forecasting the impact of renewable energies in competition with non-renewable sources. Renewable and Sustainable Energy Reviews, 1-8.
Coal production. (2018). Available at: https://en.wikipedia.org/wiki/List_of_countries_by_coal production Cristina, B and Rosa, L. (2014). Geothermal Exploration Using Remote Sensing in the South of Baja California
Sur, Mexico, 180-188. Cukup, M., Reza, A., Aswad, H., Ridwan, H. and Fajar, M. (2016). The thermodynamic cycle models for geothermal
power plants by considering the working fluid characteristic. AIP Conference Proceedings, 1712, 1-7. Dalia, S. and Asta, M. (2010). Analysis of possible geological storage of CO2 and nuclear waste in Lithuania.
Renewable and Sustainable Energy Reviews, 14, 1600–1607. https://doi.org/10.1016/j.rser.2010.02.010 Dalia, S. (2012). Comparison of carbon dioxide and nuclear waste storage costs in Lithuania. Renewable and
Sustainable Energy Reviews, 16, 2434–2445. https://doi.org/10.1016/j.rser.2012.02.066 Dewei, L., Jianbo, G., Yuehui, H. and Weisheng, W. (2013). An active power control strategy for wind farm based
on predictions of wind turbine's maximum generation capacity. J. of Renewable and Sustainable Energy, 5, 1-10. Didit, P., Sihana and Kutut, S. (2016). Performance of organic Rankine cycle system on the geothermal power
plant. AIP Conference Proceedings, 1755, 1-7. Diego, M. and Clay, P., K. (2018). Geothermal energy: Power plant technology and direct heat applications.
Renewable and Sustainable Energy Reviews, 94, 889–901. https://doi.org/10.1016/j.rser.2018.06.047 Dolf, G. (2012). Renewable Energy Technologies: Cost Analysis Series. International Renewable Energy Agency
(IRENA), 1-44. Douri, Y. and Fayadh M. (2016). Solar energy status in Iraq: Abundant or not—Steps forward. J. of renewable and
sustainable energy, 8, 1-5. Eagri. (2018). Available at: http://eagri.org/eagri50/AENG352/lec02.pdf

European Journal of Sustainable Development Research, 3(1), em0076
© 2019 by Author/s 17 / 19
Eddy, Z. (2013). Remote Sensing Application on Geothermal Exploration. AIP Conf. Proc, 1554, 261-264. Elbarbar, S., Abdel, M., Mesbah, H., Shahadat, A. and Embaby, A. (2018). Curie point depth, heat flow and
geothermal gradient maps of Egypt deduced from aeromagnetic data. Renewable and Sustainable Energy Reviews, 91, 620–629. https://doi.org/10.1016/j.rser.2018.04.071
Elisa, S., Luca, M., Daniela, F., Jean, S. and Diletta, S. (2011). Hafnium and tantalum carbides for high-temperature solar receivers. J. of renewable and sustainable energy, 3, 1-6.
Energy economics. (2018). Available at: https://www.bp.com/en/global/corporate/energy-economics/statistical-review-of-world-energy/primary-energy/energy-and-the-environment.html
Energy classification. (2018). Available at: http://bio4esobil2010.wordpress.com/2011/05/31/energy-classification/
Erik, L. (2017). In search of the wind energy potential. J. of Renewable and Sustainable Energy, 9, 1-11. Erin, W., Amanda, B. and Daisy, H. (2017). An Alaska case study: Biomass technology. J. of Renewable and Sustainable
Energy, 9, 1-10. Esru. (2018). Available at: http://www.esru.strath.ac.uk/EandE/Web_sites Fangming, J., Jianglin, C., Bing, W. and Heiji, E. (2010). Rapid Conversion of Biomass and Carbon Dioxide into
Fuel and Chemicals by Hydrothermal Reactions. AIP Conf. Proc, 1251, 1-4. Farah, M. and Eltamaly, M. (2013). Fuzzy logic control of the wind energy conversion system. J. of Renewable and
Sustainable Energy, 5, 1-13. https://doi.org/10.1063/1.4798739 Gláucia, F., Leonardo, G. and Luiz, B. (2018). A risk-hedging tool for hydropower plants. Renewable and Sustainable
Energy Reviews, 90, 370–378. https://doi.org/10.1016/j.rser.2018.03.081 Harbin, G., Rongfeng, S., Weijie, Z., Xiaoxu, F., Jianguo, J. and Baofeng, Z. (1864). Study on the Application of
Combined Cooling, Heating and Power System with Biomass Energy in China. AIP Conf. Proc, 1-9. Himadry, S., Yatim, A., Chee, T. and Kwan, Y. (2016). PV/tidal powered micro-hydro and diesel hybrid system:
A southern Bangladesh focus. Renewable and Sustainable Energy Reviews, 53, 1137–1148. https://doi.org/10.1016/j.rser.2015.09.038
Hindawi. (2018). Available at: https://www.hindawi.com/journals/isrn/2012/730631 IEA. (2018). Available at: https://www.iea.org/weo2017/ Iñaki, H., Lucía, S., Erlantz, A. and Jon, M. (2018). The emergence of renewable energy cooperatives in Spain: A
review. Renewable and Sustainable Energy Reviews, 94, 1036–1043. https://doi.org/10.1016/j.rser.2018.06.049 Jain, C. (2010). Energy Resources: Hydropower, World Energy Council. World Energy Council, 1-618. Jawahar, C. and Prawin, M. (2017). A review on turbines for a micro hydropower plant. Renewable and Sustainable
Energy Reviews, 72, 882–887. https://doi.org/10.1016/j.rser.2017.01.133 Jensen, B., Nenad, M. and Abrahamsen, B. (2013). Development of superconducting wind turbine generators. J.
of renewable and sustainable energy, 5, 1-12. Jeongwoo, H. and Vincent, B. (2015). A comparative assessment of resource efficiency in petroleum refining. Fuel,
157, 292–298. https://doi.org/10.1016/j.fuel.2015.03.038 Jessica, S., Tonio, S., Christopher, M., Mario, F., Cyril, S., John, L. and Alexander, M. (2018). Overview of solar
technologies for electricity, heating and cooling Production. Renewable and Sustainable Energy Reviews, 90, 892–909. https://doi.org/10.1016/j.rser.2018.03.112
Jitu, P. and Adharaa, D. (2017). Barriers of biomass energy and their potential solutions for remote areas of Bangladesh. IEEE, 1-4.
Joao, C. (2007). Ocean Wave Energy: Current Status and Future Perspectives. Springer, 1-439. João, P. and Victor, M. (2016). CO2 emissions, non-renewable and renewable electricity production, economic
growth, and international trade in Italy. Renewable and Sustainable Energy Reviews, 55, 142–155. https://doi.org/10.1016/j.rser.2015.10.151
Khalaji, M., Bakhoda, S., Saidur, R. and Hanaei, H. (2017). Perovskite solar cells. Renewable and Sustainable Energy Reviews, 1-11.
Klara, B., Aleksey, B., Adriana, A. and Tsanko, T. (2013). Aspects of current geothermal application in Bulgaria. J. of renewable and sustainable energy, 5, 1-8.
Kuldeep, H. and Kalpesh, V. (2018). Pyramid solar still: A comprehensive review. Renewable and Sustainable Energy Reviews, 81, 136–148. https://doi.org/10.1016/j.rser.2017.07.004
Lingyue, L., Xiaoqing, R., Yanli, Y., Peidong, Z. and Xiao, C. (2018). Analysis and recommendations for onshore wind power policies in China. Renewable and Sustainable Energy Reviews, 82, 156–167. https://doi.org/10.1016/j.rser.2017.06.114
Mahdi, T., Mohammad, M. and Mokhtar, S. (2013). Employing parallel operated fuel cell/ultra-capacitor systems. J. of Renewable and Sustainable Energy, 5, 1-22.
Mahdis, Y., Alireza, A., Babak, F., Marja, N. and Mohammad, M. (2016). Photovoltaic technology development based on a technology lifecycle approach. J. of renewable and sustainable energy, 8, 1-11.

Elavarasan / The Motivation for Renewable Energy
18 / 19 © 2019 by Author/s
Manjit, S., Yu, X., Anthony, L., Aron, H., Galen, M. and James, S. (2018). The National Solar Radiation Data Base (NSRDB). Renewable and Sustainable Energy Reviews, 89, 51–60. https://doi.org/10.1016/j.rser.2018.03.003
Mariangela, G. and Renato, G. (2016). The German energy transition: Modeling competition and substitution between nuclear power and Renewable Energy Technologies. Renewable and Sustainable Energy Reviews, 60, 1498–1504. https://doi.org/10.1016/j.rser.2016.03.022
Michael, E. (2003). Ocean Wave Energy Conversion. Elsevier ocean engineering book series, 1-205. Ming, Z., Shicheng, W., Jinhui, D., Jinghui, S. P. and Zhong, Y. Z. (2016). Review of nuclear power development
in China: Environment analysis, historical stages, development status, problems, and countermeasures. Renewable and Sustainable Energy Reviews, 59, 1369–1383. https://doi.org/10.1016/j.rser.2016.01.045
Ming, Z., Dan, D., Wuyang, Z. and Lisheng, F. (2018). Nonrenewable energy efficiency optimization in energy harvesting relay assisted systems. Physical Communication, 1-25.
Morton, C. (1974). Geothermal Power. AIP Conference Proceedings, 19, 401-411. Muhammad, S., Rizwan, R., Irtaza, H., Rehan, S., Nusrat, S., Javed, I. and Shaukat, F. (2016). The energy crisis in
Pakistan: A possible solution via biomass-based waste. J. Renewable Sustainable Energy, 8, 1-19. Olumide, O. and Edmund, C. (2018). Concentrating solar power technologies for solar thermal grid electricity in
Nigeria: A review. Renewable and Sustainable Energy Reviews, 90, 104–119. https://doi.org/10.1016/j.rser.2018.03.029
Parinya, P. and Somchai, W. (2013). Nuclear power plant scenario in Thailand. Renewable and Sustainable Energy Reviews, 24, 586–592. https://doi.org/10.1016/j.rser.2013.03.038
Qaderi, F. and Azizi, M. (2018). Petroleum wastewater treatment by using serial moving bed biofilm reactors. J. of Cleaner Production, 1-27. https://doi.org/10.1016/j.jclepro.2018.04.257
Qiang, W., Xi, C. and Xu, Y. (2013). An accident like the Fukushima effective nuclear regulation: Literature review and proposed guidelines. Renewable and Sustainable Energy Reviews, 17, 126–146. https://doi.org/10.1016/j.rser.2012.09.012
Qiang, W., Rongrong, L. and Gang, H. (2018). Research status of nuclear power: A review. Renewable and Sustainable Energy Reviews, 90, 90–96. https://doi.org/10.1016/j.rser.2018.03.044
Quing, W. and Guihuan, Y. (2017). Improved coal combustion optimization model based on load balance and coal quantities. Energy, 204-212.
Renewable energy in India. (2018). Available at: http://www.columbia.edu/~mhs119/EnergyConsump/WorldPrimaryEnergy2017_pies.png
Sadrul, A. and Ahiduzzaman, M. (2012). Biomass Energy: Sustainable Solution for Greenhouse Gas Emission. AIP Conf. Proc, 1440, 23-32. https://doi.org/10.1063/1.4704200
Saeid, M., Hikari, F. and Nugroho, P. (2018). Classification of geothermal resources in Indonesia by applying exergy Concept. Renewable and Sustainable Energy Reviews, 93, 499–506. https://doi.org/10.1016/j.rser.2018.05.018
Samuel, A., Eden, K. and Alfred, A. (2018). Renewable energy regime type and economic growth. Renewable Energy, 125, 755-767. https://doi.org/10.1016/j.renene.2018.02.135
Sana, S. and Syed, S. (2012). Review of Spanish renewable energy policy to encourage investment in solar photovoltaic, Journal of renewable and sustainable energy, 4, 1-13.
Saurabh, P., David, T. and Devinder, M. (2011). Biogas potential on Long Island, New York: A quantification study. J. of Renewable and Sustainable Energy, 3, 1-13.
Shafiullah, G., Amanullah, M., Alex, S. and Shawkat, A. (2014). Integration of roof-top solar photovoltaic systems into the low voltage distribution network. J. of Renewable and Sustainable Energy, 6, 1-21. https://doi.org/10.1063/1.4884904
Shaopeng, G., Qibin, L., Jie, S. and Hongguang, J. (2018). A review of the utilization of hybrid renewable energy. Renewable and Sustainable Energy Reviews, 91, 1121–1147. https://doi.org/10.1016/j.rser.2018.04.105
Simon, M. and Milan, M. (2017). Electricity and heat production by biomass cogeneration. AIP Conference Proceedings, 1866, 1-7.
Stephen, C., Stefan, R. and Anshuman, S. (2018). The road ahead for solar PV power. Renewable and Sustainable Energy Reviews, 92, 744–756. https://doi.org/10.1016/j.rser.2018.04.098
Sullivan, J. and Wang, M. (2013). Life cycle greenhouse gas emissions. J. of renewable and sustainable energy, 5, 1-13. Tasdemiroglu, E. (1987). Salt Availability in Turkey and its Potential Use in Solar Ponds. Resources and Conservation,
215-228. https://doi.org/10.1016/0166-3097(87)90004-6 Teng, J., Junpeng, H., Rui, L., Peng, H. and Yanjun, D. (2018). Status and prospect of solar heat for industrial
processes in China. Renewable and Sustainable Energy Reviews, 90, 475–489. https://doi.org/10.1016/j.rser.2018.03.077
Today energy. (2018). Available at: https://www.eia.gov/todayinenergy/images/2016.05.12 /main .png

European Journal of Sustainable Development Research, 3(1), em0076
© 2019 by Author/s 19 / 19
Top solar energy producing countries. (2018). Available at: https://www.bizvibe.com/blog/top-solar-energy producing countries/
Vineet, S. and Singal, S. (2017). Operation of hydropower plants-a review. Renewable and Sustainable Energy Reviews, 69, 610–619. https://doi.org/10.1016/j.rser.2016.11.169
Viresh, D. (2012). Thin solar cell technologies - Current status. Indian Vacuum Society Symposium on Thin Films: Science and Technology AIP Co, 33-37.
Wasajja, H. and Daniel, S. (2017). Evaluation of Advanced Biomass Technologies for Rural Energy Supply. IEEE, 1272-1276.
World population clock. (2018). Available at: http://www.worldometers.info/world-population Xiaopeng, G. and Xiaodan, G. (2016). Nuclear power development in China after the restart of new nuclear
construction and approval: A system dynamics analysis. Renewable and Sustainable Energy Reviews, 57, 999–1007. https://doi.org/10.1016/j.rser.2015.12.190
Yawen, L., Zhigang, L. and Fang, Y. (2018). The Investigation of Solar PV Modules. IEEE, 1-5. Yong, L., Wen, C. (2018). Insights into the geothermal utilization of abandoned oil and gas wells. Renewable and
Sustainable Energy Reviews, 87, 44–60. https://doi.org/10.1016/j.rser.2018.02.004 Yongduan, S., Bikun, W., Bin, L., Yu, Z. and Lei, W. (2013). Remotely monitoring offshore wind turbines via
ZigBee networks embedded with an advanced routing strategy. J. Renewable Sustainable Energy, 5, 1-14. Yue, G. and Jing, L. (2009). Recent advances in direct solar thermal power generation. J. of Renewable and Sustainable
Energy, 1, 1-23. Zhang, P., Wang, L., Chen, S. and Xu, J. (2017). The progress of nuclear hydrogen production through the iodine-
sulfur process in China. Renewable and Sustainable Energy Reviews, 1-11.