
RECCS plus: Comparison of Renewable Energy Technologies with Carbon ... · Comparison of Renewable...
303
RECCS plus Funding reference number: 0329967A Comparison of Renewable Energy Technologies with Carbon Dioxide Capture and Storage (CCS) Update and Expansion of the RECCS Study 0329967/07000285 Final Report to the German Federal Ministry for the Environment, Nature Conservation and Nuclear Safety (BMU) (Project initiator: Project Management Jülich, PTJ) Wuppertal Institute Dipl.-Umweltwiss. Andrea Esken Dipl.-Umweltwiss. Samuel Höller Dr. Hans-Jochen Luhmann Dipl. Soz.-Wiss. Katja Pietzner Dr. Daniel Vallentin Dr. Peter Viebahn (Project Leader) With subcontracts to Dr. Lars Dietrich LL.M. (Sozietät Wolter Hoppenberg, Hamm) Dr. Joachim Nitsch (Stuttgart) Translation Teresa Gehrs (Europäischer Sprachendienst, Osnabrück) Wuppertal, 9 August 2010 Final Report
Transcript of RECCS plus: Comparison of Renewable Energy Technologies with Carbon ... · Comparison of Renewable...

RECCS plus
Funding reference number: 0329967A
Comparison of Renewable Energy Technologies with Carbon Dioxide Capture and Storage (CCS)
Update and Expansion of the RECCS Study
0329967/07000285
Final Report
to the German Federal Ministry for the Environment, Nature Conservation and Nuclear Safety (BMU) (Project initiator: Project Management Jülich, PTJ)
Wuppertal Institute
Dipl.-Umweltwiss. Andrea Esken
Dipl.-Umweltwiss. Samuel Höller
Dr. Hans-Jochen Luhmann
Dipl. Soz.-Wiss. Katja Pietzner
Dr. Daniel Vallentin
Dr. Peter Viebahn (Project Leader)
With subcontracts to
Dr. Lars Dietrich LL.M. (Sozietät Wolter Hoppenberg, Hamm)
Dr. Joachim Nitsch (Stuttgart)
Translation
Teresa Gehrs (Europäischer Sprachendienst, Osnabrück)
Wuppertal, 9 August 2010
Wuppertal, xx. xxxx 2009
Fin
al R
ep
ort

RECCS plus – Update and Expansion of the RECCS Study
2 Final Report
The project on which this report is based was funded by the Federal Ministry for the Envi-
ronment, Nature Conservation and Nuclear Safety (project reference number 0329967A).
The sole responsibility for the content of this report lies with the authors.
Contact
Dr. Peter Viebahn Research Group “Future Energy and Mobility Structures” Wuppertal Institute for Climate, Environment and Energy Döppersberg 19 42103 Wuppertal Germany Tel.: +49 (0)202 2492-306 Fax: +49 (0)202 2492-198 E-mail: [email protected] Web: www.wupperinst.org/CCS/
List of abbreviations and symbols
Wuppertal Institute for Climate, Environment and Energy 3
Table of Contents
List of abbreviations and symbols 8!
List of tables 11!
List of figures 13!
Conclusive hypotheses 17!
Summary 23!
1! ! Introduction 43!
1.1! ! The need for an update of the first RECCS study 43!
1.2! ! Content of the present study 43!
2! ! Global development of CCS between 2007 and 2009 45!
2.1! ! Political trends and research and development initiatives 45!
2.1.1! ! Germany 45!
2.1.2! ! European Union 49!
2.1.2.1! The importance of CCS in EU policy 49!
2.1.2.2! Pilot and demonstration plants planned throughout Europe 51!
2.1.3! ! A glance at developments outside the EU 57!
2.1.3.1! China 57!
2.1.3.2! USA 60!
2.1.4! ! International negotiations on considering CCS under the Clean Development
Mechanism (CDM) 63!
2.2! ! Measures to reduce CO2 in other branches of industry 65!
2.3! ! Global networks 67!
3! ! Processes of CO2 separation in electricity generation 69!
3.1! ! New development trends and research and development activities in CO2
separation processes 69!
3.1.1! ! Post-combustion processes 69!
3.1.2! ! Pre-combustion processes 78!
3.1.3! ! Oxyfuel processes 80
!

RECCS plus – Update and Expansion of the RECCS Study
4 Final Report
3.2! ! Retrofitting power plants 83!
3.2.1! ! The term “capture ready” 83!
3.2.2! ! Measures for and effects of refits for CO2 capture 85!
4! ! Analysis of the options for the use of CO2 87!
4.1! ! Reuse of CO2 87!
4.2! ! Biological processes of CO2 capture and use 90!
4.3! ! Other processes and approaches 91!
5! ! Driving forces and attitudes of relevant stakeholders 93!
5.1! ! Non-governmental organisations 93!
5.2! ! Churches 97!
5.3! ! Politics 98!
5.3.1! ! Political parties 98!
5.3.2! ! The German government 101!
5.3.3! ! Bundesrat and German federal states 102!
5.3.4! ! Local authorities 104!
5.4! ! Advisory bodies and institutions 106!
5.5! ! Science 109!
5.6! ! Summary assessment of the attitudes of relevant stakeholders 111!
6! ! Legal aspects of introducing CCS to power plant technology 113!
6.1! ! Legal framework for CCS technology at the level of European law 114!
6.1.1! ! Developments 114!
6.1.2! ! Regulatory framework of the CCS Directive (2009/31/EC) 115!
6.1.2.1! Subject matter, scope and definitions 116!
6.1.2.2! Exploration permits: requirements and conditions for granting permits 116!
6.1.2.3! Storage permits: requirements and conditions for granting permits 117!
6.1.2.4! Operation, closure and post-closure requirements 119!
6.1.2.5! Third-party access to the infrastructure facilities 122!
6.1.2.6! Amendments of existing legal acts, general and final provisions 123!
6.1.2.7! Inclusion in emissions trading and investment incentives 126!
6.1.3! ! Summary and assessment 128!
6.2! ! Regulations on CCS concerning the storage of CO2 in oceans and seas in
international law 129
!

List of abbreviations and symbols
Wuppertal Institute for Climate, Environment and Energy 5
6.3! ! Legal developments outside the EU using the example of the U.S. State of
Wyoming and the Australian State of Victoria 130!
6.3.1! ! United States of America: The example of Wyoming 130!
6.3.2! ! Australia: The example of Victoria 132!
6.4! ! Developments in other EU Member States using the example of the
Netherlands and Poland 134!
6.4.1! ! The Netherlands 134
6.4.2 ! Poland 136!
6.5! ! Legal framework for CCS technology at the level of national law 140!
7! ! Analysis of the options for storing CO2 141!
7.1! ! Objectives 141!
7.2! ! Geological basics 141!
7.2.1! ! Formations for CO2 storage 141!
7.2.2! ! Characteristics of suitable reservoir rocks 142!
7.2.3! ! Open and closed formations 145!
7.3! ! Storage mechanisms 147!
7.4! ! Methods for estimating capacity 148!
7.4.1! ! Deep saline aquifers 148!
7.4.2! ! Depleted oil and natural gas storage sites 151!
7.5! ! CO2 storage capacity for Germany 152!
7.5.1! ! The geological situation in Germany 152!
7.5.2! ! Estimate of the CO2 storage capacity in saline aquifers beneath German
mainland 153!
7.5.3! ! Estimate of CO2 storage capacity in saline aquifers of the German North Sea 156!
7.5.4! ! Evaluation of CO2 storage capacity in depleted oil and natural gas fields 157!
7.5.5! ! Estimate of the total CO2 storage capacity for Germany 158!
7.5.6! ! Comparison of the calculated storage potential with the quantity of CO2 emitted
in Germany 160!
7.5.7! ! Conclusions from the analysis for Germany 161!
7.6! ! CO2 storage capacity in Europe 163!
7.6.1! ! Overview of existing CO2 storage estimates for Europe 163!
7.6.2! ! Important neighbouring countries for Germany regarding CO2 storage 167!
7.6.3! ! The British and Norwegian North Sea 171!
7.6.4! ! The rest of Europe 181!
7.6.5! ! Conclusions from the analysis for Europe 183!

RECCS plus – Update and Expansion of the RECCS Study
6 Final Report
7.7! ! Atlases and cadastres on CO2 storage capacity 184!
7.8! ! The potential role of enhanced oil recovery (EOR) for CCS 185!
7.8.1! ! The different stages of oil production 185!
7.8.2! ! Potential for EOR in Norway and the UK 186!
7.8.3! ! “Window of opportunity” for CCS 187!
7.8.4! ! Analogy of EOR for gas production 188!
7.8.5! ! Advantages and disadvantages of EOR 188!
7.8.6! ! Conclusions from the analysis of EOR 189!
8! ! An environmental assessment of CCS compared with renewable
energies 191!
8.1! ! Review of the results of the RECCS study 191!
8.2! ! Life cycle assessments along the whole CCS chain 191!
8.2.1! ! Complete overview 191!
8.2.2! ! Overview of the individual studies 193!
8.2.3! ! Comparison of findings 201!
8.3! ! Comparison of electricity from CCS and from renewable energies 203!
8.4! ! Direct environmental impact outside LCA 206!
8.5! ! Indirect environmental impact of coal mining and social aspects 208!
8.6! ! Possible impact of CO2 storage on subterranean ecosystems 209!
8.7! ! Conclusions from the environmental assessment 209!
9! ! Economic comparison of CCS power plants with renewable energy
technologies 213!
9.1! ! Update on electricity generating costs from CCS power plants and
renewable energies 213!
9.1.1! ! Future price trajectories for fossil fuels and CO2 emission permits 213!
9.1.2! ! Cost assumptions and other parameters of CCS power plants and their
reference power plants 218!
9.1.3! ! Calculation of electricity generating costs for CCS power plants 221!
9.1.4! ! Electricity generating costs of renewable energies 226!
9.1.5! ! Cost comparison of CCS power plants and renewable energies 228!
9.2! ! An aside: Reflections on the suitable cost term and scope of the system –
definition of break-even point 232!
9.2.1! ! Suitability of the annuity approach 232!

List of abbreviations and symbols
Wuppertal Institute for Climate, Environment and Energy 7
9.2.2! ! Suitability of the section of the system selected to determine costs: the
relevance of stock market orientation in electricity price building versus
CO2 allowance prices 232!
9.2.3! ! The impact of CCS power plants on determining price in an electricity stock
market-oriented calculation 234!
9.3! ! Conclusions from the economic analysis 236!
10! ! Systems-analytical assessment of CCS in national scenarios 239!
10.1! ! ! Review of the scenarios in the RECCS study 239!
10.2! ! ! Lead Scenario 2008 and definition of the CCS-relevant variant D 240!
10.3! ! ! Energy and emission-related key data of the model 242!
10.4! ! ! Power plant-related key data of scenario D and the scenario family CCS-
EE/KWK 243!
10.5! ! ! Results of the variant calculation in CCS-EE/KWK 246!
10.6! ! ! Conclusions from the scenario analysis 252!
10.7! ! ! Infrastructure expenditure for the transport and storage of the captured
carbon dioxide 253!
11! ! Conclusive integrated assessment of CCS for fossil fuel-fired power
plants and research recommendations 257!
11.1! ! ! Objectives 257!
11.2! ! ! Factors determining the introduction of CCS 258!
11.3! ! ! CCS in the international focus 264!
11.4! ! ! CCS in industry and in the use of biomass 264!
12! ! References 267!
13! ! Appendix 288!
13.1! ! ! Appendix 1: Key data of the cost calculation (Chapter 9) 288!
13.2! ! ! Appendix 2: Key data of variants 1 to 6 of scenario CCS-EE/KWK (Chapter 10) 291!
13.3! ! ! Appendix 3: Pipeline infrastructure scenarios 303!

RECCS plus – Update and Expansion of the RECCS Study
8 Final Report
List of abbreviations and symbols
Abbreviations
AEP American Electric Power
AOSIS Alliance of Small Island States
BGR Federal Institute for Geosciences and Natural Resources (Bundesanstalt für Geowissen-
schaften und Rohstoffe)
BMBF German Federal Ministry of Education and Research
BMU German Federal Ministry for the Environment, Nature Conservation and Nuclear Safety
BMWi German Federal Ministry of Economics and Technology
CAGS China-Australia Geological Storage
CAR Ceramic Autothermal Recovery
CCS Carbon (Dioxide) Capture and Storage
CCSA Carbon Capture & Storage Association
CCSD Cooperative Research Centre for Coal in Sustainable Development (AUS)
CDM Clean Development Mechanism
CER Certified Emissions Reductions
CHPG Combined Heat and Power Generation
CHPP Combined Heat and Power Plant
CLC Chemical Looping Combustion
CLSF Carbon Sequestration Leadership Forum
CO Carbon monoxide
CO2 Carbon dioxide
CO2CRC Cooperative Research Centre for Greenhouse Gas Technologies (AUS)
COACH Cooperation within CCS China-EU
COM Communication measure of the European Union
COORETEC “CO2 REduction TEChnologies” initiative
COP Conference of the Parties (UN)
CSIRO Commonwealth Scientific and Industrial Research Organisation
DOE U.S. Department of Energy
EB Executive Board
ECRA European Cement Research Academy
EEPR European Energy Programme for Recovery
EGR Enhanced Gas Recovery
EIA Environmental Impact Assessment
ENCAP Enhanced Capture of CO2
ENVI The Environment, Public Health and Food Safety Committee (EU)
EOR Enhanced Oil Recovery
EPA Environmental Protection Agency (USA)
EPRI Electric Power Research Institute
List of abbreviations and symbols
Wuppertal Institute for Climate, Environment and Energy 9
ETS Emission Trading System (EU)
EU European Union
FP Framework Programme
GGGSA Greenhouse Geological Sequestration Act 2008 (AUS)
GHGT International Conference on Greenhouse Gas Control Technologies
H2 Hydrogen
HR House of Representatives, USA
IEA International Energy Agency
IGCC Integrated Gasification Combined Cycle
IPCC Intergovernmental Panel on Climate Change
IPPC Integrated Pollution and Prevention Control
ITM Ion Transport Membrane
IZ Klima Initiative Klimafreundliches Kohlekraftwerk (climate-friendly coal-fired power station initiative)
JCG Australia-China Joint Coordination Group on Clean Coal Technologies
LCA Life Cycle Assessment
LCP Large Combustion Plants
LDC Least Developed Countries
LPG Liquefied Petroleum Gas
MEA Monoethanolamine
MOP Meeting of the Parties (UN)
NGCC Natural Gas Combined Cycle
NGO Non-Governmental Organisation
NRW North Rhine-Westphalia
NZEC Near-Zero Emission Coal Technologies (China)
OJ Official Journal of the European Communities
OSPAR International Cooperation on the Protection of the Marine Environment of the North-East
Atlantic
OTM Oxygen Transport Membrane
R&D Research & Development
RMB Renminbi (currency of the People’s Republic of China)
RTI Research Triangle Institute
SBSTA Subsidiary Body for Scientific and Technology Advice
SCCS Scottish Centre for Carbon Storage
STP Steam Power Plant
STRA-CO2 Support to Regulatory Activities for Carbon Capture and Storage
TGR-BF Top Gas Recycling-Blast Furnace
UBA German Federal Environment Agency
ULCOS Ultra Low CO2 Steelmaking
UN United Nations
UNCLOS United Nations Convention on the Law of the Sea
VO European Community Regulation
WI Institute for Climate, Environment and Energy
WRI Western Research Institute

RECCS plus – Update and Expansion of the RECCS Study
10 Final Report
Units and symbols
°C degree Celsius
a annum
A$ Australian dollar
b barrel
Bg gas expansion factor
cp compressibility of pores or rock
cW compressibility of formation water
E efficiency factor
Ed displacement efficiency
el electric
EV volumetric efficiency
FVF formation volume factor
g gram
Gt gigatonne (1 billion tonnes)
h hour
K Kelvin
kWhel kilowatt hour electric
kWhth kilowatt hour thermal
l litre
m metre
mCO2, effective effective gravimetric storage capacity
mCO2, theoretical theoretical gravimetric storage capacity
MJ mega joule (0.278 kWh)
MPa mega Pascal
Mt megatonne (1 million tonnes)
MWh megawatt hours (1,000 kWh)
n/g net-to-gross ratio (proportion of sediment structures with porosity and permeability
suitable for absorbing CO2)
th thermal
traps% proportion of traps in the total volume
TWh terrawatt hour (1 billion kWh)
US$ United States dollar
Vb volume of the potential storage
Vgas(STP) cumulative production volume under standard conditions
!CO2 density of CO2
" porosity

List of tables
Wuppertal Institute for Climate, Environment and Energy 11
List of tables
Tab. 2-1 ! Overview of ongoing and completed research projects funded by the Carbon
Sequestration Leadership Forum (CSLF) 51!
Tab. 2-2! List of known European CCS pilot and demonstration projects from the power
lant sector (as of 9/2009) 53!
Tab. 2-3 ! List of known European CCS pilot and demonstration projects from other branches
of industry (as of 9/2009) 66!
Tab. 3-1 ! New developments in post-combustion processes 72!
Tab. 3-2 ! New developments in pre-combustion processes 79!
Tab. 3-3 ! New developments in oxyfuel processes 81!
Tab. 3-4 ! Measures to be carried out in various CO2 capture processes 86!
Tab. 4-1! Current global industrial applications of CO2 (only products and applications in the
megatonne region; figures should be viewed with caution) 88!
Tab. 6-1 ! Regulatory and emissions trading laws governing the CCS process 124!
Tab. 7-1 ! Overview of the characteristic properties of suitable reservoir rocks (minimum,
maximum and optimum conditions) 144!
Tab. 7-2 ! Estimated values by various authors to determine storage capacity in saline
aquifers for Germany (onshore) 154!
Tab. 7-3 ! CO2 storage capacities for Germany in natural gas fields 157!
Tab. 7-4 ! CO2 storage capacities for Germany in various formations 159!
Tab. 7-5! CO2 storage capacities in Europe (known estimates) 164!
Tab. 7-6! European estimates of CO2 storage capacities and emissions from point sources
in all European countries 166!
Tab. 7-7! Comparison of CO2 storage capacities in the Netherlands 167!
Tab. 7-8! Comparison of CO2 storage capacities in Denmark 170!
Tab. 7-9! Comparison of CO2 storage capacities in the United Kingdom of Great Britain and
Northern Ireland (UK) 175!
Tab. 7-10! Comparison of CO2 storage capacities in Norway 177!
Tab. 7-11! CO2 storage capacities in Utsira 179!
Tab. 7-12! Overview of conservative capacity estimates of CO2 storage in Germany’s
neighbouring countries compared with emissions from large point sources 183!
Tab. 8-1! Comprehensive overview of assumptions of life cycle assessments along the
whole CCS chain 192!
Tab. 8-2! Greenhouse gas emissions from solar thermal power plants, photovoltaics and
offshore wind (current situation, 2025 and 2050) 203!

RECCS plus – Update and Expansion of the RECCS Study
12 Final Report
Tab. 8-2! Comprehensive overview of results of life cycle assessments along the whole
CCS chain – evaluation of five different studies 204!
Tab. 9-1! Expenses, costs and other parameters of “market-ready” CCS power plants
(2020), “mature” CCS power plants (2040) and their reference power plants (2020) 220!
Tab. 9-2! Differential costs of electricity generating costs and CO2 avoidance costs (new
plants) for natural gas (combined cycle), hard coal (steam), hard coal (IGCC) and
lignite (steam) power plants (price trajectory A/C) (with/without CCS) 224!
Tab. 9-3! Differential costs of electricity generating costs and CO2 avoidance costs (new
plants) for natural gas (combined cycle), hard coal (steam), hard coal (IGCC) and
lignite (steam) power plants (price trajectory C/A) (with/without CCS) 226!
Tab. 10-1! Energy and emission-related key data of the model in 2020 242!
Tab. 10-2! Construction of new fossil fuel-fired power plants from 2005, accessible capacity
for CCS (large-scale power plants) and their electricity generation, comparison with
expansion of renewable energies and their electricity generation in scenario D 244!
Tab. 10-3! Proportion of power plants equipped with CCS in the investigated variants of
scenario CCS-EE/KWK 245!
Tab. 10-4! The effects of using CCS technology in the new construction and retrofitting of
fossil fuel-fired power plants for various framework conditions 248!
Tab. 10-5! Quantities of captured carbon dioxide in the variants of the new scenario CCS-
EE/KWK and the RECCS scenarios CCS-MAX and CCS-BRIDGE 254!
Tab. 13-1! Price trends for fuels and CO2 allowances under three different scenarios: A
(considerable), B (moderate) and C (very low) 288!
Tab. 13-2! Electricity generating costs for fossil fuel-fired power plants with/without CCS for
different energy source and CO2 price trajectories A/C (considerable/very low)
and C/A (very low/considerable) 289!
Tab. 13-3! Future cost trend of electricity-generating renewable energy technologies
(new plants) and the mean of the whole mix of renewable energies (with/without
photovoltaics) 290!
Tab. 13-4! Key data of the scenario variant “Maximal-theoretisch” 291!
Tab. 13-5! Key data of the scenario variant “Maximal-realistisch” 293!
Tab. 13-6! Key data of the scenario variant “Maximal-Neu” 295!
Tab. 13-7! Key data of the scenario variant “Realistisch I” 297!
Tab. 13-8! Key data of the scenario variant “Realistisch I – only Kohle” 299!
Tab. 13-9! Key data of the scenario variant “Realistisch II” 301!
List of figures
Wuppertal Institute for Climate, Environment and Energy 13
List of figures
Fig. 2-1 ! Allocation of the COORETEC budget according to technological sectors (as of
6/2009). Total budget of COORETEC: ! 142.5 million 45!
Fig. 2-2 ! The EU “Directive on the geological storage of carbon dioxide” and its manifold
connections to other elements of EU climate policy 50!
Fig. 2-3 ! Overview of ongoing, planned and abandoned or completed CCS projects in Europe 52!
Fig. 2-4 ! Overview of ongoing, planned and abandoned or completed CCS projects in the
USA, Australia, China and Japan 58!
Fig. 2-5 ! U.S. R&D budget in the area of coal technologies (as of 2008). Total budget:
approximately US$ 500 million (! 369 million) 61!
Fig. 2-6 ! Planned and existing CCS projects in Australia 63!
Fig. 3-1 ! Overview of various technological routes to CO2 capture 69!
Fig. 3-2 ! Number of “capture-ready” and “not capture-ready” power plants recorded in a survey 84!
Fig. 4-1! List of possibilities for using CO2 in the technological, chemical and energy sectors 88!
Fig. 5-1! Overview of attitudes of relevant stakeholders from the area of CCS 112!
Fig. 7-1! Schematic diagram of an aquifer with permeable pore rock and sealed layers from
above and below 143!
Fig. 8-1! Development of greenhouse gas emissions with CO2 capture – evaluation of five
different studies 205!
Fig. 8-2! Greenhouse gas emissions from fossil fuel-fired power plants with CCS in
comparison with electricity from renewable energies (solar thermal power plants,
photovoltaics and offshore wind (2020/2025 and 2050)) 206!
Fig. 9-1! Prices for natural gas, hard coal and lignite at power plant for price trajectories
A, B and C (without CO2 penalty) 214!
Fig. 9-2! Price trends for CO2 allowances for trajectories A, B and C 215!
Fig. 9-3! Price trends for natural gas, hard coal and lignite at power plant for trajectories
A/A, B/B and C/C (with CO2 penalty) 216!
Fig. 9-4! Price trends for natural gas, hard coal and lignite at power plant for trajectories
A/A, A/C, B/B, C/A and C/C (with CO2 penalty) 217!
Fig. 9-5! Decline in the full load hours of fossil fuel-fired power plants in the scenario family
CCS-EE/KWK (zero point is suppressed) 221!
Fig. 9-6! Composition of electricity generating costs (new plants) for natural gas (combined
cycle), hard coal (steam), hard coal (IGCC) and lignite (steam) power plants (price
trajectory A/C) (without CCS) 222!

RECCS plus – Update and Expansion of the RECCS Study
14 Final Report
Fig. 9-7! Composition of electricity generating costs (new plants) for natural gas (combined
cycle), hard coal (steam), hard coal (IGCC) and lignite (steam) power plants (price
trajectory A/C) (with CCS) 223!
Fig. 9-8! Composition of electricity generating costs (new plants) for natural gas (combined
cycle), hard coal (steam), hard coal (IGCC) and lignite (steam) power plants (price
trajectory C/A) (without CCS) 225!
Fig. 9-9! Composition of electricity generating costs (new plants) for natural gas (combined
cycle), hard coal (steam), hard coal (IGCC) and lignite (steam) power plants (price
trajectory C/A) (with CCS) 225!
Fig. 9-10! Future cost trend of electricity-generating renewable energy technologies (new
plants) and the mean of the whole mix of renewable energies (with/without
photovoltaics; zero point is suppressed) 227!
Fig. 9-11! Development of future electricity generating costs (new plants) for renewable
energies and fossil fuel-fired power plants (with/without CCS) for price trajectories
A/C and C/A (CCS from 2020, including transport and storage) 229!
Fig. 9-12! Development of future electricity generating costs (new plants) for renewable
energies and fossil fuel-fired power plants (with/without CCS) for price trajectories
A/C and C/A – detailed portrayal of natural gas (combined cycle), hard coal and
lignite steam power plants 230!
Fig. 9-13! Schematic diagram: the marginal costs effect of renewable energies influences the
average generating costs of electricity according to their usage characteristics 234!
Fig. 10-1! Development of CO2 emissions in the Lead Scenario 2008 and in variants D2
(coal-oriented) and D (plus reduced efficiency), comparison with the business-as-
usual conditions of Energy Report IV and the reduction targets of the German
government for 2020 and 2050 241!
Fig. 10-2! Range of the development of total CO2 emissions, subdivided into the electricity
sector and the sectors of consumption “heat + fuels” for two variants of scenario
CCS-EE/KWK and comparison with the Lead Scenario 2008 246!
Fig. 10-3! Course of CO2 emissions in the electricity sector in the different variants of
scenario CCS-EE/KWK, in the Lead Scenario 2008 and in the hypothetical case
of freezing the contribution of renewables at today’s level 247!
Fig. 10-4! Annual quantities of CO2 to be captured and stored in four variants of scenario
CCS-EE/KWK 249!
Fig. 10-5! Overall electricity generation in variant D of the Lead Scenario 2008 and contribution
of CCS in two variants of scenario CCS-EE/KWK 250
Fig. 10-6! Development of the power plant capacity in variant D of the Lead Scenario 2008
and contribution of CCS in two variants of scenario CCS-EE/KWK (without “penalty
load” of CCS power plants) 251!
Fig. 10-7! Capacity of CCS power plants according to energy sources in scenario
CCS-EE/KWK (variant 4: Realistisch I) and theoretical upper limit (variant 1:
Maximal-Theoretisch) 251!

List of figures
Wuppertal Institute for Climate, Environment and Energy 15
Fig. 10-8! Draft of a Europe-wide cluster of CO2 sources 255!
Fig. 13-1! Exemplary illustration of pipeline infrastructure scenarios resulting from a
CCS-MAX strategy in North Rhine-Westphalia (total distances of 4,330 km in
scenario 1-A, 8,380 km in scenario 1-B and 1,140 km in scenario 1-C) 303!

RECCS plus – Update and Expansion of the RECCS Study
16 Final Report

Conclusive hypotheses
Wuppertal Institute for Climate, Environment and Energy 17
Conclusive hypotheses
Global development of CCS between 2007 and 2009
• A brief glimpse at the worldwide development of CCS over the past three years shows
that the development and demonstration of CCS has been given an increasingly high
profile in Germany, the European Union and many other countries (China, the USA and
Australia have also been analysed).
• Throughout Europe, 41 pilot and demonstration projects were set up in the power plant
sector. The majority of these took place in England, the Netherlands and Norway, fol-
lowed by Germany. Additionally, CO2 capture is being explored in eight known projects
within other industrial sectors.
• Internationally, the integration of CCS in the Clean Development Mechanism (CDM) re-
mains highly controversial. The contentious issues in the negotiations are not only the
basic questions about the suitability of CCS as a technology to reduce greenhouse
gases; there are also complex methodological and legal problems.
• According to the latest industry publications and press releases, the entire CCS chain
(separation, transportation and storage) is only expected to be available on a commer-
cial scale from between 2025 and 2030.
Process of CO2 separation in electricity generation
• Numerous capture processes are being developed worldwide within the individual tech-
nological routes.
• The majority of the research projects are being carried out in the post-combustion pro-
cess, where there are also the most suppliers. Despite the fact that post-combustion
technology is the least efficient of these processes, research into it has been prioritised
with a view to potentially retrofitting power stations.
• In addition to a variety of capture processes within the absorption, adsorption and mem-
brane methods, biological processes are gaining increasing attention (using algae or en-
zymes).
Options for the use of CO2
• Carbon dioxide can be reused, in particular as a parent substance to produce a variety
of materials, ranging from the chemical raw material methanol to end products, such as
urethane, tensides and urea. It can also be used in dry cleaning, fire extinguishers, cool-
ing units and aerosol cans.
• Previous estimates assumed, however, that between much less than 1 per cent and a
maximum of 5 per cent of the current quantity of CO2 produced can be bound to product
cycles.
• There are also a number of ideas for applying biological processes to use CO2 to create
algae biomass, which can be further utilised to produce biogas, biodiesel, bioethanol or
biohydrogen.

RECCS plus – Update and Expansion of the RECCS Study
18 Final Report
Driving forces and attitudes of relevant stakeholders
• Since 2007, the number of stakeholders involved in the public debate on CCS has
steadily grown.
• The opinions of environmental and climate protection organisations, relevant industry
associations and trade unions, representatives of religious institutions, parties repre-
sented in the Bundestag, federal state governments, advisory committees to the German
government and research institutions were examined. Between them, they represent a
wide range of views on CCS.
• The topics on CCS technologies currently being debated are much more specific. In
2007, discussions focused mainly on the technical and economic feasibility of the tech-
nology. Now there is a much broader and frank discussion on the topic, involving ad-
vanced aspects such as potential competitive usages with other technologies and lia-
bility issues.
• Now, the interest in CCS is not limited to its context in coal-fired power plant technolo-
gies. Industrial applications of the technology are also becoming an increasingly import-
ant option for reducing process emissions, as well as its relationship with the use of bio-
mass.
• One specific aspect of this debate, however, remains constant: the opinions and atti-
tudes on the subject of CCS are highly divided between its supporters and opponents,
even within the same groups of stakeholders.
Legal aspects of introducing CCS to power plant technology
• In June 2009, the EU adopted the CCS Directive (2009/31/EC), which is to be trans-
posed into the national law of all Member States within two years. This Directive, along
with other modified legal acts, constitutes a comprehensive regime for the use of CCS
technology valid in all EU Member States that is suitable for achieving the stated objec-
tives.
• By integrating the entire CCS process chain into the European emission trading scheme,
a mechanism will be activated so CCS can be used to provide incentives to investors
both in terms of safety and business management.
• The applicable German law has been inadequate for coping with the different procedural
steps of the CCS chain. Here, the major problems arise in the field of CO2 storage,
solely aimed at permanently removing CO2. For this reason, plans concerning the per-
manent storage of CO2 are only permitted in a few constellations in accordance with the
applicable law.
• In view of the current gaps in knowledge, a CCS law should initially facilitate only R&D
and demonstration plans, and then be reviewed. A suitable legal framework for this,
however, is necessary in the short term.
• Neither the Directive nor the German draft law stipulates how to resolve cases where
competing projects require the same geological formation in order to be realised (for ex-
ample, geothermics or gas storage versus CO2 storage). Therefore, regulations should

Conclusive hypotheses
Wuppertal Institute for Climate, Environment and Energy 19
be devised to capture, assess and solve such conflicts of use resulting from the large-
scale use of the CCS process.
Analysis of the options for storing CO2
• The aim of this analysis was a) to systematically analyse and compare the existing ca-
pacity estimates for storage sites regarding their methods and assumptions, and b) to
present a cautious, conservative estimate as a lower limit for planning purposes for po-
tential investors and political decision-makers, not only for Germany but also its neigh-
bouring countries where CO2 emissions from Germany could possibly be stored.
• Using a scenario analysis, a typical “what-if” examination was conducted in which cau-
tious estimates and assumptions were pooled. The analysis is not based on new geo-
logical data, but instead uses the findings available in the literature.
• The cautious, conservative estimate calculates an effective storage potential for Ger-
many in the region of 5 billion tonnes of CO2 (on the basis of closed systems and the re-
sulting efficiency factor of 0.1 per cent for saline aquifers). The fluctuation range yields
values between 4 and 15 billion tonnes of CO2.
• The storage potential would be sufficient for emissions in Germany, computed to be 1.2
billion tonnes of CO2 up to 2050 in the “realistic” power plant scenario.
• The effective conservative capacity estimated for north-western Europe is 49 billion ton-
nes of CO2. This capacity would be enough to store the current emissions from large
point sources for the next 40 years.
• These estimates, however, do not consider a geographic comparison of sources and
sinks, suitable transport infrastructure, legal issues or questions concerning public ac-
ceptance.
• At present, all estimates of storage capacities should generally be treated with caution.
• Enhanced oil recovery (EOR) could act as an initial scenario for CCS in Europe if suffi-
cient CO2 is made available by 2020. However, EOR needs to first prove itself offshore.
• Since EOR does not assist with climate protection, coupling CCS to this technology is at
odds with the goal of reducing global greenhouse gases.
Environmental assessment of CCS compared to renewable energies
• CO2 capture requires a much greater consumption of finite resources, with all associated
consequences.
• Taking into consideration this increased consumption and the entire process chain, in-
cluding the upstream processes of substances and energies used, the greenhouse gas
emissions from CCS power plants that will start operating in 2020 can be reduced in to-
tal by between 68 and 87 per cent (in exceptional cases up to 95 per cent).
• Due to the increased consumption of energy, there will be an effect on many other envi-
ronmental impacts. In some cases, this will be considerable (and can only be reduced
significantly by pure oxygen combustion).
• The recommendations by some authors to install a comprehensive monitoring pro-
gramme for the first CCS power plants should be taken seriously. This way, we can gain

RECCS plus – Update and Expansion of the RECCS Study
20 Final Report
information about the actual emissions caused or reduced by the capture. Such informa-
tion would considerably improve our understanding of the individual chemical processes,
and how to model them.
• Even compared with CCS power plants, renewable energies are responsible for only a
fraction of greenhouse gas emissions. In 2025 (2050), offshore wind will cause only 5 to
8 (9 to 15) per cent, solar thermal energy 11 to 18 (13 to 23) per cent and photovoltaics
14 to 24 (7 to 12) per cent of emissions from CCS power plants. All renewable energies
will have improved in absolute terms by 2050, but show higher percentages, with the ex-
ception of photovoltaics, because CCS technologies will also improve.
• Other aspects have also been neglected in life cycle assessments. These include dras-
tic, extensive changes to the landscape caused by coal mining, the consequences of a
lowering of the ground water table, contamination of the water by mine drainage and the
creation of enormous slag heaps that have a negative impact on groundwater supply for
agriculture and the surrounding ecosystems.
• It is not yet apparent whether the transportation of large quantities of carbon dioxide will
have a bio-geo-chemical impact on the microbial biota in deep rock formations.
Economic comparison of CCS power plants and renewable energy technologies
• According to the calculations presented here, electricity generating costs incurred by
CCS power plants of between 7.30 and 10.35 ct/kWhel (at power plant) can be expected
by 2020 (assumed real interest rate 6 per cent per annum). In addition to expenditure for
power plants, the development of fuel and CO2 allowance prices until 2020 have been
taken into account. Usage fees for storage sites, (“storage fees”), have not yet been in-
cluded in the calculations.
• If the dynamics of the expansion of renewables in the electricity sector remain high, it is
possible that individual renewable energy technologies (offshore and onshore wind
power, solar thermal power plants) may be able to compete with CCS power plants as
early as in 2020.
• If fossil fuel prices increase considerably and the CO2 allowance costs remain low, the
generating costs of CCS-based natural gas and hard coal-fired power plants will be
higher from 2020 than those of renewable energies. Lignite-fired CCS power plants will
follow from 2025 (offshore wind / solar thermal energy) or 2030 (mix of renewable ener-
gies).
• Even in the case of very low increases in energy prices (but higher CO2 penalties), the
additional costs incurred by CCS would be so high that renewable energies would re-
main competitive at the same time as in the high price scenario. For lignite, in particular,
the high CO2 penalty would have a negative impact that could not be entirely offset by
CO2 capture.
• If CCS is only made available at a later stage, the increases in costs previously assumed
for the year 2020 during the introduction of CCS would be postponed to probably 2025
or 2030. This would mean, however, that renewable energies, depending on these as-
sumptions, would be able to produce energy more cheaply in both the low and high price
scenario as early as when CCS is first introduced.

Conclusive hypotheses
Wuppertal Institute for Climate, Environment and Energy 21
Systems-analytical assessment of CCS in national scenarios
• Should there be a continued significant expansion of renewables and a steady increase
in combined heat and power generation in the German power supply, the scope for a
further reduction of CO2 in the remaining fossil segment of power supply using CCS is
considerably restricted.
• Ideally, with an established CCS performance of 24 GW, an average of 46 million tonnes
of CO2 could be saved annually up to 2050, compared with an equally sized electricity
generation without CCS. This amount constitutes 18 per cent of the total avoidable CO2
emissions in the electricity sector between 2005 und 2050, and 8 per cent of that within
the entire power supply.
• This potential avoidance of 46 million tonnes of CO2 per year must be set against the
annual figure of 64 million tonnes of captured CO2 (avoidance coefficient of 72 per cent),
for which a corresponding (pipeline) infrastructure must be constructed.
• The capacity of fossil fuel-fired power plants will, due to the expected expansion of re-
newable energies by 2050, steadily decrease to 3,500 hours per annum.
• If the aim remains to significantly expand the share of renewable energies in electricity
generation, the opportunity for implementing CCS is significantly reduced if, at the same
time, the operating life of nuclear power plants is extended.
• Since much of the power plant mix has already been renewed, it is vital to enable the
new fossil fuel-fired power plants constructed to date to be retrofitted as far as possible –
even for medium-sized combined heat and power plants – otherwise the achievable
segment would be reduced even further.
Conclusive integrative assessment of CCS for fossil fuel-fired power plants and re-
search recommendations
• In view of the current state of technical developments, the political guidelines and the
scientific studies published so far, the following six aspects must be highlighted as being
essential determining factors for the introduction of CCS. Within the process, it is crucial
not to look at CCS from single perspectives, but to integrate it into a holistic analysis of
several options for climate protection.
- The technology chain will probably not be available on a large scale before some-
time between 2025 and 2030. Therefore the use of CCS for power plants could in-
creasingly lose its potential role as a bridging function for renewable energies, as
was originally intended.
- The existing potential for CCS will be considerably restricted should there be con-
tinued significant expansion of renewables and a steady increase in combined heat
and power generation in the German power supply. This effect would be acceler-
ated by the planned lifetime extension of nuclear power plants.
- The relative costs of power plants with CCS and electricity generation from renew-
able energies are converging: if the dynamics of the expansion of renewables in the
electricity sector remain high, it is possible that individual renewable energy tech-

RECCS plus – Update and Expansion of the RECCS Study
22 Final Report
nologies (offshore and onshore wind power, solar thermal power plants) could com-
pete with CCS power plants as early as in 2020.
- The holistic assessment of environmental impacts shows that the CCS technology
in itself is neither beneficial nor sustainable.
- As research into the stakeholders has revealed, the social acceptance of CCS tech-
nology depends on, above all, the availability of long-term stable storage sites. An
effective storage capacity of 5 billion tonnes of CO2 can be expected to be the lower
limit for Germany, as shown by a scenario analysis. As with all other estimates,
however, this estimate should be treated with caution.
- Suitable CCS legislation is a further essential determining factor for the introduction
of CCS, as it defines the speed at which this technology can be realised.
• In view of the obstacles, it is increasingly debatable whether we should focus on CCS as
an option in the power plant area, whilst retaining the current priorities in energy policy.
Although most of the results of this study relate to Germany, they may, however, also
justify similar conclusions for the rest of Europe, given EU guidelines to expand renew-
ables and enhance energy efficiency.
• Globally, CCS nevertheless remains an important climate protection technology. Coal-
consuming countries, such as China and India, which may not have the option of rapidly
expanding renewable energies, are increasingly becoming the focus of debate.
• For this reason, research, development and demonstration in the power plant sector
remain important, provided they are not at the expense of funding for renewable ener-
gies.
• In Germany, discussions now focus increasingly on alternative applications of CCS.
Based on the results of this study, it is recommended that the first priorities should be its
potential role in industry and biomass rather than in power plants, and there should be
an assessment of what this could offer for Germany.
Summary
Wuppertal Institute for Climate, Environment and Energy 23
Summary
Chapter 1: Introduction
The RECCS study, presented at the beginning of 2007, was the world’s first comprehensive,
integrated assessment of CCS technology (WI et al. 2007). By the term “CCS technology” we
mean the entire chain, from the separation, condensation and transportation of carbon diox-
ide to its storage. A unique comparison with the development of renewable energies was
also carried out in the study. In the past three years, however, there have been a whole host
of new developments at the technical, political and scientific level. To take these develop-
ments into account and to include other aspects that, at most, could only be touched on in
the RECCS study, we now present this update and expansion of the first study. Due to wide-
ranging developments in the power plant sector, the updated study focuses only on electricity
generation, and neglects hydrogen generation.
Chapter 2: Global development of CCS between 2007 and 2009
A brief glimpse at the worldwide development of CCS over the past three years shows that
the development and demonstration of CCS has been given an increasingly important role in
Germany, the European Union (EU) and many other countries (China, the USA and Australia
have also been analysed). In Germany, development projects are primarily funded within the
scope of the COORETEC (CO2-REduction-TEChnologies) programme of the German Fed-
eral Ministry of Economics and Technology and the Geotechnologies Programme of the
German Federal Ministry of Education and Research. The construction of two demonstration
coal-fired power plants using CCS technology is in the pipeline, and individual power plant
units will be equipped with carbon dioxide capture systems. CO2 scrubbing has already been
installed on a trial basis in individual units at two power plant locations and, significantly, the
world’s first pilot plant for lignite combustion with the oxyfuel process became operational.
Throughout Europe, 41 pilot and demonstration projects were set up in the power plant sec-
tor, the majority of which were undertaken in England, the Netherlands and Norway, followed
by Germany. Additionally, CO2 capture is being explored in eight known projects within other
industrial sectors. Despite, or due to, this wide range of activities, the time when the whole
CCS chain will be utilisable on a commercial scale is constantly being postponed, and is now
expected to be ready sometime between 2025 and 2030.
CCS and CDM
The integration of CCS in the Clean Development Mechanism (CDM) has also proved to
remain highly controversial at an international level. Admitting CCS projects under the um-
brella of the CDM was first discussed in 2005 at international climate negotiations. Although
a number of consultations have taken place since then between all interested parties and
organisations, they have not yet led to any results. The points of contention in the negotia-
tions are not only basic questions on the suitability of CCS as a technology to reduce green-
house gases, but also complex methodological and legal problems.

RECCS plus – Update and Expansion of the RECCS Study
24 Final Report
Chapter 3: Processes of CO2 separation in electricity generation
Numerous capture processes are being developed worldwide within the individual techno-
logical routes. The majority of the research projects are related to the post-combustion pro-
cess, for which there are also the most suppliers. In addition to a variety of capture pro-
cesses, which are based on the absorption, adsorption and membrane methods, recent in-
terest has focused on biological processes (using algae or enzymes). Despite the fact that,
from today’s perspective, post-combustion technology is the method with the highest effi-
ciency losses, research into it is prioritised with a view to potentially retrofitting power sta-
tions. However, potential retrofitting is only appropriate for power stations that have a suffi-
cient length of service life remaining. Although it is said that CCS will not become available
before 2020, this primarily involves plants that are currently under construction or in the
planning stage. There is no adequate standard definition of such “capture ready” power sta-
tions. However, according to a recent survey, 13 of the 16 investors interviewed stated that
the coal-fired power plants they had planned or were constructing (only power plants with
capacities above 300 MW) were designed to be “capture ready”.
Chapter 4: Analysis of the options for the use of CO2
Possibilities for reusing CO2 arise in these fields: as a parent substance to produce a variety
of materials, ranging from the chemical raw methanol to end products, such as urethane,
tensides and urea; or as a technical aid in dry cleaning, fire extinguishers, aerosol cans and
cooling devices, along with other applications. Nevertheless, the majority of these processes
are brief since the CO2 is released again very quickly. In the food industry, CO2 is mainly
used as carbon dioxide gas in beverages and to neutralise water. In terms of volume, the
possibility of substituting CO2 used in this industry with captured CO2 is virtually negligible.
Previous estimates assumed that between much less than 1 per cent and a maximum of 5
per cent of the current quantity of CO2 produced can be bound to product cycles. In connec-
tion with the synthesis of methanol, use of CO2 as a “raw material” would be significantly dif-
ferent once “cheap, non-fossil hydrogen”, for example, or other reducing agents become
available, enhancing the potential for reduction. Plastics could then be used on a much larger
scale as substitutes for other materials, such as those used in the metal sector (including the
manufacture of car bodies).
There are already a number of ideas for using biological processes to capture CO2 or to ab-
sorb CO2 from the atmosphere. Microalgae are able to absorb CO2 from flue gases fed to
them. The biomass created in the process would have to be separated by centrifugation, for
instance, and further utilised (for example, to produce biogas, biodiesel, bioethanol or biohy-
drogen). Plants of this type would probably be used for smaller CO2 sources but large areas
or volumes are available for such bioreactors. In the area of land plants, work is being under-
taken on a genetically modified enzyme development to create a more efficient storage of
CO2 from the air. Microbiological transformation, on the other hand, involves converting car-
bon dioxide into methane. Other considerations include afforestation and the induction of
algal blooms in the ocean.
Other processes and approaches include the carbonisation of biomass, the storage of trees,
new catalysis processes to cleave CO2 in carbon monoxide or to convert it onto a hydrocar-
bon, the development of new materials and the absorption of CO2 to minerals.

Summary
Wuppertal Institute for Climate, Environment and Energy 25
Chapter 5: Driving forces and attitudes of relevant stakeholders
In recent years, the number of players involved in the public debate on CCS has steadily
grown. In 2007, mainly utility companies and environmental organisations were involved in
the public debate, and it was given only brief coverage in the media. Today, the issue ignites
diverse debate across a whole spectrum of social, economic and political groups.
The topics on CCS technologies now being debated are much more focused. While in 2007
discussions mainly addressed the technical and economic feasibility of the technology, there
is now much broader and more open exchange on the topic, involving advanced aspects,
such as potential competitive usages with other technologies and liability issues. Reports on
CCS are no longer restricted to the context of coal-fired power plant technologies. It is no-
ticeable that greater attention is now being paid to industrial applications of the technology as
an option to reduce process emissions. The technology is also being mentioned more fre-
quently in the context of biomass use. In Germany, the focus is primarily on the technical
advancement of CCS technologies; most stakeholders believe that these technologies are
best implemented and applied in the aspiring industrial nations that have considerable de-
posits of coal (such as China and India).
The growing expertise about CCS technologies goes hand in hand with stakeholders adopt-
ing increasingly strong positions. One specific aspect of this debate, however, remains con-
stant: the opinions and attitudes on the subject of CCS are strongly divided between its op-
ponents and supporters, sometimes even within the same groups (for instance, envi-
ronmental NGOs and science).
The analysis shows that there is no clear majority among environmental and climate protec-
tion organisations either for or against CCS technologies. The relevant industry associations
and trade unions, however, are mainly in favour of continuing to explore and implement CCS
technologies. A more negative attitude towards CCS is emerging among representatives of
church institutions, especially in regions where the use of CCS may directly affect the public
and future generations. The majority of parties represented in the Bundestag and the Ger-
man government support the use of CCS. At federal state level, Schleswig-Holstein federal
state government and all parties represented in the Schleswig-Holstein parliament clearly
oppose the storage of CO2. Highly industrialised, coal-producing federal states, such as
Brandenburg and North Rhine-Westphalia, on the other hand, are advocates of CCS. A two-
level conflict is therefore emerging: at the first level, between federal states with a great CO2
storage potential and the German government and, at the second level, between the “stor-
age states” and all other federal states.
Advisory committees to the German government mainly have a negative attitude towards
CCS technology. These committees highlight the major uncertainties associated with the use
of the technology, in particular its storage, and warn against premature strategic decisions
being taken. In addition, they believe the technology must not impede the development of
renewable energies and the enhancement of energy efficiency. The German Federal Envi-
ronment Agency, in particular, classifies CCS as unsustainable within the definition of sus-
tainable development. On the other hand, the German Council for Sustainable Development
advocates taking a leading role in the development of CCS to facilitate the sustainable use of
coal.
RECCS plus – Update and Expansion of the RECCS Study
26 Final Report
As with environmental and climate protection organisations, German research institutions
take an ambivalent stance towards CCS technology. Potsdam Institute for Climate Impact
Research and Öko-Institut regard CCS as a necessary climate protection option that should
be employed in certain sectors (such as heavy industry) or countries (such as China or India)
where it is difficult to achieve reductions in CO2 and the associated structural change. For-
schungszentrum Jülich considers CCS to be an important option for Germany, too, whereas
this is rejected by the Institute for Futures Studies and Technology Assessment.
Chapter 6: Legal aspects of introducing CCS to power plant technology
Europe
In June 2009, the European Union adopted the CCS Directive (2009/31/EC), which is to be
transposed into the national law of all Member States within two years. This Directive, along
with other modified legal acts, constitutes a comprehensive regime for the use of CCS tech-
nology valid in all EU Member States that is suitable for achieving the pursued objectives.
Since the specifications are very detailed in parts, it shows Member States what national
CCS policy might look like. At the same time, however, they are given wide scope for imple-
menting and formalising in important areas relating to the policy system.
The controversial and significant topic of liability has been the focus of much discussion. Re-
sponsibility for closed storage sites is usually transferred to the state after 20 years if certain
requirements are met. Most experts agree that this transfer of responsibility is appropriate.
Considering the periods (at least 800 years) required for climate-effective storage and the
fact that it is virtually impossible for private enterprises, unlike states, to guarantee their ex-
istence for such long periods, this 20-year time limit given in the Directive for transferring
responsibility is very short. However, Member States are able to set a longer period for the
earliest time possible for transferring responsibility.
With the implementation of the capture ready regulation in the Large Combustion Plant (LCP)
Directive, European legislators have accepted a politically negotiated compromise which
states that the use of CCS technology (so far at least) is not an actual requirement for the
approval of constructing new coal-fired power plants. Whether this will still be the case after
the review process, which is expected to take place by 2015, depends on the technical de-
velopments and the political decision that may then be required on the obligatory use of CCS
technology.
By integrating the entire CCS process chain into the European emission trading scheme, a
tool for CCS is activated that can be used to provide incentives to investors from both a
safety-related and a business-management perspective. However, important requirements
for permanent safe storage and for the investment security necessary for project investors
are only described in general and on their merits in the Directive.
Neither does the Directive provide specific guidelines for how authorities should prioritise
between different competing projects that require the same geological formation (for in-
stance, geothermal energy or gas storage versus CO2 storage).
Summary
Wuppertal Institute for Climate, Environment and Energy 27
Germany
The applicable German law has been inadequate to the task of legislating for the different
procedural steps of the CCS chain. The greatest problems arise in the field of CO2 injection,
solely aimed at permanently removing CO2. For this reason, projects concerning the perma-
nent storage of CO2 are only permitted in a few constellations in accordance with the applic-
able law.
On the basis of this finding and the specifications of the CCS Directive (2009/31/EC), a draft
CCS Law intended to encompass the whole CCS process for speedy implementation in
Germany was submitted by the German Federal Cabinet in April 2009. In the end, the Bill
was not adopted. Overall, the CCS Law was recognisably guided by achieving a transposi-
tion close to the specifications of the CCS Directive (2009/31/EC), intending to meet not only
environmental and safety requirements, but also the demands governing the necessary in-
vestment and legal security for CCS projects. This objective was not fully achieved by the
draft CCS Law. The CCS process is not expressly called a transitional technology in the draft
of the Carbon Dioxide Storage Act. Although this is not a violation of the guidelines of the
CCS Directive, critics in Germany demand a systematical change by declaring the CCS Law
as a research law that can be used to enable the exploration of CCS in a limited number of
demonstration plants. It is clear that, from today’s perspective, the CCS process, and in par-
ticular the question of the permanence of CO2 storages sites, cannot be answered conclu-
sively, and certainly not in general terms.
The provisions for detecting, assessing and resolving conflicts concerning underground
usage resulting from the large-scale use of CCS technology were also inadequate. The pro-
visions provide for solutions to individual cases, rather than for extensive, preventive plan-
ning. In a renewed attempt at creating legislation, the reservations of the potential federal
“storage states”, underestimated in the “first attempt” at devising a CCS Law explored here,
should be taken seriously. The authors are also critical of the regulatory approach because it
failed to regulate and specify fundamental legal decisions in a parliamentary act. Instead,
they were moved to the level of ordinances. However, the relevant ordinances were not
tabled at the same time as the Act. In view of the distinct conflicts emerging between land
owners and those with an interest in underground uses, this legal relationship should also be
regulated so that the risk of legal uncertainty is mitigated, and all parties are aware of their
rights and obligations. If the question of the suitable time to transfer responsibility to the re-
spective federal state is explored in further detail, the general deadline of a minimum of 30
years after the decommissioning of the plant, as stipulated in the draft of the Carbon Dioxide
Storage Act, seems appropriate. It is not recommended that new and extended, or shortened
clauses, are established in addition to the technology clauses currently used with standards
that were formalised over a long period in practice through jurisprudence. This would cause
unnecessary legal uncertainty.

RECCS plus – Update and Expansion of the RECCS Study
28 Final Report
Chapter 7: Analysis of the options for storing CO2
Germany
Underground storage of the greenhouse gas CO2 is crucial to the whole CCS process
chain.The objectives of the analysis were therefore to:
• systematically analyse and compare existing capacity estimates with regard to their
methods and assumptions;
• present a cautious, conservative estimate for the effective capacity within the definition
of a lower limit for orientation purposes for potential investors and political decision-
makers.
This would be not only for Germany, but also for neighbouring countries where CO2 from
Germany could possibly be stored.
Using a scenario analysis, a typical “what-if” examination was conducted in which cautious
estimates and assumptions were pooled. Rather than basing the analysis on new geological
data, it uses findings given in the literature. It should be pointed out that, due to a lack of
practical experience of injecting CO2, and also a lack of data, both the conservative calcula-
tion presented here and existing estimates should be treated with caution.
The “techno-economic resource pyramid for capacity for CO2 geological storage” is often
used to classify the assessed potential. In this concept, a differentiation is made between the
total pore space (theoretical capacity), the available volume (effective capacity, derived from
the theoretical capacity by applying an efficiency factor) and the practical capacity (which
depends, among other things, on source-sink matching, acceptance issues and injection
rates).
The present estimates of the CO2 storage potential for Germany in saline aquifers and de-
pleted natural gas fields (both onshore and offshore) reveal a wide range of effective ca-
pacity of between 3 and 44 billion tonnes of CO2. The average can be taken as 17 billion
tonnes of CO2, which was the conservative estimate published in the GeoCapacity project for
Germany. The main reason for this extreme range is that the assumptions of storage effi-
ciency vary considerably.
• Efficiency in saline aquifers, which describes the proportion of water in the saturated
subsurface that can be displaced by the injected CO2, ranges from 0.1 to 40 per cent in
the analysed studies. Hence the range of fluctuation of capacities is also enormous – for
onshore aquifers alone, previous estimates vary between 0.47 billion tonnes (JOULE II),
12 billion tonnes (GeoCapacity), 28 billion tonnes (BGR) and 42 billion tonnes
(GESTCO).
• With natural gas fields, efficiency varies between 75 and 100 per cent of the cumulated
recovery of natural gas, and leads to a storage potential in the analysed studies of be-
tween 1.7 and 2.8 billion tonnes of CO2.
There is less deviation in the individual studies with regard to the values chosen for the den-
sity of CO2, the proportion of traps and porosity.

Summary
Wuppertal Institute for Climate, Environment and Energy 29
For our own cautious, conservative estimate the following results can be summarised:
• With the deep saline aquifers, it is assumed that CO2 can only be injected in trap struc-
tures. Many authors justify this limitation because of its higher permanence, leading to
greater public acceptance. In addition, every system is viewed as being closed, resulting
in an efficiency factor, related to the total onshore aquifer volume, of 0.1 per cent. These
assumptions are confirmed by several new studies, which take the lower efficiency fac-
tors into account and advocate taking only closed underground systems into consider-
ation. Based on these assumptions, the conservative estimate of the storage capacity for
Germany in onshore saline aquifers amounts to 0.84 billion tonnes of CO2. The sensi-
tivity analyses with efficiency factors 0.045 per cent and 1 per cent yield a range of fluc-
tuation from 0.38 to 8.4 billion tonnes of CO2.
• The offshore aquifers had already been estimated conservatively in the GeoCapacity
report, which is why this calculation is assumed here. It gives an average capacity of 2.9
billion tonnes of CO2 (fluctuation of 1.88 to 4.4 billion tonnes of CO2). These values are
considerably higher than the capacities for onshore aquifers, even though German on-
shore aquifers are considerably larger than their offshore counterparts. The reason for
this is that, due to a lack of reliable data for offshore aquifers, it was impossible to carry
out a comparable cautious estimate, as had been the case for onshore aquifers. If the
cautious assumptions for onshore aquifers are moderated and if, as in the upper sensi-
tivity analysis, a higher increase in pressure is permitted, a different relationship between
onshore and offshore appears.
• A storage potential in depleted natural gas fields ranging from 1.34 to 1.61 billion tonnes
of CO2 (excluding reserves) and 1.62 to 1.94 billion tonnes of CO2 (including reserves)
was calculated by setting an efficiency factor of between 75 and 90 per cent. This as-
sumption seems to be justified because it is highly unlikely that the pores, previously
filled with natural gas, would be completely filled with CO2.
• Taking all formations together, the cautious, conservative estimate for Germany in this
study totals 5 billion tonnes of CO2 as the basic value. The uncertainty fluctuation yields
values from 4 to 15 billion tonnes of CO2.
If the total CO2 emissions caused by large point sources in Germany (power plants and in-
dustry) are considered (388 million tonnes per annum in 2007), then ultimately, 454 million
tonnes of CO2 would have to be captured annually. With the conservative estimate, these
emissions can be stored for 12 years (basic value) or for 8 or 33 years (sensitivity values). If
the “Realistisch I” scenario is assumed, as calculated in Chapter 10 for Germany, a total of
1.2 billion tonnes of CO2 could be captured in the power plant sector by the year 2050,
which, even under the assumption of the lowest estimate, could be stored within the geo-
graphic region of Germany. Only the effective capacity, however, was used as the basis in
each comparison. The practical capacity, generally lower than the effective capacity, would
yield lower utilisation periods.
Our analysis of the studies and the adoption of a conservative estimate show that there re-
main major uncertainties concerning the estimation of storage potential, particularly with re-
gard to saline aquifers. A further outcome is that the variation of individual parameters has a
considerable impact on the results of the calculation. We should point out that not only exist-

RECCS plus – Update and Expansion of the RECCS Study
30 Final Report
ing, but also our own estimates, are based on rough data. It is important to state a lower es-
timate, however, in the sense of a minimum value, to give politicians and industry a basis for
planning legislation and further investments.
Since the storage capacities analysed are merely approximate regional estimates, the pa-
rameters chosen should be checked and further research and geological investigations
should be undertaken to improve accuracy and knowledge. The objective should be to gain
extensive geological knowledge of all potential storage sites. This would subsequently estab-
lish the availability of potential storage and, therefore, the volume at sites. Although the Cata-
logue of Storage Capacities in Germany, currently under development, will help to improve
the database, it is by no means adequate with regard to the precise assessment of (site-
specific) storage options.
In addition, several geo-technical factors could not be taken into account in this study:
• In the discussion about the total quantity of effective storage capacity, it is often pres-
umed that all emissions from point sources can be injected. Instead of the cumulated
storage potential discussed here, however, the possible injection rate is likely to be the
limiting factor. (Gerling 2010), for instance, estimates the maximum quantity of CO2 that
can be injected annually into storage sites in Germany, based on assumptions by the
BGR, to be 50–75 million tonnes of CO2. Detailed examinations are required here to de-
termine which CCS potentials should, in fact, be implemented on the time line.
• How neighbouring structures are influenced by the injection of CO2 (for instance, with
regard to pressure) and the effect this has on total capacity are only rarely considered in
storage calculations. This interference should be examined further in practice, and
should be included in the calculations to refine this aspect.
• Underground seismic activity continues to be important. Areas that are susceptible to
natural earthquakes are precluded as storage sites. In addition, seismicity induced by
drilling and CO2 injection should also be analysed and avoided.
Europe
In order to estimate the CO2 storage potential in Europe, existing publications were assessed
and their central assumptions compiled. According to these estimates, capacities in Europe
are distributed very unevenly. Depending on the assumptions made in the studies, a total of
between 60 and 800 billion tonnes of CO2 storage potential is available. The potential in
neighbouring countries and the North Sea are especially relevant to Germany.
As we were unable to carry out our own cautious estimates for this study, as in the case of
Germany, instead we adopted the conservative estimates of the investigated studies. Some
of these estimates were supplemented by our own analyses. These estimates yielded an
effective storage capacity of 44 billion tonnes of CO2 for Germany’s “neighbouring states”:
the Netherlands, France, Denmark, the United Kingdom, Norway and Poland. The majority of
this capacity is available in Norway, with 21 billion tonnes of CO2 (48 per cent), followed by
the United Kingdom, with 15 billion tonnes of CO2 (34 per cent). The other countries explored
have only small potential at their disposal.

Summary
Wuppertal Institute for Climate, Environment and Energy 31
The Utsira formation, with 1 billion tonnes of CO2, is part of Norway’s storage capacity. This
conservative estimate assumes an effective capacity with an efficiency factor of 4 per cent
and storage only in closed structures.
If the conservative estimate for Germany is added to this figure, the total capacity amounts to
49 billion tonnes of CO2. Compared with the cumulated emissions of the analysed countries
over 40 years (47.6 billion tonnes of CO2), a virtual balance is achieved. The CO2 storage
potential would therefore have to be virtually exhausted in order to eliminate all CO2 emis-
sions.
This simplified comparison, however, disregards several difficulties:
• The increased demand for energy caused by the capture of CO2 and the CO2 capture
rate have not been included in the estimate. If these are set at 30 and 90 per cent, re-
spectively, the emissions needing to be captured and stored increase by 17 per cent.
• The capacities listed are effective, meaning that the necessary geographical matching of
sources and sinks would reduce this potential yet further.
• It was assumed in the comparison that the whole quantity of emissions could be stored,
which is a highly optimistic assumption if potential injection rates are scrutinised in more
depth.
• In addition, the viability and costs of the necessary pipeline system should be reviewed
(national studies on the costs of CO2 transport generally only allow for transportation
within one’s own country).
• Moreover, such an approach would be a centralistic solution, since the majority of ca-
pacities are located in the North Sea, signalling a significant dependence on just one
combined main pipeline route. It can be assumed that economic issues and public ac-
ceptance would be the decisive factors when considering a pan-European CO2 pipeline
system.
• Some authors argue that the underground injection of CO2 is only possible if the same
volume of salt water is recovered. This generally rules out the storage of CO2 onshore
because the recovered water would also have to be stored or, after being desalinised,
would lead to considerable occurrences of salification. The authors, however, believe
that the recovery of salt water from deep aquifers beneath the North Sea and the resul-
ting input of CO2 is a possibility.
• As in Germany, other countries would not be able to capture the whole quantity of cur-
rent emissions from large point sources for CO2 storage (for the simple reason that there
are legally binding targets for the growth of renewable energies in all EU countries). In
order to be able to assess storage capacities realistically, therefore, similar power plant
scenarios to those for Germany should be generated for other countries, and a “realistic”
quantity of CO2 matched with the conservative estimates of the storage sites.
This wide range of issues and difficulties described here show that, in all, the storage poten-
tial will probably be insufficient for the storage of all emissions. However, it appears the North
Sea would have sufficient capacity to at least store some of the northern European emis-
sions.
RECCS plus – Update and Expansion of the RECCS Study
32 Final Report
Enhanced oil recovery (EOR) using CO2
There appears to be potential for enhanced oil recovery using CO2 in the North Sea. The
obstacles that need to be overcome for a large-scale deployment of CO2 EOR offshore are
the long-term, safe supply of CO2 and a stable oil price above US$ 100/barrel. The largest
capacities will probably be required in the 2020s, by which time it is highly unlikely that a CO2
pipeline infrastructure will be in existence.
The economic incentive of EOR could promote the introduction of CCS as a climate protec-
tion option. If the EOR infrastructure is later used for CCS, the time window in which a plat-
form can be converted must be taken into account. It must also be assessed economically
whether it is worthwhile for the company to convert the platform once oil production has fi-
nally ended. If the conversion is too expensive, the infrastructure will be abandoned and the
storage site may no longer remain usable.
If the life cycle assessment of EOR is considered, it is clear that it cannot contribute to cli-
mate protection. On the contrary: for every tonne of CO2 stored, the production and subse-
quent use of the oil releases a four-fold amount of CO2 into the atmosphere. The only advan-
tage would be that by using industry emissions for EOR, the naturally occurring quantities of
CO2 previously used would remain underground and would not be tapped.
Chapter 8: An environmental assessment of CCS compared with renewable energies
In the RECCS study, life cycle assessments were carried out for the first time for the three
conventional capture routes. These LCAs were then compared with selected renewable en-
ergy plants and other progressive concepts for the use of fossil fuels. The individual pro-
cesses involved in the capture of CO2 were modelled in detail for post-combustion plants. For
pre-combustion and oxyfuel, however, only the additional energy consumption is included.
No new life cycle assessments were generated in this update. However, several new com-
prehensive life cycle assessments covering all prevalent capture routes applied to lignite-,
hard coal- and natural gas-fired power plants have been presented by a number of institu-
tions. Most of these studies were compiled in 2008. The selected studies, however, were
restricted to those in which life cycle assessments of the entire CCS chain were created,
following the respective ISO standards for life cycle assessments. An analysis was made of
the precision with which the individual steps in the process – capture, compression, transport
and storage – were modelled and also of what assumptions were made in the process.
The findings of the RECCS study were principally confirmed in the newer studies, and devel-
oped significantly. If the entire process chain, including the upstream chains of substances
and energies used, is considered, the greenhouse gas emissions from CCS power plants
operational in 2020 will only be reduced in total by around 68 to 87 per cent (in exceptional
cases up to 95 per cent).
However, other environmental impacts should be considered in addition to greenhouse gas
emissions. The higher energy consumption required in all of the processes and the materials
used in the capture processes can be perceived in direct proportion to the various impact
categories of the life cycle assessment. This factor was only modelled for the post-
combustion process in the RECCS study. More recent studies, however, also present find-
ings for pre-combustion (for both lignite and hard coal) and for oxyfuel. Amongst other things,
these studies have explored summer smog, eutrophication, soil and water acidification, ma-

Summary
Wuppertal Institute for Climate, Environment and Energy 33
rine ecotoxicity and particle emission. Depending on the assumptions made in the studies,
the various interactions in the capture processes lead to many trade-offs in the individual
environmental impact categories. In some studies, all emissions increase in accordance with
the additional energy consumption. Other studies, however, model trade-offs that arise from
the simultaneous reduction of other emissions in the course of the CO2 capture process.
As in the RECCS study, most of the studies conclude that for the post-combustion process
increases are observed with virtually all of the environmental impacts (+26 to 250 per cent).
The individual processes cannot yet be modelled in detail for pre-combustion and oxyfuel;
rough estimates for IGCC show 20 to 66 per cent increases for all environmental impacts
and 22 to 80 per cent decreases in all environmental impacts with oxyfuel.
The proportion related to the manufacture of the infrastructure, i.e. the plant required to cap-
ture, transport and store the gas, is analysed as being very low (0.3 to 2.6 per cent) in all of
the studies. Transportation of the CO2 is modelled more or less uniformly, even if assump-
tions regarding the transport distance vary. Leakages of CO2 in the compression and trans-
portation processes were only partially modelled. Leakages at the CO2 storage site were
neglected by all studies. It is assumed in some studies that the storage site would otherwise
not have been approved. Other studies assume that CO2 would indeed be released, albeit
with a long delay, which would be significantly better for the environment than the current
high rates of emission. The injection is either not modelled at all, or it is modelled only for the
purpose of power requirements or for the required infrastructure.
The largely different assumptions for the CCS chain, the time of use of CCS, the type of re-
ference power plants, the selection of various parameters and the heterogeneous choice of
environmental impact categories are particularly conspicuous. As in many other life cycle
assessments, this reveals a need for action to harmonise life cycle assessments for CCS
technology. Together with the German “Network on Life Cycle Inventory Data”, it is proposed
that the aim of harmonising life cycle assessments should be to develop standard guidelines
and to then create standard life cycle assessments for CCS reference plants based on these
guidelines.
The recommendations of some authors to install a comprehensive monitoring programme for
the first CCS power plants should not be restricted just to life cycle assessments. Such a
programme would be important for gaining information about the actual emissions caused or
reduced due to the capture of CO2. Such information would considerably improve our under-
standing of the individual chemical processes, and how they should be modelled.
Even compared to CCS power plants, renewable energies create only a fraction of green-
house gas emissions. In 2025 (2050), it is estimated that offshore wind will create only 5 to 8
(9 to 15) per cent, solar thermal energy 11 to 18 (13 to 23) per cent and photovoltaics 14 to
24 (7 to 12) per cent of the emissions of CCS power plants. All renewable energies will have
improved in absolute terms by 2050, but show higher percentages, with the exception of
photovoltaics, because CCS technologies will also improve.
Further aspects are also neglected in life cycle assessment. These include the fundamental,
extensive changes to the landscape caused by coal mining, the consequences of a decline in
the ground water table, water contamination by water from mines and the creation of enor-
mous slag heaps that have a negative impact on groundwater supply for agriculture and the

RECCS plus – Update and Expansion of the RECCS Study
34 Final Report
surrounding ecosystems. The resettlement or displacement of the population results in the
loss of agricultural land and homes. Entire village communities are destroyed, leading to so-
cial and cultural problems.
It is not yet apparent whether the transfer of large quantities of carbon dioxide will have a
biogeochemical impact on the microbial biota in deep rock formations. Drilling to depths of
3.5 km has revealed bacteria, viruses and fungi. Many of the types of bacteria found in these
deep rock formations are completely unknown. Their “function” within this ecosystem has not
nearly been researched to a sufficient extent.
Chapter 9: Economic comparison of CCS power plants and renewable energy tech-
nologies
After successfully demonstrating the entire CCS chain (the capture, transport and, in particu-
lar, storage of CO2), according to our calculations, electricity generating costs from CCS
power plants of between 7.30 and 10.35 ct/kWhel (at power plant) can be achieved by 2020
(assumed real interest rate 6 per cent per annum). The price range depends on both the
technology taken into consideration and the price trends of fuel and CO2 allowances up to
2020. The usage fees for storage sites (“storage fee”), as called for by several federal states
and the German Advisory Council on the Environment, have not yet been included.
Two scenarios were considered: very low increasing fuel costs with high CO2 penalties
(scenario C/A) and considerably rising energy costs that cause a surplus of and, therefore,
decreasing CO2 penalties (scenario A/C). In the latter case, considered to be the more
realistic scenario, CO2 avoidance costs in 2020 of ! 68/t CO2 (natural gas), ! 43/t CO2 (hard
coal) and ! 20/t CO2 (lignite) are produced.
Depending on further price trends, the long-term cost projections of CCS range from 8.10 to
13.80 ct/kWhel in 2040 and from 8.80 to 15.40 ct/kWhel in 2050. Lignite steam power plants
are in the lower region, hard coal power plants (steam and gasification) are in the medium to
high range, and natural gas in the top range. Despite increasing running costs, CO2 avoid-
ance costs decrease due to learning effects by 2040 to ! 61/t CO2 (natural gas), ! 36/t CO2
(hard coal) and !17/t CO2 (lignite). With the exception of lignite, therefore, they are still a long
way from achieving the costs of around ! 20/t CO2 to which the power industry aspires.
The average electricity generating costs of renewable energies are presently around 12
ct/kWhel, assuming a representative mix (also calculated at a real interest rate of 6 per cent
per annum). When photovoltaics are excluded from the mix, the average costs amount to
around 10 ct/kWhel. If they continue to be launched at a similar speed as before, average
electricity generating costs of approximately 8.8 ct/kWhel (including photovoltaics) and 8.2
ct/kWhel (excluding photovoltaics) can be achieved by 2020. A sustained global increase in
market penetration and learning effects give reasons to expect further significant cost de-
gressions for renewable energies over time. By 2050, therefore, the level of costs in the in-
vestigated characteristic mix could be around 8.8 ct/kWhel. Technologies such as offshore
wind power or geothermal energy could achieve electricity costs of around 5 ct/kWhel if their
learning curve continues to be used for the further expansion of global markets.
If the dynamics of the expansion of renewables in the electricity sector remains high, as as-
sumed in the scenario family CCS-EE/KWK (Chapter 10), individual renewable energy tech-
nologies (offshore and onshore wind power, solar thermal power plants) will be able to com-

Summary
Wuppertal Institute for Climate, Environment and Energy 35
pete with CCS power plants as early as in 2020, which is considered to be the potential start-
ing point for CCS power plants. The average mix is partially competitive even now. If fuel
prices increase considerably, the generating costs of CCS-based natural gas- and hard coal-
fired power plants will be higher from 2020 than for renewable energies. Lignite-fired CCS
power plants will follow from 2025 (offshore wind/solar thermal energy) and 2030 (mix of re-
newable energies). Even in the case of very small increases in energy prices, the additional
costs incurred by CCS would be so high that renewable energies would remain competitive
at the same time as in the high price scenario. The high CO2 penalty, which cannot be fully
compensated by CO2 capture, has a particularly powerful impact on lignite.
The whole calculation is based on the assumption that CCS technology will be commercially
viable by 2020. If CCS is not made available until a later stage, the increases in costs previ-
ously assumed for the year 2020 during the introduction of CCS would be postponed to later
years (2025 or 2030). This would mean, however, that renewable energies would be able to
produce energy more cheaply in both the low and high price scenario as early as when CCS
is first introduced On the other hand, renewable energies would then also have more room
for manoeuvre if their cost reduction (based on the assumption of learning rates) was also
delayed by five to ten years.
Banking analysts confirm the basic assertion of the calculations presented here. In its 2009
industry report on photovoltaics, for instance, the Landesbank Baden-Württemberg also
modelled other options of CO2 reduction using scenarios. Regarding CCS, they conclude that
this technology is “not practicable on commercial and economic grounds, not even in Central
Europe. Solar electricity generation is not more expensive than CCS (and much cheaper
from 2020).” It raises the question: “Which technology should be subsidised in future from
taxpayers’ money: ‘cleaning’ conventional, fossil fuel-fired power plants, which have an ex-
piration date, by CCS or supplying industrial society with solar electricity, which is arguably
more sustainable.”
According to the assumptions made, therefore, there is no compelling incentive from an eco-
nomic perspective to favour CCS technologies over the further expansion of renewable en-
ergies for power generation. Further considerations show, however, that the issue of gener-
ating costs and the break-even point between CCS-based power plants and renewable en-
ergies are no longer the only decisive factors from the viewpoint of investors. Our calculation
of the electricity costs on an annuity basis is not necessarily the calculation used by inves-
tors. The traditional mark-up method in electricity pricing, which enables additional invest-
ments, the higher fuel costs and an increasing price for CO2 permits to be included in our
calculation, has now been superseded by the stock market approach. This leads to effects
such as the additional CO2 costs being factored into the price, causing them to be considered
as only an item in transit, meaning that they do not influence the calculations of power plant
investors. In fact, the current price for electricity is determined by the stock market price,
which, in turn, is dependent on the merit order of operational power plants. While research
has subsequently proved that renewable energies have led to a decrease in electricity prices,
despite their currently higher capital expenditure (since their marginal costs are virtually zero,
unlike with expensive natural gas), it remains to be seen how they will influence CCS-based
power plants.

RECCS plus – Update and Expansion of the RECCS Study
36 Final Report
Chapter 10: Systems-analytical assessment of CCS in national scenarios
The potential role of CCS in the context of a German climate protection strategy largely de-
pends on previously selected energy strategies. In the occurrence of a continued significant
expansion of renewable energies and a steadily increasing share of combined heat and
power generation in the German power supply, the scope for a further reduction of CO2 in
the remaining fossil segment of power supply using CCS is considerably restricted. Ideally,
with an installed CCS capacity of 24 GW, an average of 46 million tonnes of CO2 could be
saved annually up to 2050, compared with an equally sized electricity generation without
CCS. This amount constitutes 18 per cent of the total avoidable CO2 emissions in the electri-
city sector between 2005 und 2050, and 8 per cent of that within the entire power supply.
This potential saving of 46 million tonnes of CO2 per year must be set against the annual
figure of 64 million tonnes of CO2 that would be captured and would require the construction
of a corresponding (pipeline) infrastructure. Over 30 years, this scenario would require stor-
age capacities of 1,192 million tonnes if CO2 capture came to an end in 2050. Alternative
scenario mixes considered in sensitivity analyses lead to an annual capture quantity of 44 to
117 million tonnes of CO2 and cumulated storage capacities of 830 to 2,153 million tonnes of
CO2.
The CO2 reductions achieved by expanding renewable energies and increasing efficiency in
the supply of heat and fuel are considerably larger for the same period. Even if there is a
great deal of uncertainty surrounding the costs involved, there is much to suggest that an
energy path characterised more strongly by renewable energies would be cheaper in the
medium to long term. However, it will necessitate a considerable restructuring of the energy
economy and infrastructure. For instance, completely different network structures and energy
storage facilities will be required. In any case, CO2 reductions created by efficiency improve-
ments in the electricity sector can be achieved economically with high returns.
The analysed scenarios are also based on the assumption of a scheduled phasing out of
nuclear energy. This leads to the creation of a demand for power plant capacity to fill this
gap. This could then be met by renewable energies and carbon capture technologies. How-
ever, energy policy-makers are discussing the possible extension of the operational life of
nuclear power plants. If this were to happen, the opportunity for implementing CCS is signifi-
cantly reduced. This would impact upon the objective to realise a considerable expansion in
the share of renewable energies in electricity generation. Consequently, there may only be a
“suboptimal” contribution left for potential CCS power plants if it is assumed that considerable
financial resources will be required for further research, development and demonstration be-
fore CCS is commercially available. If, moreover, the earliest opportunity for deployment re-
mains around 2020, it is vital to enable the new fossil fuel-fired power plants to be retrofitted
as far as possible – even for medium-sized combined heat and power plants – otherwise the
achievable segment would be reduced even further. In addition, a completely different mix of
renewable energies would be required, compatible with a respective CCS power plant fleet,
that is not suitable for compensating for fluctuating energies.
It follows from the analysis that the existing German energy policy objectives of considerable
improvements in efficiency (a doubling of energy productivity by 2020 compared to 1990 lev-
els; a 25 per cent share of combined heat and power generation in 2020) and of the required
significant expansion of renewable energies (a 30 to 35 per cent share of renewable ener-

Summary
Wuppertal Institute for Climate, Environment and Energy 37
gies in electricity generation by 2020 and an approximately 50 per cent share by 2030) leave
only minimal scope for the substantial use of CCS technology, even in the case of ambitious
climate protection targets. On the other hand, use of CCS technology would be prudent in a
future energy supply that only achieves moderate successes in increasing efficiency and
further expanding renewable energies, and which shows only little change compared with the
current situation with regard to its structural features.
Chapter 11: Conclusive integrated assessment of CCS for fossil fuel-fired power
plants and research recommendations
Objectives
The development and demonstration of CCS for fossil fuel-fired power plants has become
increasingly prominent in Germany, the rest of the European Union and many other countries
(China, the USA and Australia were analysed).
Particularly at the international level, CCS is considered to be vital for meeting global targets
for reducing CO2. In its “Blue Map” scenario of “Energy Technology Perspectives”, for exam-
ple, the International Energy Agency estimates that a 50 per cent reduction in global CO2
emissions by 2050 (compared to current levels) would require a 48 gigatonne reduction in
CO2 compared to the business-as-usual path (IEA 2008). It has been calculated that CCS
can make a 19 per cent contribution to this decrease, with the CO2 being captured from
power stations and industrial sites in roughly equal measures.
The European Union also supports the development and take-up of CCS technology. One of
the aims, triggered also by deliberations about improving the security of supply, is to be able
to use the resource potential of coal without multiplying greenhouse gas emissions.
Although no quantitative targets have yet been set in Germany, a variety of development
projects have been funded by the German Federal Ministries of Economics and Technology
(BMWi) and Education and Research (BMBF). The further development of the climate-
friendly generation of electricity from coal is identified as an important task in the Integrated
Energy and Climate programme.
Factors determining the introduction of CCS
If we focus on the state of the technical development, policy frameworks and previously pub-
lished scientific research, six crucial factors determining the introduction of CCS should be
highlighted. It is vitally important to consider CCS as part of an over-arching analysis of sev-
eral climate protection options, rather than from an individual perspective.
1. Large-scale availability of the technology
Numerous uncertainties exist with regard to the applicability of CCS and the resulting (quanti-
tative) role of CCS for climate protection. One of these main uncertainties is the issue of how
much time will elapse between the end of testing and actual commercial realisation. Com-
mitment to the timescale for commercial availability of the whole CCS chain (separation,
transport and storage) is consistently being deferred in the latest publications and an-
nouncements by industry. The years between 2025 and 2030 are now increasingly being
referred to as the time by which the technology will be ready for operation.

RECCS plus – Update and Expansion of the RECCS Study
38 Final Report
On the other hand, the agenda for global climate protection must be set in the next ten years.
Essentially, this can only succeed using technologies that are established and basically ap-
plicable now. These include the whole range of technologies to increase energy efficiency
and, primarily, renewables. Even if considerable effort is still required to achieve these tar-
gets with regard to establishing a suitable infrastructure (expansion of power networks,
power storage), this potential outcome nevertheless leads to conclusions that the use of CCS
for power plants (assuming the later availability of the technology) increasingly loses the po-
tential role ascribed to it as a bridging technology. CCS for power stations could primarily
play a supplementary role (for example, if the further expansion of renewable energies
should stagnate, or the full potential of energy efficiency be exhausted), but the implementa-
tion of CCS technology will increasingly focus on other large point sources from the industrial
sector, where the fields of application of renewables and other climate protection measures
are limited.
2. Available potential for CCS
The potential role of CCS depends not only on the expected timing of its application but also
on general developments in the fossil fuel-fired power plant sector. Due to the current power
plant regeneration programme, CO2 capture has arrived too late to be included directly in the
planning phase of the majority of fossil fuel-fired power installations in Germany. It is crucial,
therefore, that power stations currently under construction can be retrofitted at a later stage.
In the best outcome of our scenario analysis, (scenario “Realistisch I”), an average of 46 mil-
lion tonnes of CO2 can be avoided annually up to 2050 with an installed CCS capacity of 24
gigawatts (new construction of 75 per cent of steam and 40 per cent of combined heat and
power stations with CCS; retrofitting of 40 per cent of steam and 20 cent of combined heat
and power plants), totalling 1.2 billion tonnes by 2050. This amount constitutes 18 per cent of
the total avoidable CO2 emissions in the electricity sector between 2005 and 2050, and 8 per
cent of that within the entire power supply system. It is assumed here that, by complying with
existing basic political goals, not only the above-mentioned targets to expand the share of
renewable energies, but also the doubling of energy productivity by 2020 (compared to 1990
levels) and the share of combined heat and power, rising to 25 per cent, will be detrimental to
exploiting the full potential of CCS.
The analysis therefore shows that there is little room for a substantial use of CCS technology
(in power plants) in Germany which is reduced considerably further if the commercial imple-
mentation of CCS is postponed to 2025 or 2030 or an extension of the operating lives of nu-
clear power plants is realised.
3. Development of the relative costs of power plants with CCS and renewable ener-
gies
The economic assessment of power plants with downstream CCS depends not only on the
question of when the additional costs for CO2 capture are lower than the costs for acquiring
CO2 allowances. It is more about determining relative cost effectiveness. To this end, the
timing of competing climate protection options, such as renewables, must also be taken into
account.
If fuel prices increase considerably and the cost of CO2 permits remains low, the generating
costs of CCS-based natural gas and hard coal-fired power plants will be higher than with

Summary
Wuppertal Institute for Climate, Environment and Energy 39
renewable energies from 2020. Lignite-fired CCS power plants will follow from 2025 (offshore
wind/solar thermal energy) and 2030 (mix of renewable energies). Even in the case of very
low increases in energy prices (but higher CO2 penalties), the additional costs incurred by
CCS would be so high that renewable energies would remain competitive at the same time
as in the high price scenario. The high CO2 penalty, which cannot be fully compensated by
CO2 capture, has a particularly significant impact on lignite. If CCS can only be realised later,
the increases in costs previously assumed for 2020 during the introduction of CCS would be
postponed to later years (2025 or 2030). This would mean, however, that renewable ener-
gies would be able to produce energy more cheaply in both the low and high price scenarios
as early as from when CCS is first introduced.
4. Holistic assessment of environmental impacts
Only CO2 emissions created directly at the power plant are generally included in the debate
on CCS as a climate protection option. As this analysis shows, when looking holistically at
the environmental picture, CCS technology is in itself neither beneficial nor sustainable.
On the one hand, CO2 capture involves a considerable additional consumption of non-
renewable resources, with all of the associated consequences. Due to the additional con-
sumption of primary energy, CO2 emissions in the power plant process initially rise, so that
the actual quantity of CO2 avoided is considerably lower than the quantity of CO2 captured.
On the other hand, political goals focus on a reduction in emissions of all greenhouse gases.
Due to the additional consumption of primary energy and the other stages in the process
chain, there would be a rise in non-CO2 emissions, in particular, which cannot be collected by
the capture process. It was shown that greenhouse gas emissions from CCS power stations
will only be reduced in total by around 68 to 87 per cent, depending on the technology (up to
95 per cent only in exceptional cases of specific combinations of technologies and fuels).
Furthermore, some of the other numerous environmental factors increase considerably (and
can only be effectively reduced by pure oxygen combustion). This is also due to the addi-
tional consumption of energy.
It is the responsibility of politicians to deliberate about whether a reduction in CO2 emissions
can be reconciled with the consequences described here or whether other energy technolo-
gies without these disadvantages are preferable. Besides renewable energies, these include
existing fossil technologies, such as CHP plants based on natural gas, which already achieve
the emission targets set for the future for CCS technologies.
5. Storage site capacity and public acceptance
As our investigations have shown, the availability of long-term, stable storage sites, in par-
ticular, will be pivotal in determining the acceptance of CCS technology by the general public.
Compared to the first RECCS study, therefore, the range of stakeholders has been extended
to political and social stakeholders from the storage regions. The issue of public acceptance
has risen far higher up the agenda than was the case three years ago. If CCS technology
should prove to be technically viable, commercially available and even competitive, in spite
of the presented cost scenarios, the decisive factors are likely to be the question of the avail-
ability of suitable storage sites and gaining public acceptance of their use on a large scale.
Scientifically, the question of the availability of potential storage sites for CO2 emissions from
Germany ultimately remains unanswered. The scope of this analysis was, therefore, not re-
RECCS plus – Update and Expansion of the RECCS Study
40 Final Report
stricted to Germany, but was extended to Germany’s neighbours where there may be scope
for their storing German CO2 emissions. The objectives were:
• to systematically analyse and compare existing estimates of storage site capacities with
regard to their methods and assumptions, and
• to present a conservative estimate, a lower limit, as a benchmark for potential investors
and politicians.
The main findings of the analysis are that:
• there are significant uncertainties surrounding the information about storage potentials
(this applies explicitly to the conservative calculation, too);
• the specific basic assumptions from the existing studies could not always be applied
adequately to this analysis, thereby making it difficult to produce a comparative study;
• according to existing studies, the storage potential within Germany is estimated to be up
to 44 billion tonnes;
• taking a cautious, conservative estimate, the available storage capacity must be as-
sumed to be significantly limited (5 billion tonnes of CO2 was estimated, assuming
closed systems and a subsequent efficiency factor of 0.1 per cent for saline aquifers);
• in the event of higher demands, it would be necessary to switch storage to areas in Brit-
ish and Norwegian waters of the North Sea, where there is expected to be sufficient po-
tential;
• even using the conservative estimate, however, the emissions projected in this scenario,
which are intended to be realistic, calculate 1.2 billion tonnes of CO2 up to 2050 for the
power plant sector that could need storing, in addition to further industrial emissions;
• EOR (enhanced oil recovery) could act as an inroad for CCS in Europe, if sufficient CO2
could be made available by 2020. However, this would not be appropriate as an inde-
pendent climate protection option;
• guidelines for a standardised and documented estimate of storage potentials are re-
quired because huge deviations exist in the approach pursued by individual studies, both
in their assumption of central parameters and, in particular, in the documentation of
these assumptions.
The “storage cadastre”, currently being drawn up by the BGR, is expected to constitute a
considerable improvement in terms of clarifying data availability, since all existing geological
investigations at federal state level will be brought together. Nonetheless, considerable un-
certainty will remain until potential storage sites for CO2 are not investigated individually.
Regardless of the eventual realisable capacity, the question of whether this potential could
be exploited quickly enough remains unanswered. It has not yet been explored whether there
will be sufficient quantities of CO2 in a short space of time, as might be expected from a con-
stant flow from large-scale power plants, that can be injected into a storage site. For this rea-
son, it is recommended that there is an investigation of the infrastructure required and the
quantities of CO2 to be transported and injected, using various capacity scenarios for storage
sites, coupled with emissions scenarios. The production capacity available to plants for the

Summary
Wuppertal Institute for Climate, Environment and Energy 41
capture and injection of CO2 should also be included in the timeline. Such a study could be
developed by using scenarios to show which CCS potential in Germany would realistically
have to be available.
6. CCS legislation
A decisive factor affecting the introduction of CCS is the relevant legislation, since it affects
the timescale of the implementation. The European “CCS Directive” is considered to be the
framework for all activities along the CCS chain. In June 2009, the European Union adopted
the CCS Directive, which is to be incorporated into the national law of all Member States
within two years. This Directive, along with other modified legislation, constitutes a compre-
hensive policy for the use of CCS technology valid in all EU Member States that is suitable
for achieving the pursued objectives. By integrating the entire CCS process chain into the
European emission trading system, a tool for CCS will be activated that can be used to pro-
vide incentives to investors from both an investment security and an economic perspective.
Regarding available applicable law in individual countries and the planned transposition of
the EU Directive, it can be said that the applicable law is not suitable for capturing the whole
CCS process chain, in particular with regard to storage. The prompt creation of a suitable
legal framework for CCS is necessary to provide legal and investment security. Given the
gaps in the knowledge, a CCS law should provisionally only enable R&D and demonstration
projects and then be scheduled for subsequent review. Provisions in anticipation of the need
to detect, assess and solve conflicts of interest as a result of a large-scale use of the CCS
process should be accommodated.
CCS in the international focus
In view of the limitations presented here, the position of focusing on CCS as an option in the
power plant sector while simultaneously retaining the current energy policy priorities (expan-
sion of renewable energies and CHP, exhaustion of efficiency potentials and possibly ex-
tending the lifespan of nuclear power plants) is becoming increasingly untenable. Although
most of the results from the present study relate to Germany, similar conclusions may well be
applicable for the rest of Europe, in view of EU guidelines to expand renewable energies and
increase energy efficiency.
Nevertheless, globally, CCS remains an important climate protection technology: coal-
consuming countries such as China and India are increasingly moving centre stage into the
debate, and these countries may not have the option of rapidly expanding renewable ener-
gies. For this reason, research, development and demonstration in the power plant sector
continue to be important activities, as long as they are not at the expense of funding for re-
newable energies. But the questions set out above are also increasingly coming to the fore,
drawing attention to the timeline: what potential does the fossil power plant mix offer in the
medium to long term? Which power stations will possess the necessary criteria to make them
eligible for retrofitting? Alternatively, should they be rebuilt as CCS power plants if the CCS
chain is potentially only available for use from 2030? These questions will be explored in the
follow-up project “CCS global”, which was launched at the end of 2009 in collaboration with
Deutsche Gesellschaft für Technische Zusammenarbeit (GTZ) GmbH.

RECCS plus – Update and Expansion of the RECCS Study
42 Final Report
CCS in industry and in the use of biomass
In Germany, the debate is increasingly being directed towards alternative applications of
CCS. Whereas politicians, utility companies and lobby groups still focus mainly on CCS in
the power plant sector, research institutes, advisory bodies and NGOs are increasingly em-
phasising that the capture of CO2 at industrial point sources and biomass power plants out-
weigh this in importance. These options for use have only been touched upon in the present
study, but should nevertheless be considered briefly here.
• Whereas only greenhouse gas emissions with a target of minus 80 per cent were usually
considered in national climate scenarios, in light of higher reductions now being de-
manded (90 to 95 per cent by 2050), industry will also have to considerably reduce its
emissions. Unlike with CCS in the power plant sector, in the industrial context there are
virtually no alternative options available that could assist in a further reduction of CO2
emissions. Industry can only resort to using electricity and heat from renewable ener-
gies, where they are used directly (for example, in electricity powered steelworks). In
contrast, a significant share of emissions is process-immanent, and cannot be avoided
by applying measures such as renewable energies. There is still a definite need for re-
search into the fields of application of CCS in industry across all sectors.
• The application of CCS in biomass plants (power and heat production, fuels) is of inter-
est because “negative” CO2 emissions can be achieved. By separating the CO2 ab-
sorbed by plants during growth, CO2 could not only be avoided, but extracted long-term
from the atmosphere. This could become relevant if it proves to be impossible to achieve
the set reduction targets in other areas. Whereas some studies point to relevant scen-
arios, there is a need for research into the specific CCS potential that could be imple-
mented in Germany. To this end, it must be taken into account that
• Due to the limited availability of suitable CO2 storage sites, the potential use of CCS
should mainly occur in the industrial sector and for biomass plants. So far, there are no
clear, reliable figures for the capacities that could in fact be used in suitable geological
formations. If conservative estimates should turn out to be realistic, this space should in-
itially be reserved for these applications. The separation of CO2 in industry and for bio-
mass plants would have the added advantage that they generally create fewer emis-
sions than large power stations, enabling the gases to be injected into smaller storage
sites. With power plants, however, between 100 and 400 megatonnes can be emitted in
their lifetime, meaning that emissions from such plants will rarely be deposited at one
single storage site.
Based on the results of this study, it is therefore recommended that major attention is given
first to the two options of industry and biomass, rather than to power plants, and that their
CCS potential for Germany is explored.

Introduction
Wuppertal Institute for Climate, Environment and Energy 43
1 Introduction
1.1 The need for an update of the first RECCS study
The RECCS study, published at the beginning of 2007, was the world’s first comprehensive,
integrated assessment of CCS technology in comparison with renewable energies (WI et al.
2007)1. As such, the RECCS study has sparked great interest among experts, politicians and
NGOs alike.
Over the past three years there has been a multitude of new developments along the entire
process chain throughout the world. Germany has played a prominent role by being the lo-
cation for the first pilot and demonstration power plants either becoming operational (e.g.
Schwarze Pumpe by Vattenfall) or entering the planning phase (e.g. RWE’s IGCC power
plant in Hürth near Cologne). It is also where numerous individual process steps are being
tested. Concrete investigations and detailed planning for potential storage sites and a trans-
port infrastructure are currently underway as part of several of these projects.
A wide variety of projects are also at the planning stage in other countries; a flagship pro-
gramme of demonstration plants is currently being prepared in the EU. Legal frameworks are
being devised concurrently. For instance, the CCS Directive came into force in the EU on 25
June 2009 and must now be transposed into national law by the Member States within the
statutory period of two years. In parallel with the projects focused on power plants, the ex-
ploration and assessment of CO2 storage sites is also being actively pursued. This link in the
CCS chain has so far been regarded as the most insecure element.
The number of scientific publications in the past three years has multiplied in line with the
increase in technical developments. The increased interest can also be seen, for instance,
from the scale of the International Conference on Greenhouse Gas Control Technologies
(GHGT), the ninth of which comprised 900 presentations and 1,400 participants at the end of
2008 in Washington.
In order to take into account the developments of the past three years and to explore further
aspects that were lacking in the RECCS study, or that could not be addressed comprehen-
sively, an update and expansion of the first study is presented here. Due to the multitude of
developments in the power plant sector, however, we depart from the approach taken in the
RECCS study and consider only power generation and not hydrogen generation.
1.2 Content of the present study
Rather than review the entire RECCS study, it was decided to focus on updating the most
important areas in which major changes or activities have occurred in the last three years.
1 An English translation was published at the beginning of 2008.

RECCS plus – Update and Expansion of the RECCS Study
44 Final Report
Essentially, these areas are:
• an analysis of the worldwide development of the past three years,
• an update of the stakeholders in Germany and their attitudes,
• an update of the various processes of CO2 capture in electricity generation currently be-
ing tested,
• a compilation of new life cycle assessments for CCS in the power plant sector,
• an update of the cost trend of both renewable energies and CCS power plants in Ger-
many,
• an expansion of the long-term energy scenarios up to 2050 for Germany, including CCS.
Furthermore, three areas have been newly compiled, namely:
• an analysis of the storage potentials for Germany (not only within Germany but also in
the northern North Sea), an assessment of previously published information for Ger-
many and Europe in total and the derivation of our own conservative estimate,
• the portrayal of legal aspects with an analysis of the legal developments in Europe,
Germany and an outlook for other states within and outside the EU,
• an overview of possible uses of CO2 in industry.
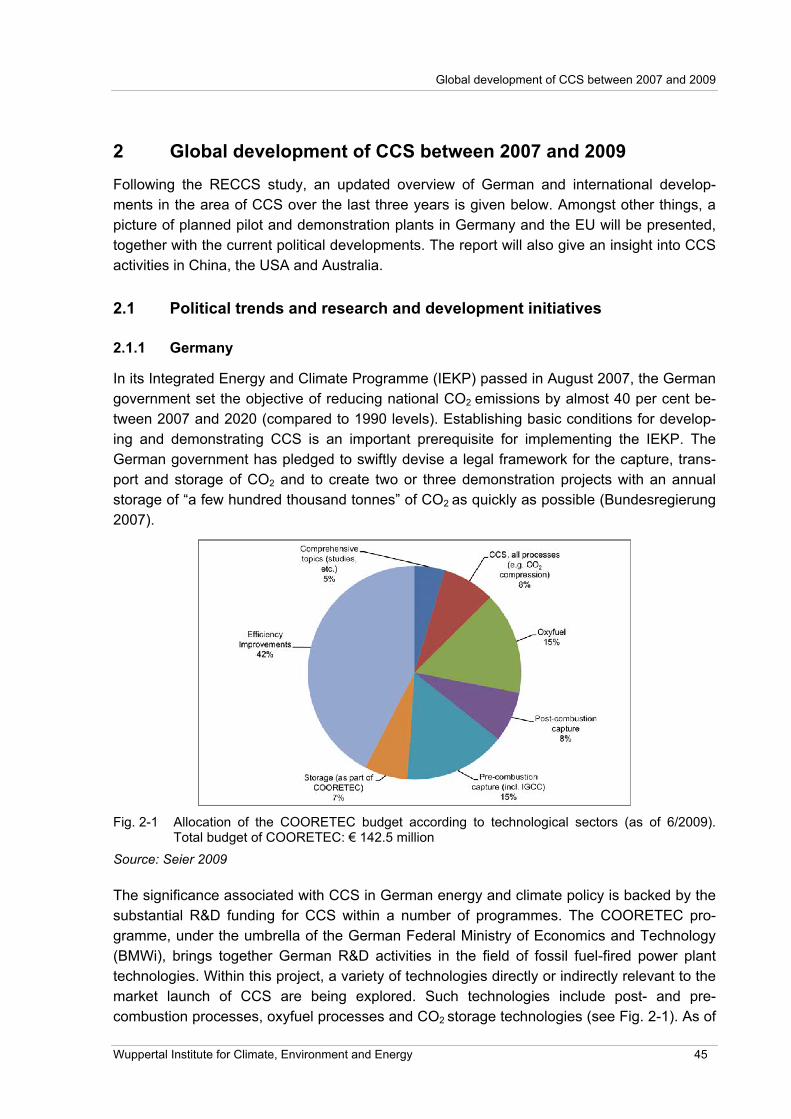
Global development of CCS between 2007 and 2009
Wuppertal Institute for Climate, Environment and Energy 45
2 Global development of CCS between 2007 and 2009
Following the RECCS study, an updated overview of German and international develop-
ments in the area of CCS over the last three years is given below. Amongst other things, a
picture of planned pilot and demonstration plants in Germany and the EU will be presented,
together with the current political developments. The report will also give an insight into CCS
activities in China, the USA and Australia.
2.1 Political trends and research and development initiatives
2.1.1 Germany
In its Integrated Energy and Climate Programme (IEKP) passed in August 2007, the German
government set the objective of reducing national CO2 emissions by almost 40 per cent be-
tween 2007 and 2020 (compared to 1990 levels). Establishing basic conditions for develop-
ing and demonstrating CCS is an important prerequisite for implementing the IEKP. The
German government has pledged to swiftly devise a legal framework for the capture, trans-
port and storage of CO2 and to create two or three demonstration projects with an annual
storage of “a few hundred thousand tonnes” of CO2 as quickly as possible (Bundesregierung
2007).
Fig. 2-1 Allocation of the COORETEC budget according to technological sectors (as of 6/2009). Total budget of COORETEC: ! 142.5 million
Source: Seier 2009
The significance associated with CCS in German energy and climate policy is backed by the
substantial R&D funding for CCS within a number of programmes. The COORETEC pro-
gramme, under the umbrella of the German Federal Ministry of Economics and Technology
(BMWi), brings together German R&D activities in the field of fossil fuel-fired power plant
technologies. Within this project, a variety of technologies directly or indirectly relevant to the
market launch of CCS are being explored. Such technologies include post- and pre-
combustion processes, oxyfuel processes and CO2 storage technologies (see Fig. 2-1). As of

RECCS plus – Update and Expansion of the RECCS Study
46 Final Report
June 2009, the total budget for the COORETEC project amounted to ! 142.5 million (Seier
2009). Of this sum, ! 75.5 million is directly connected to CCS. In contrast, the total budget
of COORETEC in 2007 was just ! 79 million. The significant budget increase is the result of
additional funding for CCS from the High-Tech Strategy launched by the German Federal
Ministry of Education and Research (BMBF) (BMBF 2007). In addition, economic stimulus
programmes recently adopted by the German government also contain funding for research
into CCS amounting to ! 1.5 billion.
Within the Geotechnologies research programme of the BMBF, twelve new projects have
received funding of ! 28.6 million since January 2008 under the thematic focus “Technolo-
gies for the safe and long-term storage of the greenhouse gas CO2 II”. The projects are listed
and briefly described below:
• ALCATRAP – optimisation of CO2 storage by reaction with alkaline residual materials
through the ALCATRAP process
• CLEAN – CO2-enhanced gas recovery Altmark
• CO2-Leakage – CO2-leakage test in a near-surface aquifer for evaluation of monitoring
concepts and methods
• CO2-MoPa – modelling and parameterisation of CO2 storage in deep saliniferous forma-
tions for dimension and risk analyses
• COBOHR – sealing of wells of CO2 underground storage for the long-time abandonment
before and after the injection
• CO2Depth – software for accurate depth focusing, resolution and localisation of CO2
storage and migration processes from 3D seismic data
• CO2SEALS – sealing processes in the geological storage of CO2
• CO2SINUS – CO2 storage in in-situ converted coal seams
• COMICOR – fault-related CO2 migration, alteration and storage properties in new red
sandstone of the Hessian Depression – natural analogue for industrial CO2 sequestra-
tion
• CORA – CO2 reservoir abandonment and post-injection monitoring
• COSONOStRA – CO2-SO2-NOx-stimulated rock alteration
• RECOBIO2 – investigation of the biogeochemical transformation of injected CO2 in the
deep subsurface.
The capture and storage of CO2 is expected to play a leading role in a new energy research
programme launched by the German government. In a paper entitled “Eckpunkte und
Leitlinien zur Weiterentwicklung der Energieforschungspolitik der Bundesregierung” (Key
points and guidelines on the further development of the energy research policy of the Ger-
man government), published by the Helmholtz Association in September 2009, the develop-
ment and use of CCS technologies to achieve climate goals are given a high priority in Ger-
many’s future energy research policy (Helmholtz-Gemeinschaft 2009).

Global development of CCS between 2007 and 2009
Wuppertal Institute for Climate, Environment and Energy 47
In Germany, two coal-fired power plants with CCS technology are in the pipeline, and indi-
vidual power plant units are to be equipped with carbon dioxide capture systems (see also
Tab. 2-2 and Section 3.1 for information about the individual processes):
• RWE’s planned demonstration power plant with IGCC technology in Hürth should origi-
nally have begun operations in 2015. A suitable pipeline route for transporting captured
CO2 and the geological exploration of an applicable storage site in North Frisia and in
Eastern Holstein are also in the planning stages. In summer 2009, massive protests
were staged at the potential storage site in North Frisia, which caused the state parlia-
ment to halt all further exploration of CO2 storage sites. As a consequence, RWE put a
temporary stop to its plans in November 2009 (WDR 2009).
• In Lubmin, near Greifswald, Dong-Energy is planning to equip the new hard coal-fired
power plant, which will go into operation in 2012, with post-combustion technology.
However, planning permission for the power plant has not yet been given and large
numbers of groups have joined forces in the region to protest against the construction of
the plant. Shortly before finalising this report, Dong-Energy surprisingly cancelled this
power plant project.
• In Brandenburg, Vattenfall plans to test two capture processes in the Jänschwalde
power plant near Cottbus: the oxyfuel process, for which a new boiler is being installed,
and the post-combustion process, which is being fitted to existing boilers. Construction is
due to start in 2011. At the same time, geological investigations are being carried out in
two areas (Beeskow and Neutrebbin in Brandenburg) to find a suitable storage formation
for captured CO2 – also for the Schwarze Pumpe pilot plant.
• E.On is planning to build a pilot plant in Wilhelmshaven where a new scrubbing deter-
gent (Econamine-FG+) will be used in the post-combustion process. This pilot plant will
be used within the existing power plant units from 2010.
The trial installation of CO2 capture plants at two power plant units in Germany has already
been completed:
• In collaboration with Linde and BASF, RWE launched a pilot plant to scrub CO2 at the
plant site in Niederaußem in August 2009. The CO2 is separated for test purposes and
then released into the atmosphere again.
• In collaboration with Siemens, E.On commissioned a pilot plant at Staudinger power
station near Großkrotzenburg in mid-September 2009 to develop an innovative solvent.
This project is backed by funds from the COORETEC programme.
Furthermore, Vattenfall put the world’s first pilot plant for lignite combustion with the oxyfuel
process (pilot plant with 30 MWth) into operation in September 2008 at the Schwarze Pumpe
site in the Brandenburg town of Spremberg. The Altmark is also being discussed as a poten-
tial storage site.
In Regulation No. 663/2009 of the European Parliament and of the Council of 13 July 2009
on an economic recovery programme (EEPR, see Section 6.1.2.7), the power plant projects
run by RWE AG in Hürth and by Vattenfall AG in Jänschwalde were classified as eligible for
funding. The contract was awarded only to the project in Jänschwalde, which is one of six
projects that will receive ! 180 million in funding (IZ Klima 2009b).

RECCS plus – Update and Expansion of the RECCS Study
48 Final Report
The establishment of a legal framework for the capture, transport and storage of CO2 is de-
pendent on corresponding requirements of the EU Directive on the geological storage of car-
bon dioxide (see Chapter 6). According to the Directive, the necessary legal and administra-
tive regulations must have been transposed into the law of EU Member States two years
after their publication at the latest (that is, by 25 June 2011). Due to the significance of CCS
technology to climate protection, the German Federal Ministry for the Environment, Nature
Conservation and Nuclear Safety (BMU) is responsible for drafting a German CCS law. The
process is being accompanied by the BMWi.
A draft for a German “CCS law” was adopted by the German Federal Cabinet on 1 April
20092. The law was discussed during a first reading in the Bundestag on 8 May 2009. During
the debate, the German Minister of the Environment stressed the particular importance of
CCS to global climate protection, especially with regard to countries with large coal reserves,
such as China, India, the USA and Russia. The speaker from the BMWi emphasised the con-
tribution of coal in meeting the world’s demand for energy. On the opposing side, there was
criticism from representatives of the group of Bündnis 90/Die Grünen, among others. They
objected to the fact that the legislative procedure was rushed through and also to the subsi-
dies granted for CCS technology (IZ Klima 2009a). The Advisory Council on the Environment
of the German government also voiced its concern (see also Chapter 5).
On 15 May 2009, representatives of the German federal states discussed the Bill in the Bun-
desrat. In its final advisory opinion, they introduced requests for modification on various
technical, ecological and financial issues. There were two central demands made by the
Bundesrat. The first was to avoid rivalry in the use of underground storage sites through CO2
storage by way of a prioritisation of renewable energies (for instance, geothermal energy)
and, secondly, a better allocation of the burdens and risks between the German government,
the federal states and operators. The federal states, for instance, would like to see the Ger-
man government assume sole responsibility of the risks involved in the permanent adoption
of CO2 disposal sites (Bundesrat 2009).
On 25 June 2009 – shortly before the law was to be passed in the Bundestag – the Bill was
surprisingly defeated due to objections from CDU/CSU representatives (also from Schleswig-
Holstein) in whose constituencies explorations for CO2 storage sites were to be carried out.
Reasons given for the rejection included a lack of acceptance of the technology by the public
and concerns over powers of intervention in the property of third parties (Märkische Allge-
meine Zeitung 2009).
A description of the draft bill is given in Section 6.5, along with an analysis of the remaining
questions about its implementation. A detailed description of the various stakeholders in
Germany and their assessment of CCS technology are given in Chapter 5.
2 Draft “Gesetz zur Regelung von Abscheidung, Transport und dauerhafter Speicherung von Kohlendioxid (CO2ATSG)” (Law to regulate the capture, transport and permanent storage of carbon dioxide).

Global development of CCS between 2007 and 2009
Wuppertal Institute for Climate, Environment and Energy 49
2.1.2 European Union
2.1.2.1 The importance of CCS in EU policy
CCS is a central component of the European climate protection strategy. On 17 December
2008, the set of EU directives “Renewable Energy and Climate Change” (“green package”)
was agreed by the European Parliament. It was ratified in March 2009 by the Council of Min-
isters and the Commission and was subsequently published, and enacted, on 25 June 2009.
The following objectives were laid down in the package:
• to increase energy efficiency by 20 per cent by 2016,
• to lower greenhouse gas emissions by 20 per cent by 2020 (base year 1990),
• to increase the share of renewables in final energy consumption from the current EU
average of 8.5 per cent to 20 per cent of final energy consumption in 2020, and
• to raise the share of biofuels in the transport sector to at least 10 per cent.
In order to achieve the planned reductions in greenhouses gases, the EU Commission at-
taches great significance to CCS technology. In a memo to the European Parliament on the
Energy and Climate Package, CCS is said to be “highly important” (European Commission
2008). This is because coal reserves will also have to be used in future to supply energy to
Europe and to meet the ever-increasing need for energy in developing and transition count-
ries. In order to utilise the energy potential of coal without multiplying greenhouse gas emis-
sions, the EU is promoting the development and take-up of CCS technology.
The Energy and Climate Package also contains the follow-up to the EU emission trading
scheme (ETS)3 from 2013 and the “CCS Directive”4. The latter represents the crucial step for
the concrete implementation of power plants with a CO2 capture system and, in particular,
the subsequent storage of CO2. The Netherlands has made the greatest progress so far in
implementing the legal prerequisites for CCS; in Poland, too, arrangements are also being
made to transpose the Directive swiftly. These two countries will be analysed in Section 6.4.
The amendment of the ETS Directive ensures the full acceptance of avoided “CCS CO2” in
the European emission trading scheme. CO2 captured by CCS technology and stored under-
ground is considered to be an emission that has not taken place. At the same time, in ac-
cordance with the Directive, emission permits will no longer be allocated from 2013 but auc-
tioned off, creating an incentive to purchase emission permits or to invest in CO2 capture
systems. Moreover, the EU Commission requests Member States to invest at least 20 per
cent of proceeds from the trading scheme in R&D and in measures to protect the climate.
Within this, CCS is expressly mentioned alongside renewable energy sources (see Section
6.1.2.7 for a more detailed analysis).
Besides the aforementioned Directives and initiatives, the SET Plan (“European Strategic
Energy Technology Plan”), passed by the EU Commission in November 2007, is also fun-
3 Directive 2009/29/EC of the European Parliament and of the Council of 23 April 2009 amending Directive 2003/87/EC (OJ L. 140 of 5 May 2009, p. 63).
4 Directive 2009/31/EC of the European Parliament and of the Council of 23 April 2009 on the geological storage of carbon dioxide and amending other legal acts (OJ L. 140 of 5 June 2009, p. 114).

RECCS plus – Update and Expansion of the RECCS Study
50 Final Report
fundamental to the development and distribution of CCS in the EU. CCS is listed as one of
six key technologies in this Plan which are to be supported in terms of industrial policy until
2020. With a view to launching CCS into the marketplace, it is intended to establish an EU
network of twelve CCS demonstration projects, the construction of which was put out to ten-
der in August 2008. The company Det Norske Veritas AS (DNV) was chosen as the contrac-
tor to assist the EU Commission in setting up the network5.
Fig. 2-2 shows the connections between the different elements of the EU climate package
and the SET Plan and the “Action Plan for Energy Efficiency”.
Fig. 2-2 The EU “Directive on the geological storage of carbon dioxide” and its manifold connections to other elements of EU climate policy
Source: Authors’ design
The Carbon Capture & Storage Association (CCSA) is a highly active national initiative within
the EU. It was established in March 2006 by an industrial consortium to develop CCS tech-
nology, primarily in the United Kingdom but also internationally. It aims to be able to demon-
strate the large-scale use of CCS in Great Britain by 2014. However, its objective is also to
unite business, technology and science sectors in a network so that they can each deliver
5 For further information: http://ec.europa.eu/energy/coal/sustainable_coal/ccs_en.htm (as of 24 September 2009).

Global development of CCS between 2007 and 2009
Wuppertal Institute for Climate, Environment and Energy 51
their own expertise to CCS. This would be supported by the UK government and the EU
Commission.
The state-level Carbon Sequestration Leadership Forum (CSLF), now consisting of 22 mem-
ber states and the EU, is also highly committed to the research area of CCS. Twenty projects
receive funding from the CSLF, seven of which have already been completed (see Tab. 2-1).
Tab. 2-1 Overview of ongoing and completed research projects funded by the Carbon Sequestration Leadership Forum (CSLF)
CSLF project Ongoing Completed
Alberta Enhanced Coal-Bed Methane Recovery Project X
CANMET Energy Technology Centre (CETC) R&D Oxyfuel Combustion for CO2 Cap-
ture
X
CASTOR X
China Coalbed Methane Technology/CO2 Sequestration Project X
CO2 Capture Project (Phase 2) X
CO2CRC Otway Project X
CO2 GeoNet X
CO2 Separation from Pressurized Gas Stream X
CO2 SINK X
CO2STORE X
Dynamis X
ENCAP X
Feasibility Study of Geologic Sequestration of CO2 in Basalt Formations of (Deccan
Trap) in India
X
Frio Project X
Geologic CO2 Storage Assurance at In Salah, Algeria X
IEA GHG Weyburn-Midale CO2 Monitoring and Storage Project X
ITC CO2 Capture with Chemical Solvents X
Regional Carbon Sequestration Partnerships X
Regional Opportunities for CO2 Capture and Storage in China X
Zama Acid Gas EOR, CO2 Sequestration, and Monitoring Project X
Source: CSLF 2009
2.1.2.2 Pilot and demonstration plants planned throughout Europe
The following Tab. 2-2 shows the currently known CCS demonstration projects in Europe.
With regard to quantity, England, the Netherlands and Norway are leading the way, followed
by Germany.
Fig. 2-3 also contains CCS projects that have already been dropped – the project in Tjeld-
bergodden, Norway, that was rejected for financial reasons as well as the project in Peter-
head, Scotland, which was abandoned due to a lack of prompt support by the government
(van Noorden 2007). In addition, in Australia the IGCC power plant in Perth was abandoned
due to the questionable long-term stability of the storage intended for this project. A post-
combustion plant in Cooper Basin was also scrapped, for financial reasons. In Canada, the

RECCS plus – Update and Expansion of the RECCS Study
52 Final Report
construction of a new oxyfuel power plant in Saskatchewan was abandoned. Instead, an
existing power plant will be equipped with the post-combustion process. Two recently halted
European projects – a project in Aalborg (Denmark) was abandoned due to protests by the
public and a project in Mongstadt (Norway) was also stopped for financial reasons – have not
yet been entered on the map (Wolff 2009).
Fig. 2-3 Overview of ongoing, planned and abandoned or completed CCS projects in Europe
Source: Scottish Centre for Carbon Storage, School of GeoSciences, University of Edinburgh (www.geos.ed.ac.uk/ccsmap)

Global development of CCS between 2007 and 2009
Wuppertal Institute for Climate, Environment and Energy 53
Tab. 2-2 List of known European CCS pilot and demonstration projects from the power plant sector (as of 9/2009)
Country/Location Capture
technology
Industry Power output CO2 captured Storage Players Commencement
MWel Mt/a
Bulgaria
Maritsa Pre-combustion Electricity 650 3.43 Depleted oil and gas
fields
Bulgarian Energy
Holding
not specified
Denmark
Kalundborg Post-combustion Electricity 600 3.58 Saline aquifer Dong Energy 2015
Aalborg Post-combustion Electricity 470/
(310 following retro-
fit)
1.8 Saline aquifer Vattenfall 2013, halted due
to protest
Finland
Meri Pori Oxyfuel or
post-combustion
Electricity 560 (400-450 fol-
lowing retrofit)
3.35 not specified Fortum, TVO 2015
France
Lacq plant +
Rousse Feld
Oxyfuel Electricity 30 Depleted oil and gas
fields
Total, Alstom, Air
Liquide
2010
Germany
Jänschwalde Oxyfuel and
post-combustion
Electricity 250 (oxyfuel)
<250 (post-comb.)
1.79 EGR or saline aquifer Vattenfall 2015
Wilhelmshaven Post-combustion Electricity 500 (100 captured) 0.6 Saline aquifer E.on 2015
Hürth Pre-combustion Electricity 450 2.8 Saline aquifer RWE 2015
Großkrotzenburg
Staudinger
Post-combustion Electricity 510 (net) not specified not specified E.on 2009
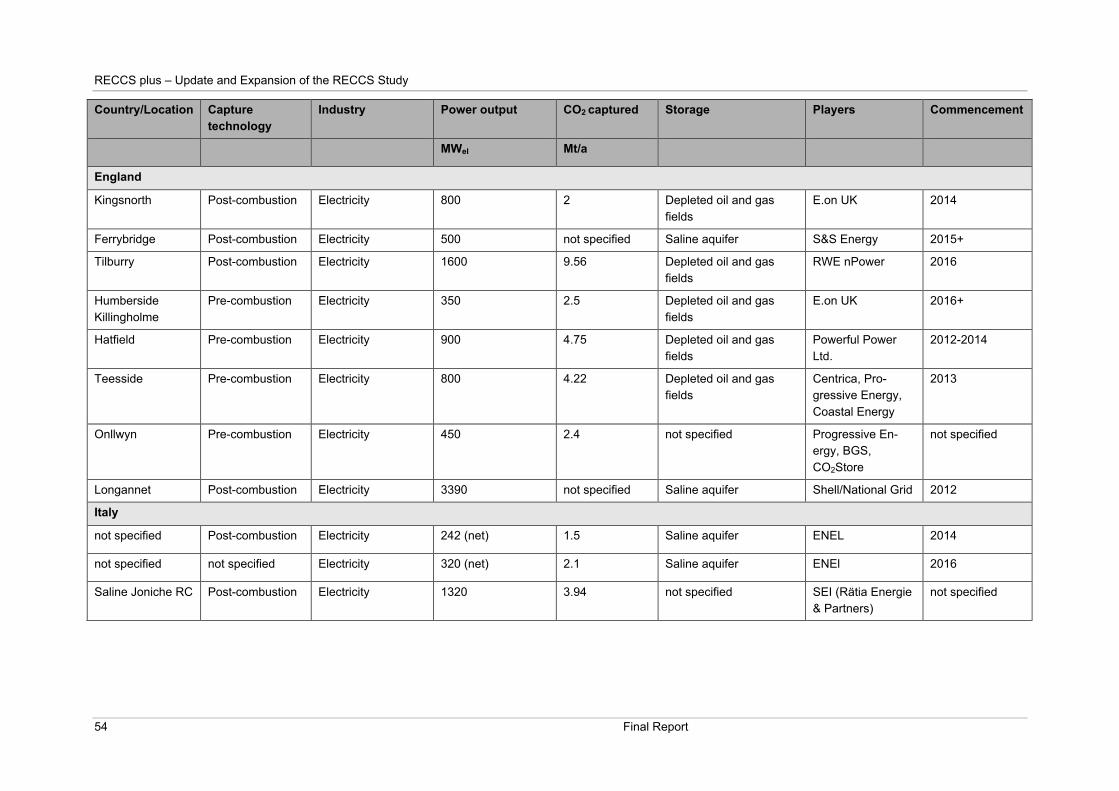
RECCS plus – Update and Expansion of the RECCS Study
54 Final Report
Country/Location Capture
technology
Industry Power output CO2 captured Storage Players Commencement
MWel Mt/a
England
Kingsnorth Post-combustion Electricity 800 2 Depleted oil and gas
fields
E.on UK 2014
Ferrybridge Post-combustion Electricity 500 not specified Saline aquifer S&S Energy 2015+
Tilburry Post-combustion Electricity 1600 9.56 Depleted oil and gas
fields
RWE nPower 2016
Humberside
Killingholme
Pre-combustion Electricity 350 2.5 Depleted oil and gas
fields
E.on UK 2016+
Hatfield Pre-combustion Electricity 900 4.75 Depleted oil and gas
fields
Powerful Power
Ltd.
2012-2014
Teesside Pre-combustion Electricity 800 4.22 Depleted oil and gas
fields
Centrica, Pro-
gressive Energy,
Coastal Energy
2013
Onllwyn Pre-combustion Electricity 450 2.4 not specified Progressive En-
ergy, BGS,
CO2Store
not specified
Longannet Post-combustion Electricity 3390 not specified Saline aquifer Shell/National Grid 2012
Italy
not specified Post-combustion Electricity 242 (net) 1.5 Saline aquifer ENEL 2014
not specified not specified Electricity 320 (net) 2.1 Saline aquifer ENEl 2016
Saline Joniche RC Post-combustion Electricity 1320 3.94 not specified SEI (Rätia Energie
& Partners)
not specified

Global development of CCS between 2007 and 2009
Wuppertal Institute for Climate, Environment and Energy 55
Country/Location Capture
technology
Industry Power output CO2 captured Storage Players Commencement
MWel Mt/a
Netherlands
Eemshaven Post-combustion Electricity 40 0.2 Depleted oil and gas
fields
RWE Power,
BASF, Linde
2015
Maasvlakte
Rotterdam
Post-combustion Electricity 1070
(100 captured)
5.6 Depleted oil and gas
fields
E.on Benelux not specified
Pistoolhaven
Rotterdam
Post-combustion Electricity 845 not specified not specified ENECO, Interna-
tional Power
2011
Eemshaven Pre-combustion Electricity 1200 4.14 Depleted oil and gas
fields
Nuon 2013
Europoort
Rotterdam
Pre-combustion Electricity 450 2.5 Depleted oil and gas
fields
CGEN NV 2014
Rotterdam Pre-combustion Electricity 1000 4 Depleted oil and gas
fields
Essent 2016
Norway
Bergen Post-combustion Electricity/refineries 280 MWel
350 MWth
1.5 Saline aquifer Statoil Hydro,
Gasnova
2014
Hammerfest Post-combustion Electricity 100 not specified Saline aquifer Hammerfest En-
ergi, Sargas, Sie-
mens
not specified
Husnes Post-combustion Electricity/other 400 2.5 Saline aquifer Tinfos, Sor-Norge,
Eranet, Sargas
not specified
Karsto Post-comb./ oil +
gas
Oil and gas 420 1.2 Saline aquifer Aker, Fluor, Mitsu-
bishi
2012
Mongstad Post- or pre-
comb.
Electricity 450 1.2 Saline aquifer BKK 2014, abandoned
for financial rea-
sons

RECCS plus – Update and Expansion of the RECCS Study
56 Final Report
Country/Location Capture
technology
Industry Power output CO2 captured Storage Players Commencement
MWel Mt/a
Haugesund not specified 400-800 not specified not specified Haugaland Kraft 2015
Poland
Warsaw Post-
comb./electricity
Electricity 480 2.87 not specified Vattenfall 2015+
Kedzierzyn
Kozlelaskie
Pre-combustion Electricity/chemical
industry
500 MWth Syngas+
250 MWel
3.4 Saline aquifer PKE/ZAK 2014
Belchatow Post-combustion Electricity 858 (1/3 CCS) 5.1 Saline aquifer PGE, ICPC, CMI,
PGI
2013
Scotland
Cockenzie Post-combustion Electricity not specified not specified Saline aquifer Scottish Power not specified
Spain
Compostilla
Leon
Oxyfuel not specified 500
(400 CCS)
not specified Saline aquifer Endesa 2015
not specified Post-combustion Electricity 800
(200 CCS)
not specified Saline aquifer Union Fenesa 2016-2017
Czech Republic
Hodonin SE Post-combustion Electricity 105 0.5 Saline aquifer SE.Power 2015
Ledvice N Post-combustion Electricity 660 3.48 Saline aquifer N.Power 2015
Source: modified from ZEP 2008, authors’ additions

Global development of CCS between 2007 and 2009
Wuppertal Institute for Climate, Environment and Energy 57
Some of the programmes and projects presented in the RECCS Report have since been
completed. A brief overview (selection) of the results is given below:
• CATO: The first phase of this Dutch research programme has been completed. CO2
sources and sinks were quantified, the costs of capturing and transporting CO2 were de-
termined and the necessary infrastructure and its optimum pipeline routes were planned.
In addition, a number of capture processes were tested in pilot plants, of which the
SEWGS process (Sorption Enhanced Water Gas Shift) proved to be very promising. The
SEWGS process can be implemented in both natural gas and coal-fired power plants,
and has lower efficiency losses than other processes. Furthermore, it is less expensive
than conventional scrubbing processes (see also Section 3.1). The follow-up programme
CATO-2 focuses on the demonstration and integration of the CCS technology chain in
the existing power plant fleet. In addition, strategic information for political and invest-
ment-related decisions is to be compiled and made available.
• GeoCapacity: This project was an expansion and update of the GESTCO project, in
which the geological storage capacities of a number of selected European countries
were investigated. One of the tasks completed in the GeoCapacity project was to pro-
vide a first conservative estimate of the storage capacity in saline aquifers in the German
North Sea (see Section 7.5.3).
• Geotechnologies: The first 3-year phase of this R&D programme initiated by the BMBF
was completed in mid 2008. Using the knowledge gained from this first phase and the
questions it raised, the second phase was designed as a further development of the first
phase (see also Section 2.1.1).
2.1.3 A glance at developments outside the EU
Activities are taking place throughout the world, but especially in the USA, Australia, China
and Japan (see Fig. 2-4). Algeria and the United Arab Emirates are also active in the field of
CCS. In the following sections, developments in the USA, Australia and China will be ana-
lysed in further detail.
2.1.3.1.1 China
General development
Due to China’s strong economic growth, there has been a vast expansion of coal-fired power
plants there. Since China has large coal reserves, which it intends to use because of the
country’s rapidly increasing demand for energy, many experts regard the use of CCS tech-
nology here as crucial in supporting global endeavours to reduce emissions.
Although the development and commercialisation of CCS is not yet China’s top political pri-
ority, the number of international and national research, development and demonstration
projects in China is increasing, especially due to the growing global awareness and concern
about climate issues. On 14 June 2007, the Chinese government published a paper entitled
“China’s Scientific & Technological Actions on Climate Change”. In it, it resolves to establish
a roadmap for the development and demonstration of CCS and to complete capacity-building
activities as well as research, development and demonstration projects (MOST et al. 2007).
Furthermore, CCS is one of the key topics in the area of “Clean Coal Technology” within the

RECCS plus – Update and Expansion of the RECCS Study
58 Final Report
863 programme of the 11th Five-Year Plan (2006-2010). The 863 programme was initiated in
1986 (86) in the month of March (3) with the aim of advancing the development of key tech-
nologies of fundamental importance to national economic development and security. Around
RMB 20 million (! 2.2 million)6 are being made available within the 863 programme from
2008 to 2010 to carry out R&D into CCS. The research focuses on CCS in combination with
IGCC power plants, since this option leads to lower efficiency losses than capturing CO2
from the flue gas of conventional coal-fired power plants (Morse et al. 2009).
Fig. 2-4 Overview of ongoing, planned and abandoned or completed CCS projects in the USA, Aus-tralia, China and Japan
Source: Scottish Centre for Carbon Storage, School of GeoSciences, University of Edinburgh (www.geos.ed.ac.uk/ccsmap)
Numerous R&D projects on the subject of CCS are currently being planned and completed in
China. Here, a distinction can be made between Chinese initiatives and international co-
operative projects.
Chinese CCS projects
PetroChina has invested around RMB 200 million (! 21.6 million) to perform enhanced oil
recovery at ten oil production stations in the Jilin oil field. In December 2005, China Huaneng
Group and seven other Chinese energy suppliers joined forces to establish the GreenGen
Corporation to develop, demonstrate and distribute CCS technology. GreenGen plans to
start capturing CO2 at a pilot plant in 2009. The process is to be tested on a 100 MW plant in
2014. These two steps are intended as preparation for constructing an IGCC power plant
with CCS in 2017. The plant, to be built at the Tianjin site, will be designed for a capacity of
400 MW (Shisen 2007). It will later be extended to 650 MW. Since the power plant will be
built close to several chemical plants, the resulting synthesis gases, waste heat, electricity
and other by-products such as hydrogen will be exploitable. It is intended to use the captured
CO2 to enhance oil recovery (EOR).
6 This and the following conversions are based on the average exchange rate of RMB (renminbi) to ! in the period from 1 January to 4 September 2009 (RMB 0.10821 = ! 1).

Global development of CCS between 2007 and 2009
Wuppertal Institute for Climate, Environment and Energy 59
Other plans are being advanced by Shenhua Group, which recently completed a large-scale
coal hydrogenation plant in Erdos, Inner Mongolia. According to Shenhua, the plant, which is
intended to produce diesel, naphtha and liquefied petroleum gas (LPG), was recently put into
operation (China Daily 2009). The hydrogen required for the hydrogenation process is re-
portedly produced using coal gasification. Shenhua is considering capturing the CO2 pro-
duced during gasification and injecting it into a nearby oil field to enhance oil recovery. It is
reported that around 3.6 million tonnes of CO2 will be captured annually (Morse et al. 2009).
International cooperative projects in the area of CCS focusing on China
In addition to the activities of Chinese players, use of CCS in China is being promoted by
bilateral or multilateral cooperative projects. The EU, Japan, the USA and Australia are par-
ticularly active in this area. Their current activities are briefly described below.
• European Union: Under the leadership of Great Britain, the EU, in collaboration with the
Chinese government, is implementing the “Near-Zero Emissions Coal Technologies”
(NZEC) project, which was initiated in 2005 at the 8th EU-China summit in Beijing. The
project comprises three work phases (Haydock 2008):
- Phase 1 (up to the end of 2009): Completion of capacity-building measures for the
assessment of potential CO2 storage sites in China and of case studies for the se-
lection of suitable technologies for CO2 capture; identification of potential CO2 stor-
age sites in China, creation of a technological and political roadmap for the devel-
opment and distribution of CCS in China. The results of Phase 1 were presented at
a workshop in China in autumn 2009.
- Phase 2 (2010/2011): Detailed design of a CCS demonstration project.
- Phase 3 (up to 2014): Construction and operation of the CCS demonstration power
plant.
In addition to NZEC, the EU is also involved in the project “COoperation Action within
CCS CHina-EU” (COACH). The aim of the project is to lay the foundation for the devel-
opment of large-scale coal-fired power plants with CCS, and to strengthen cooperation
between the EU and China in this area. Various aspects of the technology are being ex-
plored in the project. These include the assessment of various capture processes with
regard to technical, environmental and economic factors, the derivation of criteria for the
selection of potential plant sites and the identification of suitable financing mechanisms.
The results of the project are to be integrated in a roadmap for the large-scale use of
CCS in Chinese coal-fired power plants.
The “Support to Regulatory Activities for Carbon Capture and Storage” (STRACO2) pro-
ject focuses on the legal and political issues surrounding CO2 storage. It is part of the 7th
European Framework Programme, and aims to promote the development and imple-
mentation of a regulatory framework for the distribution of CCS in the EU and China.
• Japan: In May 2008, Japan and China signed an agreement to carry out a project to
capture 1–3 million tonnes of CO2 annually at the Harbin power plant in Heilongjiang
Province. The CO2 is transported along a 100 km pipeline to Daqing oil field and injected
into the oil field for EOR.

RECCS plus – Update and Expansion of the RECCS Study
60 Final Report
• USA: In 2004, the USA and China formed a bilateral working group on the subject of
climate change, which identified CCS as one of ten core topics for joint R&D projects. In
the meantime, the USA is financing a number of CCS projects in China. One of these
projects is “Building Regulatory Capacity in China – Guidelines for Safe and Effective
Carbon Capture and Storage”. In this project, the World Resources Institute and Tsing-
hua University are drawing up guidelines and best-practice examples for the implemen-
tation of CCS, and are offering capacity-building measures for policy-makers. The guide-
lines address all stages of the CCS process. Special emphasis is placed on guarantee-
ing the permanence of storage sites.
The new U.S. administration has instigated further initiatives for cooperation in the area
of CCS. In July 2009, representatives of the U.S. and Chinese governments signed a
“Memorandum of Understanding to Enhance Cooperation on Climate Change, Energy
and Environment”. In particular, the memorandum aims to enhance cooperation within
the framework of capacity-building measures, R&D projects and initiatives to spread cli-
mate-friendly technologies. A total of ten core topics are mentioned, one of which is CCS
technologies. Joint R&D projects are expected to be coordinated by the US-China Clean
Energy Research Center. The foundation of this centre was announced by the U.S. De-
partment of Energy in July 2009. CCS is one of the top-priority subjects. The centre,
which will be based in both China and the USA, is equipped with a total budget of US$
15 million (! 11 million)7 (DOE 2009a).
• Australia: In 2007, the “Australia-China Joint Coordination Group on Clean Coal Tech-
nology” (JCG) was founded to foster the development, application and transfer of coal
technologies with low greenhouse gas emissions. JCG’s budget in 2008/2009 amounted
to US$ 20 million (! 14.8 million) (Australian Coal Association 2009). The JCG is based
on previous bilateral and multilateral initiatives such as the “Asia-Pacific Partnership on
Clean Development and Climate Change”. Among others, the “China Australia Geologi-
cal Storage” (CAGS) project, which conducted a detailed assessment of potential CO2
storage sites, was produced within the partnership under the leadership of Geoscience
Australia and the Chinese Ministry of Science and Technology.
2.1.3.2 USA
Within the sub-area of coal technologies, CCS is one of the top priorities of U.S. technology
policy. The most important ongoing R&D projects in this field are the “FutureGen” and “Car-
bon Sequestration” projects. Other projects, such as the “Advanced Turbines” project, which
develops turbines for low-carbon IGCC power plants, have synergies with CCS projects. Fig.
2-5 shows that “FutureGen” and “Carbon Sequestration” received the highest allocation of
funding in the area of coal in 2008. With a total budget of almost US$ 500 million (! 369 mil-
lion), these two projects represented a share of around 40 per cent. In 2009, the R&D budget
for coal technologies was increased substantially by the “American Recovery and Reinvest-
ment Act of 2009 (Recovery Act)” to overcome the financial crisis. The U.S. government
7 This and the following conversions are based on the average exchange rate of USD to ! in the period from 1 January to 4 September 2009 (! 0.73828 = $ 1).

Global development of CCS between 2007 and 2009
Wuppertal Institute for Climate, Environment and Energy 61
made over US$ 1.3 billion (! 959.8 million) available for large-scale CCS projects (Burks et
al. 2009).
Fig. 2-5 U.S. R&D budget in the area of coal technologies (as of 2008). Total budget: approximately US$ 500 million (! 369 million)
Source: DOE 2008; Slutz 2008
The FutureGen project in particular is expected to benefit from the additional funding. Fu-
tureGen aims to build a 275 MW polygeneration plant in Mattoon, Illinois, that will produce
electricity and hydrogen through coal gasification. The project is being led by an international
consortium, in which the U.S. Department of Energy acted as the financier until recently.
Since 2008, however, the project and the role played by the ministry as financier were ques-
tioned, due to substantial increases in costs caused by internationally rising investment ex-
penditure for large-scale plants. In July 2009, the FutureGen consortium and the U.S. Minis-
try of Energy finally signed an agreement laying down further steps for the project. By the
beginning of 2010, the consortium aimed to present a provisional design of the plant, specify
its project cost estimates, put forward a financing scheme, secure further investors and, if
necessary, carry out additional tests on the subsurface. The ministry and the consortium will
decide on the continuation of the FutureGen project, based on the results of this work. Both
parties consider a continuation as the preferred solution. The financial contribution of the
U.S. government is expected to be significantly higher than in 2008, at US$ 1.073 billion (!
738.4 million). Over 90 per cent of the funding is expected to come from the “Recovery Act”.
Thus state funding for FutureGen alone would be around double the entire R&D budget for
coal technologies in 2008. The FutureGen consortium is expected to make a financial contri-
bution of US$ 1 billion (DOE 2009b).
The above-mentioned “Carbon Sequestration” project covers all phases of the CCS process,
and is subdivided into three parts:
• “Core Research & Development”: Comprising technical R&D activities in the areas of
capture, storage and monitoring the CO2 storage sites, simulation and risk assessment
of CO2 storage, as well as possibilities for CO2 exploitation. In August 2009, the U.S.
Ministry of Energy announced it would fund 19 projects to determine, assess and simu-
RECCS plus – Update and Expansion of the RECCS Study
62 Final Report
late the risks involved in underground CO2 storage. The ministry is making a total of US$
27.6 million (! 20.4 million) available for this purpose (DOE 2009c).
• “Infrastructure”: Includes “Regional Carbon Sequestration Partnerships” and other large-
scale CCS projects. The partnerships, realised in cooperation with industrial players, are
to help the identification and development of suitable technologies, necessary infrastruc-
ture measures and regulations for CCS projects in certain regions. Differing geographic
framework conditions for CO2 storage in the USA necessitate a regionally differentiated
approach. At present, there are seven regional partnerships involving 43 U.S. federal
states and over 350 authorities, universities and enterprises (NETL 2009).
• “International Cooperations”: In this area, international cooperations and networks are
funded to further CCS, e.g. the Carbon Sequestration Leadership Forum (CSLF), fi-
nanced by the Ministry of Energy, the Asian-Pacific Partnership and support for other in-
ternational demonstration projects.
In addition to R&D projects, the U.S. government is endeavouring to develop a legal frame-
work for CO2 storage in geological storage sites. In the process, considerations are given to
integrate the special demands of CO2 storage in the existing regulation regime, e.g. in the
“Underground Injection Control Program” (UIC). Moreover, numerous other legislative initia-
tives to regulate CO2 storage have also taken place recently (for further details, see Section
6.3.1).
2.1.3.2.1 Australia
The CCS strategy of the Australian government comprises three elements:
• Technical research and development: The government supports CCS-relevant research
projects carried out by the “Commonwealth Scientific and Industrial Research Organisa-
tion” (CSRIO) and by “Geoscience Australia”. It also finances two research institutions
that focus particularly on CCS, namely: the “Cooperative Research Centre for Green-
house Gas Technologies” (CO2CRC) and the “Cooperative Research Centre for Coal in
Sustainable Development” (CCSD). Sixteen CCS projects are currently being planned or
completed in Australia. Of these, eleven projects deal with CO2 capture and five with
CO2 storage. Fig. 2-6 shows the geographical distribution and status of the projects. The
“CO2CRC Otway Project” is the Australian government’s most advanced R&D initiative.
Since April 2008, 150 tonnes of CO2 per day have been pumped into a depleted gas
field at a depth of up to 2 km. A total of 50,000 to 100,000 tonnes of CO2 are to be in-
jected within the space of two years. The project, which comprises a comprehensive
programme for monitoring the storage sites, is worth some $A 40 million (! 21.8 mil-
lion)8. It is being realised by a consortium made up of 15 enterprises and seven gov-
ernment agencies (CO2CRC 2009).
8 This and the following conversions are based on the average exchange rate of $A to ! in the period from 1 January to 4 September 2009 (! 0.54559 = A$ 1).

Global development of CCS between 2007 and 2009
Wuppertal Institute for Climate, Environment and Energy 63
Fig. 2-6 Planned and existing CCS projects in Australia
Source: CO2CRC 2009
• Development of a legal framework and of monitoring standards: The government intends
to develop a legal framework for CO2 capture and storage, as well as standards for
monitoring storage sites in cooperation with industrial enterprises and regional gov-
ernments (for further details, see Section 6.3.2).
• Enhancement of and participation in international CCS activities: In the third element of
its CCS strategy, the Australian government supports international initiatives to spread
CCS technology. Such initiatives include the “Asia-Pacific Partnership on Clean Devel-
opment and Climate” and the CSLF. Furthermore, the Australian government advocates
the stronger integration of technology in the UN Framework Convention on Climate
Change, and is in favour of its inclusion in the Clean Development Mechanism (CDM).
2.1.4 International negotiations on considering CCS under the Clean Development
Mechanism (CDM)
In recent years, the integration of CCS in the Clean Development Mechanism (CDM) has
evolved into a highly contentious issue in international climate negotiations. The CDM en-
ables industrialised countries to fulfil some of their obligations to reduce greenhouse gases in
developing countries. The projects aim to make a contribution to sustainable development in
developing countries, and must be carried out in addition to reduction measures already
taken.
Compared with emissions in the project case, the reduction of emissions is determined using
a reference scenario (also called a baseline). According to a specified procedure to validate
and certify the reduction of emissions, corresponding emission permits – called “Certified
Emission Reductions” (CER) in the case of CDM – are generated. A prerequisite for valida-
tion is a methodology for determining the reference scenario that has been approved by the
Executive Board (EB) of the CDM.

RECCS plus – Update and Expansion of the RECCS Study
64 Final Report
Approval of CCS projects under the umbrella of the CDM was initially discussed in 2005
within the international climate negotiations, since three proposals for calculating reference
scenarios and monitoring CCS projects had previously been submitted to the EB of the CDM.
However, none of the submitted methodologies were approved because they failed to pro-
vide sufficient precision on methodological and accounting issues involving CCS projects.
At the Conference of the Parties (COP) and the 1st Conference of the Parties of the Kyoto
Protocol (MOP) in Montreal in December 2005, the Parties to the Kyoto Protocol were re-
quested to produce statements on the subject. In the ensuing years, further consultations
were held with all interested parties and organisations on the topic of CCS-CDM. At the
COP/MOP 2 in Nairobi at the end of 2006, the EU, Canada, China, Japan, South Africa and
in particular the OPEC countries voted in favour of considering CCS under the CDM. The
groups of the Least Developed Countries (LDCs), the Alliance of Small Island States
(AOSIS) and Argentina, Brazil and Venezuela positioned themselves against such meas-
ures. The Parties agreed on a two-year negotiation process under the umbrella of the Sub-
sidiary Body for Scientific and Technology Advice (SBSTA), in order to be able to make a
decision at the COP/MOP 4 (Watanabe et al. 2007).
However, the agreed negotiation process did not lead to any conclusive result. At the Climate
Conference in Pozna" in December 2008, two proposals – one that supported considering
CCS under the CDM and another that opposed it – for a resolution by the Plenum were re-
jected. The Parties then requested the EB of the CDM to undertake an assessment of the
impact of including CCS in the CDM. At a meeting of the SBSTA in June 2009, the positions
of CCS opponents and proponents were again shown to have hardened. While Canada,
Australia, Kuwait and Nigeria were in favour of considering CCS under the CDM, Argentina,
Brazil and Venezuela were opposed to it (Treber 2009). The points of contention in the nego-
tiations are not only basic questions on the suitability of CCS as a technology to reduce
greenhouse gases but also complex methodological and legal problems. De Coninck (2008)
summarises the basic points of contention as follows:
• Market readiness of CCS: Those who oppose the use of CCS under the CDM argue that
CCS has not yet achieved full market readiness and that the technology should not yet
be funded within the flexible mechanisms. Proponents, on the other hand, focus on a
learning-by-doing effect based on a strict body of rules and regulations because it could
accelerate the technological development of CCS.
• CCS should first be developed and tested in industrialised countries: CCS opponents
are afraid that offsetting a reduction in emissions through CCS under the CDM would of-
fer an incentive to exploit developing countries as a test area for technology that may be
unsafe. CCS proponents argue that it would give developing countries the opportunity to
become important market players in the development and sale of the technologies in-
volved.
• CCS projects might displace other CDM projects: Opponents are afraid that a large
number of CCS projects would lead to a reduction in the market price for CERs. Brazil,
one of the strongest opponents of considering CCS projects in the CDM, is still worried
that its share of the CER market would fall as a result of including CCS projects because
it has only little potential for the use of CCS, due to the high proportion of hydropower in
its energy mix. On the other hand, it is pointed out that there would only be an incentive
Global development of CCS between 2007 and 2009
Wuppertal Institute for Climate, Environment and Energy 65
for the use of the technology in the case of high allowance prices, owing to the high
costs of CCS.
• Technologies for the enhanced recovery of hydrocarbons do not contribute to a reduc-
tion in greenhouse gases: CCS opponents argue that the approval of “enhanced oil re-
covery” (EOR) projects in which CO2 is injected in the storage site to raise the oil produc-
tion rate would lead to an increased consumption of oil, and therefore an increase in
greenhouse gas emissions (as Luhmann also analysed in 2009). Proponents of CCS
projects in the CDM counter that the additional volume of oil produced through EOR
would also be used without incentives for CCS.
• CCS would make the framework conditions for renewable CDM projects more difficult:
CCS opponents call for priority to be given to renewables in the reduction of greenhouse
gas emissions. CCS proponents argue that the possibility of offsetting CCS projects un-
der the CDM could encourage the Parties to adopt more ambitious targets to reduce
greenhouse gases.
Referring to methodological aspects, the following issues are primarily discussed:
• Project boundaries: CCS technologies comprise several activities – capture, transport
and storage. There is broad consensus between the Parties that all activities should be
included in the CDM. However, it is not clear how to proceed if activities are carried out
in countries with different statuses, i.e. if capture takes place in an Annex I country and
storage in a non-Annex I country.
• Offsetting additionally caused emissions (“carbon leakage”): The term “carbon leakage”
describes the offsetting of additional emissions caused within a CCS project. It was dis-
cussed between the Parties whether and how, for instance, emissions resulting from the
increased coal requirements of a power plant due to efficiency losses in CO2 capture
could be offset. A second possible case would be to offset emissions resulting from the
use of oil produced additionally through EOR in a CCS-CDM project.9
• Permanence: This aspect relates to the possibility that CO2 could leak from the storage
site after allowances for the achieved CO2 reduction have been awarded. In order to
guarantee a low degree of leakage of CO2 and to be able to quantify leaked emissions,
the Parties discussed guidelines for the selection and monitoring of storage sites. How-
ever, the duration of monitoring and how it is to be financed have not yet been stipu-
lated. Moreover, it needs to be clarified how leaked emissions are to be offset.
2.2 Measures to reduce CO2 in other branches of industry
Apart from CO2 emitters from the area of power and heat generation, there are other sectors
that release large quantities of CO2 into the atmosphere. These branches would also be po-
tentially suitable for capturing and storing this climate-changing gas. German industry, for
9 In general, “carbon leakage” means the increase in emissions due to the displacement of industrial produc-
tion (and hence emissions) from industrialised countries to those where no or fewer climate protection re-strictions apply. This would lead to a decline in turnover and employment in the countries of origin. The in-itially lower emissions are then juxtaposed to higher emissions abroad (see http://www.co2-handel.de/article306_10147.html).

RECCS plus – Update and Expansion of the RECCS Study
66 Final Report
instance, which emits 160.7 million tonnes or 18.2 per cent of Germany’s total CO2 emis-
sions (884.1 million tonnes of CO2), is the country’s third largest producer of CO2 emissions
after the energy industry (382.3 million tonnes of CO2 = 43.2 per cent) and transport (167.4
million tonnes of CO2 = 18.9 per cent) (DIW 2006). A CO2 capture potential of 28 million ton-
nes per annum of large-scale industrial point sources was estimated for North Rhine-
Westphalia, which corresponds to around 16 per cent of the total quantities of CO2 that can
be captured in NRW (WI 2009).
Tab. 2-3 List of known European CCS pilot and demonstration projects from other branches of in-dustry (as of 9/2009)
Country/
Location
Capture technology
/branch of industry
Power
output
CO2
captured
Storage Players Com-
mence
ment
MWel Mt/a
France/
Florange
Post-
combustion/steel
not
specified
not
specified
Saline aquifer ArcelorMittal not
speci-
fied
Germany/
Eisenhütten-
stadt
Post-
combustion/steel
not
specified
not
specified
Saline aquifer ArcelorMittal not
speci-
fied
Netherlands/
Barendrecht +
Pernis
H2 produc-
tion/chemical in-
dustry + refineries
not
specified
0.4 Depleted oil
and gas fields
Shell 2011
Norway/
Bergen
Post-
combustion/electricity
+ refineries
280 MWel
+350 MWth
1.5 Saline aquifer Gasnova 2014
England/
Scunthorpe
Post-combustion/
steel
not
specified
not speci-
fied
Depleted oil
and gas fields
Corus/Tata
Steel
not
speci-
fied
Norway/
Husnes
Post-
combustion/other
400 2.5 Saline aquifer Tinfos, Sor-
Norge, Era-
net, Sargas
not
speci-
fied
Norway/
Karsto
Post-combustion/oil +
gas refineries
420 1.2 Saline aquifer Aker, Fluor,
Mitsubishi
2012
Poland/
Kedzierzyn
Kozle, Slaskie
Pre-combustion/
electricity +chemical
industry
500 MWth
syngas+
250 MWel
3.4 Saline aquifer PKE/ZAK 2014
Source: ZEP 2008 and authors’ additions
Activities in other branches of industry (see Tab. 2-3) to reduce CO2 emissions are primarily
conducted in the steel industry. The EU-funded ULCOS programme (Ultra Low CO2 Steel-
making) is an ambitious R&D programme to reduce process-related CO2 emissions in the
production of steel. The programme is currently in Phase II, in which several new steel pro-
duction processes are being tested in pilot projects to examine the medium- to long-term
most promising technologies on an industrial scale. The first technology to be evaluated on
an industrial scale is based on blast furnace technology, including top gas recycling (TGR-

Global development of CCS between 2007 and 2009
Wuppertal Institute for Climate, Environment and Energy 67
BF) and CCS. The ULCOS programme is supported by a consortium of 48 European part-
ners10.
The cement industry is also undertaking a long-term CCS research project via the European
Cement Research Academy (ECRA). In the first phase, suitable capture processes for the
clinker burning process were investigated. Oxyfuel and the post-combustion process via ab-
sorption were found to be particularly suitable. In the second phase, detailed technical and
economic tests are being carried out for these two processes (ECRA 2007). Another project,
being implemented by Associated Cement Companies Ltd. (ACC), aims to explore the use of
biomass to fire kilns. In a special bioreactor, the CO2 arising from the combustion process
shall be used to produce oleiferous algae (Suri 2007).
In general, however, many other measures, such as raising energy efficiency, using new
materials and lighter components and the increased use of secondary fuels (e.g. biomass),
are being taken in “CO2-intensive” branches of industry to reduce CO2 emissions. (Schäfer
2009) mentions a number of examples of measures already taken in the cement industry to
reduce CO2 emissions:
• modernisation of existing furnaces
• substitution of old plants for new plants
• change to fuels that produce less carbon dioxide or (proportionately) biogenic fuels
• partial substitution of limestone by already calcined secondary raw materials
• replacement of cement clinkers by other main cement constituents.
Until now, no estimate has been made of the CCS potential for industrial point sources in
Germany. However, CCS might possibly be necessary, since the CO2 emissions from this
sector, unlike the power and heat sectors, could not be completely avoided using efficiency
measures and renewable energies. Against this backdrop, the German Advisory Council on
the Environment calls for CCS at industrial point sources to have a higher priority over CCS
in the power plant sector in the event of the construction of a CCS infrastructure (SRU
2009b).
2.3 Global networks
The most important CCS networks are briefly described below:
• CO2Net was initiated by the 5th Framework Programme on Research and Development
(FP) of the EU. It was set up in 2006 and is likely to be continued up to 2011. The net-
work consists of a consortium of 30 large companies and organisations, mainly from the
EU, but also from the USA and Australia. It focuses on combining the expertise from all
CCS-relevant branches of industry, thus driving forward the advancement of the tech-
nology along the entire CCS chain.
• Thirteen geological institutes from seven European countries cooperate in CO2Geonet to
gain more detailed knowledge of geological deep structures in the area of geological
10 For information on the ULCOS programme see also http://www.ulcos.org.

RECCS plus – Update and Expansion of the RECCS Study
68 Final Report
storage. This way, more precise information on storage capacity, storage site risks and
recommendations on monitoring processes can be given.
• There is a very dedicated national network in the German Federal State of North-Rhine
Westphalia (NRW): this is where the Kompetenz-Netzwerk Kraftwerkstechnik (Power
Plant Technology Competence Network) was founded in 2005. Power plant builders,
operators, suppliers, parts manufacturers, academia and research, the Energy Agency
NRW (at that time the NRW State Initiative on Future Energies) and the Research and
Energy Ministries of NRW are involved in this network. The aim of this network is to pool
and coordinate the players’ activities, and to act as an interface between business, aca-
demia and politics. At the same time, the network acts as an advisory body for the state
government of NRW, and intends to initiate specific projects.
The competence network is part of the field of power plant and network technology of
the Energy Agency NRW. It consists of a high-ranking steering committee and subject-
specific working groups that deal with specific issues, topics and projects. The two
themes dealt with to date are
- Advanced power plant technologies (700 degree power plant),
- Options for future energy supply (low-carbon power plant).
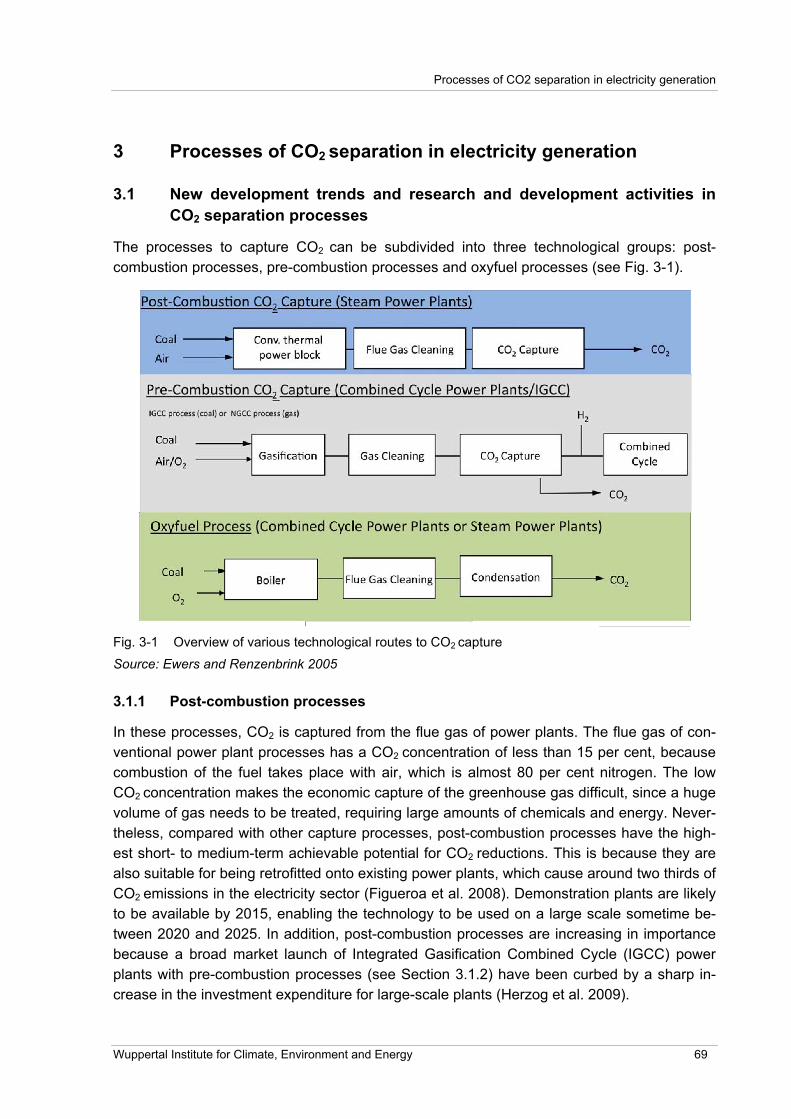
Processes of CO2 separation in electricity generation
Wuppertal Institute for Climate, Environment and Energy 69
3 Processes of CO2 separation in electricity generation
3.1 New development trends and research and development activities in
CO2 separation processes
The processes to capture CO2 can be subdivided into three technological groups: post-
combustion processes, pre-combustion processes and oxyfuel processes (see Fig. 3-1).
Fig. 3-1 Overview of various technological routes to CO2 capture
Source: Ewers and Renzenbrink 2005
3.1.1 Post-combustion processes
In these processes, CO2 is captured from the flue gas of power plants. The flue gas of con-
ventional power plant processes has a CO2 concentration of less than 15 per cent, because
combustion of the fuel takes place with air, which is almost 80 per cent nitrogen. The low
CO2 concentration makes the economic capture of the greenhouse gas difficult, since a huge
volume of gas needs to be treated, requiring large amounts of chemicals and energy. Never-
theless, compared with other capture processes, post-combustion processes have the high-
est short- to medium-term achievable potential for CO2 reductions. This is because they are
also suitable for being retrofitted onto existing power plants, which cause around two thirds of
CO2 emissions in the electricity sector (Figueroa et al. 2008). Demonstration plants are likely
to be available by 2015, enabling the technology to be used on a large scale sometime be-
tween 2020 and 2025. In addition, post-combustion processes are increasing in importance
because a broad market launch of Integrated Gasification Combined Cycle (IGCC) power
plants with pre-combustion processes (see Section 3.1.2) have been curbed by a sharp in-
crease in the investment expenditure for large-scale plants (Herzog et al. 2009).

RECCS plus – Update and Expansion of the RECCS Study
70 Final Report
Post-combustion processes are the most developed technological path to CO2 capture, be-
cause similar scrubbing processes are already in use in other branches of industry. Some of
the leading suppliers include Mitsubishi Heavy Industries (MHI; Japan), Cansolv (Canada),
Fluor (USA), HTC Purenergy (Canada) and Aker Clean Carbon (Norway). Various techno-
logical paths are pursued within the category of post-combustion processes (see Tab. 3-1 for
a detailed characterisation):
• Absorption process: The flue gas reacts with a solvent that absorbs CO2. This group
includes the most developed and common capture processes, such as amine gas treat-
ing, in particular. Monoethanolamine (MEA) is one of the preferred amine solutions.
However, MEA is a relatively powerful solution that bonds strongly with CO2, causing its
regeneration to involve high energy use. For this reason, many current R&D projects are
concentrating on searching for alternative or modified solvents. For instance, attempts
are being made to increase their reactivity by modifying the molecular geometry of
amine solvents (“hindered amines”) or a combination of various solvents (“blended sol-
vents”).
• Adsorption process: CO2 is not absorbed by the solvent but is attached to its surface.
There is no chemical reaction between the CO2 and the solvent. At present, work is be-
ing carried out on adsorption processes that use zeolitic or metal-organic substances to
bond the CO2. The former have a very high CO2 selectivity, but a low capture capacity.
The latter have a high adsorption capacity, but it is not sure how resistant it is to impuri-
ties in the flue gas.
• Membrane process: This process is an alternative and medium- to long-term option.
Membranes are semi-permeable separating layers used to separate mixtures of sub-
stances, such as flue gas. They are already used commercially in a range of industries.
Their use in CO2 capture is still at a relatively early stage of development. Membranes
have the advantage that impurities are removed by separating the flue gas prior to the
capture process, reducing the consumption of the solvent. However, existing membrane
technologies have a low level of technological maturity, and are not yet an economical
option. For this reason, one area that current R&D projects are investigating is to im-
prove the economic efficiency of the technology.
• Biological capture processes: These processes will also only be available on a large
scale in the medium to long term. They use natural organisms, such as algae or en-
zymes, to bond the CO2. Algae-based capture processes are currently being pursued
with great interest in the USA, since CO2 is being converted into biomass, which can be
utilised as energy. German energy suppliers such as RWE and E.On and the Swedish
state-owned enterprise Vattenfall are also working on similar projects. Until now, how-
ever, such capture processes have only been tested in pilot or laboratory settings. Also,
algae cultivation in open ponds may require large areas of land. For this reason, inten-
sive work on the development of closed reactors for algae cultivation is being conducted.
In Germany, E.On in particular is concentrating on developing post-combustion technology.
E.On has a total of seven pilot projects which are either in the planning stages or are oper-
ational. In these projects, the company is cooperating with leading suppliers of scrubbing
processes, plant builders and research institutions (E.On 2009):

Processes of CO2 separation in electricity generation
Wuppertal Institute for Climate, Environment and Energy 71
• Pilot plant Karlshamn (Sweden): Since spring 2009, E.On, in cooperation with Alstom,
has been operating a pilot plant based on a scrubbing process with chilled ammonia.
Thirty tonnes of CO2 are to be separated daily.
• CATO pilot plant Maasvlakte (Netherlands): Up to the end of 2008, a scrubbing process
based on amino acid salts was tested at the E.On site Maasvlakte in cooperation with
the Dutch research foundation TNO. Further operation of the pilot plant is being carried
out within the CATO follow-up project CATO-2.
• Pilot plant with Hitachi Power Europe and Electralabel: Construction of a plant for the
identification of a new, optimised solvent. The plant is designed to treat a maximum of
5,000 m3 flue gas per hour. It should be operational for four years.
• Pilot plant with Cansolv Technologies: The capture process of the Canadian technology
company is to be used here for the first time in Europe. In a two- to three-year test
phase, it is intended to operate the plant with a flue gas volume of 20,000 m3 per hour.
• Pilot plant Staudinger (Germany): Construction of a pilot plant within a research project
together with Siemens, in which a new solvent for CO2 capture is to be developed. The
pilot plant went into operation in mid-September 2009.
• Pilot plant Wilhelmshaven (Germany): Optimisation of Fluor’s capture technology
(Ecoamine FG+). A pilot plant is expected to be operational in 2010 at the power plant
site in Wilhelmshaven. The cost of the project amounts to approximately ! 10 million.
• Pilot plant with Mitsubishi Heavy Industries (Germany): The plant is to be put into oper-
ation in 2010/11 at a power plant site yet to be determined. The latest capture processes
by Mitsubishi Heavy Industries will be used in combination with advanced solvents. The
plant is designed for 20,000 m3 flue gas per hour.
Simultaneously with the pilot projects listed above, E.On is working in cooperation with
higher education institutions and research institutions in Europe and North America to de-
velop and enhance scrubbing detergents and scrubbing processes.
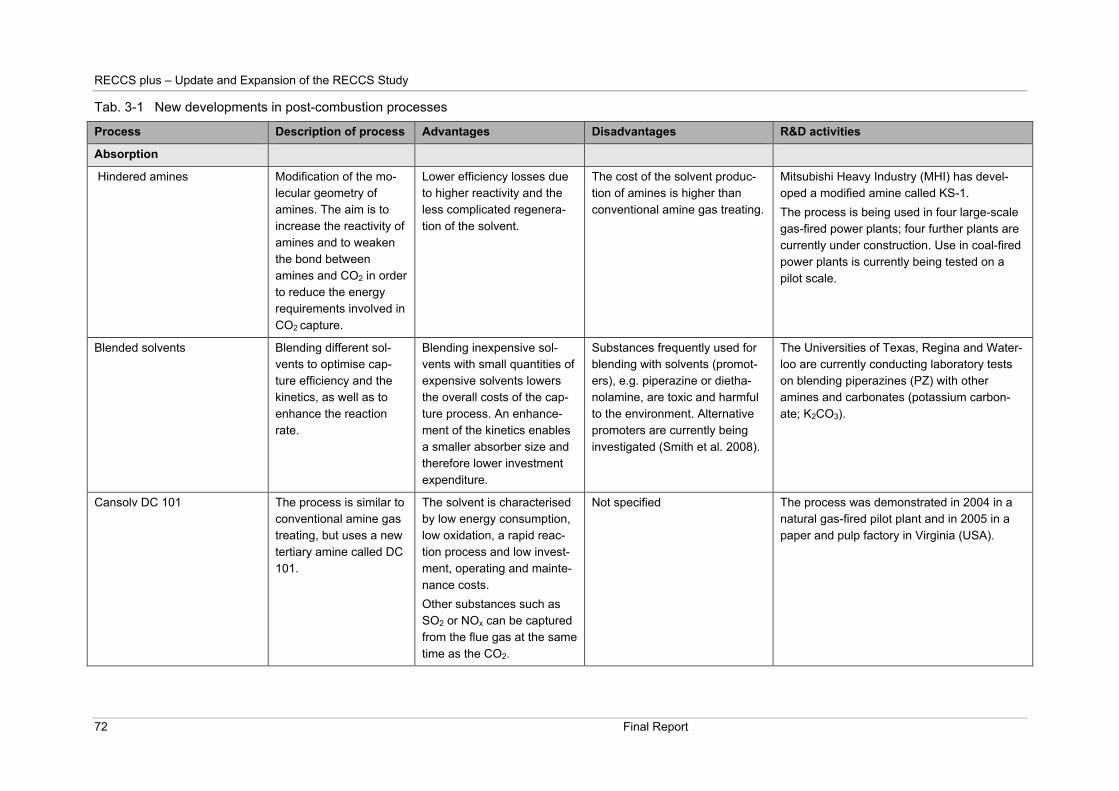
RECCS plus – Update and Expansion of the RECCS Study
72 Final Report
Tab. 3-1 New developments in post-combustion processes
Process Description of process Advantages Disadvantages R&D activities
Absorption
Hindered amines Modification of the mo-
lecular geometry of
amines. The aim is to
increase the reactivity of
amines and to weaken
the bond between
amines and CO2 in order
to reduce the energy
requirements involved in
CO2 capture.
Lower efficiency losses due
to higher reactivity and the
less complicated regenera-
tion of the solvent.
The cost of the solvent produc-
tion of amines is higher than
conventional amine gas treating.
Mitsubishi Heavy Industry (MHI) has devel-
oped a modified amine called KS-1.
The process is being used in four large-scale
gas-fired power plants; four further plants are
currently under construction. Use in coal-fired
power plants is currently being tested on a
pilot scale.
Blended solvents Blending different sol-
vents to optimise cap-
ture efficiency and the
kinetics, as well as to
enhance the reaction
rate.
Blending inexpensive sol-
vents with small quantities of
expensive solvents lowers
the overall costs of the cap-
ture process. An enhance-
ment of the kinetics enables
a smaller absorber size and
therefore lower investment
expenditure.
Substances frequently used for
blending with solvents (promot-
ers), e.g. piperazine or dietha-
nolamine, are toxic and harmful
to the environment. Alternative
promoters are currently being
investigated (Smith et al. 2008).
The Universities of Texas, Regina and Water-
loo are currently conducting laboratory tests
on blending piperazines (PZ) with other
amines and carbonates (potassium carbon-
ate; K2CO3).
Cansolv DC 101 The process is similar to
conventional amine gas
treating, but uses a new
tertiary amine called DC
101.
The solvent is characterised
by low energy consumption,
low oxidation, a rapid reac-
tion process and low invest-
ment, operating and mainte-
nance costs.
Other substances such as
SO2 or NOx can be captured
from the flue gas at the same
time as the CO2.
Not specified The process was demonstrated in 2004 in a
natural gas-fired pilot plant and in 2005 in a
paper and pulp factory in Virginia (USA).

Processes of CO2 separation in electricity generation
Wuppertal Institute for Climate, Environment and Energy 73
Process Description of process Advantages Disadvantages R&D activities
Chilled ammonia Ammonium carbonate,
which reacts with CO2 to
form ammonium bicar-
bonate, is used as the
solvent in place of
amines. After separation
of the pure CO2 stream,
the residual bicarbonate
is converted into car-
bonate. Prior to the
capture process, the flue
gas is cooled to a tem-
perature of 0–10°C in
order to prevent the
toxic ammonia from
escaping and to achieve
a high capture level.
Considerably lower energy
intensity than conventional
amine gas treating.
Risk of the escape of toxic
emissions of ammonia.
The process was originally developed by
Nexant, and is being licensed by Alstom.
The process is being tested by American
Electric Power (AEP) in a power plant in New
Haven, West Virginia, and by E.On in a pilot
plant in Karlshamn, Sweden (E.On 2009).
Dry regenerable sorbents A variety of solids can
be used to absorb and
then release CO2.
The Research Triangle
Institute (RTI) is devel-
oping a capture process
on the basis of sodium
carbonate (Na2CO3),
which reacts with water
and CO2 to form sodium
bicarbonate (NaHCO3).
Suitable for retrofitting exist-
ing plants.
Capture rates of over 90%
are possible.
Lower capital costs and
energy requirement than
conventional amine gas
treating.
Solid solvents are more difficult
to handle than fluid solvents.
The reaction rate between CO2
and NaCO2 is very high and
creates considerable heat,
which is why an efficient transfer
and process integration of the
heat is required.
So far, no CO2 capture pro-
cesses have been employed
large-scale on the basis of solid
solvents.
RTI started to carry out tests on the process
in 2002. Several solvents and reactor designs
have been tested.
Ionic liquids Organic salts are used
as CO2 solvents in a
liquid, ionic state under
Due to the weak bond be-
tween the salts and the CO2,
the regeneration of the sol-
The salts that, to our current
knowledge, are most suitable for
CO2 capture have so far only
The process is being researched at the Uni-
versity of Notre Dame, Indiana, in cooperation
with experts from the U.S. NETL (National

RECCS plus – Update and Expansion of the RECCS Study
74 Final Report
Process Description of process Advantages Disadvantages R&D activities
ambient conditions. The
salts capture the CO2
from the flue gas
through a weak ionic
bond.
vent requires relatively little
energy.
High thermal stability of the
salts at temperatures of
>200°C (Anderson et al.
2007).
The salts are also suitable
for capturing SO2.
been produced in small quanti-
ties and at high cost.
Unlike conventional solvents,
the salts have a high level of
viscosity. This can lead to higher
energy intensity within the pro-
cess. Further research is re-
quired into this matter.
Energy Technology Laboratory). The proper-
ties of various salts and their use in combina-
tion with membranes is being investigated.
Carbonate looping The CO2 contained in
flue gas reacts in a car-
bonator with burnt lime
(CaO) to form limestone
(CaCO3). The CO2 is
then leached out of the
limestone at tempera-
tures of 850–920°C in a
regenerator, leaving
behind burnt lime (CaO).
The CaO can be used
for another reaction with
CO2.
The process can be retrofit-
ted onto existing power
plants.
The extracted lime can then
be used in processes for the
desulphurisation of flue gas.
Additional heat is formed in
the reaction of CaO and CO2
that can be used to dry the
fuel or produce steam, for
instance.
After carrying out several reac-
tion runs, the absorption ca-
pacity of the CaCO3 decreases
successively due to increasing
solidification resulting from heat-
ing during the process. Fresh
CaCO3 must constantly be
added to ensure a continuously
high capture rate.
Leaching out CO2 from the lime-
stone is an endothermic reaction
during which heat must be sup-
plied. The heat is preferably
produced by combusting coal
with oxygen, since combustion
with air reduces the concentra-
tion of the CO2 stream. Around
one third of the coal supply is
used in the process due to the
high energy intensity of O2 pro-
duction.
An experimental field on a 1 MWth scale is
currently being established at Darmstadt
University of Technology to carry out tests on
the technological realisation of the process
(Epple et al. 2008).
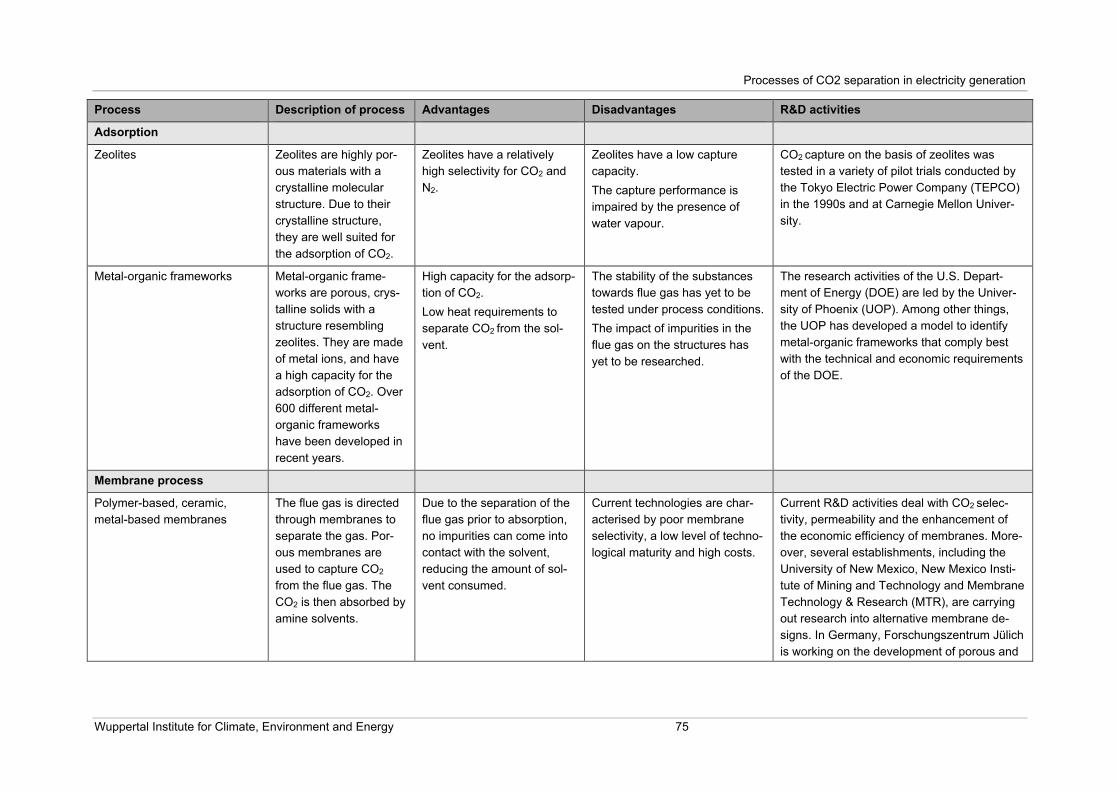
Processes of CO2 separation in electricity generation
Wuppertal Institute for Climate, Environment and Energy 75
Process Description of process Advantages Disadvantages R&D activities
Adsorption
Zeolites Zeolites are highly por-
ous materials with a
crystalline molecular
structure. Due to their
crystalline structure,
they are well suited for
the adsorption of CO2.
Zeolites have a relatively
high selectivity for CO2 and
N2.
Zeolites have a low capture
capacity.
The capture performance is
impaired by the presence of
water vapour.
CO2 capture on the basis of zeolites was
tested in a variety of pilot trials conducted by
the Tokyo Electric Power Company (TEPCO)
in the 1990s and at Carnegie Mellon Univer-
sity.
Metal-organic frameworks Metal-organic frame-
works are porous, crys-
talline solids with a
structure resembling
zeolites. They are made
of metal ions, and have
a high capacity for the
adsorption of CO2. Over
600 different metal-
organic frameworks
have been developed in
recent years.
High capacity for the adsorp-
tion of CO2.
Low heat requirements to
separate CO2 from the sol-
vent.
The stability of the substances
towards flue gas has yet to be
tested under process conditions.
The impact of impurities in the
flue gas on the structures has
yet to be researched.
The research activities of the U.S. Depart-
ment of Energy (DOE) are led by the Univer-
sity of Phoenix (UOP). Among other things,
the UOP has developed a model to identify
metal-organic frameworks that comply best
with the technical and economic requirements
of the DOE.
Membrane process
Polymer-based, ceramic,
metal-based membranes
The flue gas is directed
through membranes to
separate the gas. Por-
ous membranes are
used to capture CO2
from the flue gas. The
CO2 is then absorbed by
amine solvents.
Due to the separation of the
flue gas prior to absorption,
no impurities can come into
contact with the solvent,
reducing the amount of sol-
vent consumed.
Current technologies are char-
acterised by poor membrane
selectivity, a low level of techno-
logical maturity and high costs.
Current R&D activities deal with CO2 selec-
tivity, permeability and the enhancement of
the economic efficiency of membranes. More-
over, several establishments, including the
University of New Mexico, New Mexico Insti-
tute of Mining and Technology and Membrane
Technology & Research (MTR), are carrying
out research into alternative membrane de-
signs. In Germany, Forschungszentrum Jülich
is working on the development of porous and

RECCS plus – Update and Expansion of the RECCS Study
76 Final Report
Process Description of process Advantages Disadvantages R&D activities
ceramic membranes and on suitable methods
for the production of membranes.
Biological processes
Enzyme-based capture sys-
tems
The CO2 is bound by
enzymes in a biological
reactor and transformed
into bicarbonate ions.
The bicarbonate can
then be processed into
limestone, among other
things.
The CO2 is absorbed at low
temperatures. The process is
therefore considerably less
CO2-intensive than post-
combustion processes.
The process is still at an early
stage of development. Stable
operation over a longer period
and on a large scale has not yet
been tested.
The Canadian company CO2 Solution is de-
veloping and testing bacteria for the produc-
tion of suitable enzymes in cooperation with
Babcock and Wilcox.
The company Carbozyme is developing and
testing an enzyme-based capture process on
a laboratory scale.
Algae-based capture systems Algae cultures bred in
open ponds or closed
reactors are added to
the captured CO2. The
CO2 is transformed into
air by photosynthesis.
The algae reproduce
and can be processed
into biodiesel, for in-
stance.
The CO2 is transformed into
biomass, which can be used
as energy.
Open ponds for algae cultivation
are associated with high space
requirements; closed reactors
require high investments (Ras-
mussen 2008).
Very large amounts of algae are
required to bind CO2 emissions
from coal- and gas-fired power
plants.
Harvesting algae for further use
involves high energy require-
ments.
E.On has been operating a pilot plant in
Hamburg since 2008 that transforms CO2 into
a specially developed micro alga. E.On and
the City of Hamburg bear half of the costs of
the pilot plant (! 1 million) each.
In cooperation with Jacobs University Bremen
and Forschungszentrum Jülich, RWE is re-
searching algae production assisted by fertili-
sation with flue gas containing CO2.
Lausitz University of Applied Sciences (FHL)
has been commissioned by Vattenfall Europe
to develop a concept for an algae breeding
plant. The aim of the project is to build a pilot
plant at Senftenberg combined heat and
power plant on the basis of the knowledge
gained. In the process, CO2 from the flue gas
of the power plant shall be converted into
organic compounds by algae using photosyn-
thesis (Vattenfall Europe 2009c).
Two Canadian companies, Trident Explor-
ation and Menova Energy, have been devel-

Processes of CO2 separation in electricity generation
Wuppertal Institute for Climate, Environment and Energy 77
Process Description of process Advantages Disadvantages R&D activities
oping a new reactor model for algae-based
CO2 capture since 2007 (Green Car Congress
2007).
In May 2009, the company BioProcessAlgae
received US$ 2.1 million from the U.S. State
of Iowa to develop a bioreactor that uses the
CO2 emissions of an ethanol plant for algae
production.
Source: Herzog et al. 2009, Figueroa et al. 2008, EPRI 2007
RECCS plus – Update and Expansion of the RECCS Study
78 Final Report
RWE is focusing on developing the post-combustion variant as an option for retrofitting exist-
ing power plants. RWE launched a pilot plant in August 2009 to scrub CO2 at the power plant
site in Niederaußem. The plant intends to separate 300 kg of CO2 per hour and to achieve a
capture rate of 90 per cent. The project is being conducted in cooperation with Linde and
BASF (Ewers 2008), and is 40 per cent subsidised by the German Federal Ministry of Eco-
nomics and Technology. RWE has ring-fenced a budget of around ! 80 million for the entire
project (Spiegel Online 2009). In addition to the German pilot plant, RWE is involved in de-
veloping two pilot plants in the USA to capture CO2 from power plant flue gas. The plants
have capacities of 3 MWel and 20 MWel, and are being constructed under the auspices of the
Electric Power Research Institute (EPRI) and American Electric Power (AEP), respectively.
Vattenfall Europe intends to retrofit a boiler with a post-combustion process at the existing
lignite-fired power plant Jänschwalde in Lusatia. The power plant consists of two boilers with
a capacity of 250 MWel each. Initial feasibility studies have already begun. It should go into
operation in 2015 (Vattenfall Europe 2009a).
3.1.2 Pre-combustion processes
In these processes, the fuel is transformed by gasification into a synthesis gas consisting
mainly of carbon monoxide (CO), hydrogen (H2) and CO2. The proportion of CO content of
the synthesis gas is reduced in a shift reactor, creating a gas with a considerably higher CO2
concentration than in the flue gas from conventional power plants. The CO2 can be sepa-
rated with considerably less energy consumption than in post-combustion processes. Des-
pite their comparatively efficient methods of capture, pre-combustion processes have been a
lower priority for R&D recently. This is explained by the fact that the distribution of IGCC
power plant technologies has not yet extended beyond individual demonstration plants due
to the high investment expenditure involved, amongst other things. In addition, developing
countries are concentrating primarily on conventional combustion processes in the construc-
tion of new coal-fired power plants (Herzog et al. 2009). In Germany, RWE had intended to
build an IGCC power plant with CO2 capture by 2015. The anticipated gross performance of
the power plant was 450 MWel and the net performance around 330 MWel. Approximately 2.6
million tonnes of CO2 were to be captured annually (Ewers 2008). However, future plans
were halted in November 2009 (see Section 2.1.1).
Current R&D activities in the field of pre-combustion deal primarily with the development of
new physical solvents such as lithium silicate or alternative processes such as membrane
systems or chemical looping combustion (CLC). In the latter, metal oxide, rather than oxy-
gen, is used to oxidise the fuel. In this way, any direct contact between the fuel and air is
avoided in the combustion process in order to create a concentrated CO2 stream. The pro-
cess is currently being pursued by European players in particular, such as Alstom and the
Swedish Chalmers University.
Tab. 3-2 shows a detailed characterisation of various approaches of this process.

Processes of CO2 separation in electricity generation
Wuppertal Institute for Climate, Environment and Energy 79
Tab. 3-2 New developments in pre-combustion processes
Process Description of process Advantages Disadvantages Projects/licensed processes
New physical
solvents
The Research Triangle Institute (RTI) is
currently developing a solvent on the
basis of lithium silicate (Li4SiO4) to cap-
ture CO2 at high temperatures and under
high pressures.
The performance of the sol-
vent is not negatively affected
by high temperatures, pres-
sures of 0–20 bar, CO2 con-
centrations of 2–20% or im-
purities in the synthetic gas
stream.
The process has not
yet been tested on a
large scale, but such
tests are being
planned.
In 2007, RTI successfully tested the process on a labora-
tory scale. A pilot plant with a daily capture performance
of 1 tonne of CO2 should be put into operation by 2010,
followed by a large-scale demonstration plant with a cap-
ture capacity of 100 tonnes/day by 2013 (Gupta 2009).
Polymer-based
membrane
systems
The process is based on the various
permeabilities of the components of syn-
gas. Synthesis gas passes through sev-
eral polymeric membranes with various
permeabilities, enabling CO2 to be cap-
tured from the synthesis gas.
Membrane technologies do not
require any phase changes in
the process.
They involve low maintenance
costs.
The stage of devel-
opment is close to
commercialisation,
but the costs are still
very high.
The U.S. Department of Energy is financing a variety of
R&D projects on membrane processes, one of which is
the development of a liquid membrane that is stable at
high temperatures and has a high CO2 selectivity.
Chemical loop-
ing combustion
(CLC)
Metal oxides or limestone-based oxygen
carriers are used instead of oxygen to
oxidise the fuel. Direct contact between
the fuel and the air supplied for combus-
tion is therefore avoided. The resulting
combustion exhaust gases consist mainly
of CO2 and water, making it easy in the
oxyfuel process to separate the CO2
once the water has been condensed out.
The process does not require
any energy-intensive produc-
tion of oxygen in air separation
plants.
The high concentration of CO2
in the combustion exhaust gas
reduces the energy required to
capture CO2 compared to post-
combustion systems.
The process is still at
an early stage of
development, and is
currently being
tested on the pilot
scale.
So far, the process
is only suitable for
gaseous fuels. Solid
fuels such as coal
must be gasified
first.
The process was tested for over 100 operating hours in
2004 in a 10 kWth pilot plant of Chalmers University in
Göteborg.
Alstom, in cooperation with Chalmers University, is cur-
rently developing and testing a limestone-based CLC
process for new and existing coal-fired power plants
(Andrus 2009).
A 1 MWth test plant is currently being constructed at
Darmstadt University of Technology to test the technical
feasibility of CLC in coal-fired plants (Epple et al. 2008).
Various reactor concepts and oxygen carriers are being
tested within the ENCAP project to make the process
exploitable for both gaseous and solid fuels (ENCAP
2009).
Source: Authors’ design
RECCS plus – Update and Expansion of the RECCS Study
80 Final Report
3.1.3 Oxyfuel processes
In oxyfuel processes, virtually pure oxygen (over 95 per cent) is used in place of air for the
combustion of fuel. In this way, the CO2 concentration in the flue gas can be increased to 80
per cent, enabling CO2 to be captured by simply condensing it out. Oxyfuel processes are
considered to be a promising alternative to post- and pre-combustion processes, but are still
at an early stage of development. So far, virtually no reliable economic feasibility studies
have been conducted.
In Germany, Vattenfall Europe, in particular, is concentrating on the area of oxyfuel technol-
ogy. The company put the world’s first pilot plant (30 MWth) for lignite combustion with the
oxyfuel process into operation in September 2008 at the Schwarze Pumpe site in the Bran-
denburg town of Spremberg. The cost of the plant amounts to around ! 70 million (Vattenfall
Europe 2009b). In addition, Vattenfall Europe is conducting feasibility studies for the installa-
tion of a 250 MWel oxyfuel power plant at the plant site of Jänschwalde in Lusatia. The oxy-
fuel boiler will replace a conventional boiler, and will be commissioned in 2015 (Vattenfall
Europe 2009a).
Current R&D work, for example, that by Babcock & Wilcox on oxyfuel technology, explores
energy-efficient methods for producing the required oxygen. Although cryogenic air separa-
tion processes are currently being used for this purpose, they are very energy- and cost-
intensive. They make up around 33 per cent of the investment expenditure and 67 per cent
of the power demand of an oxyfuel plant (ENCAP 2009). Alternative options to oxygen pro-
duction are ceramic membrane systems and molecular sieves or the adsorption of oxygen. In
the process, the mineral perovskite, a calcium titanium oxide (CaTiO3), is used for the ad-
sorption and storage of oxygen. With the support of the U.S. Department of Energy, Linde is
currently building a suitable pilot plant with a production output of 0.7 tonnes of oxygen per
day. Linde is also exploring the cost effectiveness of the process in cooperation with Alstom.
Tab. 3-2 shows a detailed characterisation of various approaches of this process.

Processes of CO2 separation in electricity generation
Wuppertal Institute for Climate, Environment and Energy 81
Tab. 3-3 New developments in oxyfuel processes
Process Description of process Advantages Disadvantages Projects/licensed processes
Optimised processes
for cryogenic air sepa-
ration
In the oxyfuel process, pure oxygen
is used in place of air for the com-
bustion of fuel. A flue gas consisting
mainly of CO2 and water vapour is
created. The most commonly used
method to produce oxygen is cryo-
genic air separation (distillation),
whereby the oxygen is separated
from the other gas components of
air.
Unlike pre-combustion sys-
tems, oxyfuel processes can
be used in new and existing
conventional power plants.
Air separation processes are
already used on a large
scale in a variety of industrial
sectors.
Compared to post- and pre-
combustion processes, the oxy-
fuel route is still at an early stage
of development.
Air separation processes are very
cost- and energy-intensive. They
make up approximately 67% of
the power required in oxyfuel
processes, reducing the cost
effectiveness of the process.
Babcock & Wilcox is working on a cost-
effective oxyfuel process suitable for retrofitting
existing plants (Figueroa et al. 2008).
Alstom Power is working on an optimised boiler
design for combustion with pure oxygen.
In September 2008, Linde AG and Vattenfall
Europe Technology Research entered into a
technology partnership to develop oxyfuel
technology on the basis of lignite. For this
purpose, a pilot plant was put into operation in
Lusatia. Linde is providing the air separation
technology. In 2015, a 250 MWel oxyfuel dem-
onstration power plant is to be commissioned
at the Jänschwalde site in Lusatia (Vattenfall
Europe 2009b).
Intensive research is currently being under-
taken into more efficient air separation plants.
For instance, a number of industrial gas pro-
ducers are working towards optimising heat
exchangers, high-capacity compressors and
control systems (Dechema 2009).
Ceramic membrane
systems and molecular
sieves
In place of cryogenic air separation,
air is passed through ceramic mem-
branes or molecular sieves at high
temperatures (800–900°C). In the
process, oxygen is separated from
the remaining gas components of
air.
OTM technology is able to
increase the efficiency of the
oxyfuel process compared to
oxyfuel processes based on
cryogenic air separation by
4.6% (Hassel et al 2008).
The technology is at an early
stage of development and has not
yet been tested on a large scale.
The “ion transport membrane” system (ITM) by
Air Products and Chemicals is the furthest
developed method in the sense of commercial
use. This system is based on patented high-
temperature ceramic membranes. Air Products
has been operating a pilot plant since 2005;
another plant should go into operation this year
(Dechema 2009).

RECCS plus – Update and Expansion of the RECCS Study
82 Final Report
Process Description of process Advantages Disadvantages Projects/licensed processes
Praxair has also developed a transport mem-
brane system. The enterprise is currently work-
ing on integrating the individual process com-
ponents and on the fuel flexibility of the pro-
cess. The R&D activities have received US$
5.4 million in funding from the U.S. Department
of Energy (Hassel et al. 2008).
Ceramic autothermal
recovery (CAR)
Air is fed at high temperatures to a
fixed bed vessel filled with pellets
made of perovskite (CaTiO3). Oxy-
gen is absorbed and stored at the
surface of the perovskite.
The adsoption of oxygen on
perovskite takes place exo-
thermically, and therefore
requires no or little heat
input.
According to an initial cost-
efficiency analysis by Linde
and Alstom, the CAR pro-
cess is more effective and
less expensive than cryo-
genic air separation pro-
cesses (Dechema 2009).
The process is at an early stage of
development, and has not yet
been tested on a large scale.
Problems have yet to be solved
with regard to the effectiveness
and cost of perovskite, as well as
its behaviour towards impurities
(Dechema 2009).
With the assistance of the U.S. Department of
Energy, Linde has been advancing the process
in the past two years. Linde is building a pilot
plant for 0.7 tonnes of oxygen/day in order to
test the technology in collaboration with West-
ern Research Institute.
Together with Alstom Power Plant Laborato-
ries, Linde is compiling a detailed cost-
efficiency analysis for an oxyfuel plant that
uses the CAR process.
Western Research Institute (WRI) is testing the
CAR process in a pilot plant.
Source: Authors’ design

Processes of CO2 separation in electricity generation
Wuppertal Institute for Climate, Environment and Energy 83
3.2 Retrofitting power plants
3.2.1 The term “capture ready”
Retrofitting occurs when existing power plants are supplemented at a later date by a further
known component, or one that is yet to be developed, so as to be able to fulfil an additional
task without seriously restricting the function of the existing plant. “In so doing, not only un-
avoidable (but if possible limitable) restrictions of the function in the retrofitting phase (long
shut-downs can be very costly), but also those that can arise in the regular operation of the
plant after retrofitting have to be taken into consideration,” (Fischedick et al. 2006).
If the retrofit of a power plant involves capturing CO2 emissions, this can be defined as CO2
retrofitting. If possible future CO2 retrofitting is taken into consideration when power plants
are being planned and constructed, these plants are generally called “capture ready” power
plants. Such designs should at least decrease the retrofitting effort and are expected to be
more efficient than in the case of unprepared retrofitting (Fischedick et al. 2006). With plants
that are not “capture ready”, the retrofit of CO2 capture technologies leads to either higher
costs and efficiency losses or cannot be carried out due to lack of space at the plant site.
“Capture readiness” is a central focus of the EU “CCS Directive” because only such power
plants will be granted planning permission in the future (compare Section 6.1.2.6).
So far, there is no common understanding of the meaning of the term “capture ready”. The
most commonly cited definition was coined by the International Energy Agency (Irons et al.
2007). According to this definition, in order to achieve the status of “capture ready”, the fol-
lowing criteria must be met:
• Provision of space: Not only additional equipment with scrubbers, CO2 compressors,
oxygen production plants, etc. need to be taken into account; further space may also be
required for the construction of a whole additional power generation plant to compensate
for the efficiency losses that would occur in the post-combustion method.
• Identification of transport routes: This requires potential CO2 storage sites, their capaci-
ties and distances from the power plants to be identified at the preliminary stage. The
next stage would be to identify potential transport routes. If pipelines are intended, po-
tential obstacles such as securing rights of way and also projections of public reaction
must be evaluated. In the event of transportation by ship, the feasibility, safety and ac-
ceptance of on-shore buffer storage and ship loading and unloading facilities must be
assessed.
• Storage sites: The requirements for identifying and qualifying storage sites must be de-
fined by policy-makers. According to the IEA, it is conceivable, on the one hand, to sim-
ply prove the existence of a storage reservoir with sufficiently large capacity; on the
other hand, it could be necessary to carry out a detailed geological analysis and to re-
serve the option for a certain storage capacity at an early stage to avoid the intended
area being used for other purposes.
• Pre-investments: A multitude of pre-investments are listed and economically assessed
for the different capture routes. The IEA provides member countries of the Greenhouse
Gas Programme with a tool to calculate and assess pre-investments.

RECCS plus – Update and Expansion of the RECCS Study
84 Final Report
In a study by Ecofys and MVV Consulting (Graus et al. 2008), a survey of power plant opera-
tors was conducted, which investigated how many existing and planned fossil-fuel fired
power plants in the EU are “capture ready”. The study takes only gas- and coal-fired power
plants with capacities >300 MW into account. This includes approximately 260 power plants
with a total capacity of 200 GW, or 25 per cent of the European power generation capacity. A
total of 31 operators of planned gas-fired power plants or plants under construction, as well
as 16 operators of planned coal-fired power plants or plants under construction took part in
the survey. Fig. 3-2 shows the share of “capture ready” plants of the surveyed operators’
gas- and coal-fired power plants currently being planned or under construction. No informa-
tion is available on 118 planned gas-fired power plants or plants under construction and 48
coal-fired power plants currently being planned or under construction. The diagram reveals
that the majority of gas-fired power plants currently being planned or under construction are
not designed to be “capture ready”. The requirements of CCS technology have been taken
into greater consideration among the investigated coal-fired power plants (13 of the 16 power
stations). In both cases, however, the significance of the survey is limited, due to the large
number of power plants for which no information was available.
Fig. 3-2 Number of “capture-ready” and “not capture-ready” power plants recorded in a survey
Source: Based on Graus et al. 2008
In the study, power plants that met the following conditions were classified as “capture ready”
(Graus et al. 2008):
• implementation of a feasibility study for the retrofit of CO2 capture technologies,
• availability of sufficient space for the required CCS technology during the construction
and operation of the plant,
• assessment of the plant components that would require adjustment in the event of a
retrofit,
• assessment of potential pre-investments,
• evaluation of the potential storage site and a suitable transportation route to the storage
site.
The criteria applied are therefore more or less identical to the aforementioned points. Fig. 3-2
illustrates the proportion of “capture ready” power plants to such power plants unsuitable for
retrofitting. It is clear that preparations for retrofits onto coal-fired power plants are much
more advanced than those for gas-fired power plants.

Processes of CO2 separation in electricity generation
Wuppertal Institute for Climate, Environment and Energy 85
In Germany, TÜV NORD has developed “a binding catalogue of requirements for carbon
capture readiness”. The requirements for “carbon capture ready” certification are summa-
rised in the TÜV NORD Climate Change Standard TN-CC 006, and aim to offer a “clear defi-
nition of the term” (TÜV NORD CERT 2008). At present, however, these requirements have
not been agreed upon in either Germany or abroad; furthermore, certification is voluntary
since it has not yet been required by law. For this reason, certification is only related to plans
for power plants. Amongst other things, it must be proven that
• the location is generally suitable for retrofitting the power plant by 2020, and that suffi-
cient space is reserved for the refit;
• adjustments already carried out to the power plant for later retrofitting do not have a
negative impact on efficiency, and
• a site-specific concept has been presented regarding the transportation and long-term
storage of the captured CO2.
In 2008, the first two power plant plans by E.On (Wilhelmshaven and Antwerp) were awarded
the certificate (BSOZD 2008).
3.2.2 Measures for and effects of refits for CO2 capture
There are various requirements for potential retrofitting, depending on the capture process.
Tab. 3-4 summarises which individual steps have to be implemented with the various pro-
cesses.
Regardless of the chosen capture routes, the following general impacts of retrofits can be
determined:
• Efficiency: The efficiency of “capture ready” plants is generally lower than the potential
efficiency of new plants with CO2 capture. In a study for the Federal State of North
Rhine-Westphalia, an additional efficiency loss of 1-2 percentage points was assumed
with retrofits in consultation with energy suppliers (WI 2009).
• Increased investment expenditure: Retrofitting leads to increased investment expendi-
ture. However, these can be offset over a shorter period than over the total lifetime of the
power plant. CO2 retrofitting is, therefore, only practical if the plant has a sufficiently long
remaining service life.
• Retrofit phase: During the retrofit phase, the power plants must be shut down tempo-
rarily. As a result, they cannot generate any revenue during the refit.
• Additional space requirements: Space has to be provided not only on the premises of
the power plant, but also within the plant to be able to integrate the CO2 capture plants
or to make any necessary alterations. Estimates assume 50 per cent more space for
natural gas combined cycle power plants and up to 200 per cent for conventional coal-
fired power plants (Fischedick et al. 2006).

RECCS plus – Update and Expansion of the RECCS Study
86 Final Report
Tab. 3-4 Measures to be carried out in various CO2 capture processes
Post-combustion Installation of a CO2 gas scrubber
Installation of a CO2 liquefaction plant
Connections for heat extraction to regenerate the scrubbing agent
Optimisation of the cooling system
Provisions for heat recovery in CO2 capture and liquefaction
Plants to remove the liquefied CO2
Optimisation of the flue gas desulphurisation plant to minimise the SO2 content in the flue
gas
Adjustment of the pipeline system
Provisions for the power plant’s own electricity requirements
Higher thermal power requirements in the form of cooling energy
Pre-combustion *) Installation of a natural gas reformer
Installation of a CO2 gas scrubber before the gas turbine combustor
The gas turbine combustor must be retrofitted to enable H2 to be used as fuel
Installation of a CO2 liquefaction plant
Plants to remove the liquefied CO2
Oxyfuel Installation of an air separation plant
Installation of a CO2 liquefaction plant
Retrofit or replacement of the existing steam generator
Increase of the cooling capacity to enable the water to be condensed out of the exhaust
gas
It has to be guaranteed that the CO2 pipeline is highly corrosion-resistant to O2 and SO2
components in the liquefied CO2
*) Retrofitting existing natural gas combined cycle power plants
Source: Fischedick et al. 2006
A project carried out by the research association ef.Ruhr between 2007 and 2009 entitled
“Analyse zur Nachrüstung von Kohlekraftwerken mit einer CO2-Rückhaltung” (Analysis for
the retrofitting of coal power plants with CO2 capture) investigated how to plan retrofitting
coal-fired power plants with CO2 capture. The project simulated the influence of various con-
cepts of retrofitted CO2 scrubbers on the power plant operation using the example of the
“hard coal reference power plant NRW”. In addition, various approaches to separate, pre-
pare, liquefy and transport CO2 were explored. (ef.ruhr 2009)
Around the same time as this technically-oriented project, in a study (WI 2009) Wuppertal
Institute analysed which power plants would generally be suitable for CO2 retrofitting in North
Rhine-Westphalia, what impact a CCS strategy would have on the federal state’s carbon
footprint and what infrastructure would be required for transportation and storage (see also
Section 10.7).

Analysis of the options for the use of CO2
Wuppertal Institute for Climate, Environment and Energy 87
4 Analysis of the options for the use of CO2
4.1 Reuse of CO2
We will now give an overview of the possibilities for reusing CO2.
Chemical substances/hydrocarbons: Carbon dioxide is already employed as a parent sub-
stance to produce a variety of materials, ranging from the chemical raw methanol to end pro-
ducts, such as urethane, tensides and urea. Of these end products, urea has the highest
market volume. The annual global demand for urea is around 90 million tonnes. A total of
around 10 million tonnes of inorganic and organic carbonates are required annually. Polyure-
thane also has a market volume of 10 million tonnes (IPCC 2005). Putting these figures into
proportion, however, the CO2 energy-related emissions alone were 31 billion tonnes world-
wide and 790 million tonnes in Germany (BMWI 2008b).
Technical aids: Carbon dioxide is also used as a technical aid in dry cleaning, fire extin-
guishers, aerosol cans and cooling devices, along with other applications. This potential
could be replaced at very short notice by CO2 captured from carbon-emitting power plants or
other CO2-emitting industrial facilities. Compared with the quantity of CO2 created from
power plant processes, however, the market potential is tiny. In addition, the majority of
these processes are brief since the CO2 is released again very quickly. According to (IPCC
2005), the worldwide demand for the technical use of CO2 is around 10 million tonnes.
Food: In the food industry, CO2 is mainly used as carbon dioxide gas in beverages and to
neutralise water. In terms of volume, the possibility of substituting CO2 used in this industry
with captured CO2 is virtually negligible. The purity requirements and binding periods are
also reasons for this not being pursued. The advantage of these approaches, however, is
that the natural underground occurrence of CO2 is not tapped, avoiding unnecessary addi-
tional emissions. Around 8 million tonnes of CO2 are used worldwide in the food industry
each year (IPCC 2005).
Fig. 4-1 shows the possibilities of recycling CO2, and Tab. 4-1 summarises the current global
industrial applications of CO2. This data shows that the current level of applying CO2 is com-
paratively low.
Previous estimates assumed that between much less than 1 per cent and a maximum of 5
per cent of the current quantity of CO2 produced can be bound to product cycles (IPCC 2005,
Plass 2002). Accordingly, today’s total worldwide industrial demand for CO2 is around 115
million tonnes of CO2/a (around 72 per cent of which (65 million tonnes) is used in the pro-
duction of urea). This figure corresponds with around 0.5 per cent of annual energy-related
CO2 emissions worldwide. It must also be taken into account that CO2 is not bound long-term
when reused. The “binding periods” vary from a few weeks (for methanol, for instance) to
several decades (for various plastics, for example). Furthermore, binding separated CO2
(and the energy expenditure associated with it) may not necessarily be more favourable to
the energy and emissions reduction balance than the conventional method of binding carbon
as “feedstock” in the chemical process.
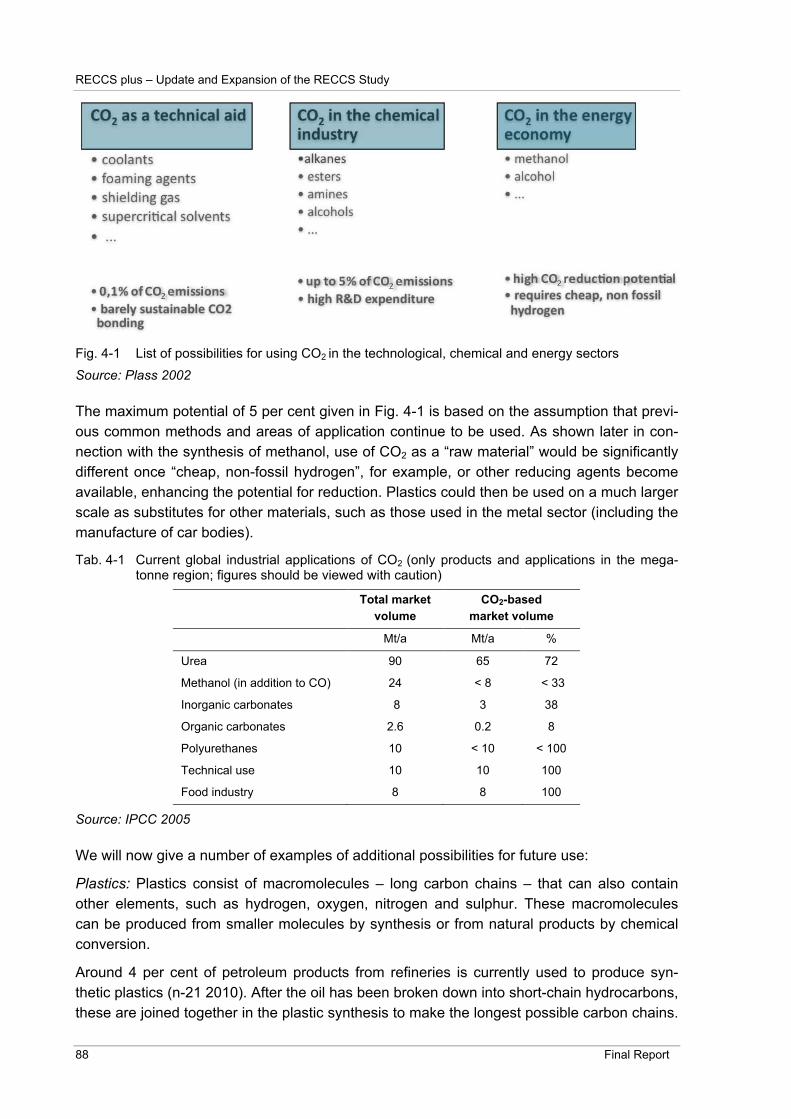
RECCS plus – Update and Expansion of the RECCS Study
88 Final Report
Fig. 4-1 List of possibilities for using CO2 in the technological, chemical and energy sectors
Source: Plass 2002
The maximum potential of 5 per cent given in Fig. 4-1 is based on the assumption that previ-
ous common methods and areas of application continue to be used. As shown later in con-
nection with the synthesis of methanol, use of CO2 as a “raw material” would be significantly
different once “cheap, non-fossil hydrogen”, for example, or other reducing agents become
available, enhancing the potential for reduction. Plastics could then be used on a much larger
scale as substitutes for other materials, such as those used in the metal sector (including the
manufacture of car bodies).
Tab. 4-1 Current global industrial applications of CO2 (only products and applications in the mega-tonne region; figures should be viewed with caution)
Total market
volume
CO2-based
market volume
Mt/a Mt/a %
Urea 90 65 72
Methanol (in addition to CO) 24 < 8 < 33
Inorganic carbonates 8 3 38
Organic carbonates 2.6 0.2 8
Polyurethanes 10 < 10 < 100
Technical use 10 10 100
Food industry 8 8 100
Source: IPCC 2005
We will now give a number of examples of additional possibilities for future use:
Plastics: Plastics consist of macromolecules – long carbon chains – that can also contain
other elements, such as hydrogen, oxygen, nitrogen and sulphur. These macromolecules
can be produced from smaller molecules by synthesis or from natural products by chemical
conversion.
Around 4 per cent of petroleum products from refineries is currently used to produce syn-
thetic plastics (n-21 2010). After the oil has been broken down into short-chain hydrocarbons,
these are joined together in the plastic synthesis to make the longest possible carbon chains.

Analysis of the options for the use of CO2
Wuppertal Institute for Climate, Environment and Energy 89
In place of crude oil, short-chain hydrocarbons that act as the base material can be created
from CO2. With this method of reusing CO2, further development is required only in the con-
version of CO2 into different hydrocarbons.
Initial research findings have been presented on the manufacture of plastics from natural
products using CO2. One such example is the manufacture of plastics using limonene: at
Cornell University in Ithaka, a catalytic process has been developed in a laboratory setting. In
this process, robust plastic resembling polystyrene is created out of CO2 and a substance
called limonene, which can be found in orange peel. Processes such as these, however, are
still at an early stage of development (Froboese 2007).
An aside: Innovative building material
A scientist from the field of biomineralisation, Professor Brent Constantz from California, has
developed a process that enables CO2 captured from power plants and waste heat to be
used to produce cement. In the process, the flue gases from the power plant pass through
huge seawater tanks. The magnesium and calcium dissolved in water forms carbonates with
the carbon dioxide, creating a mineral sludge that can be dried using waste heat from the
power plant, which would otherwise remain unused. It is questionable, however, whether
these processes can be adapted to an industrial scale, how lucrative they might be, and how
rapidly new developments can be integrated into existing processes and accepted by their
respective sectors (Biello 2008).
Fuels: The C atom cannot only be reused in substances. In certain conditions, a further dual
use of the carbon atom is also conceivable, i.e. a lower emission of CO2 per energy quantity.
In this case, the captured CO2 is not stored, but further processed into methanol, for in-
stance, using CO2-free hydrogen obtained from wind energy, for example, or, as is being
considered in the USA, from nuclear power. The product created (in this case methanol) is
reused as energy. Processes to create methanol are largely founded on the base material
being converted first into a synthesis gas and subsequently into methanol (CH3OH).
Synthesis gases for a methanol synthesis, consisting of CO, CO2, hydrogen (H2), residual
methane and inert gases, are produced conventionally on the basis of natural gas or coal. In
other processes, however, synthesis gases can also be produced from a mixture of CO2 and
H2 from other processes (for example, CO2 as a separation product of an integrated coal
gasification and H2 on the basis of electrolytic processes) and then specifically used for the
synthesis of dimethyl ether (DME), synthetic fuels (gas-to-liquid) or methanol.
In the case of methanol as the target product, a non-conventional process can be applied in
which synthesis gas, consisting of only CO2 and H2, is converted into methanol and water in a
heterogeneous catalysed reaction system:
(A) CO2 + H2 ! CO + H2O 41 kJ/mol (shift reaction)
(B) CO2 + 3 H2 ! CH3OH + H2O - 49 kJ/mol (exothermic)
Processes that directly link methanol synthesis to other processes are also being re-
searched. At the Centre for Solar Energy and Hydrogen Research in Stuttgart, for instance,
an integrated process has been developed that can be used to absorb CO2 from the air, as
well as to create methanol via a modified form of electrolysis with subsequent synthesis
(Specht and Bandi 2007).
RECCS plus – Update and Expansion of the RECCS Study
90 Final Report
Detailed investigations are required to assess the overall efficiencies, and hence the CO2
emissions, of such process variants in the current climate. It must also be considered
whether there is enough “climate-friendly hydrogen,” which would be required to support the
process in the future. This is also needed elsewhere, so it is uncertain whether there would
be sufficient availability for it to satisfy all demands.
4.2 Biological processes of CO2 capture and use
There are already a number of ideas for using biological processes to capture CO2 or to ab-
sorb CO2 from the atmosphere. Here, we must differentiate between onshore and offshore
options for use. In addition, research is also being carried out into processes to microbiologi-
cally transform CO2 into CH4 (methane).
Microalgae: Microalgae can provide over ten times as much biomass yield as higher land
plants. Essentially, algae are able to absorb CO2 from flue gases fed to them. The flue gases
may have CO2 contents of up to approximately 20 per cent. If microalgae were used in a bio-
reactor, CO2-depleted flue gases would be emitted. The biomass created in the process
would have to be separated by centrifugation, for instance, and further utilised (for example,
to produce biogas, biodiesel, bioethanol or biohydrogen). There are around eight million spe-
cies of microalgae, and so far only a handful have been used for this process.
Plants of this type would probably be used for smaller CO2 sources if large areas or volumes
are available for such bioreactors. Sunlight is required as the source of energy. This process
is not yet ready for transferral to the large scale. A further yield increase is possible from a
technical perspective by improving the design of the reactor and optimising the light input,
e.g. by micro-structured plane light conductors (Ausfelder and Bazzanella 2008).
Microalgae cannot be used in the open air. They require a closed system or basin that en-
sures they are covered by water and mixed sufficiently. The net energy yield and amount of
space required are the critical factors for evaluating the expediency of the process. To this
end, the City of Hamburg launched the research project “Technologies to tap the resource
microalgae” (TERM). A pilot plant for the absorption of CO2 by algae was put into operation in
mid 2008 (Bensmann 2008). The following sample calculation highlights the problem of the
space required: according to Kerner’s process, applied in Hamburg, a 21,500 hectare area of
algae would be required for a modern 1,100 MW hard coal-fired power plant with a CO2
emission of 5.4 million tonnes of CO2/a.
RWE is also carrying out research into the possibility of microalgae binding CO2. In the vi-
cinity of the power plant in Bergheim-Niederaußem, flue gases from the plant are conveyed
into an algae production plant to convert the CO2 they contain into algal biomass. The aim is
to investigate whether the algal biomass produced can be reused to make building materials
or fuels. Up to 6,000 kg of algae (dry matter) can be produced annually by this plant, binding
around 12,000 kg of CO2 in the process (Beck 2008).
Enzyme development: The enzyme ribulose bisphosphate carboxylase/oxygenase (Rubisco)
is ultimately responsible for plant systems absorbing CO2 from the air. Efforts to genetically
modify this enzyme could cause plant systems to store CO2 more rapidly or efficiently. This
initially applies to the growth period. Although CO2 is produced again if the plant is later used
as a bioenergy source, the energy yielded from it can be classified as CO2-free, because the

Analysis of the options for the use of CO2
Wuppertal Institute for Climate, Environment and Energy 91
CO2 is removed from the air again in the next cycle. With this process, a net reduction effect
can be realised in the timeframe if the biomass yielded is combusted on a large scale and
the CO2 produced is captured and stored. As it is in its early stages of development, com-
mercial use of this process is not expected in the short term. One inhibiting factor, which
could be important for public acceptance, is the use of genetically modified plants.
Microbiological transformation (methane production): Basic research is being carried out into
the microbiological transformation of CO2 into CH4. This research is supported by program-
mes such as “Geotechnologies” (see Section 2.1.1).
Afforestation: The CO2 reductions achievable through afforestation, or the prevention of de-
forestation, are identified as potential climate protection options in various investigations.
Due to the limited space potential for this option to have a significant impact, it is generally
restricted to areas outside Germany. Additionally, this process involves areas where there
are competing demands on land use, and would only be effective in the long term. When
applied to the large forested areas of the world, the discussion is much more complex be-
cause the interests of the groups involved are considerably more varied. Furthermore, eco-
logical and social implications must also be considered.
Another option is to afforest or recultivate semi-arid areas where there had been low concen-
trations of biomass. An obstacle here, however, would be the large quantity of fresh water
required and the competing demands for the water, which is also required for drinking or irri-
gating agricultural areas. A highly efficient irrigation system and measures to enhance the
water storage capacity and to prevent soil erosion would be essential for the afforestation of
semi-arid areas (GDCh 2003).
Induction of iron blooms: CO2 can essentially also be bound by artificial algal blooms in the
ocean. Iron fertilisation is required for this. In particular in the southern ocean areas, which
have a shortage of iron compounds, an induction of iron blooms could cause the whole
ocean system to absorb more CO2. Various issues must be investigated here, such as the
efficiency of the method and its potential ecological consequences, in particular its effect on
marine ecosystems. The London Convention’s scientific advisory body, amongst others, has
highlighted the negative ecological impact of this method.
In collaboration with German and Indian scientists, an experiment (LOHAFEX) was carried
out in the Atlantic at the beginning of 2009. However, no satisfactory results were obtained.
Following the blooms created by iron fertilisation, the algae were consumed by copepods
before they could settle on the seabed, as expected. The carbon therefore remained “bound”
inside the copepods just beneath the surface of the water and was released again relatively
rapidly. In addition to the, as yet unknown, ecological impact, therefore, there also has to be
a great deal of research into the residence period of the CO2 “separated” in this way (AWI
2009).
4.3 Other processes and approaches
Carbonisation of biomass: Max Planck Institute (MPI) in Potsdam is pursuing a process,
called hydrothermal carbonisation (HTC), in which plant systems are effectively artificially
carbonised by the addition of chemical substances at elevated temperature and pressure.
The coal fraction can then be extracted from the biomass and reduced to a small volume.

RECCS plus – Update and Expansion of the RECCS Study
92 Final Report
The idea is that the coal produced can be used to enhance the soil or is added to the known
industrial recycling states of lignite. Under the slogan “Magic Coal from a pressure cooker,”
initial conversions have been successful within the laboratory. Although a total evaluation of
the process has yet to be made, the subject of biocoal is also being researched at other uni-
versities and institutes, such as TU Berlin, Potsdam Institute for Climate Impact Research
and Institute of Sugar Beet Research in Göttingen.
Storage of trees: The Institute of Biochemistry of the University of Greifswald proposes stor-
ing trees under anaerobic conditions (under oxygen exclusion) in mines, thus retaining the
CO2 underground for hundreds of years (Scholz and Hasse 2008). So far there has been no
evaluation of whether the technical space and raw material potential is, or could be, available
as a carbon sink in a significant form, and what socio-economic consequences may arise
from it.
New catalysis: Many research projects in the field of chemical processes concentrate on the
development of novel catalysts that can be used to cleave CO2 in CO, or for conversion into
a hydrocarbon. However, no large-scale feasible innovations have yet been identified.
New materials: Under the leadership of Gerard Ferey, Institut Lavoisier of the Université de
Versailles Saint Quentin-en-Yvelines, French scientists have succeeded in developing a
nano-powder that can be used to capture CO2, amongst other things. A cubic metre of the
substance MIL-101 (organometallic crystals) has been able to capture 400 m3 of CO2 in the
pores of this nano-powder at a temperature of 25°C. According to Ferey, the powder could
be used to filter out CO2 from exhaust gas emissions. It is not yet known, however, what to
do with the “CO2 saturated” powder (Winter 2008).
Absorption to minerals: In natural weathering processes, CO2 is bound to magnesium sili-
cate. The atmospheric CO2 is bound long-term for geological ages. This natural reaction is
exothermic and spontaneous. When installed into the crystal lattice, therefore, energy is re-
leased over a period of between several hundred and one thousand years. To become tech-
nically applicable, this process must be greatly accelerated. Minerals found in large quanti-
ties throughout the world, such as olivine, wollastonite and serpentine, are used as the base
material. These minerals are then mechanically comminuted and treated thermally. During
an aqueous conversion, metals are dissolved out of the crystal lattice and converted into
solution with the carbonate ions. The products and silicates then settle out of this solution.
The thermal and mechanical pre-treatment, however, requires considerable energy expendi-
ture. In addition, enormous quantities of reaction products accumulate (0.66 tonnes of quartz
and 1.92 tonnes of magnesium carbonate per tonne of CO2), which need to be transported
(Ausfelder and Bazzanzella 2008).

Driving forces and attitudes of relevant stakeholders
Wuppertal Institute for Climate, Environment and Energy 93
5 Driving forces and attitudes of relevant stakeholders
In addition to purely technical factors, the development of CCS technologies is also depend-
ent on so-called “driving forces”, different aspects of which may have an influential and ac-
celerating effect. These driving forces mainly include global climate protection, national sup-
ply and energy security, the development of technological potential for innovation and export
opportunities, plant construction firms and other economic incentives (as already explained in
detail in the RECCS study). Above all, such drivers give impetus to the development of CCS
technologies in the long term, which is why their impact on the development of CCS tech-
nologies has not changed significantly over the past two years.
In contrast, the attitudes of interested parties towards CO2 capture and storage over the last
three years has become much more informed and differentiated. One indication of this is
given when following the debate on the perspectives and potential of CCS technologies,
which has steadily intensified and widened since the beginning of the 21st century. Not only
are numerous experts from science and industry and politicians involved in the debate, now
an increasing number of stakeholders from other social areas are also participating in the
public exchange of opinions on the future of this technology. The following section provides
an overview of the current discussion on CO2 capture and storage. Anxious about existing
and future projects and plans (such as exploration procedures and seismic measurements),
the “concerned stakeholders” are increasingly engaging in this public debate, particularly
those who live in the municipalities or federal states where potential storage site formations
are located. The following illustration is based on a qualitative analysis of written position
papers and comments by different stakeholders. The role of each type of stakeholder is de-
scribed below. They are organised into categories, namely non-governmental organisations
(NGOs), churches, political players, advisory committees and institutions, and scientists.
5.1 Non-governmental organisations
A large number of NGOs from a variety of social areas are now dealing with the subject of
CCS. At the beginning of 2007, NGOs were mainly focusing on climate and environmental
protection, and were expressing their views through the media. At that time, the debate about
CCS was chiefly otherwise the domain of experts and specialists. Since then, just three
years later, numerous other NGOs are among those institutions that have been partially re-
sponsible for raising awareness about CCS. Commercial and grassroots organisations de-
serve special mention here. These institutions and their respective stances and comments
on CCS are presented below.
Climate and environmental protection organisations
We will first describe some of the climate and environmental protection NGOs operating na-
tionwide. The current positions of the following NGOs were analysed in this context: Friends
of the Earth Germany (BUND), Greenpeace, Germanwatch, German Environmental Aid
(DUH), Nature and Biodiversity Conservation Union (NABU), World Wide Fund for Nature
(WWF) and Robin Wood. All of these NGOs have already established their positions on CCS

RECCS plus – Update and Expansion of the RECCS Study
94 Final Report
CCS in publicly available papers. Their attitudes towards CCS range from being clearly in
favour of it to its definite rejection.
The WWF and Germanwatch are among the clear proponents of CCS technologies, advocat-
ing its rapid development and market launch. Both NGOs envisage the application of CCS in
biomass power plants and in the industrial sector, since so-called “net sinks” could be
achieved and unavoidable process emissions stored (WWF 2009:2; Germanwatch 2009:2).
They also call for a compulsory introduction of CCS technologies for combustors that emit
over 350 grams of CO2/kWhel. The precondition, however, is that unresolved technical, legal
and ecological issues should be resolved (WWF 2009:4; Germanwatch 2009:4).
NABU is one of the more cautious proponents of CCS. NABU’s statement clearly suggests
that CCS should primarily be further developed as an international climate protection option,
as rapidly growing national economies such as India and China will continue to adhere to
their coal-based power generation (NABU 2009:1). NABU also wants a minimum level of
efficiency to be set for new fossil fuel-fired power plants.
DUH is neither a clear proponent nor opponent of CCS. Instead, this organisation seeks to
prevent the construction of new coal-fired power plants through public lobbying. In their
statement, they clearly express doubts about the large-scale applicability and economic fea-
sibility of CCS technologies. From its criticism: “Not even a ‘capture ready’ should become
statutory in Germany,” our understanding is, however, that they at least accept the use of
CCS in future for all planned coal-fired power plants and for those under construction (DUH
2009:10).
In contrast, BUND, Greenpeace and Robin Wood oppose the use of CCS technologies. Ac-
cording to BUND, it is too late to implement this technology because, realistically, the imple-
mentation of CCS can only be assured from sometime between 2020 and 2025 (Jansen
2009:2). They argue that giving financial support to an uncertain technology such as CCS
could block other future-oriented investments. According to BUND, the CO2 pollution ex-
pected from emerging industrial nations (such as China) and the bridging function that some
attribute to CCS are not adequate arguments for justifying this technology either. In addition,
it remains uncertain whether power stations currently under construction will ever be retrofit-
ted. BUND points out that sustainable clean forms of energy that could replace the fossil fuel
coal can already be used today. In conclusion, BUND consistently backs energy efficiency
and renewable energies.
With their climate protection scenario “Plan B 2050” (Barzantny et al. 2009:126) Greenpeace,
too, takes an unequivocal stand against CCS in the power plant sector. CCS is not needed
as a bridging technology, they say, and the expansion of coal-fired power plants generally
undermines the goals of climate protection. In view of possible competing uses for the de-
ployment of underground storage formations, Greenpeace supports making geothermal pro-
jects a priority and calls for this to be formally recognised in the legislation (Barzantny et al.
2009:75). Greenpeace does see potential for applying CCS in the industrial sector, and in
combination with biomass. The organisation argues that the latter option is especially rel-
evant in highly ambitious CO2 reduction scenarios, which require negative net emissions
worldwide in the second half of this century.
Driving forces and attitudes of relevant stakeholders
Wuppertal Institute for Climate, Environment and Energy 95
Robin Wood categorically rejects the construction of new lignite and hard coal-fired power
plants and, as a consequence, the use of CCS technologies. The organisation calls instead
for a radical change in energy policy. Moreover, it believes that CCS technologies will be
applied too late to achieve the envisaged climate protection targets for 2020, since testing
and development work still has to be done.
Compared with 2007, the opinions and positions of the various climate and environmental
protection NGOs are now much more differentiated and substantiated. There are also a
number of areas, however, where many NGOs reach a consensus. These areas can be seen
in the aforementioned position papers and statements presented to the German government
by many NGOs in May 2009 to help draft a bill on the regulation of CCS. In summary, these
areas of agreement are:
• no priority of CO2 storage sites over alternative forms of use of energy production, i.e. no
exclusion of competitive uses,
• further research and development into CCS technologies using demonstration projects;
transfer of research results into a future CCS law,
• assignment of more responsibility, post-closure obligation and liability to the operators
according to the polluter pays principle, and
• creation of an underground development plan.
In conclusion, taking an overview of these groups, it emerges that there is no definite trend of
being either opposed to or in favour of CCS technologies among the vast majority of the en-
vironmental and climate protection organisations in Germany.
Industry associations
The Bundesverband der Deutschen Industrie e.V. (BDI) sees in CCS technologies an im-
portant technological option for developing the climate-friendly use of lignite and hard coal.
For this reason, they believe that this technology has the potential to contribute to energy
supply security and to reducing Germany’s dependence on raw materials, such as gas and
oil. The BDI believes that CCS could herald an opportunity for economic players to take on a
key role in a global future market (BDI 2009:1). The BDI believes a German CCS law should
be heavily based on the EU Directive, and criticises that some parts of the current draft law
extend significantly beyond the requirements of the European CCS Directive (for example, in
the areas of liability regulations and financial security). They argue that such regulations
would unnecessarily make the technology more expensive, and place German enterprises at
a disadvantage compared with Member States that adopt the EU regulation without amend-
ments or additions (BDI 2009:2). According to this Association, a future-oriented legal
framework is required as soon as possible to ensure the rapid development of this technol-
ogy and, in particular, to determine a liability ceiling (BDI 2009:3).
The Wirtschaftsvereinigung Stahl asserts that it will be impossible to implement CCS tech-
nologies prior to 2020. The steel industry is currently engaging in long-term research activi-
ties into new process technologies that could achieve considerable greenhouse gas reduc-
tions in future. The Wirtschaftsvereinigung Stahl, however, stresses that the economic effi-
ciency and public acceptance of CCS technologies are, as yet, unknown territory. They be-
lieve that the way forward is framework legislation, that will enable the industry to carry out

RECCS plus – Update and Expansion of the RECCS Study
96 Final Report
demonstration projects in the future. To this end, discrimination-free access to carbon dioxide
supply networks and carbon dioxide storage sites are required, in addition to non-excessive
requirements with regard to the purity of carbon dioxide gases, investment incentives and a
clear legal framework that does not impede the development of a transport and storage site
infrastructure too greatly (Wirtschaftsvereinigung Stahl 2009:1).
According to the Bundesverband der Energie- und Wasserwirtschaft e.V. (BDEW), CCS sig-
nifies a commitment to coal and is, therefore, a future-focused, positive technology. In princi-
ple, they consider CCS technologies to be a possibility for utility companies to reconcile the
requirements of global climate protection with the guarantee of ensuring the necessary en-
ergy supply security. According to them, this is also significant in that it will contribute to at-
taining energy policy commitment to continue to use coal as an energy source. The BDEW
therefore also welcomes the draft law for the regulation of CCS by the German government,
and calls for the law to be passed as soon as possible. This Association advocates having
the EU CCS Directive translated and applied intact into national law. They consider it import-
ant to avoid unfair competition and to support German businesses that are introducing tech-
nical innovations for climate protection. They only support the German CCS law to a limited
extent because of it having tighter controls than the EU CCS Directive. Their reservations are
centred around the provision of financial security and the post-closure obligations (BDEW
2009:3). They consider the regulations on ownership structures at and around suitable CO2
storage sites to be insufficient, and believe they will probably lead to considerable delays in
CCS projects.
The German Lignite Industry Association (DEBRIV) is in favour of CCS technologies. They
believe that CCS would give many countries the chance to develop and establish social jus-
tice. According to the German lignite industry, the draft law for CO2 capture and storage pre-
sented by the German government is a vital contribution to securing the safe, climate-friendly
supply of energy to Germany in future. DEBRIV considers it unjustifiable to delay or prevent
the implementation of the bill. The draft law, they say, creates an important basis for estab-
lishing a transportation system and for developing and operating underground storage sites
for captured carbon dioxide. They consider it suitable for establishing the foundations for fu-
ture planning and investment security for enterprises. Coal will remain a vital element in the
energy mix worldwide for the foreseeable future, and would be made sustainable by CCS
technology. According to DEBRIV, other industries, such as the chemical or petrochemical
industry, should also be given the opportunity to reduce their greenhouse gas emissions in
this way with the assistance of new technologies (Maaßen 2009: 4).
The Geothermische Vereinigung – Bundesverband Geothermie e.V. believes there is a keen
competitive relationship between CCS and geothermal projects. This is because the storage
of CO2 is in competition with the use of geothermal energy and the storage of compressed
air. This could particularly affect areas in the northern region of Germany. The Association
calls for a future CCS regulation that would deny a survey permit for CCS projects if a permit
based on mining law was already in existence for the same area for the use of geothermal
energy. The geothermal association suggests granting the competent (mining) authorities
discretionary powers so that the relative advantages and disadvantages of the various uses
of underground sites can be evaluated on a case by case basis, and that sufficient space be

Driving forces and attitudes of relevant stakeholders
Wuppertal Institute for Climate, Environment and Energy 97
ring-fenced for the future use of geothermal energy (Gaßner 2009:2, Bundesverband Geo-
thermie 2009). The European Geothermal Energy Council (EGEC), based in Brussels, goes
one step further, calling for a clear priority for the use of geothermal projects over the storage
of CO2, since CCS is primarily only a bridging technology (EGEC 2009:2).
Trade unions
The Confederation of German Trade Unions (DGB) voices its concern that CCS is only one
of many climate protection options and possibilities for securing energy supplies (DGB
2009:2). They argue that CCS technologies have not yet been sufficiently investigated with
regard to their economic efficiency, technical feasibility and harmlessness to human health,
nature and the environment. For this reason, the DGB insists on the implementation of dem-
onstration projects in order to prove the suitability of CCS for reducing carbon dioxide emis-
sions. If this is proved, all retrofittable power plants should preferably be equipped with CCS
technologies. In this case, the DGB says, the intended CCS law should be updated accord-
ing to the latest scientific and technical developments. This should be no later than when
CCS technology is made obligatory for all new power plants. The law must guarantee a legal
basis for the permanent storage of carbon dioxide in underground geological formations
(DGB 2009:3).
The Mining, Chemistry and Energy Industrial Union (IG BCE) clearly advocates the further
use of coal as an energy source. It supports the exploration and realisation of CCS technolo-
gies, yet warns against unnecessarily premature regulatory provisions. They argue that a
statutory obligation to retrofit all new power stations with CCS technologies could jeopardise
current modernisation work and the construction of hard coal- and lignite-fired power plants
with higher levels of efficiency. Above all, CCS must be developed by 2020. To achieve this,
according to IG BCE, framework conditions for pipelines and CO2 storage sites must be cre-
ated now (IG BCE 2008:7).
In summary, it becomes evident that relevant industry associations and trade unions (with
the exception of national and international geothermal associations) mainly have a positive
attitude towards the further exploration and implementation of CCS technologies. However,
they do not expect this technology to be applied before 2020. They point out that economic
and technical feasibility has not yet been sufficiently analysed. Contrary to the positions of
most environmental organisations, the associations want a CCS law to be passed as soon as
possible, which should be based largely on the EU CCS Directive. They stress that there
should not be further regulatory intervention for financial security and post-closure obliga-
tions, at the expense of companies.
5.2 Churches
Representatives of different religious groups are now also becoming engaged in the public
debate on CCS. Unsurprisingly, certain stances have become visible in the church districts
where CCS activities are expected, as power stations already exist there, or they are poten-
tial storage locations.
The North Frisia church district, for example, takes a clear stance against CCS, in the form of
opposing the RWE DEA exploration project (Kirchenkreis Nordfriesland 2009). The synod of
North Frisia church district advocates a sustainable lifestyle that treats natural resources with
RECCS plus – Update and Expansion of the RECCS Study
98 Final Report
care and respect, and that does not jeopardise the lives of future generations. Members of
the church therefore oppose energy projects with repercussions that are destined to last cen-
turies or even millennia. Since the risks of CCS technologies are as yet unknown, concerns
and fears among the population are necessarily greater, they claim. The church district calls
on its federal state government and the German government to abandon the intended CCS
law. They also appeal to utility companies to promote energy supply solely on the basis of
renewable sources. In addition, they refer to possible conflicts of use, since other options for
using deep geothermal energy or the storage of compressed air or hydrogen for wind energy
purposes would be suited to this region. Last but not least, public commitment is mentioned.
In recent years, this has been a major contributory factor in sustainable energy management
(for example, public investment in citizens’ wind farms (Bürgerwindparks) and the initiation of
the Aktivregion Nordfriesland Nord). Against the backdrop of these efforts, the citizens of
North Frisia perceive that their dedication would be profoundly challenged if they have to
bear the future consequences of an energy management that is no longer sustainable.
The committee of Jülich Mitwelt church district takes a slightly different stance. Representa-
tives of the committee express their concern that the construction of new power stations in
this region would lead to more open-cast mines being developed. They therefore urge the
federal state government of North Rhine-Westphalia only to grant permission for new power
plants if it does not involve the creation of new open-cast mines. Only then, they say, can the
further “exploitation” of homelands and the resettlement of 9,000 to 12,000 more people in
the open-cast mining regions be avoided. The representatives also voice their concern that
the capture, transport and storage of CO2 are very expensive and, from a technical point of
view, harbour considerable risks. Other negative aspects of CCS technologies, they argue,
include a reduction in power plant capacity, the fact that a technical solution may not happen
before 2020, and that utility companies would request that the state contribute to costs. In
conclusion, the church district considers a further use of lignite beyond the approved periods
to be misguided as a suitable approach for energy supply in the future, since this would pre-
vent the rapid and more comprehensive use of renewable energies.
On the basis of these two stances of church districts, it is clear that negative attitudes mainly
emerge in the regions where the use of CCS could have a direct impact on the public and
future generations.
5.3 Politics
5.3.1 Political parties
CDU
In a position paper on energy policy dated 16 July 2009, the German Christian Democratic
Union (CDU) assigns a high priority to a “diversified and competition-oriented energy mix”
(CDU/CSU 2009a) for future-proof energy policy. They assume that, even though there has
been a strong growth in renewable energy sources, fossil fuels such as coal will be a central
part of the energy mix for some time to come. Their use, however, should be as efficient and
climate-friendly as possible. Against this backdrop, the CDU “expressly” supports the further
development of CO2 capture and storage, which “can make a vital contribution to the climate-
friendly use of fossil fuels and climate protection worldwide,” (CDU 2009a). This assessment
Driving forces and attitudes of relevant stakeholders
Wuppertal Institute for Climate, Environment and Energy 99
is mentioned again in the CDU manifesto for the 2009 Bundestag elections (CDU/CSU
2009b).
During the Bundestag debate on 6 May 2009, on a law for regulating underground CO2 stor-
age, speakers from the CDU/CSU parliamentary group emphasised that, in addition to the
benefits of CCS technologies in terms of climate policy, there is also the opportunity to play a
leading international role in the development and testing of this technology, creating a basis
for technology exports. It was agreed that the draft for the CCS law should create reliable
legal framework conditions for this process (Bundestag 2009).
In the course of further consultations on the draft law, however, it became obvious that there
were diverse views on underground CO2 storage within the CDU/CSU parliamentary group.
In particular, members of parliament from constituencies where there will be site investigat-
ions for CO2 storage expressed concern about public acceptance in the affected areas and
about intervention in ownership structures. As a result of these objections, the law was de-
feated on 25 June 2009 and could not be passed, as had been planned, before the
Bundestag elections in September 2009.
SPD
The German Social Democratic Party (SPD) is somewhat ambivalent when it comes to ques-
tions concerning the future use of coal in Germany. The SPD parliamentary group in the
Bundestag, for example, is split between a coal-friendly and a more environmentally-
oriented, coal-critical wing. For this reason, issues surrounding coal policy sometimes lead to
controversial debate (Vallentin 2009). In 2007, the SPD’s attitude towards CCS was outlined
in the decision paper “Social democratic energy and climate policy for the 21st century”. In
this paper, it states that research activities into CCS technology for creating CO2-free energy
production are of central importance, and that Germany should expand its expertise in this
field. From 2015, the first coal-fired power plant equipped with CCS technology in Germany
is expected to be operational; CCS power plants are supposed to be standard by 2020. For
this reason, the SPD supports any efforts to explore and test this technology (SPD 2007).
In their manifesto for the 2009 Bundestag elections, the SPD stated their position on CCS
more precisely, including framework conditions for CO2 storage. Primarily, the reuse of CO2
is given priority over its underground storage. In the event of CO2 storage, citizens affected
should be involved in the approval process and companies must guarantee the permanence
of the storage sites. The importance of CO2 capture and storage for future energy supplies is
also underscored in the SPD’s manifesto by demanding that the revision clause for the Ger-
man hard coal mining industry is applied “well before 2012”, preventing the phasing out of
the hard coal mining industry (SPD 2009). The SPD therefore gives coal a prominent position
in the future German energy mix.
In the debate on the draft of a CCS law in the Bundestag on 6 May 2009, the SPD parlia-
mentary group supported the draft law presented by the German Federal Ministry for the
Environment, Nature Conservation and Nuclear Safety, led by the SPD at that time. None-
theless, the SPD posed critical questions, such as ones associated with the necessary safety
standards for storage, the assumption of the costs for the risks involved in CO2 storage by
the companies responsible and possible competition between CCS and other CO2 reduction
options, such as renewable energies or energy efficiency (Bundestag 2009).

RECCS plus – Update and Expansion of the RECCS Study
100 Final Report
FDP
In their Resolution of Intent on energy policy, dated 11 September 2008, the FDP (German
Free Democratic Party) parliamentary group in the Bundestag underlined the crucial signifi-
cance of a broad energy mix (FDP 2008). This would include renewables, nuclear power,
coal, oil and gas, and is key to keeping Germany’s dependence on energy imports as low as
possible. The FDP assumes that coal will continue to play a leading role in German energy
supply in the medium term, but that it should be used in a climate-friendly manner. Research
into the development of CO2 capture and storage is therefore given top priority in both the
resolution adopted by the parliamentary group and in the policy statements on energy agreed
on in 2006 at the FDP’s federal party convention in Rostock (FDP 2006).
In their manifesto for the 2009 Bundestag elections, the FDP confirmed this position and
called for CCS technology to be promoted through pilot projects and for the rapid creation of
a legal framework. New coal-fired power plants should only be given planning permission if
their design allows retrofitting of a system for CO2 capture. In addition to CO2 storage, the
FDP calls for research into the options for the use of CO2 and its legal implementation (FDP
2009).
Although the FDP accompanied the debate on the bill presented by the former German gov-
ernment for a CCS law quite favourably, they pointed out potential competitive uses when
constructing a pipeline system for CO2 transport and storage. When laying transport corri-
dors, ownership conflicts and competitive uses with geothermal energy and (in the case of
saline aquifers) the use of groundwater should be avoided (Bundestag 2009).
Die Linke
The core element of the energy policy programme of Die Linke (The Left) is a massive ex-
pansion of renewable energies and a considerable increase in energy efficiency. In their
manifesto for the 2009 Bundestag elections, the Party calls for an increase in the share of
renewables in the electricity sector of at least 50% by 2020. At the same time, it supports the
phasing out of nuclear energy and a medium-term withdrawal from generating electricity from
coal. They also oppose the planning and construction of new coal-fired power plants. This
also applies to coal-fired power plants equipped with CCS technology, which they call an
“illusory solution” and therefore equally reject. (Die Linke 2009a)
Eva Bulling-Schröter, environmental policy spokeswoman of Die Linke parliamentary group
in the Bundestag, acknowledges that CCS may indeed serve as a bridging technology if ne-
cessary, but there is a risk that some of the impetus for the transition to renewables may be
lost if attentions are focused on CCS (Die Linke 2009b). In consultation responses to the
draft of the CCS law in May 2009, Die Linke criticised that the law would lead to a premature
commitment to a technological path that has not yet been sufficiently explored. In this con-
text, the party referred, above all, to various storage risks (for example, leakages caused by
old boreholes). For this reason, Die Linke shares the opinion of the German Advisory Council
on the Environment that the draft law should be changed to a research act, as a “minimum
requirement”. Die Linke also criticised the formal structure of the law, claiming that important
details, such as the structure of the storage sites, the composition of the gas stream or the
approval procedures for CO2 pipelines, would have to be agreed upon subsequently by pro-
visions without any involvement by legislators. (Bundestag 2009)

Driving forces and attitudes of relevant stakeholders
Wuppertal Institute for Climate, Environment and Energy 101
Bündnis 90/Die Grünen
The main focus of the energy policy of Bündnis 90/Die Grünen (Alliance 90/The Greens) is
on renewables and energy efficiency. Both of these components would contribute to a drastic
reduction in the use of fossil fuels and would promote climate-friendly energy supply (Bünd-
nis 90/Die Grünen 2009a). The attitude of Die Grünen towards CCS technology is described
in a position paper by the parliamentary group, dated 3 March 2009. Although the paper
does not completely rule out CCS as a technological option for reducing CO2, it makes a de-
tailed inspection of the disadvantages and uncertainties related to this technology. In the
debate in the Bundestag on the CCS draft law, the spokeswoman of Die Grünen parliamen-
tary group drew attention to the high level of investment expenditure required for introducing
the technology and the uncertainties regarding planning approval procedures for extensive
underground CO2 storage sites and laying CO2 pipelines over long distances (Bundestag
2009).
Due to these objections, Die Grünen advocate that CCS technology must be scrutinised ac-
cording to strict legal framework conditions and that there should be large-scale testing. The
legal framework must stipulate, amongst other things, that the operators of CCS plants shall
be liable, based on the polluter pays principle, for monitoring the storage sites and any dam-
age that may be incurred. In addition, the storage sites shall be explored with maximum
transparency, and access to CO2 transport systems and storage sites shall be regulated
without discrimination. Alternative uses of underground storage sites, such as to generate
geothermal energy or to store compressed air, must not be disadvantaged by CCS projects.
In addition to these legal issues, Die Grünen stress that the use of CCS must not impede the
complete conversion of the energy system to renewables. And hence financial support for
research into CCS technology should not be at the expense of renewable energies. They
also demand a moratorium on the construction of new coal-fired power plants until CCS has
become a technical reality (Bündnis 90/Die Grünen 2009b).
5.3.2 The German government
The former German government, comprising CDU/CSU and SPD (2005-2009), considered
CCS technology to be a vital element of their energy and climate strategy. In a speech deliv-
ered on 24 June 2009, the Federal Chancellor Angela Merkel (CDU) stressed that CCS
could make a major contribution to reducing CO2 and that it was of central importance to the
further use and spread of German coal technologies. Consequently, restrictive legal frame-
work conditions should not impede the testing and implementation of CCS technology
(Merkel 2009).
Within the Black-Red German government, it was debatable for a long time who was respon-
sible for CCS technology. In the end, the responsibility for drafting the CCS bill was assigned
to the Federal Ministry of the Environment, Nature Conservation and Nuclear Safety (BMU),
whilst the Federal Ministry of Economics and Technology (BMWi) accompanied the work
process. In the debate on the CCS law, the former Federal Minister for the Environment,
Sigmar Gabriel, pointed out that CCS was necessary for combating climate change and
could also contribute to energy supply security and defending Germany’s leadership in tech-
nology in the power plant sector (Bundestag 2009). As well as the national relevance of
RECCS plus – Update and Expansion of the RECCS Study
102 Final Report
CCS, he stressed the technology’s significance for developing and emerging countries, such
as China and India, where energy consumption, mainly comprising domestic coal, is increas-
ing rapidly. For this reason, the opportunity to use coal in an environmentally-friendly manner
is important in integrating these countries into a post-Kyoto agreement, Gabriel explained.
With regard to controversial questions regarding the CCS draft law, Gabriel indicated that the
problem of possible competing uses with geothermal projects or compressed air reservoirs
should not be overestimated, since the geographic distribution and the geological depths of
such projects did not usually coincide with the corresponding requirements of CCS storage
sites. Concerning companies’ responsibility for the safety of such storage sites, Gabriel rec-
ommended coupling operating permits for CO2 storage sites to obliging operators to adapt
plants to the latest scientific and technological standards (Bundestag 2009).
The BMWi considers the use of CCS technology to be a precondition for retaining a balanced
energy mix in Germany, based to a great extent on domestic energy sources. Moreover, the
Ministry believes it is crucial that German climate protection technologies are devised and
tested promptly to enable them to be made available worldwide. With regard to the CCS draft
law, the importance of the cooperation between federal and federal state authorities, as well
as between business and the public, is stressed, so that they can share expertise and en-
gender a high degree of security and acceptance (BMWi 2009a).
The new German government elected in September 2009, comprising CDU/CSU and FDP,
supports the development and market launch of CCS in their coalition agreement. To this
end, they announced that they would implement the EU CCS Directive “soon” and would
promote public acceptance of the technology (CDU/CSU and FDP 2009). CDU/CSU and
FDP also intend to commission the preparation of a “geothermal atlas” to examine competing
uses with CCS and to expand research programmes on options for using CO2.
5.3.3 Bundesrat and German federal states
In the CCS draft law, the German federal states play a central role, since they will be as-
signed important duties concerning the monitoring of storage sites and providing data to the
Federal Institute for Geosciences and Natural Resources (BGR) for the analysis of storage
site layers. This particularly applies to the northern federal states of Schleswig-Holstein and
Lower Saxony, where most of the potential CO2 storage sites are located. On 15 May 2009,
the Bundesrat therefore gave a comprehensive statement on the German CCS draft law,
criticising numerous technical, ecological and financial aspects of the bill and its stipulation of
burden sharing between the federal and state governments.
With regard to the latter aspect, the following proposals for amendments are particularly rel-
evant (Bundesrat 2009):
• the federal states should be given the opportunity to comment on the processing and
evaluation of regional geological data by the BGR and the resulting conclusions by the
BMWi,
• the federal states oppose the exemption from costs awarded to former operators of
closed CO2 storage sites, since this violates the precautionary principle. For this reason,
they are calling on the German government to investigate options for introducing regula-

Driving forces and attitudes of relevant stakeholders
Wuppertal Institute for Climate, Environment and Energy 103
tory controls for the plant operators having to accept financial responsibility for any dam-
age incurred, even after responsibilities have been transferred to the state,
• since potential CO2 storage sites are situated in just a few German federal states, the
Bundesrat states that the Federation should assume all risks associated with CO2 stor-
age to avoid this handful of states being unfairly burdened.
At federal state level, the CCS debate has also gained momentum. Here, the viewpoints vary
between approval and rejection. In July 2009, the federal state parliament of Schleswig-
Holstein argued unanimously in favour of stopping soil explorations conducted by RWE Dea
in the districts of Schleswig-Flensburg, North Frisia and Eastern Holstein at the request of
the CDU/SPD parliamentary groups. They consider the investigations into potential CO2
storage to be unnecessary in view of the Federation’s adjournment of the decision on the
controversial CCS law. They also believe that the technology is not yet fully mature (Landtag
Schleswig-Holstein 2009a). In September 2009, the parliamentary groups of the SPD, Bünd-
nis 90/Die Grünen and the Southern-Schleswig Voters’ Association (SSW) also called on the
federal state government of Schleswig-Holstein to pursue the goal of prohibiting CO2 storage
via the Bundesrat (Landtag Schleswig-Holstein 2009b). Subsequently, the CDU and FDP
tabled an amendment in which the federal state government is pledged to ensure that, in the
new national CCS law, the German federal states will be given independent rights to exclude
the permanent underground storage of CO2 from their territory. The federal state government
should not be able to allow the underground storage of CO2 against the will of the population
(Landtag Schleswig-Holstein et al. 2009c). The CDU of Schleswig-Holstein, however, op-
poses a nationwide prohibition of CO2 storage (Landtag Schleswig-Holstein 2009d).
In their coalition agreement, finalised on 17 October 2009, the newly elected federal state
government of Schleswig-Holstein, comprising the CDU and FDP, categorically rejects CCS
technology, too. In compliance with the motion for amendment from the CDU and FDP state
parliamentary groups, the coalition backed the inclusion of a right to veto in the CCS law so
that affected federal states have the power to reject CO2 storage projects in their territory
(CDU Schleswig-Holstein and FDP Schleswig-Holstein 2009).
In the coal-producing federal states of Brandenburg and North Rhine-Westphalia, on the
other hand, the majority approves of CCS. The Premier of Brandenburg emphasised in
spring 2009 that it is crucial that a legal framework for CO2 storage is established soon in
order to maintain Brandenburg’s dominant technical position in generating CO2-low power
from lignite (Staatskanzlei Brandenburg 2009). Against this backdrop, the former federal
state government, comprising the SPD and CDU, also advocated the exploration of potential
CO2 storage sites in the Oder-Spree district. Both governing parties insist, however, that the
process be carried out as transparently as possible, and with public participation, to achieve
a high degree of public endorsement and acceptance (SPD-Landtagsfraktion Brandenburg
2009).
The federal state’s stance towards CCS had to be realigned, however, after the federal state
election in Brandenburg in September 2009, that resulted in the formation of a new federal
state government, comprising the SPD and Die Linke. In contrast to the SPD, Die Linke in
Brandenburg had argued for a medium-term withdrawal from generating power from lignite
by “2040 at the latest” in their manifesto (Die Linke Brandenburg 2009) and also rejected
CO2 storage (TAZ 2009). As a result, the two issues became the subject of controversial de-

RECCS plus – Update and Expansion of the RECCS Study
104 Final Report
bate during coalition negotiations with the SPD. In the coalition agreement of the new federal
state government, however, the coalition now supports the demonstration and testing of CCS
technology. As from 2020, new lignite-fired power stations shall only be approved if CO2
emissions are “drastically” reduced (SPD-Brandenburg and Die Linke Brandenburg 2009).
With regard to the research and use of CO2 storage sites in Brandenburg, the safety of the
population is paramount. Regional, social and ecological conflicts shall be minimised by pro-
viding detailed information to the population and enhanced mediation by the state. Moreover,
the challenge now was to coordinate the competing claims on the use of potential CO2 stor-
age sites, for example, for deep geothermal energy (SPD-Brandenburg and Die Linke Bran-
denburg 2009).
The federal state government of North Rhine-Westphalia (NRW) supports CCS and the cre-
ation of a corresponding legal framework, and attempts to reduce the public’s reservations
about the construction of coal-fired power plants or CO2 pipelines through dialogue, and to
promote technical exchange on CCS. One way in which this is being achieved is through the
“Power Plant Technology Network NRW”, organised by EnergyAgency.NRW, which has al-
ready held various symposia on this subject. At question time in the federal state parliament
of NRW in June 2009, the use of CCS technology was approved by all parliamentary groups,
with the exception of Die Grünen (Landtag NRW 2009). Christa Thoben, Federal State Minis-
ter for Economic Affairs and Energy, clearly favours CCS and also supports the CCS draft
law. She has also supports RME’s CCS project in Hürth near Cologne (MWME NRW 2009).
5.3.4 Local authorities
In 2010, the utility companies RWE, E.On and Vattenfall Europe started exploring possible
CO2 storage sites. RWE Dea is investigating potential storage sites in the districts of North
Frisia and Schleswig-Flensburg in Schleswig-Holstein. E.On Gas Storage GmbH has applied
for permission to Lower Saxony State Office for Mining, Energy and Geology (LBEG) to in-
vestigate possible CO2 storage sites in the area of the River Weser. The application com-
prises 17 districts and urban districts in Lower Saxony and Bremen. Vattenfall Europe may
investigate suitable storage site formations in East Brandenburg. The company has submit-
ted the relevant applications for exploration to the Brandenburg State Office for Mining and
Geology in Cottbus. The explorations focus on the East Brandenburg regions of Beeskow
and Neutrebbin.
The exploration of geological formations in northern Germany, carried out in order to assess
their suitability as potential CO2 storage sites, has, however, provoked resistance in the re-
gions concerned. Numerous municipal bodies have expressed their rejection of CCS tech-
nology in recent months. Some of these initiatives are listed below:
• Rural district of Leer: In a statement to the LBEG, the administration of the rural district
in Lower Saxony emphasised its opposition to CO2 storage, because too little is known
about its possible consequential damage; it has not yet been sufficiently researched
whether the underground storage of CO2 can guarantee its permanent and safe dis-
posal.
• Insel- und Halligkonferenz: This association opposes CCS, since the technology does
not prevent the production of CO2. Furthermore, gas would have to be transported long
Driving forces and attitudes of relevant stakeholders
Wuppertal Institute for Climate, Environment and Energy 105
distances to storage sites and the environmental impact of CO2 storage has not yet been
researched in sufficient depth. Due to the potential negative impact on nature and tour-
ism, the body instead advocates the expansion of renewable energies (Neue Energie
2009a).
• Gemeindetag Nordfriesland: On behalf of the 126 municipalities belonging to the district
association, the Gemeindetag spoke out in a resolution against a final CO2 disposal site
and exploration processes carried out by RWE Dea. In this resolution, the German gov-
ernment is urged not to pass the bill for a CCS law due to the possible risks involved in
storage and the potential negative impact on the Wadden Sea. It opposes the federal
state government of Schleswig-Holstein using the region as a “test area” for CCS (Der
Inselbote 2009).
• Schleswig County Council: In a resolution in July 2009, the County Council rejected the
German government’s draft for a CCS law and the storage of CO2 in the district of
Schleswig. It calls on the German and federal state governments to ban any funding for
research activities on CCS technology. In another resolution, they urge RWE Dea to re-
frain from carrying out the intended seismic measurements in their search for suitable
CO2 storage sites in the region (Schleswig-Holsteinscher Zeitungsverlag 2009a).
• Kappeln Town Council: At the request of Die Grünen parliamentary group, the Town
Council passed a resolution against a CO2 storage site planned by RWE in Schleswig-
Holstein. They justify the rejection of CCS on the grounds of competing uses by alterna-
tive energy technologies, such as geothermal energy, and also the potential negative
impact on tourism in the region and the high costs of the technology compared with
other alternative options for generating energy (Schleswig-Holsteinscher Zeitungsverlag
2009b).
• Beeskow (Oder-Spree) local representatives: Seven mayors and directors from the re-
gion around Beeskow (Brandenburg) have published a joint statement in which they re-
ject both CCS and the intended exploration of a potential storage site near Beeskow.
The reasons they give are that the project is damaging to the region’s good reputation
and tourism, and that it is associated with too many uncertainties. According to plans by
Vattenfall, CO2 from the future demonstration power plant Jänschwalde will be liquefied
and pumped through pipelines to storage sites in East Brandenburg from 2015 (Neue
Energie 2009b).
In conclusion, it can be stated that the majority of parties represented in the Bundestag and
the German government support the use of CCS. Die Linke is its most vehement opponent.
Die Grünen demand a strict framework of rules and regulations for the use of this technology,
and a clear priority for renewables. At federal state level, Schleswig-Holstein state gov-
ernment and all parties represented in the Schleswig-Holstein state parliament clearly op-
pose the storage of CO2. This attitude is reinforced by the firm public rejection in potential
storage site areas. Highly industrialised, coal-producing federal states, such as Brandenburg
and NRW, on the other hand, are supporters of CCS. A two-level conflict is therefore emer-
ging: at the first level, between federal states with a great CO2 storage potential and the Ger-
man government and, at the second level, between the “storage states” and all other federal
states where coal still plays a vital role with regard to structural policy.
RECCS plus – Update and Expansion of the RECCS Study
106 Final Report
5.4 Advisory bodies and institutions
German Council for Sustainable Development
The German Council for Sustainable Development was convened by the German gov-
ernment in 2001 to contribute to the implementation of the German sustainability strategy
and to identify significant problem areas concerning this subject. In recent years, this body,
also called the “Sustainability Council”, and, in particular, its Chairman Dr. Volker Hauff, has
become an important advocate of CCS technology. In a resolution as early as in 2003, the
Council described CCS technology as a precondition for the sustainable use of coal and,
therefore, as a “necessary stage of development” (Rat für nachhaltige Entwicklung 2003).
This position was further specified in the ensuing years. In autumn 2008, the Council pub-
lished a position paper on important issues concerning energy policy, in which CCS technol-
ogy is classified as a central option for reducing CO2, especially within the global context.
Since Germany is a country with a long tradition of eminence in the field of energy technol-
ogy, it has a global responsibility to develop and apply CCS technology. They therefore call a
halt to the approval of any coal-fired power plants without CCS after 2015, and that all new
fossil fuel-fired plants from 2010 must be retrofittable. For existing plants that emit more than
the respective average of hard coal and lignite-fired power plants, proposals are being made
to ensure they are retrofitted now, according to regulatory law (Rat für nachhaltige Entwick-
lung 2008).
During the debate on the CCS draft law by the German government in summer 2009, Hauff
emphatically spoke out in favour of this technology being used and promoted, as it was not
yet possible to secure Germany’s energy supply on the basis of renewables alone in the de-
cades to come. Hauff therefore backed the CCS law and also asked for a large-scale re-
search initiative on CO2 processing and for its application as a resource (Rat für nachhaltige
Entwicklung 2009a). He called the concerns expressed by environmental associations about
CCS technology “provincial” (Rat für nachhaltige Entwicklung 2009b). In December 2009,
Michael Vassiliadis, Chairman of the Mining, Chemistry and Energy Industrial Union (IG
BCE) and member of the Sustainability Council, requested that the German government
promote CCS technology and work towards increasing public acceptance of this technology
(Rat für nachhaltige Entwicklung 2009c).
German Advisory Council on the Environment (SRU)
The SRU was established by the German government in 1971, and was therefore one of the
first institutions to provide scientific policy advice to Germany’s environmental policy. The
remit of the Council is to describe and assess the environmental situation and environmental
policy in Germany and their development trends. Its role is to expose misguided eco-political
developments so that they can be avoided or eliminated.
In a public hearing on the CCS law in the Bundestag on 25 May 2009, the SRU criticised the
current draft of the law. Their statement focuses on uncertainties with regard to the scope of
storage capacities and the ecological risks involved in CO2 storage. In addition, the SRU re-
fers to possible alternative uses for CO2 storage sites, including deep geothermal energy,
compressed air and natural gas storage, as well as the high costs of CCS.

Driving forces and attitudes of relevant stakeholders
Wuppertal Institute for Climate, Environment and Energy 107
The SRU rejects the draft law of the former German government, as so many uncertainties
remain. For example, because of these uncertainties, the SRU believes that it would be in-
appropriate and premature to prescribe powers to issue statutory instruments regarding such
important issues as financial security. This would allow decisions on vital issues to be made
without the involvement of parliament.
Additionally, it claims the bill fails to ensure a “strategic and long-term assessment of the
possible conflicts of interest,” (SRU 2009a). Consequently, it would lead to a period of long-
term political inflexibility, since the decision on the type of use for available storage sites sig-
nifies a significant “strategic turning point,” (SRU 2009a). It also criticises that transferring
responsibility for the storage sites after a period of 30 years means shifting the costs to the
affected federal states in northern and eastern Germany, equating to an indirect subsidisa-
tion of CCS operators.
Due to the reservations outlined above, the SRU supports a research law that enables CCS
to be tested in a limited number of demonstration plants. In this way, it wants to avoid making
a sweeping decision on the application of this technology before the opportunities and risks
have been investigated thoroughly. During the negotiations for the coalition agreement of the
new German government, the SRU reaffirmed its previous position on CCS in a letter to the
representatives of CDU/CSU and FDP in the negotiation groups for the economy, the envi-
ronment and energy. The letter states that a new CCS law should make provision for a man-
agement concept for the storage areas. As far as the use of the storage sites is concerned,
the SRU recommends giving priority to CO2 captured from biomass-fired power plants and
industrial processes, as well as to geothermal energy and energy storage over CO2 capture
from power stations (SRU 2009b).
Office of Technology Assessment at the German Bundestag (TAB)
The TAB was established at the German Bundestag in 1990 to create a knowledge base for
research- and technology-related decisions. In November 2007, the Office published a pro-
gress report on the subject of CO2 capture and storage. In addition to greenhouse gas reduc-
tion, the report also focuses on the gentle exploitation of finite resources, economic efficiency
and social aspects (such as public acceptance, dealing with long-term risks) as essential
criteria for the assessment of this technology. There remains a great deal of uncertainty re-
garding these points, which is why the TAB concludes that the current knowledge base is
“nowhere near sufficient for a substantiated assessment of the technical and ecological fea-
sibility of CCS nor can it appraise how this technology can contribute to achieving the goal of
climate protection,” (TAB 2007). It states that it is therefore necessary to close these gaps in
the knowledge. The TAB mainly considers industrial companies to be responsible for re-
search and development in the areas of CO2 capture, CO2 conditioning and CO2 transporta-
tion. The main task of the state is to create reliable legal framework conditions for these ac-
tivities and to carry out research into CO2 storage.
In order to create such a legal framework, the TAB proposes a two-phase procedure. In the
short term, an “interim solution” for assisting the implementation of upcoming CCS projects
should be devised (TAB 2007). At the same time, they believe it essential to devise a com-
prehensive regulatory framework to follow this interim solution once CCS is available on a
large scale.
RECCS plus – Update and Expansion of the RECCS Study
108 Final Report
As far as CO2 storage is concerned, the TAB identifies considerable need for research into
potential competitive uses (for example, natural gas storage or deep geothermal energy) in
addition to issues about CO2 interactions with underground rock and a precise determination
of storage site capacity. At the same time, it stresses that technological research into CO2
capture and storage must be supplemented by social and eco-scientific research. This is
necessary, they say, to facilitate a solid assessment of the economic, ecological and social
impacts of CCS technology. Furthermore, the TAB believes that a nationwide communica-
tion, information and participation strategy should be devised in order to encourage public
acceptance.
German Federal Environment Agency (UBA)
The German Federal Environment Agency, founded in 1974, is Germany’s central envi-
ronmental authority. It offers the German government scientific support, and is responsible
for enforcing environmental laws. In a position paper published in 2006, the UBA advocated
a sustainable climate policy, primarily focusing on converting to renewable energies and en-
hanced energy efficiency. CCS, on the other hand, is classified as being an unsustainable
technology, due to efficiency losses as a result of CO2 capture and the finiteness of CO2
storage site options. The UBA acknowledges, however, that the technology could be neces-
sary as a transitional option if certain basic conditions can be guaranteed, such as a maxi-
mum leakage rate of 0.01 per cent per annum and the development of a sophisticated legal
framework to ensure high standards in storage safety. (UBA 2006)
In May 2009, the UBA published an updated position paper on CCS technology. In this pa-
per, it is also stressed that Germany would be able to achieve its climate protection goals
through considerable energy savings and a consistent use of renewable energies, even
without CCS. CCS is regarded merely as a transitional technology and should be adopted
only if measures to increase energy efficiency and to promote the use of renewables are
unsuccessful. In particular, the UBA highlights the technical uncertainties at all levels of the
CCS process chain and possible conflicting interests with geothermal heat and electricity
production. The Agency therefore advocates creating underground spatial planning to avoid
individual conflicts with regard to the use of geological formations. (UBA 2009a)
German Advisory Council on Global Change (WBGU)
The WBGU was founded by the German government as an independent, scientific advisory
body in 1992. Its principle tasks include analysing and evaluating global environment and
development problems, as well as monitoring and assessing national policies for the
achievement of sustainable development.
In 2006, the WBGU published a special report on the future of oceans, which explored the
warming up and acidification of the oceans (WBGU 2006). In one chapter of the report, the
possibilities of CO2 storage in the ocean and below the ocean floor, as well as the potential,
the costs, risks and legal implementation of these options, are explained and discussed. Due
to the unpredictable impact on the ecosystem, the WBGU categorically rejects storage in the
ocean, for example, by direct injection of the gas or its storage on the ocean floor. The
Council recommends instituting a worldwide ban. The report also points out the futility of
ocean storage of CO2, as it would not reduce the long-term impact of CO2 emissions, due to
the permanent interaction between oceans and the atmosphere.
Driving forces and attitudes of relevant stakeholders
Wuppertal Institute for Climate, Environment and Energy 109
As for CO2 storage below the ocean floor, the report reaches a more differentiated verdict
because the risk of negative environmental impacts is considered to be lower. In view of the
rapidly increasing demand for energy in developing and emerging countries, the WBGU con-
siders this method of CO2 storage to be a possible transition technology, complementing
more sustainable CO2 reduction strategies. The report points out, however, that the promo-
tion of CCS technology by politicians and business should not result in renewable energies
and energy efficiency being sidelined. Furthermore, it recommends regulating the use of the
technology through a legal framework and restricting it to a limited period of time (for exam-
ple, a few decades).
In summary, this analysis shows that that advisory committees to the German government
mainly have a negative attitude towards CCS technology. SRU, TAB, WBGU and UBA high-
light the major uncertainties associated with the use of the technology, in particular its stor-
age, and warn against hasty strategic decisions being made. In addition, they believe the
technology must not impede the development of renewable energies and the enhancement
of energy efficiency. The UBA, in particular, classifies CCS as unsustainable within the defi-
nition of sustainable development. On the other hand, the German Council for Sustainable
Development advocates taking a leading role in the development of CCS to facilitate the sus-
tainable use of coal.
5.5 Science
Öko-Institut e.V.
In the public hearing at the Bundestag, the Öko-Institut declared CCS technology to be an
“important CO2 reduction option ... – not only globally, but by all means also for Germany,”
(Matthes et al. 2009). The potential fields of application are regarded as being not only the
power plant sector, but also the avoidance of CO2 from industrial sources, such as the steel
industry, cement manufacturing and the chemical industry. The Institute emphasises that
CCS should be classified as a “multi-use option”, because it is essential for reducing in-
dustrial process emissions both nationally and internationally in order to achieve the 2°C tar-
get. In Germany, process emissions amount to 80 million, and 2.5 billion tonnes per annum
worldwide (Energiewirtschaftliche Tagesfragen 2009). This is equivalent to a share of 9 per
cent in Germany’s total energy-induced CO2 emissions. Globally, the share constitutes about
8 per cent (BMWi 2009b).
The Öko-Institut basically supports the creation of a long-term regulatory framework, includ-
ing a revision clause introduced by the German government. The Institute, however, criti-
cises many detailed aspects of the law. For example, the draft law does not include sufficient
elements for investigating and solving long-term competitive uses, nor is there an instrument
for devising a comprehensive CO2 transport infrastructure. They insist that both of these is-
sues must be taken into consideration in an amendment of the law in 2015. They also rec-
ommend ensuring sufficient timely information and public participation to avoid acceptance
problems at the storage sites.
Other sections of the draft law, such as the transfer of responsibility for CO2 storage sites to
the federal states after 30 years and obligations to provide financial security, are viewed as

RECCS plus – Update and Expansion of the RECCS Study
110 Final Report
positive. In addition to national regulations, the Öko-Institut proposes devising programmes
to initiate a transfer of knowledge with regard to CCS regulation (Öko-Institut 2009).
Potsdam Institute for Climate Impact Research (PIK)
Represented by Professor Hans-Joachim Schellnhuber, Director of the Institute, and his
deputy Professor Ottmar Edenhofer, PIK has repeatedly referred to the use of CCS technol-
ogy as a precondition for achieving the 2°C target. According to Edenhofer, an ambitious
climate policy without CCS would require a rapid withdrawal of the use of coal. This would
mean, however, that the abundant coal reserves of the world’s largest CO2 emitters, such as
China, the USA and India, would be devalued and these countries would not participate in an
international agreement on climate protection (TAZ 2009).
PIK further argues that CCS is not only significant in terms of coal use, but could also be
applied in combination with biomass combustion. If CO2 is emitted during the combustion of
biomass, negative emissions would occur, as energy from plants can basically be used in an
emission-neutral way, due to their ability to bind carbon. The application of biomass CCS
systems, they explain, is especially necessary with regard to ambitious climate protection
routes that require a greenhouse gas concentration of 400 ppm in the atmosphere to meet
the 2°C target. PIK therefore requests the use of the limited resources to store CO2 for bio-
mass CCS processes, since this is the only way to achieve negative emissions (Edenhofer et
al. 2009). The Institute also recommends introducing a scarcity price for the use of under-
ground storage sites to ensure their maximum efficiency in terms of time and sectoral use.
Edenhofer supports the creation of demonstration power stations to illustrate technical and
economic feasibility, ecological effectiveness and, in particular, the social acceptance of the
technology.
Forschungszentrum (FZ) Jülich
Under the umbrella of Forschungszentrum Jülich, various institutes are working on the topic
of CCS. The subjects range from the development of new technologies for CO2 capture and
assessing the energy-efficiency and environmental impacts of the technology. In model cal-
culations on energy and climate policy, FZ Jülich concludes that CCS technology may play
an important role within a cost-optimal climate protection strategy for Germany. Assuming
that CO2 can be reduced by 40 per cent by 2030 compared with 1990 levels, cost savings
will amount to " 20 billion between 2020 and 2030, thanks to the use of CCS (Martinsen et
al. 2006). The scenario calculations assume that CCS will be marketable from a price of " 30
per tonne of avoided CO2.
Institute for Futures Studies and Technology Assessment (IZT)
IZT is a non-profit research institute that devises technology assessment scenarios used to
shape recommendations for politicians, business and civil society. Professor Rolf Kreibich,
Director of the Institute, clearly spoke out against the use of CCS technology at an aware-
ness raising event on CCS in Schleswig-Holstein. He argued that it leads to a significant in-
crease in demand for primary energy for fossil fuel-fired power plants and also generates
high costs, whilst the benefits of achievable capture rates and levels of efficiency are still
largely unknown. Furthermore, unpredictable risks in the storage areas were involved, since
large-scale CO2 storage was associated with “totally unknown impacts, impermeabilities,
investigations, monitoring, possible accidents, environmental impacts and health hazards.”

Driving forces and attitudes of relevant stakeholders
Wuppertal Institute for Climate, Environment and Energy 111
Ultimately, CCS would prolong the use of central, fossil fuel-fired large power plants and
drain funds required for promoting renewable energies (IZT et al. 2009).
In summary, it can be said that German research institutions take an ambivalent stance to-
wards CCS technology. PIK and Öko-Institut regard CCS as a necessary climate protection
option that should be employed in certain sectors (such as heavy industry) or countries (such
as China and India) where otherwise it would be difficult to achieve reductions in CO2 and
the associated structural change. FZ Jülich considers CCS to be an important option for
Germany, too, whereas this technology is generally rejected by IZT.
5.6 Summary assessment of the attitudes of relevant stakeholders
In recent years, the number of players involved in the public debate on CCS has steadily
grown. In 2007, mainly utility companies and environmental organisations were involved in
the public debate, and it was given only brief coverage in the media. Today, the issue ignites
diverse debate across a whole spectrum of social, economic and political groups.
The topics on CCS technologies now being debated are much more focused. While in 2007
discussions mainly addressed the technical and economic feasibility of the technology, there
is now much broader and more open exchange on the topic, involving advanced aspects,
such as potential competitive usages with other technologies and liability issues. Reports on
CCS are no longer restricted to the context of coal-fired power plant technologies. It is no-
ticeable that greater attention is now being paid to industrial applications of the technology as
an option to reduce process emissions. The technology is also being mentioned more fre-
quently in the context of biomass use. In Germany, the focus is primarily on the technical
advancement of CCS technologies; most stakeholders believe that these technologies are
best implemented and applied in the aspiring industrial nations that have considerable de-
posits of coal (such as China and India).
The growing expertise about CCS technologies goes hand in hand with stakeholders adopt-
ing increasingly strong positions. One specific aspect of this debate, however, remains con-
stant: the opinions and attitudes on the subject of CCS are strongly divided between its op-
ponents and supporters, sometimes even within the same groups (for instance, envi-
ronmental NGOs and science). Fig. 5-1 summarises where stakeholders are positioned on a
continuum between endorsement and rejection, based on their formal statements and opin-
ions.11
11 The individual stakeholders were classified by a purely qualitative analysis. Fundamental statements on CCS technologies by the stakeholders were decisive for their classification.
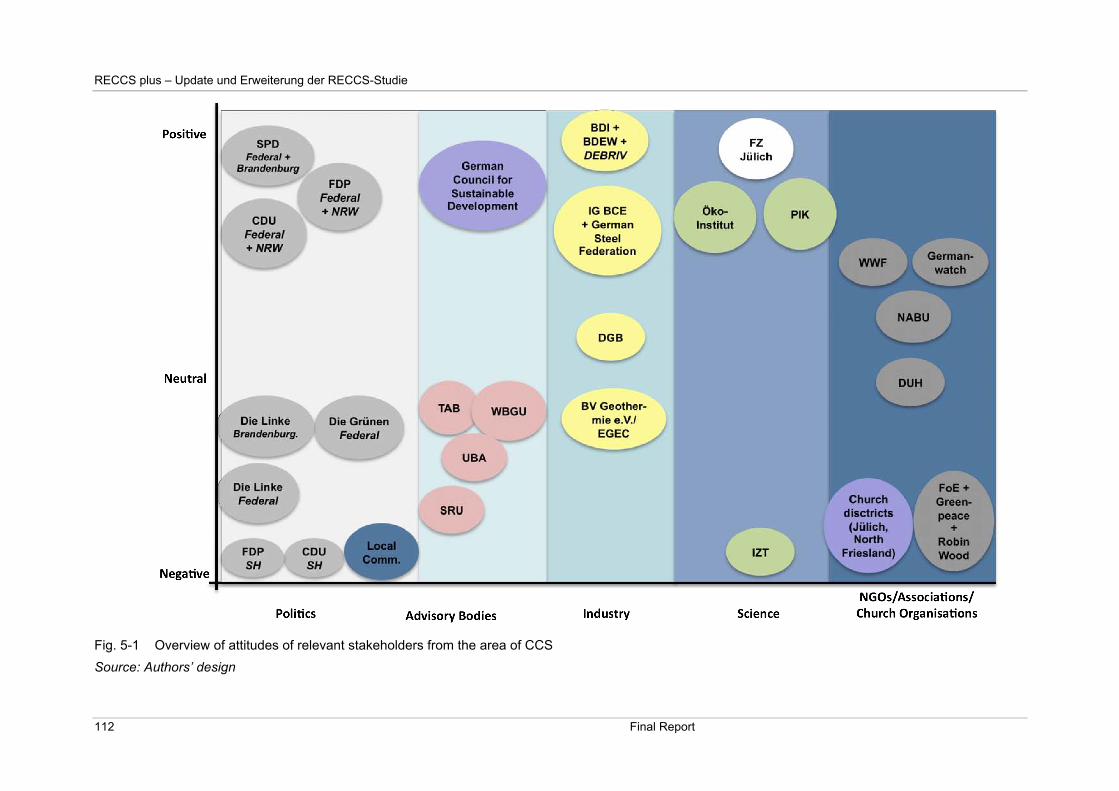
RECCS plus – Update und Erweiterung der RECCS-Studie
112 Final Report
Fig. 5-1 Overview of attitudes of relevant stakeholders from the area of CCS
Source: Authors’ design
Legal aspects of introducing CCS to power plant technology
Wuppertal Institute for Climate, Environment and Energy 113
6 Legal aspects of introducing CCS to power plant technology
The political, socio-economic and legal aspects of CCS have been at the forefront of national
and international discussions since the publication of the IPCC Special Report on Carbon
Capture and Storage in 2005. Prior to this, much of the debate had been focused on the en-
gineering, economic, geological and geotechnical aspects of CCS. Following the publication
of this Report, it soon became clear that the existing legal framework was inadequate for:
• establishing the legal and investment security for project organisers essential for invest-
ments in R&D and
• accurately assessing the hazards and risks involved, particularly in the permanent stor-
age of CO2, in the final stage of the CCS process. This has to be assessed alongside a
sufficient storage duration required to have an impact on climate.
This appreciation of these shortcomings in the legal framework did not apply to German law
alone (Dietrich 2007, Grünwald 2007), but also to the existing legal frameworks of other EU
Member States, as well as European law and international agreements (IEA 2005, Hendriks
et al. 2005).
Rapid changes were made to European law to support the political targets for dramatic re-
ductions in CO2 emissions to mitigate global climate change. A viable legal framework for the
CCS process to be able to make an impact on climate and the environment had to be de-
vised. Directive 2009/31/EC of the European Parliament and of the Council of 23 April 2009
on the geological storage of carbon dioxide and amending other legal acts (for short: CCS
Directive 2009/31/EC) came into effect on 25 June 2009. Now the same standards apply
throughout the Community with regard to the requirements governing CCS technology. For
the CO2 capture and transport processes, the Directive partially relies on existing provisions.
However, an entirely new legal order has been created for the final step: the permanent stor-
age of CO2. Consequently, legal developments in the Member States appear to be inevitable
where they decide in favour of regulating and deploying CCS technology in their own sover-
eign territories.
The central legal aspects regarding the use of CCS technology are classified as follows:
• legal framework for CCS technology at the level of European law
• legal framework of international agreements
• developments outside the EU using the example of the U.S. State of Wyoming and the
Australian State of Victoria
• implementation in other EU Member States, using the example of the Netherlands and
Poland
• legal framework for CCS technology in Germany (merely a summary of the German part
of the report).

RECCS plus – Update and Expansion of the RECCS Study
114 Final Report
The scope of this analysis is not to cover all conceivable technical processes and options for
CCS use. Instead, the report focuses on the use of CCS technology in fossil fuel-fired power
plants.
6.1 Legal framework for CCS technology at the level of European law
6.1.1 Developments
The second phase of the European Climate Change Programme (ECCP II) was launched in
February 2005 by the Communication from the Commission entitled “Winning the Battle
Against Global Climate Change”.12 This was to form the basis for future EU climate policy. At
the same time, a working group to investigate “Carbon Capture and Geological Storage
(CCS)” was established.13 Besides assessing its potential, this Working Group III was to de-
velop economic aspects and the risks involved in CCS technology and, in particular, the
need for regulatory action. It was also given the task of describing and exploring the core
elements of a suitable legal framework for the development of the environmentally safe use
of CCS technology. In the Final Report of Working Group III, presented in June 2006, it was
concluded that there was a substantial need for judicial regulation. In addition, the Commis-
sion was requested to change the role of CCS through the authority of European law, in par-
ticular with regard to water and waste law, to create a clear political and legal framework for
the use of CCS and to remove existing legal obstacles (ECP II 2006).
In the communication “Limiting Global Climate Change to 2 Degrees Celsius – The way
ahead for 2020 and beyond” of 10 January 2007, the EU Commission stressed that CCS
technology should be viewed as a future option to enable the continued use of fossil fuels.14
In its communication “Sustainable power generation from fossil fuels: aiming for near-zero
emissions from coal after 2020” released on the same day, it emphasised that a legal and
political framework for CCS should be created in the EU. In addition, obstacles within existing
laws should be removed to enable CCS to be used in an environmentally friendly, safe and
reliable manner, and to set suitable incentives for the use of CCS.15
In compliance with the request by the European Council of March 200716 to create the ne-
cessary legal framework, the EU Commission presented its much-publicised draft of a Cli-
mate and Energy Package on 23 January 2008 (see also Fig. 2-2). A main element of the
legislative package was the Commission’s proposal for a directive on the geological storage
of carbon dioxide and for amending Council Directives 85/337/EEC and Directives
2000/60/EC, 2001/80/EC, 2004/35/EC, 2006/12/EC and Regulation (EC) No. 1013/2006.17
After consultations, hearings and obtaining the necessary position statements, the European
12 COM(2005)0035.
13 Accepted Final Report of Working Group III (Carbon Dioxide Capture and Storage) of 1 June 2006, Euro-
pean Climate Change Programme II (ECCP II).
14 COM(2007)0002, p. 29.
15 COM(2006)0843, p. 9 f.
16 Council document 7224/07.
17 COM /2008/0018 final Directive 85/337/EEC (EIA Directive); Directives 2000/60/EC (Water Framework Di-
rective), 2001/80/EC (LCP Directive), 2004/35/EC (Environmental Liability Directive), 2006/12/EC (Waste
Framework Directive) and Regulation (EC) No. 1013/2006 (Shipments of Waste).

Legal aspects of introducing CCS to power plant technology
Wuppertal Institute for Climate, Environment and Energy 115
Council adopted the now modified CCS Directive on 6 April 2009. The CCS Directive
2009/31/EC was published in the Official Journal of the European Union on 5 June 2009, and
came into effect on 25 June 2009, twenty days after its publication.18 The CCS Directive
(2009/31/EC) must be transposed by Member States by 25 June 2011. In addition to the
CCS Directive 2009/31/EC, another Directive equally significant to the regulation and future
development of the CCS process came into force at the same time as part of the EU Climate
Pact. This was Directive 2009/29/EC of the European Parliament and of the Council of 23
April 2009, amending Directive 2003/87/EC. The purpose of this Directive is to improve and
extend the greenhouse gas emission allowance trading scheme of the Community.19 A deci-
sive expansion of the emission trading scheme contained within it is that all activities along
the CCS chain will be included in European emissions trading.
6.1.2 Regulatory framework of the CCS Directive (2009/31/EC)
The CCS Directive (2009/31/EC), which extends Article 175 of the Treaty establishing the
European Community, is divided into a total of eight Chapters with 41 Articles, and contains
two Annexes. In regulating the CCS process, European legislators, and now national legisla-
tors (Grünwald 2007, Dietrich 2007, Schulze et al. 2008), faced the question of whether the
total process, which could mainly be divided into three steps, should be codified in a directive
of their own or whether the various steps should be integrated into existing legal acts. With
the CCS Directive (2009/31/EC), European legislators decided to regulate the safety and
environmental requirements involved in CO2 storage in a new, separate directive. The cap-
ture and transport of CO2, on the other hand, are mainly represented in existing European
legal acts.
The CCS Directive (2009/31/EC), in which CO2 storage is comprehensively regulated, is,
therefore, of central importance to the future regulation of CO2 storage by Member States. In
view of the risk and hazard potential involved in CO2 storage, it is the fundamental responsi-
bility of the law, and its legislators, to provide the instruments necessary to guarantee the
highest level of safety as well as security for investment and planning (as described by
Schulze et al. 2008). With these objectives in mind, the Directive was to provide a detailed
web of regulations on the operation, closure and responsibility for storage sites, as well as for
post-closure obligations for plants to secure the permanent fate of the CO2 injected into stor-
age sites (compare Doppelhammer 2008, Dietrich and Bode 2008, Hellriegel 2008, Radgen
et al. 2009, Viebahn and Luhmann 2009). It is also significant that CCS technology is classi-
fied by European legislators as a so-called “bridging technology” to mitigate climate change,
use of which should not, however, serve as an incentive to increase the share of power
plants fired with conventional fuels. In addition, the development of CCS should not lead to a
reduction in efforts to support energy-saving policies, renewable energies and other safe and
sustainable low carbon technologies, both in research and financial terms (compare Recital 4
of the CCS Directive (2009/31/EC)). Thus, at least in this transition period for energy supply,
the “bridging period”, CCS technology is equal to other climate protection technologies, in the
sense of consolidating and securing energy supply with conventional fuels. The remarks
18 OJ L. 140 of 5 June 2009, p. 114.
19 OJ L. 140 of 5 May 2009, p. 63.
RECCS plus – Update and Expansion of the RECCS Study
116 Final Report
made in Recital 4 of the Directive show that the share of conventional fuels in the energy mix
should not be increased through the use of CCS technology.20
6.1.2.1 Subject matter, scope and definitions
Chapter 1 (Articles 1 to 3) of the CCS Directive (2009/31/EC) refers to the subject matter and
scope, and contains numerous definitions. In keeping with the political aim, the content of the
Directive is to establish a legal framework for the capture, transport and – and this is where
the focus of the regulation lies – environmentally safe geological storage of carbon dioxide to
contribute to the fight against climate change (Article 1(1)). The purpose of the environmen-
tally safe geological storage of CO2 is the permanent capture of CO2 so that it prevents nega-
tive effects and any risk to the environment and to human health (Article 1(2)). According to
Article 2 of the Directive, the geographic scope of the storage of CO2 applies to the territory
of the Member States, their exclusive economic zones and their continental shelves. Fur-
thermore, the Directive may not be applied to R&D projects (intended storage <100 kt
CO2/a). Also, storage in formations extending beyond the territory of the Member States is
prohibited, as is the storage of CO2 in the water column21.
It is important to understand the definition of “storage” in this context. The injection of CO2
with the intention of permanently containing it in geological formations does not constitute
storage from a legal perspective, at least with the intended volumes involved in large-scale
use. Such storage always presupposed a reuse of the deposited substance. In legal terms,
injecting CO2 into geological formations without a practical application for its reuse, thus
permanent retention in formations, constitutes a deposit. Nonetheless, the term “storage” is
still used in the definitions contained in Article 3 to describe the deposit of CO2. This blurring
of terms is regrettable, but cannot be changed at the level of European law now that the CCS
Directive (2009/31/EC) has come into effect. Also, the term “Carbon Capture and Storage”
has already become widespread and established in the English language (compare also
Dietrich and Bode 2005). Furthermore, the official German translation of the Directive also
uses the word Speicherung (storage) throughout.
6.1.2.2 Exploration permits: requirements and conditions for granting permits
Chapter 2 (Articles 4 and 5) determines the basic requirements for the selection of storage
sites (Article 4) and the conditions for granting exploration permits (Article 5). According to
Article 4(1), Member States shall retain the right to determine the areas from which CO2 stor-
age sites may be selected and – for competence reasons – Member States have the right
not to facilitate storage in parts or in the whole of their sovereign territory. Member States
that intend to allow the geological storage of CO2 in their territory must undertake an as-
sessment of the storage capacity available. For this purpose, a permit for reconnaissance
and exploration (“exploration permit”) may be granted.
20 Since CO2 capture leads to an 18–32% increase in consumed fuels (depending on the technology) (see Tab.
10-1), this would signify a corresponding reduction of fossil fuel-fired power plants in the European energy
mix on the same scale.
21 However, this does not apply to parts of the North Sea situated beyond the territories of the EU Member
States. For this area, tacit agreement has been reached that such areas can be used as storage formations.

Legal aspects of introducing CCS to power plant technology
Wuppertal Institute for Climate, Environment and Energy 117
The suitability of a geological formation for use as a storage site should be determined
through assessing the characteristics of the potential storage complex and surrounding area
according to Article 4(3) in connection with Annex I of the Directive using the three-step pro-
cedure contained within it. Annex I sets out very detailed requirements for the suitability test
of storage sites. For instance, activities around the storage complex that may conflict with it
(exploration, production and storage of hydrocarbons, geothermal use of aquifers and use of
underground water reserves) must be documented, and extensive geological and geophysi-
cal data of the storage complex must be collected. According to Article 3(6), the storage
complex means the storage site and surrounding geological domain which can have an ef-
fect on overall storage integrity and security (that is, secondary capture formations). On the
other hand, according to Article 3(3), storage site means a defined volume area within a geo-
logical formation used for the geological storage of CO2 and associated surface and injection
facilities (for the geological background, see also Section 7.2.2).
In Article 5, provision is made for exploration to be subject to a permit requirement in national
law, insofar as the Member State considers exploration to be necessary prior to storage. No
such exploration may take place without an exploration permit. Furthermore, these explor-
ation permits may only be granted for the storage of a limited volume of CO2, and for a lim-
ited period which, however, can be extended. To ensure investment security, the holder of an
exploration permit is granted the exclusive right to explore the potential storage complexes.
Member States should ensure that no conflicting usages of the storage complex are allowed
during the validity period of the permit. Assuming that the large-scale implementation of CCS
technology takes place, this exclusive right granted to exploration permit holders is likely to
cause problems for them and for national decision-makers responsible for approving applica-
tions for permits. This is due to aspects of not only competition law, but also legislation sur-
rounding the awarding of contracts. In the event of there being several applicants for a suit-
able storage location, a legally secure allocation of the often limited capacities must take
place, in view of the high investments involved (compare Viebahn and Luhmann 2009).
There are no explicit guidelines in the Directive for national authorities regarding the criteria
for such decisions and their weighting, which leaves it up to the Member States to determine
the form they will take. Concrete implementations will reveal which instruments and policies
the Member States will use to ensure a legally secure “allocation of capacities”. This issue,
and the issue of third-party access to the limited capacities, will be explored in further detail
in Section 6.1.2.5.
6.1.2.3 Storage permits: requirements and conditions for granting permits
The conditions and requirements for granting storage permits are defined in Chapter 3 (Arti-
cles 6 to 11). According to Article 6(1), Member States must ensure that no storage site is
operated without a storage permit; that there should be only one operator for each storage
site; and that no conflicting uses are permitted on the site. Member States must ensure that
the procedures for granting storage permits (the same applies to exploration permits) are
open to all legal entities possessing the necessary capabilities and that the permits are
granted on the basis of objective, published and non-discriminatory criteria. This exclusive
right of use granted to the holder of an exploration permit is continued in the process for the
storage permit, in accordance with Article 6(3), where it is stated that:

RECCS plus – Update and Expansion of the RECCS Study
118 Final Report
• priority for the granting of a storage permit for a particular site shall be given to the
holder of the exploration permit for that site, provided that the exploration of that site is
completed, that any condition set in the exploration permit has been complied with, and
that the application for a storage permit is made during the period of validity of the ex-
ploration permit and
• Member States shall ensure that no conflicting uses of the complex are allowed during
the permit procedure.
For the holder of an exploration permit, this means an exclusive right of use to the explored
geological formations, usually associated with high investment expenditure. Complications
regarding competition law and contract awarding laws can also be expected in connection
with granting storage permits, following the procedure for granting exploration permits. These
issues will have to be solved with explicit guidelines in the regulations by the Member States,
as well as learning by experience from the actual large-scale implementation of CCS (for
conceivable conflicts of use, compare Dietrich and Schäperklaus 2009, SRU 2009a).
In addition to the usual documents (name and address of the potential operator, proof of
technical competence), applications for storage permits must also include: an evaluation of
the storage site and storage complex, an assessment of the expected security of the site,
details of the intended quantity to be injected, the prospective sources of CO2, the compo-
sition of the CO2 to be stored, the intended injection rates and pressures, and the location of
injection facilities. Further documents required in the application process are a description of
measures to prevent significant irregularities,22 a proposed monitoring plan (Article 13(2)), a
proposed corrective measures plan (Article 16(2)), a provisional post-closure plan (Article
17(3)) and the results of the environmental impact assessment (EIA) carried out in accord-
ance with Article 5 of the EIA Directive (85/337/EEC). Finally, proof that financial security will
be valid and effective prior to starting the injection process must also be enclosed with the
application. Articles 8 (Conditions for storage permits) and 9 (Contents of storage permits)
regulate the conditions that must be satisfied in order for a storage permit to be granted and
the contents that should be included in the permits. Some of the content-related require-
ments governing storage permits correspond to the requirements for exploration permits.
Others extend beyond the requirements for exploration permits.
It is particularly worth noting the review of draft storage permits by the Commission in Article
10, which may issue a non-binding opinion on them. This review must be taken into account
by the national authorities when issuing permits. Since, however, it is merely a non-binding
opinion, national authorities may decide against the opinion of the Commission and should
support this with a statement justifying this decision. Unlike with the Commission’s draft, the
adopted Directive clarifies the fact that it is a non-binding opinion, meaning that the obligation
to participate is now reconcilable with the subsidiarity principle.23 Hence the “two-man rule”
applies with regard to individual cases.
22 According to Article 3(17), ‘significant irregularity’ means any irregularity in the injection or storage oper-
ations or in the condition of the storage complex itself, which implies the risk of a leakage or risk to the envi-
ronment or to human health.
23 In its Resolution of 14 March 2008, Bundesrat Publication 104/08, No. 15, the Bundesrat rightly spoke out
against the powers of decision provided for in the Commission’s draft (Articles 10 and 18 of the Draft) be-

Legal aspects of introducing CCS to power plant technology
Wuppertal Institute for Climate, Environment and Energy 119
The highly hazardous potential of CO2 storage is taken into account in Article 11. If a granted
permit is given the right to proceed, this is considerably restricted by precautionary powers of
intervention for the authority substantiated by the precautionary principle. The operator must
inform the competent authority of any changes planned in the operation of the storage site;
major changes must be approved. The granting of these retrospective powers of intervention
are called upon, and common legislative practice in the applicable law, in the event of there
being potentially hazardous installations simply on the grounds of constitutional law (the
state’s duty of protection). In addition, the competent authority shall review the storage permit
five years after issuing the permit and every ten years thereafter, without prejudice to any
further conditions. If any leakages occur or had occurred previously, if conditions of the per-
mit are not observed or are breached, or if it appears necessary on the basis of subsequent
scientific findings and technological progress, the competent authority can adjust the storage
permit to the altered circumstances or even withdraw the storage permit, depending on the
extent of the damage, danger or severity of the breach.
6.1.2.4 Operation, closure and post-closure requirements
The requirements governing the operation, closure and post-closure obligations are set out in
Chapter 4 (Articles 12 to 20). Article 12 determines that the CO2 to be stored shall “consist
overwhelmingly of carbon dioxide”, for which reason no waste or other matter may be added
for the purpose of disposing of that waste or other matter. As a criterion for the acceptance of
a CO2 stream, i.e. of CO2 originating from CO2 capture, it was proposed in the Report of the
Environment, Public Health and Food Safety Committee (ENVI) to replace the general word-
ing “overwhelmingly of carbon dioxide” with a more specific definition – that “a CO2 stream
should consist of at least 95 per cent carbon dioxide and should not contain any corrosive
substances such as H2S or SO2”. It was also proposed to adjust these requirements to the
composition within the review process, should future scientific findings require an adjust-
ment.24 This proposal for an amendment, which would have gone beyond the degree of pu-
rity of at least 90 per cent previously discussed in this respect, was much criticised for many
reasons (for example, Radgen et al. 2009; compare also Hellriegel 2008a). As a result, the
general clause-like specification already stated in the Commission’s proposal – “overwhelm-
ingly of carbon dioxide” – in connection with the option granted to the Commission to issue
specific guidelines on the determination of the purity criteria on a case by case basis,
became part of the Directive. As long as no criteria are issued by the Commission, the Mem-
ber States have some scope within this to determine specific requirements governing the
CO2 stream.
It is also set out that the operation of the storage site must not have a negative impact on its
integrity: there should be no significant risk to the environment or to human health, and no
other requirements of applicable Community legislation should be breached. Furthermore,
there are some very detailed regulations regarding the monitoring of the installations by the
Member States. Monitoring must be based on a monitoring plan that is updated and ap-
cause “such involvement by the Commission in the administrative implementation … (contradicts) the sub-
sidiarity principle.” See also (Dietrich and Bode 2008).
24 ENVI, Compromise and consolidated Amendments 1-27 to the geological storage of carbon dioxide and
amending Council Directives, 6 October 2008, (PE407.716v01-00).

RECCS plus – Update and Expansion of the RECCS Study
120 Final Report
proved at regular intervals (Article 13(2) in connection with Annex II). Non-routine inspections
are also permitted (Article 15). Operators are also obliged to draw up reports (Article 14).
Safety procedures must be carried out in the event of leakages or significant irregularities
(Article 16).
Articles 17 to 21 contain the provisions governing closure and post-closure, the transfer of
responsibility and the financial security arrangements. As has already been mentioned, these
must be proved when submitting the application.
The requirements and conditions for the closure of a storage site are determined in Article
17, which states that a storage site shall be closed:
• if the relevant conditions stated in the permit have been met (a)
• at the substantiated request of the operator, after authorisation of the competent auth-
ority (b) or
• if the competent authority so decides after the withdrawal of a storage permit pursuant to
Article 11(3) (c).
As a matter of principle, the operator is generally responsible for the storage site even after
its closure up until the time when the responsibility is transferred to the competent authority
(compare Article 18, see below for further information). The post-closure obligations must be
fulfilled according to a post-closure plan. This plan is to be designed by the operator based
on Annex II No. 2 of this Directive, whereby the preliminary post-closure plan, which must be
updated and approved by the competent authority, forms the basis of the final post-closure
plan, which also requires approval. Exceptions to these procedural requirements exist in the
event of an officially ordered closure of a storage site by the competent authority (compare
Article 17(4) and (5)).
After a storage site has been closed, Article 18 gains special significance. Article 18 deter-
mines the conditions for transfer of responsibility for decommissioned storage sites. Where a
storage site has been closed in accordance with points (a) or (b) of Article 17(1), all legal
obligations laid down in this Directive and other European legal acts shall be transferred to
the competent authority on its own initiative or upon request from the operator. This is pro-
vided that “all available evidence indicates that the stored CO2 will be completely and per-
manently contained,” that a minimum period (no less than 20 years), to be determined by the
competent authority, has elapsed, that the financial obligations have been fulfilled, the site
has been sealed and the injection facilities have been removed.25 The 20-year deadline is
the minimum period. The period may only be less than 20 years if certain conditions are met.
Longer periods, on the other hand, are possible.
The operator must prepare a report and submit it to the competent authority for the latter to
approve the transfer of responsibility. This report must demonstrate that the injected CO2 has
been completely and permanently contained. The actual behaviour of the injected CO2 must
conform with the modelled behaviour, no leakages should be detected and the storage site
25 Interestingly, there was no debate at the European level on whether the period of generally at least 20 years
after the closure before responsibility may be transferred suffices to comply with the polluter pays principle
applicable in European law. The debate was all the more heated in Germany, for instance, in discussions on
the CCS law to be enacted.

Legal aspects of introducing CCS to power plant technology
Wuppertal Institute for Climate, Environment and Energy 121
must be in a state of long-term stability. In this context, it must be pointed out that, due to a
current lack of knowledge, it cannot be forecast for certain whether and when a storage site
complies with the criterion of being completely and permanently contained, and what time
period should be applied for long-term capture (compare the associated economic implica-
tions in Bode and Dietrich 2008). The Directive does not yet provide a specific guideline for
the Member States and the competent national authorities to follow in the implementation of
this undefined category. However, the Commission is given the option in Article 18(2)(2) of
adopting guidelines on the assessment of the factors based on which operators have to
prove that the CO2 has been completely and permanently contained. For legal and invest-
ment safety reasons alone, and with the goal of achieving standard legal practice throughout
as much of Europe as possible, it is to be hoped that the Commission will soon make use of
the option granted to it.
Until such guidelines are issued, the IPCC Guidelines for National Greenhouse Gas Inventor-
ies from 2006 may act as a useful guide (IPCC 2006).26 Where the competent national auth-
ority is satisfied that the CO2 has been completely and permanently contained, it can prepare
a draft decision of approval of the transfer of responsibility. In accordance with the Directive,
the Commission does not only have a representative position with regard to the creation of
uniform administrative standards in the procedure for the transfer of responsibility. On the
contrary, the competent national authorities must present both the mandatory operator’s re-
port about the complete and permanent capture of the CO2 and the draft decision of approval
of the transfer of responsibility to the Commission, along with other associated documents to
enable the Commission to exercise its right to issue an opinion on the specific case. Here
again, therefore, the “two-man rule” is applied. Conformity with European primary law is
guaranteed since, although the opinion of the Commission must be observed in the decision
taken by the nation state, the Commission’s opinion is not binding for the competent national
authorities.
The regulations concerning financial security and the financial mechanisms determined in
Articles 19 and 20 are of central importance to closure, post-closure and the transfer of re-
sponsibility. The instrument of the provision of financial security is not new, and has often
been used in legislation for potentially hazardous environmental uses, such as in the area of
waste legislation, implemented by the polluter pays principle. By requiring financial security,
the risk to the general public of shouldering the costs incurred through insolvency is averted
(Dietrich and Bode 2008, Dietrich 2007).
In accordance with Article 19, the Member States must ensure that proof of adequate finan-
cial security can be established by the potential operator as part of the application for a stor-
age permit. This safeguard is to ensure that all obligations arising from the operation of the
storage site can be met. This financial security should not only be proved, but also valid and
effective before injection work begins. Financial security should remain valid and effective
until the responsibility for the storage site is transferred to the competent authority after its
closure. The Directive does not contain any additional criteria that would cause the financial
security to be used for obligations laid out in this Directive and obligations arising through the
inclusion of the storage sites in the emissions trade. Consequently, a certain amount of inse-
26 Compare also (Bode and Dietrich 2008).

RECCS plus – Update and Expansion of the RECCS Study
122 Final Report
curity remains that can only be resolved at Member State level by developing revised admin-
istrative or legal practices. Article 19(2) allows a periodical adjustment of financial security.
The Article states that this is to “take account of changes to the assessed risk of leakage and
the estimated costs of all obligations arising under the permit issued pursuant to this Direc-
tive as well as any obligations arising from inclusion of the storage site under Directive
2003/87/EC.”
Therefore, it becomes clear that the risk of leakage must also be assessed when calculating
and costing financial security. There are a number of factors involved in the process of calcu-
lating financial security. Firstly, there is the inclusion of potential requirements, such as the
obligation to return CO2 allowances initially generated for CO2 storage. A second factor which
causes uncertainty for investment projects is that the price for allowances is determined by
the market and is vulnerable to considerable fluctuations. Therefore, the cost of the security
can vary significantly and may need to be adjusted.
Finally, according to Article 20, Member States must ensure that the operator, on the basis of
arrangements to be decided by the Member States, makes an additional financial contribu-
tion to the competent authority before the transfer of responsibility of the storage site, in ac-
cordance with Article 18, has taken place. The amount of the operator’s contribution to cover
any costs that may arise to ensure the permanent capture of the CO2 in the storage site
should take into account those criteria referred to in Annex I on the characterisation and
(risk) assessment of the storage site. Also the elements relating to the history of storing CO2
relevant to determining the post-transfer must be taken into account. Furthermore, the antici-
pated cost of 30 years of post-closure monitoring must be included in the security amount.
As a result, the criteria for the precise calculation of the amount is formulated in a general
way and is not very precise. However, the Commission may adopt guidelines for estimating
the security amount. This would be developed in consultation with Member States with the
aim of ensuring transparency and predictability for operators. The adoption of uniform stand-
ards in this area seems to be pertinent in view of the general criteria given to date, in order to
create better investment security for businesses.
6.1.2.5 Third-party access to the infrastructure facilities
Chapter 5 of the Directive (Articles 21 and 22) regulates the requirements with regard to ac-
cess to the CO2 transport network and to the storage sites, and how they should be met by
the Member States. These regulations appear to be essential to avoid unfair competition, not
least against the varied background of the restricted storage capacities in Member States,
the exclusive rights of use granted to the holder of a storage permit and the fact that the con-
struction of a CO2 transport infrastructure will involve high investment expenditure. Accord-
ingly, the right of access to transport and storage capacity is formulated in Article 21(1). This
access must be shaped and provided in a transparent and non-discriminatory manner de-
termined by the Member State according to the objectives of fair and open access. However,
the right of access is not unlimited. For example, access may be refused where there is in-
compatibility in the technical specifications of the installations which cannot be reasonably
overcome or on the grounds that the transport networks or the storage sites are inadequate.
Member States must ensure that any operator who refuses access because of shortcomings
in capacity or in transport connections takes the necessary measures to guarantee access to

Legal aspects of introducing CCS to power plant technology
Wuppertal Institute for Climate, Environment and Energy 123
the site. However, this obligation is restricted since such improvements should be “economi-
cally beneficial”. If they are not, then the costs of these improvements should be borne by the
potential customer. It is incumbent upon the Member States to devise the specific regulatory
framework, whereby the nation state’s design may draw on existing and transferable experi-
ence within the area of access to natural gas transport and storage capacities (Viebahn and
Luhmann 2009, Dietrich 2006).
6.1.2.6 Amendments of existing legal acts, general and final provisions
One of the aspects of Chapter 6 (Articles 23 to 30) is that, in the spirit of cross-border co-
operation, the competent authorities must publish a “storage register”. Additionally, Member
States must make information available to the public relating to the implementation of this
Directive. Corresponding necessary amendments or alterations to other existing legal acts of
the EC are set out in Chapter 7 of the Directive (Articles 31 to 37). Due to the amendments,
the procedural steps involved in capturing and transporting CO2, the risk potentials of which
only differ slightly to industrial processes that are already practiced and regulated, are also
captured in regulatory law.27 In addition to the CCS Directive (2009/31/EC), CO2 storage is
also assigned to other EC environmental provisions, thus sketching out how it can be sys-
tematically implemented by the Member States. The aim is to remove existing legal barriers
to the CCS process.
Regulatory coverage of capture and transport
The construction and operation of CO2 pipelines to transport the CO2 to storage sites, and
the associated booster stations, will be subject to the EIA obligation, as a result of the
amendment of Annex I of the EIA Directive (85/337/EEC) laid down in Article 31. This reflects
the legislation for the storage sites themselves, and also the installations for CO2 capture
constructed and operated in the power plant and in the industrial process. According to Arti-
cle 37, Annex I of the IPPC Directive (2008/1/EEC) has been amended so that CO2 capture
installations are covered by the scope of this Directive. This means that safety requirements
and risk assessment criteria in the construction and operation of the installations are uni-
formly defined under European law. A thorough description of the regulatory consequences
of the previously described amendments by the CCS Directive (2009/31/EC) is given by (de
Graaf and Jans 2009). Tab. 6-1 provides an overview of the specifications of the CCS Direc-
tive 2009/31/EC relevant to licensing law.
27 Compare also Recitals 15 and 16 of the CCS Directive 2009/31/EC.

RECCS plus – Update and Expansion of the RECCS Study
124 Final Report
Tab. 6-1 Regulatory and emissions trading laws governing the CCS process
Capture Transport Storage
Operational
phase Post-closure phase
Before transfer-
ring responsibility
After transferring
responsibility
Permit re-
quirements
-2008/01/EC
(previously
96/91/EC IPPC
Directive) and
-85/337/EEC (EIA
Directive)
85/337/EEC (EIA
Directive) CCS Directive CCS Directive CCS Directive
Emissions
trading
-Not yet deter-
mined
-Determined in
the Directive
amending the
Emission Trade
Directive (Annex
I)
-Not yet
determined
-Determined in
the Directive
amending the
Emission Trade
Directive (Annex
I)
-One-sided
inclusion pos-
sible already
based on the
previous Emis-
sion Trade
Directive (cf.
Article 24 old
version)
-Determined in
the Directive
amending the
Emission Trade
Directive (An-
nex I)
-One-sided inclu-
sion possible
already based on
the previous
Emission Trade
Directive (cf.
Article 24 old
version)
-Determined in
the Directive
amending the
Emission Trade
Directive (Annex
I)
-One-sided inclu-
sion possible al-
ready based on the
previous Emission
Trade Directive (cf.
Article 24 old ver-
sion)
-Determined in the
Directive amending
the Emission Trade
Directive (Annex I)
Leakages Return of permits Return of permits Return of per-
mits Return of permits No reimbursement
Directive amending the Emission Trade Directive means: Directive 2009/29/EC (of the…) amending Directive
2003/87/EC so as to improve and extend the greenhouse gas emission allowance trading scheme of the Com-
munity of 23 April 2009, OJ L 140, 63
CSS Directive means: Directive 2009/31/EC (of the…) on the geological storage of carbon dioxide and amending
Council Directives 85/337/EEC and Directives 2000/60/EC, 2001/80/EC, 2004/35/EC, 2006/12/EC and Regulation
(EC) No. 1013/2006 of 23 April 2009, OJ L 140, 114
Source: Based on (Dietrich and Bode 2008)
Revocation of procedural obstacles and bans
Procedural obstacles and bans are eliminated by the amendments in Articles 32, 35 and 36.
The extension of the Water Framework Directive (2000/60/EC) is regulated in Article 32. Ac-
cording to Article 11(3)(j) of the Water Framework Directive, neither injection of CO2 nor its
discharge into the groundwater was ever permissible, since legislators had obviously as-
sumed it to be a harmful substance. Due to the addition of possible exceptions in accordance
with Article 11(3) of the Water Framework Directive, the injection of captured CO2 for storage
purposes into geological formations, which for natural reasons are permanently unsuitable
for other purposes, is now, in principle, permitted. Articles 35 and 36 led to the amendment of
regulations regarding waste. These amendments were necessary because, according to the

Legal aspects of introducing CCS to power plant technology
Wuppertal Institute for Climate, Environment and Energy 125
previous predominant opinion in legal literature, CO2 captured for storage was classified as
waste within the meaning of the Waste Framework Directive (2006/12/EC) (Hendriks et al.
2005, Dietrich 2007, Schulze et al. 2008, de Graaf and Jans 2009). Consequently, CO2 in-
jected into geological formations was classified as the disposal of waste in underground dis-
posal sites, and was not permitted according to Article 5(3) of the Landfill Directive
(1999/31/EC) (Hendriks et al. 2005, Dietrich 2007). Based on knowledge of the existing un-
certainties, the scope of the Waste Framework Directive has now been restricted by an
amendment of Article 2(1)(a) of the Waste Framework Directive. This amendment does not
apply to gaseous discharges into the atmosphere any more than it applies to CO2 that is cap-
tured, transported and geologically stored within the CCS process. CO2 that is to be trans-
ported for the purpose of geological storage has now been excluded from the scope of the
Waste Shipment Regulation (EC No. 1013/2006) by the amendment of the Regulation pro-
vided for in Article 36 (Article 1(3)(h) of the Regulation).
Capture readiness rule and environmental damage
Another regulation, which is of great relevance to the power plant industry and very contro-
versial in the legislative process (compare Radgen et al. 2009, de Graaf and Jans 2009),
determines an expansion of the LCP Directive (2001/80/EC) in Article 33. This amendment
led to the inclusion of the “capture ready” principle in Article 9a of Directive 2001/80/EC for
large combustion plants. Member States must ensure that operators of all combustion plants
with a rated electrical output of 300 MWel or more, for which the original construction licence
or original operating licence is granted after the coming into force of the CCS Directive
2009/31/EC, have assessed the criteria for retrofitting with CCS technology prior to construc-
tion and commissioning. The assessment must cover whether suitable storage sites are
available, whether transport facilities are technically and economically feasible, and whether
CO2 capture installations can be retrofitted. If the assessment shows that the CCS criteria
have been met, the competent authority must ensure that suitable space on the installation
site for retrofitting capture installations is set aside (for more detailed explanations on retrofit-
ting capture ready power plants, see Section 3.2).
The Environment, Public Health and Food Safety Committee (ENVI) was unable to pass its
proposal for amendment in the legislative process. This proposal had become known as the
“Schwarzenegger clause”. The proposal would have meant that from 2015, power plants with
a capacity of over 300 MWel would only have been granted a permit if they were able to
guarantee an emission standard of 500 g CO2/kWhel.28 Had the proposal been accepted, it
would have meant that only new coal-fired power plants that used CO2 capture within the
CCS process would have received permits from 2015. An emission standard of 500 g
CO2/kWhel would have equated to the obligation to use CCS in power plants from 2015. It is
assumed, however, that CCS technology will not have been adequately developed and
tested by 2015, and that suitable CO2 storage sites will not have been sufficiently explored
and developed (Radgen et al. 2009). In the end, this proposal was not accepted in the legis-
lative process and was not included in the version of the CCS Directive (2009/31/EC) that
was ultimately adopted (compare also de Graaf and Jans 2009).
28 ENVI, Compromise and consolidated Amendments 1-27 to the geological storage of carbon dioxide and
amending Council Directives, 6 October 2008, (PE407.716v01-00).
RECCS plus – Update and Expansion of the RECCS Study
126 Final Report
In addition, the Environmental Liability Directive (2004/35/EC) has been amended to the ex-
tent that the operation of CO2 storage sites is classified as an occupational activity, which
means that operators will have responsibility for fixing any damage that their processing
causes, or threatens to cause, to the environment.
The Directive closes with the Final Provisions laid down in Chapter 8. These Final Provisions
stipulate that the Commission will review the existing regulations by 31 March 2015. They
also contain transposition and transitional steps to be undertaken by the Member States (Ar-
ticle 39) and also its entry into force and the addressees of the Directive. The CCS Directive
(2009/31/EC) must be implemented by Member States by 25 June 2011.
6.1.2.7 Inclusion in emissions trading and investment incentives
Some economic implications for the development of CCS technology have already been
identified. Much work has taken place addressing the regulations to codify CCS technology
in terms of safety and the regulatory process. The CCS Directive 2009/31/EC is key in this
area. However, these aspects are not the focus of the regulations, and are inadequate for a
comprehensive legal framework with which to specifically promote the development of CCS.
Reference was made at an early stage (Dietrich and Bode 2005, Hendriks et al. 2005, Diet-
rich 2007 and Hohmuth 2008) to the possibilities and the conceivable economic incentives of
including CCS technology in the European emission trading system, which has established
itself as a central international instrument for climate protection. Based on the version of the
Emission Trading Directive applicable until Directive 2009/29/EC came into effect, it was only
possible to include CCS by way of an opt-in according to Article 24 (de Graaf and Jans 2009,
Hohmuth 2008, Dietrich 2007), i.e. only as an exception to the rule.
Consequently, the Directive amending the Emissions Trading Directive (2009/29/EC)29, also
adopted within the European Climate Package on 23 April 2009, contains provisions that
could bring significant incentives for the continuing development of CCS technology in Eu-
rope, due to the long-term potential of this technology to reduce emissions. The amended
Emissions Trading Directive states that activities along the entire CCS process chain are
now expressly subject to the emissions trading obligation, following the acceptance of these
activities in Annex I of the Emissions Trading Directive in relation to the greenhouse gas
CO2. The raised profile of the emissions trading obligation for CCS brings with it the special
investment incentive of not having to submit allowances for captured and permanently stored
CO2. However, CO2 allowances for capturing and storing CO2 cannot be allocated for free
(compare Article 10a(3) and Article 12(3a) of the amended Emissions Trading Directive). The
flipside of this is that, in the case of leakages of CO2 along the CCS chain, the quantity of
allowances corresponding to the leaked share of CO2 must be surrendered. In the event of a
leakage, no permanent CO2 reduction has taken place. If no leakages occur, the operators of
CCS installations can freely dispose of, and sell, the share of CO2 allowances allocated in
total for the plant.
In these circumstances, two combined incentives are set for investors and operators of CCS
installations. Firstly, operators and investors have a strong interest in the permanence of the
29 Directive 2009/29/EC (of the…) amending Directive 2003/87/EC so as to improve and extend the green-
house gas emission allowance trading scheme of the Community of 23 April 2009, OJ L 140, 63.

Legal aspects of introducing CCS to power plant technology
Wuppertal Institute for Climate, Environment and Energy 127
CO2 reduction, and therefore in the safety of the storage sites. This in turn should lead to the
implementation of safety investments. Secondly, operators and investors pursue the eco-
nomic goal of retaining the free disposability and tradeability of the allowances generated by
the CCS process, in order to continue to exploit them commercially. The funding system as-
sociated with the inclusion in emissions trading is presented in Tab. 6-1. There is a certain
amount of insecurity for investors caused by the selected financing mechanism. This is due
to the fact that, so far, no general criteria have been established to record, measure and as-
sess leakages from storage sites. Without these criteria, forecasts of quantifiable obligations
for returning allowances in the event of a leakage cannot be made.
Regardless of this integrated indirect promotion in the emission trading scheme, Article
10a(8) of the Emissions Trading Directive now provides for another financial mechanism for
the construction of 12 demonstration plants by making available allowances in the new en-
trants’ reserve. This financial support for the construction of demonstration plants was added
at the last minute of the legislative process “as a completely new condition” (according to
Viebahn and Luhmann 2009). Pursuant to Article 10a(8) of the Emissions Trading Directive,
up to 300 million allowances will be made available until 31 December 2015 “… to help
stimulate the construction and operation of up to 12 commercial demonstration projects that
aim at the environmentally safe capture and geological storage (CCS) of CO2 as well as
demonstration projects of innovative renewable energy technologies, in the territory of the
Union”. This provision should lead to or facilitate the acceleration of the implementation of
the first commercial demonstration plants. The allowances will be made available to support
these demonstration projects that will pave the way for the development, in geographically
balanced locations, of a wide range of CCS processes and innovative renewable energy
technologies that are not yet commercially viable. The award of the allowances will be de-
pendent upon proof that CO2 emissions have been avoided.
Projects will be selected on the basis of objective and transparent criteria that include re-
quirements for knowledge-sharing. A further requirement is that no project shall receive sup-
port that exceeds 15 per cent of the total number of allowances available. Consequently, if
each demonstration plant receives the maximum amount of funding available, seven projects
can be funded. With a potential allowance value of ! 30/t CO2, a total of ! 9 billion could be
paid, hence a maximum of ! 1,350 million per project. Deciding on a certain allocation quota
is a political decision. The negotiations on the criteria to be applied for the selection of pro-
jects and for the allocation of awarded allowances have not yet been concluded. A concrete
roadmap for the selection of projects was submitted to Parliament in February 2010 (Euro-
pean Commission 2010). According to a proposal by (Viebahn and Luhmann 2009), funding
could be divided between CCS projects and renewable energies in accordance with both
technologies’ intended share in EU electricity supply in 2050, described in the World Energy
Outlook as 29 per cent for CCS and 71 per cent for renewables.
It is also worth mentioning that financial assistance is available for pre-selected CCS projects
by way of Regulation No. 663/2009 of the European Parliament and of the Council of 13 July
2009. The intention is to establish a programme to aid economic recovery by granting Com-
munity financial assistance to projects in the energy industry, the European Energy Pro-

RECCS plus – Update and Expansion of the RECCS Study
128 Final Report
gramme for Recovery (EEPR).30 The Regulation establishes a financing instrument for the
development of projects in the field of energy in the Community which, by providing a finan-
cial stimulus, contributes to economic recovery, the security of energy supply and the reduc-
tion of greenhouse gas emissions. “Carbon capture and storage” is also listed in the Regula-
tion’s sub-programmes (Chapter II, Section 3, Articles 17-21). The eligible projects and en-
visaged Community contribution are listed in the Annex to the Regulation.31 Eligible German
projects were the power plant project run by RWE AG in Hürth near Cologne and the power
plant project initiated by Vattenfall AG in Jänschwalde. The latter was then awarded ! 180
million in funding (IZ Klima 2009b).
6.1.3 Summary and assessment
The CCS Directive (2009/31/EC), which is to be transposed into the national law of all Mem-
ber States by June 2011, along with other modified legal acts, constitutes a comprehensive
policy for the use of CCS technology valid in all EU Member States. What is remarkable
about the Directive is the short period – not even 18 months – from the presentation of the
Commission’s draft in January 2008 to its coming into force in June 2009. This rapid turn-
around is due to the fact that the CCS process is regarded as a bridging technology, and that
CCS, if achievable on a large scale, should be available from 2020 at the latest. Since the
specifications of the EU legislation are very detailed in parts, it shows Member States what
national CCS policy might look like. However, the Member States, which can classify CO2
storage in their sovereign territory as wholly or partially inadmissible, are given wide discre-
tion regarding implementation and specification in important areas that affect the regulatory
system.
The decision by European legislators to establish a separate, new regulatory system for the
storage process, in which the distinctive features of CO2 storage are to be recognised, should
be perceived in a positive way as it should accelerate the arrival of technical feasibility. It is
therefore clarified that CO2 captured in the CCS process and transported to storage sites for
permanent storage is not subject to laws surrounding waste. Also, due to the amendment of
the Water Framework Directive, the previous ban on injection has now been lifted. The CCS
Directive (2009/31/EC) obligates Member States to have safety and environmental aspects
of CO2 storage checked by authorities as a prerequisite to starting work on the site. This cov-
ers the entire storage process, from exploration (“exploration permit”) and the compression
or injection of the CO2 (“storage permit”) to the closure of the storage sites after the comple-
tion of storage, for which a permit is also required from the competent authority.
The Directive makes a landmark decision, the details of which were discussed inconclusively
beforehand. Responsibility for closed storage sites is usually transferred to the state after 20
years and if the agreed requirements have been met. Most experts agree that this transfer of
responsibility is appropriate. Considering the periods (at least 800 years) required for cli-
mate-effective storage and the fact that it is virtually impossible for private enterprises, unlike
states, to guarantee their existence for such long periods, this 20-year time limit given in the
30 OJ L 200, p. 31.
31 Gas and electricity infrastructure projects (Chapter II, Section 2, Articles 4-11, Annex No. A.) and offshore
wind projects (Chapter II, Section 2, Articles 12-16, Annex No. B) count as eligible projects alongside the
listed CCS projects.

Legal aspects of introducing CCS to power plant technology
Wuppertal Institute for Climate, Environment and Energy 129
Directive for transferral of responsibility is very short. However, Member States are able to
extend this minimum period for transferring responsibility.
The steps of capture and transport fall within the scope of existing regulations, due to the
similarity of activities already practised, and are subject to the safety and environmental re-
quirements therein. With the implementation of the capture ready regulation in the LCP Di-
rective, European legislators have accepted a politically negotiated compromise which states
that the use of CCS technology (so far at least) is not an actual requirement for the approval
of constructing new coal-fired power plants. Whether this will still be the case after the review
process, which is expected to take place by 2015, depends on the technical developments
and the political decision that may then be required on the obligatory use of CCS technology.
By integrating the entire CCS process chain into the European emission trading scheme, a
tool for CCS will be activated that can be used to provide incentives to investors from both a
safety-related and a business management perspective. Important requirements for long-
term safe storage and for the investment security necessary for project investors are only
described in general and on their merits in the Directive. This relates to, for example, the
question of the minimum requirements to be met by the injected CO2, i.e. its degree of purity,
and the parameters on which the financial securities are calculated. Here the Directive has
not yet been very specific, although it does provide for the Commission to specify matters by
issuing guidelines to define the requirements more precisely.
Neither does the Directive provide guidelines for how authorities should prioritise between
different competing projects that require the same geological formation to be present (for
instance, geothermal energy or gas storage versus CO2 storage). It is to be hoped that the
Commission will soon make use of the option for specification granted to it in order to estab-
lish a standard application of law and investment security.
All in all, the new regulations for CCS technology are suitable for achieving the objectives
pursued by it.
6.2 Regulations on CCS concerning the storage of CO2 in oceans and seas
in international law
As well as on the mainland (“onshore”), the storage of CO2 is also possible in geological for-
mations beneath the seabed (“offshore”), and it is the intention that this will happen. Regula-
tions pertaining to international maritime law regarding marine environmental protection are
crucial to assessing the reliability of such projects. This is because the great majority of these
offshore areas are outside of the jurisdiction of nation states (compare the detailed descrip-
tion in UBA 2008, as well as Stoll and Lehmann 2008). National law only applies to such pro-
jects if storage takes place within the territories of nation states, i.e. within the exclusive eco-
nomic zones and in the area of nation states’ continental shelves. The possibilities of regula-
tion available to the EU are also restricted to this area (compare also Article 2(1) and (3) of
the CCS Directive (2009/31/EC)).
A selection of relevant international agreements are:

RECCS plus – Update and Expansion of the RECCS Study
130 Final Report
• the United Nations Convention on the Law of the Sea of 10 December 1982, which
came into force in 1994 (UNCLOS)32,
• the Convention on the Prevention of Marine Pollution by Dumping of Wastes and Other
Matter of 197233 and the 1996 Protocol (London Protocol) to it34,
• the Convention for the Protection of the Marine Environment of the North-East Atlantic of
1992 (OSPAR Convention)35 and
• the Convention for the Protection of the Marine Environment of the Baltic Sea Area of
1992 (Helsinki Convention)36.
Following subsequent amendments to the London Protocol and the OSPAR Convention in
February 2007 (for further details, see Stoll and Lehmann 2008 and UBA 2008), CO2 streams
from the CCS process for storage purposes can now be injected into sub-seabed formations
once detailed substantive and procedural requirements have been met. The CO2 must be of
the highest purity. There can only be trace amounts of substances associated with the CCS
process or the parent substances that cause the minor contamination of the CO2. Under no
circumstance may waste or other matter separate from the CCS process be added to the
injected CO2 for the purpose of disposing of this waste or other matter (UBA 2008).
No amendment has yet been made to the Helsinki Convention, which contains only recom-
mendations and political agreements, rather than legally binding regulations.
6.3 Legal developments outside the EU using the example of the U.S. State
of Wyoming and the Australian State of Victoria
Naturally, endeavours to achieve the large-scale use of CCS technology are not limited to
Europe and the EU. Many other states are also encouraging its development. Below, the
U.S. State of Wyoming and the Australian State of Victoria are taken as examples to briefly
describe the legal developments in these states where, more or less, comprehensive legal
frameworks have been created specifically for CO2 storage.
6.3.1 United States of America: The example of Wyoming
In addition to there being numerous R&D activities (compare Section 2.1.3.2), much legal
work is taking place in the USA at both federal and state level to regulate CCS technology.
At federal level, the “American Clean Energy and Security Act”37 has been submitted to the
parliamentary process as draft legislation, which would substantially change the energy and
32 The United Nations Convention on the Law of the Sea of 10 December 1982 (Federal Law Gazette II, p.
1798), which has been in force since 16 November 1994.
33 Convention on the Prevention of Marine Pollution by Dumping of Wastes and Other Matter, 13 November
1972, 11 ILM 1291 (1972).
34 1996 Protocol to the Convention of Marine Pollution by Dumping of Wastes and Other Matter, 13 November
1972, 8 November 1996, 36 ILM 1, 7-21 (1996).
35 Convention for the Protection of the Marine Environment of the North-East Atlantic of 22 September 1992
(cf. Federal Law Gazette 1994 II, p. 1355).
36 Convention for the Protection of the Marine Environment of the Baltic Sea Area (Federal Law Gazette 1994
II, p. 1355).
37 H.R. 2450.
Legal aspects of introducing CCS to power plant technology
Wuppertal Institute for Climate, Environment and Energy 131
climate policy of the USA. The aim of the Bill, which was adopted in the House of Represen-
tatives on 26 June 2009, is “to create clean energy jobs, achieve energy independence, re-
duce global warming pollution and transition to a clean energy economy.” In the section “Title
1 – Clean Energy” as a sub-section “Subtitle B – Carbon Capture and Sequestration”, the
draft for the “American Clean Energy and Security Act” contains comprehensive provisions
with which existing energy and environmental protection laws (such as the Clean Air Act and
the Safe Drinking Water Act) would be amended to include the special features of the CCS
process and to promote CCS technology (for further details, compare Larsen et al. 2009; for
general details, compare also Global CCS Institute 2009a). The American Clean Energy Act
is an attempt to regulate important legal framework conditions at the federal level (Schill et al.
2009). These conditions tackle regulative uncertainties that have been recognised as an in-
vestment hurdle, such as with regard to transport, storage and liability in the event of envi-
ronmental and health-related hazards (Wörlen et al. 2009). The law has yet to be approved
by the Senate and has not yet come into effect. In addition, there are a number of other par-
liamentary bills that aim to regulate the CCS process at the federal level:
• Carbon Capture and Storage Early Development Act38 (for further details, compare Kerr
et al. 2009): in the process of adoption, adopted in the House of Representatives on 24
March 2009, not yet law;
• Carbon Capture and Sequestration Programme Amendments Act39: in the process of
adoption, not yet law;
• American Energy Leadership Act 200940: in the process of adoption, not yet law;
• Carbon Storage Stewardship Trust Fund of 200941: in the process of adoption, not yet
law.
It should be noted that there is some overlap in the contents of the aforementioned draft
laws. For instance, the regulations contained in the Carbon Capture and Storage Early De-
velopment Act have been incorporated into the American Clean Energy and Security Act.
This means that not all of the laws will be adopted.
In July 2008, the U.S. Environmental Protection Agency (EPA) proposed regulating federal
requirements for CO2 storage sites, based on the existing regulatory system of Underground
Injection Control (UIC).42 UIC regulates the injection of harmful and harmless substances
underground. The programme is part of the “Safe Water Drinking Act”, and defines five
classes of injection wells that have different functions. In the draft of the EPA, an additional
injection well category (Class VI) has been created for the purpose of CO2 storage.
The paper also includes criteria for tests to be carried out on storage sites, the construction
of injection wells, the monitoring of storage sites and ground water resources in the sur-
rounding area, as well as on the distribution of financial burdens (EPA 2008). In August
38 H.R. 1689.
39 S 1013.
40 S 1462.
41 S 1502.
42 Proposed Rule of the EPA of 25 July 2008, Proposed Rule concerning Federal Requirements Under the
Underground Injection Control (UIC) Program for Carbon Dioxide (CO2) Geologic Sequestration (GS) Wells
http://www.epa.gov/fedrgstr/EPA-WATER/2008/July/Day-25/w16626.pdf

RECCS plus – Update and Expansion of the RECCS Study
132 Final Report
2009, the EPA published a “Notice of Data Availability” (NODA), which supplemented the
draft from the previous year with newly obtained knowledge. In particular, it contains geologi-
cal information gathered from the testing of storage sites within “Regional Carbon Sequestra-
tion Partnerships” and other studies, as well as the results of a published hearing on the
rules and regulations published in 2008 (EPA 2009). These regulations will not come into
effect before the end of 2010 (Kerr et al. 2009).
Should the Bills become law, there would be a federal legal framework that would largely
regulate CCS technology. It remains to be seen how further developments will evolve.
Wyoming deserves special mention regarding regulations on CCS technology at U.S. state
level (regarding the developments in the federal states, compare also Pollak et al. 2009;
Schill et al. 2009). As early as in March 2008, Wyoming was the first U.S. federal state to
adopt a law specifically related to the long-term storage of CO2, the enrolled Act No. 25.43 As
a result of this law, (“long-term”) CO2 storage without simultaneous use of the EOR, EGR or
ECBM processes was transferred to control of the Wyoming Department of Environmental
Quality. The law provides for a regulatory system in which the formal requirements for per-
mits are defined by the Department of Environmental Quality. This was integrated into the
existing regulatory framework for “Underground Injection Control” and drinking water protec-
tion legislation (Kerr et al. 2009). Amongst other things, permit applications must include de-
tails about financial assurance, a detailed description of the properties of the storage forma-
tion, a monitoring plan and a detailed plan for post-closure monitoring, including evidence of
safety precautions. In addition, a bonding procedure and other financial assurance methods
will be developed and proposed in 2009.
These regulations have since been supplemented by three further laws for the State of
Wyoming, with which the aforementioned request for regulation was implemented. In Feb-
ruary 2009, the “House Bill No. 57” led to existing mining and drilling rights being deemed
preferential to planned CO2 storage. “House Bill No. 58” clarifies that the owner and obligor
for stored CO2 and for other substances injected simultaneously with CO2 is exclusively the
person who carried out the injection. Among other things, “House Bill No. 80” provides for a
“unitization for geological sequestration sites.” According to this law, under the supervision of
the Wyoming Oil and Gas Conservation Commission, rights to storage formations belonging
to different parties will be rearranged for the purpose of CO2 storage if 80 per cent of the af-
fected parties agree to such a procedure.
In summary, therefore, comprehensive regulations for the coverage of CCS technology are
intended in the USA or, as shown in the example of Wyoming, are already established in law.
6.3.2 Australia: The example of Victoria
In November 2008, the Australian Federal Government adopted the “Offshore Petroleum
Amendment (Greenhouse Gas Storage) Act 2008”, which provides for a regulatory frame-
work for CO2 storage in “Commonwealth offshore waters”. Reference is made to existing
regulations from the oil sector in this law. However, these federal regulations apply only to
the offshore storage of CO2.
43 House Bill No. 0090.
Legal aspects of introducing CCS to power plant technology
Wuppertal Institute for Climate, Environment and Energy 133
In 2009, the Australian “Environment Protection and Heritage Council” and the “Ministerial
Council on Mineral and Petroleum Reserves” presented Environmental Guidelines for Car-
bon Dioxide Capture and Geological Storage. These guidelines contain the first basic details
at federal level on environmental assessment, monitoring and the closure of storage sites.
According to these guidelines, the monitoring process must include an examination of the
storage site prior to the injection of CO2 and monitoring in the region surrounding the actual
CCS injection site. Operators will be required to undertake monitoring, and there will also be
independent assessment of their monitoring systems (EPHC 2009; for general information,
compare also Global CCS Institute 2009b).
Legal provisions at state level exist for the onshore storage of CO2. For instance, in October
2008, the “Greenhouse Gas Geological Sequestration Act 2008 (GGGSA)”44 was adopted as
a framework law in the Australian State of Victoria, where the testing and development of
CCS technology is particularly important, due to there being large deposits of lignite there.
The act will come into effect by 1 January 2010 at the latest. This legislation created a legal
framework for the storage of CO2, as well as other greenhouse gases, in underground geo-
logical formations for the State of Victoria. The regulations of the GGGSA cover only storage
and the steps immediately prior to storage, such as site exploration and the injection of the
greenhouse gases. The legislation does not contain any concrete guidelines for the first two
steps of the process, i.e. the capture and transport of greenhouse gases. Mention is merely
made of “greenhouse gas infrastructure lines”, which are defined as pipelines to transport
greenhouse gases. These are permitted due to the existing 2005 “Pipeline Act”45. Storage,
on the other hand, is regulated comprehensively, from the exploration of suitable sites to the
storage procedure and monitoring. Some specific arrangements remain outstanding, such as
where the responsibilities of authorities will lie.
In terms of its legal character, the GGGSA is based on the 1998 “Victorian Petroleum Act”, in
which (similar) regulations are already established for the exploration and recovery of hydro-
carbons in the oil and natural gas industry (Department of Primary Industries 2009). The
GGGSA exclusively regulates the storage of greenhouse gases on the mainland (“onshore”).
This act supplements the provisions of the “Offshore Petroleum and Greenhouse Gas Stor-
age Act 2008”46, a Commonwealth Act that sets up a regulatory system for the exploration,
injection and storage of greenhouse gases offshore, outside the 3-mile zone.
Separate permits are required for exploration, storage and monitoring, whereby they build on
each other in part:
1. Greenhouse gas sequestration exploration permit
This permit authorises the holder of the permit to carry out exclusive exploration of the
formations for a period of five years (which can be extended only once).
2. Greenhouse gas sequestration formation retention lease
A “retention lease” gives the holder of an exploration permit the exclusive right to use the
explored formation for five years if it is suitable for storage but not yet commercially via-
44 Greenhouse Gas Geological Sequestration Act 2008; No. 61 of 2008, Victorian Statute Book.
45 Pipelines Act, No. 61 of 2005 Victorian Statute Book.
46 Offshore Petroleum Amendment (Greenhouse Gas Storage) Act 2008, Commonwealth Act, No. 117, 2008.

RECCS plus – Update and Expansion of the RECCS Study
134 Final Report
ble, but which might become viable to develop within 15 years. This right can be re-
newed twice for a period of five years each.
3. Greenhouse gas substance injection and monitoring licence
This licence authorises and enables the holder to carry out the storage process. It also
requires the holder to monitor the process for the entire period up to the end of the stor-
age phase. The licence is valid until further execution of the permitted activities is can-
celled or surrendered by the holder. The right to receive this licence is initially restricted
to holders of an exploration permit or a retention lease following application to the com-
petent authority. The holder of such a licence must, amongst other things, submit a long-
term monitoring and risk management plan for approval by the competent authority (min-
istry) prior to returning the licence. A further condition for returning the licence is that no
risk to lives and health or to the environment may be posed or arise due to the injected
CO2.
For all three types of permit, the GGGSA prohibits the storage of greenhouse gases on land
in a national park or a wilderness area.
Furthermore, the GGGSA contains provisions governing the relationship between the land
owner and “occupier”. According to these provisions, storage activities may not be carried
out without the consent of these parties. These parties are entitled to receive compensation if
their rights are infringed.
Further “Greenhouse Gas Geological Sequestration Regulations” are in the pipeline for 2009.
These regulations aim to complete and formalise the framework of the GGGSA. Amongst
other things, specifications will be made regarding monitoring obligations and risk manage-
ment. In addition, obligations about the notification of dangerous situations and the obligation
for the permit holder to present an environmental management plan are to be specified in
further detail (Department of Primary Industries 2009). It remains to be seen how the current
process will develop.
6.4 Developments in other EU Member States using the example of the
Netherlands and Poland
Parallel to developments at European level, endeavours to implement CCS technology are
also being advanced in the existing energy supply systems within the Member States of the
EU. The following examples from the Netherlands and Poland illustrate how these countries
have sought to create a suitable legal framework for its implementation. Once again, the final
step in the CCS chain is given particular attention.
6.4.1 The Netherlands
In the Netherlands, CCS is given plenty of scope for reducing CO2 emissions through differ-
ent climate protection technologies. There are numerous initiatives for the integration of CCS
technology in the existing energy supply system (compare Koster 2008 and Koornneef et al.
2008a). This is justifiable since there are plenty of geological formations in the Netherlands
that are suitable for the permanent storage of CO2, particularly gas storage sites that are still
in operation or are already depleted (in the majority of cases).

Legal aspects of introducing CCS to power plant technology
Wuppertal Institute for Climate, Environment and Energy 135
The CO2 capture stage is generally covered by existing Dutch law. Requirements for the on-
shore pipeline transportation of CO2 will be determined by an amendment of the “Algemene
Maatregel von Bestuur” (Ecofys 2007). However, it is only deemed necessary to make
amendments in the areas of environmental impact assessment and strategic environmental
assessment, which are regulated in the “Environmental Impact Assessment Decree of 1994”
(Koornneef et al. 2008a, de Graaf and Jans 2009).
Corresponding legislation for the mining industry assists with establishing the legal scope of
coverage of CO2 storage in the Netherlands since it comprehensively regulates the storage
of substances in underground formations (Ecofys 2007, Koster 2008). Until now, the special
features of CO2 storage have not been explicitly mentioned in Dutch mining law, the
“Mijnbouwwet”. The same applies to the delegated legislation in mining law. However, the
storage of CO2 is already adequately covered by applicable mining law (Roggenkamp 2008).
The storage of substances at depths of more than 100 metres below the earth’s surface is
not permitted without a permit. CO2 can be included in the regulations for the storage of sub-
stances (Koster 2008, Roggenkamp 2008). It is stored at depths of between 800 and 2,500
metres (compare Section 7.2.2). The storage permit contains details about the substances
and areas for which the permit is valid, as well as the period of validity. The storage permit
should also determine whether the substances should remain underground permanently or
should specify the date for their removal. Contrary to the regulations of the German Federal
Mining Law, therefore, a differentiation is made between the term “storage” and the express
“permanent capture” of the substances underground.
Further permits are ruled out if a storage permit has already been granted for the same for-
mation. Similarly, permits are also refused if an exploration permit or a mineral extraction
permit has already been granted for the area. If an application is made for a storage permit, a
storage plan must be submitted to the competent authority. Amongst other things, this stor-
age plan must contain a description of the composition and quantity of the stored substan-
ces, comprehensive data with regard to the structures of the location of the formations in
which the substances are stored and a list of potential hazards that could occur as a result of
the dispersion of the injected substance and any conceivable chemical reactions of the sub-
stance with the host rock.
Prior to the closure of a storage site, a completion or closure plan must be submitted to the
competent authority. This plan must also contain extensive documentation and risk man-
agement requirements (Koster 2008). The question also arises in the Netherlands as to how
various uses of its geological underground can be reconciled with one another, or how, on
the basis of which factors, one of the technologies should be given preferential treatment.
One of the main examples of this is the extraction and storage of natural gas on the one
hand and CO2 storage on the other (Roggenkamp 2008). It appears that there has not yet
been any amendment to the mining law provisions with regard to the requirements of the
CCS Directive (2009/31/EC), whereby the connecting factor of the necessary legislative
amendments are considered to be in mining law (Koster 2008).
In addition to the necessary mining law permits, the environmental law requirements in the
Netherlands must also be considered. The special issues and requirements of the CCS Di-
rective (2009/31/EC) and the other amended legal acts of the EU associated with the CCS
process have not yet been explicitly accounted for in environmental legislation. The Dutch

RECCS plus – Update and Expansion of the RECCS Study
136 Final Report
Environmental Management Law (Wet milieubeheer) is of particular importance to envi-
ronmental law requirements. In the Environmental Management Law, direct reference is
made to the requirements of the IPPC Directive and the LCP Directive. This means that no
extensive amendments are deemed necessary to implement the further amendments of the
IPPC Directive and the LCP Directive associated with the adoption of the CCS Directive
(2009/31/EC) for the CCS process (de Graaf and Jans 2009).
Amendments and clarifications are also considered necessary for Dutch law in view of the
amendments and supplements to the EIA Directive with which the various steps involved in
CCS, sometimes dependent on the attainment of stipulated volumes and dimensions, are
introduced (de Graaf and Jans 2009, Koornneef et al. 2008a). Definite proposals have al-
ready been submitted with regard to the requirements that exist in the Netherlands due to the
environmental impact assessment and a strategic environmental assessment (Koornneef et
al. 2008a). Due to the regulations contained in the CCS Directive (2009/31/EC) on the
amendment of the Waste Framework Directive and other waste law provisions, according to
which CO2 is expressly removed from the scope of waste law, amendments to waste legisla-
tion in the Netherlands are considered to be necessary (de Graaf and Jans 2009).
The Dutch Environmental Licensing (General Provisions) Bill (Wabo) aims to integrate pro-
ject approval into just one single permit. Germany has also tried to streamline the process in
this way through the framework of codifying the Environmental Law Code, in addition to a
water law approval procedure, if required. The subject of the licensing procedure is all about
environmental relevance, spatial planning and construction law requirements. One single
authority will be responsible for the licensing procedure. It is being debated whether the
multi-link CCS process can be viewed as one activity for which one single permit is required,
particularly since the mining law permit for CO2 storage is not the subject of the draft law ac-
cording to applicable law (de Graaf and Jans 2009). It remains to be seen how the further
developments will evolve.
In Regulation No. 663/2009 of the European Parliament and of the Council of 13 July 2009
on a European Energy Programme for Recovery (EEPR, see Section 6.1.2.7), three Dutch
power plant projects – two in Rotterdam and one in Eemshaven – were classified as eligible
for funding. The E.ON project in Maasvlakte, the industrial area of Rotterdam, was finally
awarded funding of ! 180 million (IZ Klima 2009b).
6.4.2 Poland
In Poland, CCS technology is considered to have great potential for reducing CO2 emissions.
The CCS Directive (2009/31/EC) has not yet been transposed into Polish law, but should be
implemented by 2011. The discussion on how best to set about doing this has only just
started. Poland is interested in the rapid development of CCS technology to the level of
large-scale feasibility, the foundations of which should be laid between 2010 and 2012.
The report on the “Energy policy of Poland up to 2030 (Polityka energetyczna Polski do 2030
roku)”47, was presented on 10 November 2009, following consultations with the Polish Coun-
47 Accessible at:
http://www.mg.gov.pl/NR/rdonlyres/5474D2C2-2306-42B0-B15A-7D3E4E61D1D8/56330/PE.pdf.

Legal aspects of introducing CCS to power plant technology
Wuppertal Institute for Climate, Environment and Energy 137
cil of Ministers. In this report, the use of CCS technology, together with other innovations in
energy efficiency and the increased use of renewable energies, was expressly mentioned as
an important building block in Poland’s future energy infrastructure. Whilst this report is not a
binding roadmap, it contains political targets designed to be adopted in the short term.
In Section 7.2 of the report under the title “Measures to limit negative environmental impacts
arising in the area of power generation”, relating to CCS technology, it is stated that the in-
troduction of uniform standards on the use of CCS technology for commercial use is planned
with regard to the construction of new coal-fired power plants. Poland intends to take an
active role in implementing the goal of the EU Commission to establish demonstration plants
for CCS technology and in the area of renewable energies across Europe. One CCS
demonstration plant is to be constructed in Poland (power plant in Belchatów). In addition,
R&D into CCS technology and into the use of CO2 as a raw material in industry will be
encouraged.
In August 2009, the Polish Ministry of Economy presented a first draft of a programme to
formalise and implement the report “Energy policy of Poland up to 2030” for 2009 to 2012.48
CCS technology is mentioned in the report in Sections 6.5 to 6.7. Within this, it is intended to
work with the EU Commission to develop consolidated standards in the use of CCS technol-
ogy. To support this, it is intended to transpose the CCS Directive (2009/31/EC) into Polish
law by 2011. Both tasks fall within the remit of the Ministry of Economy.
In addition, it recommends that this programme should be supported by public information
campaigns (by 2012). Also, a monitoring programme for the underground storage of CO2 will
be devised and implemented. The Ministry of Environment is responsible for both tasks. A
further aim is to realise the demonstration projects and to devise possibilities and solutions
for the further development of “clean coal technologies” within an operative programme “In-
frastructure and Environment” in 2009 and 2010 and a national programme in 2010. The
possibilities and opportunities for CCS technology in the processing of natural oil and natural
gas are to be investigated and researched.
On 4 November 2009, the Polish Ministry of Environment submitted a first draft to implement
the CCS Directive (2009/31/EC).49 The new regulations mainly affect the Polish Mining and
Geology Act.50 Poland is pursuing the path of implementing the CCS Directive’s
(2009/31/EC) stipulations by connecting it to existing and established regulation regimes.
There are no plans to enact a separate CCS law in Poland.
According to the CCS Directive (2009/31/EC), the activities involved in the selection of stor-
age sites (“exploration permit”) and the storage process itself (“storage permit”) are subject to
authorisation. Polish legislators intend to implement this stipulation using two “licences”, to
be issued by the Polish Ministry of Environment. All applicants must be commercially active
enterprises, which fall within the scope of the Law on Economic Activities51. While the CCS
48 "Programme to implement the energy policy of Poland 2009-2012 (Program dzia"a# wykonawczych na lata
2009-2012)”, accessible at:
http://www.mg.gov.pl/NR/rdonlyres/5474D2C2-2306-42B0-B15A-7D3E4E61D1D8/56333/zal3PDW.pdf.
49 Accessible at: http://www.mos.gov.pl/g2/big/2009_11/1c483d65bb96ad1332c18842f9bd9bf7.pdf.
50 Mining and Geology Act of 4 February 1994, Dziennik Ustaw (Dz. U., Polish law gazette) No. 27, Pos. 97.
51 Law on Economic Activities of 2 July 2004, Dz. U. No. 173, Pos. 1807.

RECCS plus – Update and Expansion of the RECCS Study
138 Final Report
Directive (2009/31/EC) does not apply to research-based plants with a total storage volume
of under 100,000 tonnes of CO2, the amended Mining and Geology Act does not provide for
such a restriction.
Explorations of both geological formations and underground storage52 can only be carried out
if a written licence has been issued by the Ministry of Environment. An environmental impact
assessment is an essential component of the application process for the choice of storage
sites. Not only the mayor of the communities in which the storage sites are located must be
involved in the process – the EC Commission, which can issue a statement on the project
within four months, also has a say in the matter, complying with the stipulations of Article 10
of the CCS Directive (2009/31/EC).
The draft law also determines the information applications should contain and the supporting
documents to be submitted, which go beyond the stipulations in Article 7 of the CCS Direc-
tive (2009/31/EC). If an application is made for a “storage licence”, a working plan for the
underground storage and a monitoring concept must be presented.
In accordance with Article 7 of the CCS Directive (2009/31/EC), applicants must enclose a
proposal for a monitoring plan, a corrective measure plan and a post-closure plan with their
application. According to Polish regulations, these plans will be combined into a single plan,
the working plan for the underground storage of CO2. This plan is subject to approval by the
competent supervisory body (the Polish State Mining Authority), and becomes legally binding
as an annex to the licence. The plan must be updated at least every five years.
In addition, applicants must enclose supporting documents to prove they have sufficient fi-
nancial means within the meaning of Article 19 of the CCS Directive (2009/31/EC) with their
application for a “storage licence”. This financial security is paid into a “subsidiary account” of
the Fund for Environmental Protection and Water Management, as regulated in the Envi-
ronment Protection Law53. The security is made available to bring a proper end to the ac-
tivity, etc., in the event of the insolvency of the company, if it terminates its activities or if the
licence is revoked. The guarantee comprises a repayable and a non-repayable part. The
costs of decommissioning and 20 years of monitoring, or any costs for associated mainte-
nance work are repayable. The costs of 30 years of monitoring once responsibility has been
transferred to the state are not repayable. Any associated maintenance work or activities to
be carried out by the state instead of the actual party responsible are not repayable either.
Amongst other things, the licence determines how the work for which the application was
made will be carried out, the exact boundary of the storage site, the limits to which the work
can be performed, the period for which the licence is granted and the earliest date on which
work can commence. In addition, the licence may also contain details on environmental pro-
tection or special safeguarding measures (such as special monitoring requirements or use of
the best technology available). Furthermore, the licensed storage sites may not be larger
than 1,200 km$.
52 In the draft law, the term “sk"adowanie = storage/deposit” is used. The term “storage = gromadzenie” is not
mentioned in the draft, contrary to the choice of terms in the CCS Directive (2009/31/EC) in European law
and the official Polish translation.
53 Environment Protection Law of 27 April 2001, Dz. U. No. 62, Pos. 627.

Legal aspects of introducing CCS to power plant technology
Wuppertal Institute for Climate, Environment and Energy 139
If the future stipulations to be contained in the Mining and Geology Act are not met, the ap-
plication for a licence will be rejected. The application may also be rejected if it breaches the
Law on Economic Activities. Licences can be transferred to third parties, provided they are
able to meet the conditions and any other stipulations.
Any company that can prove it has the appropriate knowledge and experience can be an
operator of an underground storage site. The company in possession of a licence to explore
geological formations and to store CO2 underground is the rightful owner under mining law,
and is therefore entitled to the mining rights. The company must also fulfil its documentation
obligations.
The provisions on the underground storage of CO2 are regulated separately in a new section
of the Mining and Geology Act. In particular, they comprise details on how to determine sites,
on commissioning underground storage sites, reports to be submitted by the operator, in-
spection, measures to be taken in the event of irregularities, closure, post-closure and regis-
tration obligations and the transfer of responsibility.
It is intended to make the storage of CO2 subject to charge, which is of particular interest
against the backdrop of the current debate in Germany on a “storage fee”. Sixty per cent of
the fees will be awarded to the communities containing the plants. Forty per cent of the in-
come will be allocated to the Fund for Environmental Protection and Water Management.
The transposition of the stipulations of the CCS Directive (2009/31/EC) demands not only an
amendment of the Mining and Geology Act, but also amendments to other laws, such as the
Law on Economic Activities, the Environmental Impact Assessment Act54, the Energy Act55,
the Environment Protection Law and the Environmental Damage Act56. A provision will be
incorporated into the Waste Act57, stipulating that this law shall not apply to the underground
storage of CO2. The purpose of these measures is to transpose the stipulations of the Direc-
tive.
Even in the planning permission process, all operators of new power plants with a capacity
exceeding 300 MW must comment on how CO2 should be captured and stored in future. It is
assumed in Poland that energy costs will increase by over 60 per cent following the large-
scale deployment of the CCS process. The practical implementation is particularly interesting
to energy companies that will have to purchase all of their emission allowances by auction
after 2020.58
According to Regulation No. 663/2009 of the European Parliament and of the Council of 13
July 2009 on a European Energy Programme for Recovery (EEPR, see Section 6.1.2.7), the
power plant project by PGE at the Belchatow site was classified as eligible for funding; it was
finally awarded ! 180 million in funding (IZ Klima 2009b).
54 Law on Environmental Impact Assessment, Environmental Information and Public Participation in Envi-
ronmental Procedures of 3 October 2008, Dz. U. No. 199, Pos. 1227.
55 Energy Act of 10 April 1997, Dz. U. No. 54 Pos. 348.
56 Environmental Damage Act of 13 April 2007, Dz. U. No. 75, Pos. 493.
57 Waste Act of 27 April 2001, Dz. U. No. 62, Pos. 628.
58 http://biznes.gazetaprawna.pl/artykuly/371121,4_5_mld_euro_rocznie_za_magazynowanie_co2.html.

RECCS plus – Update and Expansion of the RECCS Study
140 Final Report
6.5 Legal framework for CCS technology at the level of national law
This Section is only available in the German version of the Final Report. A summary is given
in the English version.
The applicable German law has been inadequate to the task of legislating for the different
procedural steps of the CCS chain. The greatest problems arise in the field of CO2 injection,
solely aimed at permanently removing CO2. For this reason, projects concerning the perma-
nent storage of CO2 are only permitted in a few constellations in accordance with the applic-
able law.
On the basis of this finding and the specifications of the CCS Directive (2009/31/EC), a draft
CCS Law intended to encompass the whole CCS process for speedy implementation in
Germany was submitted by the German Federal Cabinet in April 2009. In the end, the Bill
was not adopted. Overall, the CCS Law was recognisably guided by achieving a transposi-
tion close to the specifications of the CCS Directive (2009/31/EC), intending to meet not only
environmental and safety requirements, but also the demands governing the necessary in-
vestment and legal security for CCS projects. This objective was not fully achieved by the
draft CCS Law. The CCS process is not expressly called a transitional technology in the draft
of the Carbon Dioxide Storage Act. Although this is not a violation of the guidelines of the
CCS Directive, critics in Germany demand a systematical change by declaring the CCS Law
as a research law that can be used to enable the exploration of CCS in a limited number of
demonstration plants. It is clear that, from today’s perspective, the CCS process, and in par-
ticular the question of the permanence of CO2 storages sites, cannot be answered conclu-
sively, and certainly not in general terms.
The provisions for detecting, assessing and resolving conflicts concerning underground
usage resulting from the large-scale use of CCS technology were also inadequate. The pro-
visions provide for solutions to individual cases, rather than for extensive, preventive plan-
ning. In a renewed attempt at creating legislation, the reservations of the potential federal
“storage states”, underestimated in the “first attempt” at devising a CCS Law explored here,
should be taken seriously. The authors are also critical of the regulatory approach because it
failed to regulate and specify fundamental legal decisions in a parliamentary act. Instead,
they were moved to the level of ordinances. However, the relevant ordinances were not
tabled at the same time as the Act. In view of the distinct conflicts emerging between land
owners and those with an interest in underground uses, this legal relationship should also be
regulated so that the risk of legal uncertainty is mitigated, and all parties are aware of their
rights and obligations. If the question of the suitable time to transfer responsibility to the re-
spective federal state is explored in further detail, the general deadline of a minimum of 30
years after the decommissioning of the plant, as stipulated in the draft of the Carbon Dioxide
Storage Act, seems appropriate. It is not recommended that new and extended, or shortened
clauses, are established in addition to the technology clauses currently used with standards
that were formalised over a long period in practice through jurisprudence. This would cause
unnecessary legal uncertainty.
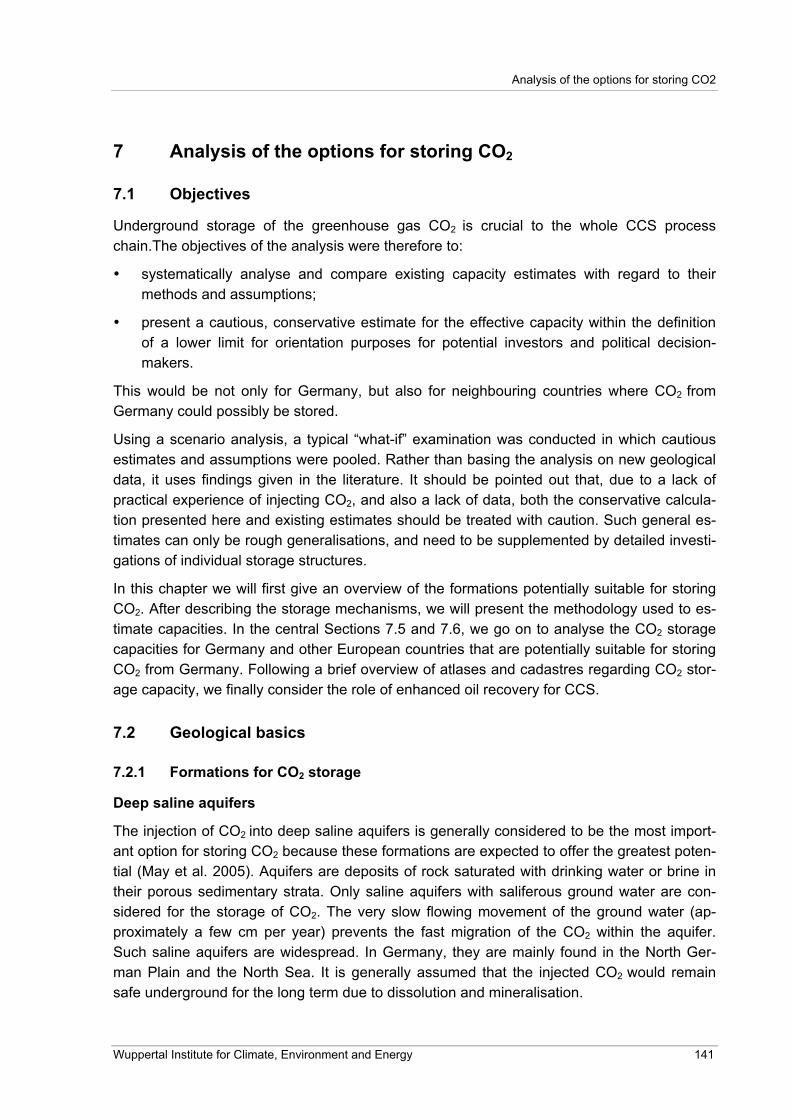
Analysis of the options for storing CO2
Wuppertal Institute for Climate, Environment and Energy 141
7 Analysis of the options for storing CO2
7.1 Objectives
Underground storage of the greenhouse gas CO2 is crucial to the whole CCS process
chain.The objectives of the analysis were therefore to:
• systematically analyse and compare existing capacity estimates with regard to their
methods and assumptions;
• present a cautious, conservative estimate for the effective capacity within the definition
of a lower limit for orientation purposes for potential investors and political decision-
makers.
This would be not only for Germany, but also for neighbouring countries where CO2 from
Germany could possibly be stored.
Using a scenario analysis, a typical “what-if” examination was conducted in which cautious
estimates and assumptions were pooled. Rather than basing the analysis on new geological
data, it uses findings given in the literature. It should be pointed out that, due to a lack of
practical experience of injecting CO2, and also a lack of data, both the conservative calcula-
tion presented here and existing estimates should be treated with caution. Such general es-
timates can only be rough generalisations, and need to be supplemented by detailed investi-
gations of individual storage structures.
In this chapter we will first give an overview of the formations potentially suitable for storing
CO2. After describing the storage mechanisms, we will present the methodology used to es-
timate capacities. In the central Sections 7.5 and 7.6, we go on to analyse the CO2 storage
capacities for Germany and other European countries that are potentially suitable for storing
CO2 from Germany. Following a brief overview of atlases and cadastres regarding CO2 stor-
age capacity, we finally consider the role of enhanced oil recovery for CCS.
7.2 Geological basics
7.2.1 Formations for CO2 storage
Deep saline aquifers
The injection of CO2 into deep saline aquifers is generally considered to be the most import-
ant option for storing CO2 because these formations are expected to offer the greatest poten-
tial (May et al. 2005). Aquifers are deposits of rock saturated with drinking water or brine in
their porous sedimentary strata. Only saline aquifers with saliferous ground water are con-
sidered for the storage of CO2. The very slow flowing movement of the ground water (ap-
proximately a few cm per year) prevents the fast migration of the CO2 within the aquifer.
Such saline aquifers are widespread. In Germany, they are mainly found in the North Ger-
man Plain and the North Sea. It is generally assumed that the injected CO2 would remain
safe underground for the long term due to dissolution and mineralisation.

RECCS plus – Update and Expansion of the RECCS Study
142 Final Report
Oil and natural gas fields
Depleted oil and natural gas fields are ideal for storing CO2 underground. Carbon dioxide is
injected below the structure, causing it to rise, due to the difference in density (similar to the
formation of oil and natural gas). It then collects beneath the roof. Depleted oil and natural
gas fields have shown they have caps that have been suitable for millions of years. Equally,
these caps are assumed to be impermeable to greenhouse gases. However, it is important to
note that CO2 has different chemical properties to those of oil or natural gas, which could
cause problems. Above all, it is important to mention that the formation of carbonic acid,
caused by the dissolution of CO2 in the water, creates an acidic and therefore corrosive envi-
ronment (Hunt 1995, Ennis-King and Paterson 2007, Kharaka et al. 2006).
The initiation of the commercial application of CCS could be triggered by the expansion of
tertiary oil recovery, which has already been applied for decades in the USA. Here, naturally
occurring CO2 is injected into oil fields to enhance extraction (enhanced oil recovery, EOR).
Using this method, some of the oil is forced out of the formation. However, the CO2 also
blends with it, reducing the viscosity of the oil and making recovery easier. The CO2 must
then be separated from the oil. Further information on EOR and the environmental impacts
associated with it can be found in Section 7.8.
Another similar technology is enhanced gas recovery (EGR) using CO2, which, as yet, is a
long way from becoming commercially available (Grünwald 2008).
Deep coal seams
Another option under discussion is the injection of CO2 into deep uneconomical coal seams
and depleted coal mines. When the gas comes into contact with the surface of the coal, it is
absorbed and, therefore, bonds to it. This reaction, successful in a laboratory setting, must
first be proven in natural environments in a series of extensive experiments. So far, in situ
tests have encountered severe problems. For this reason, the option for storing CO2 in coal
deposits has until now been declared as unfeasible because of safety concerns and storage
efficiency issues (Shi and Durucan 2005). This storage option is not being considered in
Germany because the underground is highly fissured due to coal production, and it appears
impossible to guarantee controlled injection (May 2003).
7.2.2 Characteristics of suitable reservoir rocks
Reservoir rock must meet certain prerequisites if the deposit of CO2 is to be successful. The
central criterion is an impermeable cap rock to prevent the injected gas from escaping to-
wards the surface (see Fig. 7-1 in which the example of an aquifer is given). In addition, suit-
able injectivity must be guaranteed; in other words, the quantity of CO2 that needs to be in-
jected must reach the subsurface in the stipulated time. This condition is known as permea-
bility. In contrast, the ratio of pore space to the total volume of a rock is defined as its po-
rosity. The injected CO2 can only spread into the depression and provide sufficient space for
subsequent quantities if the pores are connected to one another. If the pores are too small,
an extremely high level of pressure must be applied to allow the gas to pass through the rock
structures.
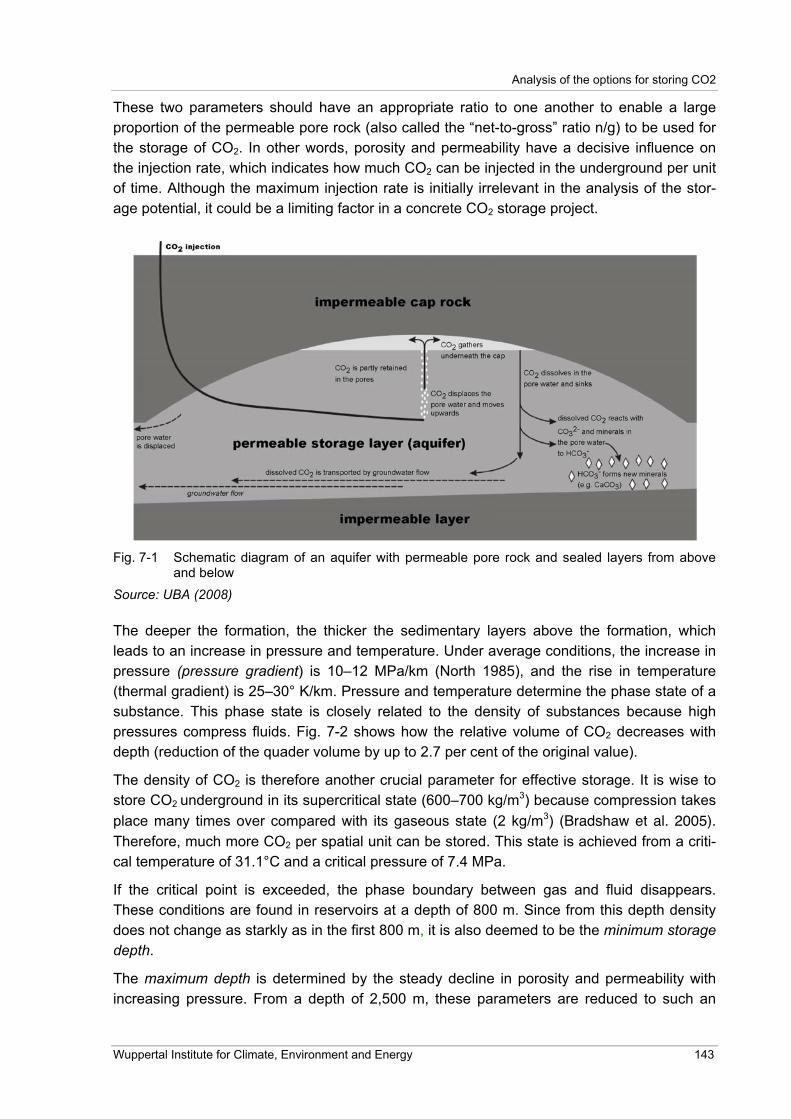
Analysis of the options for storing CO2
Wuppertal Institute for Climate, Environment and Energy 143
These two parameters should have an appropriate ratio to one another to enable a large
proportion of the permeable pore rock (also called the “net-to-gross” ratio n/g) to be used for
the storage of CO2. In other words, porosity and permeability have a decisive influence on
the injection rate, which indicates how much CO2 can be injected in the underground per unit
of time. Although the maximum injection rate is initially irrelevant in the analysis of the stor-
age potential, it could be a limiting factor in a concrete CO2 storage project.
Fig. 7-1 Schematic diagram of an aquifer with permeable pore rock and sealed layers from above and below
Source: UBA (2008)
The deeper the formation, the thicker the sedimentary layers above the formation, which
leads to an increase in pressure and temperature. Under average conditions, the increase in
pressure (pressure gradient) is 10–12 MPa/km (North 1985), and the rise in temperature
(thermal gradient) is 25–30° K/km. Pressure and temperature determine the phase state of a
substance. This phase state is closely related to the density of substances because high
pressures compress fluids. Fig. 7-2 shows how the relative volume of CO2 decreases with
depth (reduction of the quader volume by up to 2.7 per cent of the original value).
The density of CO2 is therefore another crucial parameter for effective storage. It is wise to
store CO2 underground in its supercritical state (600–700 kg/m3) because compression takes
place many times over compared with its gaseous state (2 kg/m3) (Bradshaw et al. 2005).
Therefore, much more CO2 per spatial unit can be stored. This state is achieved from a criti-
cal temperature of 31.1°C and a critical pressure of 7.4 MPa.
If the critical point is exceeded, the phase boundary between gas and fluid disappears.
These conditions are found in reservoirs at a depth of 800 m. Since from this depth density
does not change as starkly as in the first 800 m, it is also deemed to be the minimum storage
depth.
The maximum depth is determined by the steady decline in porosity and permeability with
increasing pressure. From a depth of 2,500 m, these parameters are reduced to such an

RECCS plus – Update and Expansion of the RECCS Study
144 Final Report
extent that it becomes extremely difficult to inject CO2 into the formation (Vangkilde-
Pedersen et al. 2008). For this reason, suitable storage reservoirs would be located at a
depth of between 800 and 2,500 m.
Fig. 7-2 How the density, and hence the volume, of CO2 changes with depth (the density’s unit must be kg/m
3)
Source: Based on IPCC 2005
In aquifers, the bed rock in this region is water-saturated. The water has a very high salt con-
tent and, under average conditions, contains over 300 g/l dissolved substances. This water
must be displaced or, if insufficient space is available, compressed to enable sufficient quan-
tities of CO2 to be stored. If the pressure cannot be increased any further, then the water
must be extracted from the formation.
Tab. 7-1 shows the maximum and minimum values of the decisive parameters for selecting
storage sites.
Tab. 7-1 Overview of the characteristic properties of suitable reservoir rocks (minimum, maximum
and optimum conditions)
Property Unit Minimum Optimum Maximum Example *
Permeability Cap rock mD as low as possible 1 - 10
Reservoir mD 200 > 300 > 1,000 100–700
Porosity Cap rock % - < 10 10
Reservoir % 10 20 30 18.7
Thickness Cap rock m 20 > 100 infinite infinite
Reservoir m 20–50 100 300 200
CO2 density kg/m3 500 700 750 650
Depth m 800 1,200 2,500 200–3000
* = properties of a Lower Trias reservoir (UK), average values following (Bentham 2006)
Source: Höller 2009

Analysis of the options for storing CO2
Wuppertal Institute for Climate, Environment and Energy 145
7.2.3 Open and closed formations
When considering the type of storage sites, a differentiation can be made between closed
and open structures and closed and open systems. In the following, we first describe geo-
logical structures.
Fig. 7-3 shows the differences between structures using examples from oil and natural gas
geology. The most well-known type of closed structure, also called a trap, is an anticlinal
arch structure, which can be best imagined as a subterranean hill (illustration (a)). In addition
to these structural traps, other hydrocarbon storage sites can be found in faults (b) or strati-
graphic traps (c). Furthermore, illustration (d) shows accumulation in salt domes. Since these
closed structures have previously retained oil and natural gas, they are equally well suited for
the storage of CO2. In this case, the CO2 is accumulated as mobile phase beneath the cap
rock.
Fig. 7-3 Overview of various geological structures in which oil and natural gas have accumulated
Source: Grotzinger and Jordan 2010
In addition to anticlines, there are also rocks with layers that dip towards the centre of the
structure, so-called syncline structures. These syncline formations are open towards the top,
which can lead to the further dissipation of CO2 underground, increasing risks to safety (Dose
2008). A syncline and an anticline structure are shown in Fig. 7-4.

RECCS plus – Update and Expansion of the RECCS Study
146 Final Report
Fig. 7-4 Geological formations to explain the terms anticline and syncline
Source: Grotzinger and Jordan 2010
Structures can be part of an open or closed system (Fig. 7-5). In both cases, the water would
be compressed and displaced after injection. In a closed system, an injection of CO2 would
increase the pressure within the system, and the compression would make space for the
gas.
If the structure is connected to a large aquifer, it is described as an open system (bottom left
in Fig. 7-5). In this case, the displacement process prevails during injection. The quantity of
salt water that can be displaced out of the formation without having a negative impact on
humans and the environment is determined by efficiency. Only a certain amount of CO2 can
be injected before a potentially catastrophic outcome, such as the salinisation of potable
water reservoirs or the seepage of salt water to the surface. The much discussed term “leak-
age” is then given a new dimension because it is no longer only the CO2 that could enter the
atmosphere from the underground, but also deep ground water with a very high salt content.
In the legal definition of Section 6.1.2.2, the term for the structure was called the storage site.
The whole system in which this site is located is called the storage complex.
It is relevant to make a distinction between these two terms, particularly when the possible
leakage of CO2 is involved. The German Federal Environment Agency (UBA 2009) views
even the escape of CO2 from the storage site as a leakage, whereas the CCS Directive
2009/31/EC only defines leakage when the injected gas leaks out of the storage complex.
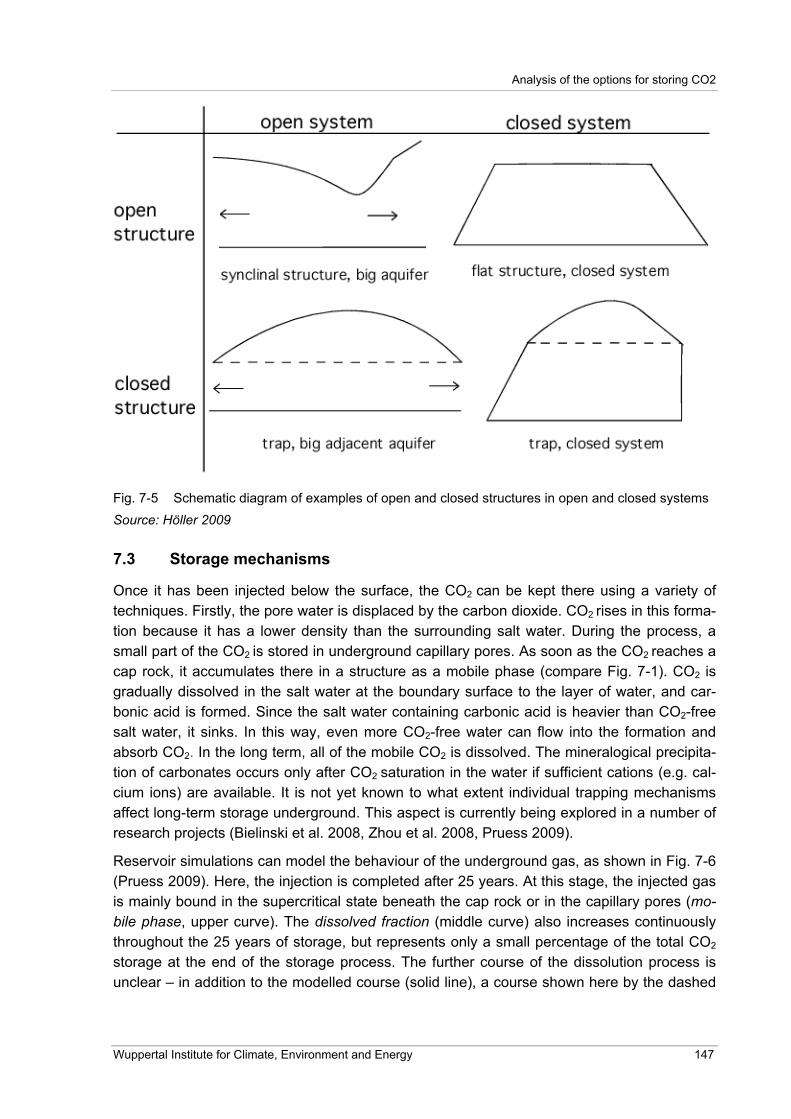
Analysis of the options for storing CO2
Wuppertal Institute for Climate, Environment and Energy 147
Fig. 7-5 Schematic diagram of examples of open and closed structures in open and closed systems
Source: Höller 2009
7.3 Storage mechanisms
Once it has been injected below the surface, the CO2 can be kept there using a variety of
techniques. Firstly, the pore water is displaced by the carbon dioxide. CO2 rises in this forma-
tion because it has a lower density than the surrounding salt water. During the process, a
small part of the CO2 is stored in underground capillary pores. As soon as the CO2 reaches a
cap rock, it accumulates there in a structure as a mobile phase (compare Fig. 7-1). CO2 is
gradually dissolved in the salt water at the boundary surface to the layer of water, and car-
bonic acid is formed. Since the salt water containing carbonic acid is heavier than CO2-free
salt water, it sinks. In this way, even more CO2-free water can flow into the formation and
absorb CO2. In the long term, all of the mobile CO2 is dissolved. The mineralogical precipita-
tion of carbonates occurs only after CO2 saturation in the water if sufficient cations (e.g. cal-
cium ions) are available. It is not yet known to what extent individual trapping mechanisms
affect long-term storage underground. This aspect is currently being explored in a number of
research projects (Bielinski et al. 2008, Zhou et al. 2008, Pruess 2009).
Reservoir simulations can model the behaviour of the underground gas, as shown in Fig. 7-6
(Pruess 2009). Here, the injection is completed after 25 years. At this stage, the injected gas
is mainly bound in the supercritical state beneath the cap rock or in the capillary pores (mo-
bile phase, upper curve). The dissolved fraction (middle curve) also increases continuously
throughout the 25 years of storage, but represents only a small percentage of the total CO2
storage at the end of the storage process. The further course of the dissolution process is
unclear – in addition to the modelled course (solid line), a course shown here by the dashed

RECCS plus – Update and Expansion of the RECCS Study
148 Final Report
red line could also be conceivable. The mineralogical deposit is only noticeable over the
course of millennia, but does increasingly contribute to permanence.
Fig. 7-6 Reservoir simulation of CO2 injection into a saline aquifer where the injection is stopped after 25 years
Source: Based on Pruess 2009
The storage capacity is calculated on the assumption that the capture process in the power
plant, the transport and the storage of CO2 underground takes place continuously until the
storage site is full. Due to the constant injection over a relatively short (geological) period,
only the first underground processes are activated. For this reason, capacity estimates gen-
erally only include supercritical CO2. It takes decades before the dissolution and mineral
binding takes place in relevant quantities, and these do not affect the estimates. If, however,
the storage process is interrupted for a longer period, space may be created for additional
injections due to the dissolution of CO2 in the salt water.
7.4 Methods for estimating capacity
When calculating storage potentials, a methodological distinction is made between a “top-
down” and a “bottom-up” approach. In the “top-down” approach, a total volume (for example,
for the whole of Germany) is assumed. This total volume is then restricted according to vari-
ous criteria (“volumetric concept”). Using the “bottom-up” method, single structures are con-
sidered and their capacities added together to calculate the total storage potential. While the
volumetric concept is usually used for aquifers, the “bottom-up” approach is generally applied
for hydrocarbon fields. We will now proceed to review these two concepts in detail.
7.4.1 Deep saline aquifers
The most common method for estimating the capacity of deep saline aquifers is based on the
volumetric concept. In this case, the storage capacity is calculated using Formula 7.1:

Analysis of the options for storing CO2
Wuppertal Institute for Climate, Environment and Energy 149
(7.1)
where
= gravimetric storage capacity, theoretical or effective, [ ] = kg;
= volume of the potential formation, [ ] = m3;
= porosity, [ ] = %;
= proportion of sediment structures with porosity and permeability suitable for absorb-
ing CO2 (net-to-gross ratio), [ ] = per cent;
= proportion of traps in the total volume, [ ] = %;
= density of the CO2, [ ] = kg/m3.
First, the volume (m3) is calculated from the average available subterranean area (m2) and
the thickness of the aquifers (m). This volume is then restricted to the fraction of the volume
that can absorb CO2, using the net-to-gross ratio. For acceptance reasons and for easier
monitoring, CO2 should only be stored in closed structures. This is documented in most stud-
ies, and is achieved by considering traps%. The gravimetric theoretical storage capacity
of CO2 is obtained by taking into account the density .
The theoretical storage capacity calculated using Equation 7.1 is applied to calculate the
pore volume of a reservoir rock. However, it is impossible to fill this total volume with CO2
because the pores are water-saturated. For this reason, efficiency factor E, which takes the
potential water displacement and compressibility into account, is required. Applying this fac-
tor produces the effective CO2 storage capacity (= volumetric capacity in May 2009):
(7.2)
where
= efficiency factor, [ ] = %.
To classify the various terms related to capacity, the Carbon Sequestration Leadership
Forum (CSLF) proposed the “techno-economic resource pyramid for capacity for CO2 geo-
logical storage” (Bachu et al. 2007). A modified version of this pyramid is shown in Fig. 7-7.
Factor E is used to convert theoretical capacity into effective capacity, which equates to one
step higher up the pyramid. This factor E is the major unknown quantity in most publications
and varies considerably (40 per cent in May et al. 2005, 5–40 per cent in Christensen 2009,
1–4 per cent in Frailey 2008, 0.1–1 per cent in Ehlig-Economides and Economides 2010). A
comprehensive list of efficiency factors from various studies is given in (Höller 2009). The
efficiency factor does not always relate to the same volume, however, but depends on
whether only the traps or the total aquifer is selected as the affected pore volume. If the fac-
tor applies to the total aquifer, the value traps% must be omitted in Formula 7.1.

RECCS plus – Update and Expansion of the RECCS Study
150 Final Report
Fig. 7-7 Pyramid showing the interrelation of storage capacities
Source: Modified from Vangkilde-Pedersen et al. 2008
While the efficiency factor is taken to be a fixed amount in most cases, the following two ex-
amples show a more detailed breakdown. In both variants, the factor refers to the volume of
the total aquifer or the affected pore space in the aquifer.
• For open systems, the U.S. Department of Energy (U.S. DoE) provides a clear derivation
of the efficiency factor. Here E, as shown in Equation 7.3, is divided into various partial
factors (Frailey 2008). Multiplying these partial factors yields a storage efficiency of 1 to
4 per cent. The net-to-gross ratio (n/g), the volumetric efficiency (Ev) and the displace-
ment efficiency (Ed) are taken into account (Höller 2009, simplified following Frailey
2008):
(7.3)
• On the other hand, Van der Meer and Yavuz (2009) assume that every system must be
viewed as finite, i.e. closed, and that it is impossible to displace salt water from the aqui-
fer system. The injected gas only displaces water within the system, i.e. from the trap
structure to the adjacent aquifer, but not beyond it. At the same time, however, the re-
servoir pressure of the total system increases. The space affected by this pressure
propagation is called the “total affected space”. The arguments presented frequently fail
to consider what would happen to the potentially displaced water, because it would oc-
cupy space in another area underground or, in the worst case scenario, could reach the
earth’s surface. For this reason, scientists calculate the estimate using an efficiency fac-
tor based on the compressibility of formation water (cw) and the pores or the rock (cp).
They also take into consideration a maximum possible increase in pressure in the total
formation ( ) (compare also Thibeau 2009):
(7.4)
This factor is applied to the total affected system. In the trap structure where the injection
takes place, however, a considerably higher proportion of water could be displaced, as
Analysis of the options for storing CO2
Wuppertal Institute for Climate, Environment and Energy 151
long as the total pressure does not exceed the maximum. The stability of the limiting cap
rock should always be guaranteed, otherwise safety could be jeopardised.
It becomes evident that the aforementioned distinction between open and closed systems
(Fig. 7-5) is crucial to the calculation of the efficiency factor. The more further restrictive fac-
tors are considered, the more they decrease the potential for CO2 injection. The step from
effective to practical capacity is accompanied by economic and regulatory or legal barriers.
Geotechnical considerations must also be taken into account. These factors may reduce the
potential yet further, due to the quality of the cap, interaction between various storage sites
and injectivity per time unit. Competitive usage and public acceptance also play a decisive
role (SRU 2009a). If the injection of CO2 at a particular storage site is rejected by the public,
then its practical capacity equals zero.
7.4.2 Depleted oil and natural gas storage sites
The storage capacity for CO2 in depleted oil and natural gas traps is calculated using the vol-
umes of recovered hydrocarbons. The volume can be calculated from either the originally
available reserves and an extraction factor or from the cumulated extraction volume
Vgas(STP). If a field has not yet been completely exhausted, many authors include an addi-
tional proportion of the remaining reserves in the calculation because this space can also be
used as a CO2 storage site once extraction has been completed (Hoth et al. 2007). The cal-
culation is then carried out with a larger volume, leading correspondingly to a higher CO2
storage potential.
Another factor is required to assess this storage site to allow for the change in density of the
oil or natural gas between the reservoir conditions and the earth’s surface. This factor is
called the gas expansion factor (Bg) in the case of natural gas and the formation volume fac-
tor (FVF) in the case of oil. With the density of CO2 ( ), this produces the calculation in
accordance with Formula 7.5 for the theoretical storage quantity of CO2 in natural gas fields
(oil calculations are carried out analogously, but would make only a negligible contribution to
the amount of CO2 storage available in Germany):
(7.5)
where
= theoretical gravimetric storage capacity in natural gas fields, [ ] = kg;
= volume of the extracted natural gas at the earth’s surface under standard
conditions (p = 1000 hPa, T = 15°C), [ ] = m3;
= density of the CO2, [ ] = kg/m3;
= gas expansion factor, [ ] = 1.
Most authors do not differentiate between these computed theoretical storage capacities and
the effective storage capacity based on an efficiency factor. In the advanced concept in the
GeoCapacity report (Vangkilde-Pedersen et al. 2009a), the injected gas or injected water is
at least subtracted from the volume introduced for additional recovery.
RECCS plus – Update and Expansion of the RECCS Study
152 Final Report
In 2007, the CSLF defined an efficiency factor for natural gas fields (Bachu et al. 2007). Effi-
ciency factor E comprises here of mobility and the buoyancy of the CO2 underground, the
heterogeneity of the geological structures, water saturation and the formation thickness.
Thus it contains water migration in a depleted storage site connected to the ground water,
which is often observed. The reduction of the pore space due to settlement induced by ex-
traction should also be considered.
Holloway et al. (2006) consider that between 65 and 90 per cent is a realistic efficiency fac-
tor. Hendriks et al. (2004) estimate a value of 75 per cent, which would reduce the storage
capacity by a quarter. This approach is supported by a new study by the IEA Greenhouse
Gas R&D Programme (IEA GHG 2009a). This has led to the downward adjustment of earlier
global storage potential estimates. In addition, capacities are also adjusted further downward
since 50 and 100 million tonnes of CO2 are deemed to be the minimum capacity per storage
site for onshore and offshore storage, respectively. The Scottish Carbon Capture and Stor-
age Centre also assumes a minimum size of 50 million tonnes of CO2, but only refers to
fields in the North Sea (SCCS 2009b).
7.5 CO2 storage capacity for Germany
The total capacity for the geological storage of CO2 is calculated from the capacity estimates
for the individual types of formation. For Germany, these types are saline aquifers beneath
the landmass, suitable offshore formations (i.e. beneath the North Sea within German sover-
eign territory) and depleted oil and natural gas storages sites. We will now discuss these
types of formation individually. We will then proceed to determine their potential for CO2 stor-
age, and compare it to other estimates.
7.5.1 The geological situation in Germany
In Germany, most potential storage structures can be found in the North German Basin and
the North Sea (Fig. 7-8), where there is a considerable quantity of depleted natural gas
fields. These fields would make the rapid introduction of CO2 storage easier, due to relevant
geological data being already available.
Since this storage space is limited, it would be necessary to revert to saline aquifers if CCS
technology were to be used on a large scale. These structures can also be found in the North
German Basin. The North Sea could serve as potential storage space. It is particularly suit-
able as it has enormous sediment backfilling (primarily Rotliegendes) that has accumulated
from contributory rivers over millions of years. However, the German section is small com-
pared to the possibilities available in Norwegian or British waters. In addition, public accept-
ance is more likely to be gained for offshore projects than on populated land. Several protest
groups across Europe have already campaigned against underground exploration projects
and the potential final disposal of CO2.
Molasse from the northern pre-Alpine area and the Upper Rhine Graben provides a few use-
ful sedimentary structures. Due to seismic activity there, however, the risks involved in using
them for CO2 storage cannot be estimated. For this reason, they should not be included in
the calculation.
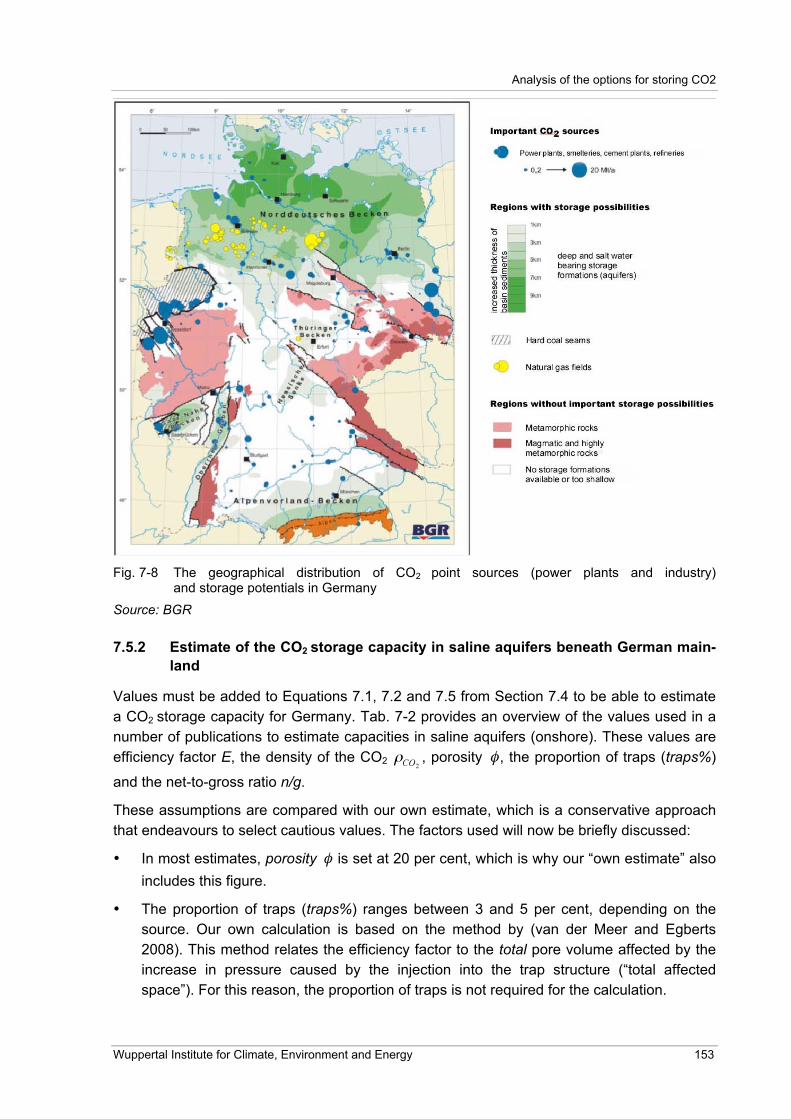
Analysis of the options for storing CO2
Wuppertal Institute for Climate, Environment and Energy 153
Fig. 7-8 The geographical distribution of CO2 point sources (power plants and industry) and storage potentials in Germany
Source: BGR
7.5.2 Estimate of the CO2 storage capacity in saline aquifers beneath German main-
land
Values must be added to Equations 7.1, 7.2 and 7.5 from Section 7.4 to be able to estimate
a CO2 storage capacity for Germany. Tab. 7-2 provides an overview of the values used in a
number of publications to estimate capacities in saline aquifers (onshore). These values are
efficiency factor E, the density of the CO2 , porosity , the proportion of traps (traps%)
and the net-to-gross ratio n/g.
These assumptions are compared with our own estimate, which is a conservative approach
that endeavours to select cautious values. The factors used will now be briefly discussed:
• In most estimates, porosity is set at 20 per cent, which is why our “own estimate” also
includes this figure.
• The proportion of traps (traps%) ranges between 3 and 5 per cent, depending on the
source. Our own calculation is based on the method by (van der Meer and Egberts
2008). This method relates the efficiency factor to the total pore volume affected by the
increase in pressure caused by the injection into the trap structure (“total affected
space”). For this reason, the proportion of traps is not required for the calculation.
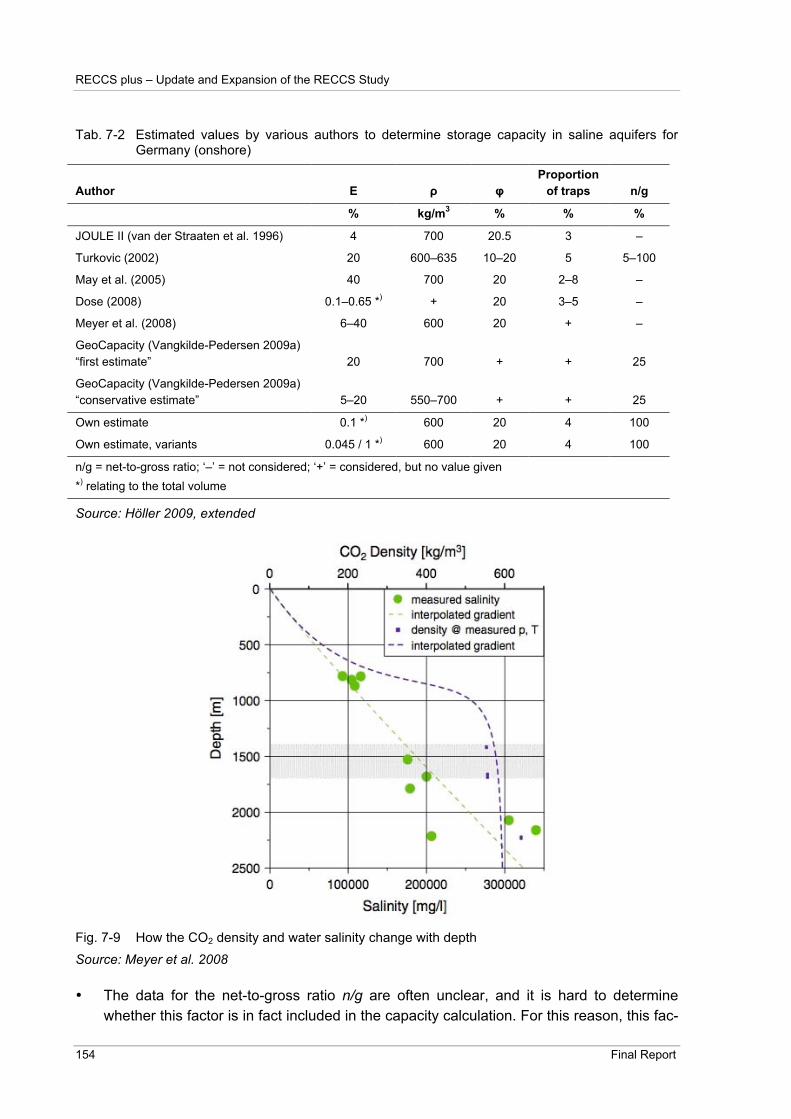
RECCS plus – Update and Expansion of the RECCS Study
154 Final Report
Tab. 7-2 Estimated values by various authors to determine storage capacity in saline aquifers for Germany (onshore)
Author E ! "
Proportion
of traps n/g
% kg/m3 % % %
JOULE II (van der Straaten et al. 1996) 4 700 20.5 3 –
Turkovic (2002) 20 600–635 10–20 5 5–100
May et al. (2005) 40 700 20 2–8 –
Dose (2008) 0.1–0.65 *) + 20 3–5 –
Meyer et al. (2008) 6–40 600 20 + –
GeoCapacity (Vangkilde-Pedersen 2009a)
“first estimate” 20 700 + + 25
GeoCapacity (Vangkilde-Pedersen 2009a)
“conservative estimate” 5–20 550–700 + + 25
Own estimate 0.1 *) 600 20 4 100
Own estimate, variants 0.045 / 1 *) 600 20 4 100
n/g = net-to-gross ratio; ‘–’ = not considered; ‘+’ = considered, but no value given
*) relating to the total volume
Source: Höller 2009, extended
Fig. 7-9 How the CO2 density and water salinity change with depth
Source: Meyer et al. 2008
• The data for the net-to-gross ratio n/g are often unclear, and it is hard to determine
whether this factor is in fact included in the capacity calculation. For this reason, this fac-

Analysis of the options for storing CO2
Wuppertal Institute for Climate, Environment and Energy 155
tor was not considered in our own estimate (the set value of 100 per cent does not influ-
ence the final result).
• The density % of CO2 chosen in our own estimate is 600 kg/m3, which falls in the lower
region of the values listed. The choice of this value is attributed to (Gerling 2008), who
specifies the density of pure CO2 at between 600 and 650 kg/m3. If impurities were in-
cluded, this value would be further reduced. The value chosen is supported by the den-
sity development from the Schweinrich structure (see Fig. 7-9).
• The efficiency factor is the most significant parameter. Tab. 7-2 shows a range from 0.1
to 40 per cent, i.e. a variation around a factor of 400. The different values depend not
only on whether closed or open systems are considered, but also on the volume to
which the estimate refers.
For our own conservative estimate, it appears justifiable to assume only closed forma-
tions for CO2 injection. For this reason, we follow the definition by (van der Meer and
Egberts 2008), which interprets all systems as finite. According to this definition, the
maximum pressure increase and the compressibility of rock (cp) and water (cw) are re-
sponsible for calculating efficiency factor E (see Formula 7.4). The efficiency factor is
applied to the pore volume of the total system.
With regard to storage site safety, (van der Meer and Egberts 2008) consider a value of
1 MPa for the increase in pressure to be suitable for northern Europe. (Dose 2008) com-
putes a scenario with 1.3 MPa in a similar manner. The value of 1 MPa is therefore as-
sumed for the conservative estimate. Several authors consider a total compressibility c
(= cp + cw) of 1*10-3/MPa to be realistic (Dose 2008 and Thibeau 2009, amongst others).
Using Formula 7.4, we calculate an efficiency factor of 0.1 per cent.
The factors considered must be measured and calculated individually for each structure,
depending on their geological characteristics. For this reason, only an average value or
range of fluctuation can be selected for the cautious estimate made here. This is implied
by two sensitivity analyses:
- For Sensitivity Analysis 1, the maximum increase in pressure is retained at 1 MPa,
and a lower value for total compressibility c is assumed. This factor varies in the lit-
erature between 0.45*10-3/MPa (van der Meer 2009), 0.8*10-3/MPa (Zhou et al.
2008) and 1*10-3/MPa (Holloway et al. 2009). To represent a range of possible ca-
pacities, the lowest value of 0.45*10-3/MPa is chosen. This sensitivity analysis leads
to an efficiency factor of 0.045 per cent.
- In Sensitivity Analysis 2, on the other hand, the maximum increase in pressure is
varied. Here, we referred to other publications in which an increase in pressure in
the total system of 6 MPa (Zhou et al. 2008), 8 MPa (Thibeau 2009) or 10 MPa
(Holloway et al. 2009) is considered possible. 10 MPa is used for this sensitivity an-
alysis. The total compressibility remains at 1*10-3/MPa. These values lead to an effi-
ciency factor of 1 per cent.
Overall, a range of 0.045–1 per cent is yielded for the efficiency factor, with a basic value
of 0.1 per cent.

RECCS plus – Update and Expansion of the RECCS Study
156 Final Report
This range is also confirmed in other studies: a current IEA GHG study on storage effi-
ciencies, for instance, computes an efficiency factor of 0.59 per cent, related to the total
volume, for closed systems (IEA GHG 2009). (Ehlig-Economides and Economides 2010)
also confirm that no more than 1 per cent of the pore volume, and maybe even up to 100
times less, can be used for storage. This would lead to efficiency factors between 0.01
and 1 per cent.
Let us point out here that the assumption of closed systems does not mean that all sys-
tems are closed in nature. Some studies assume mainly open systems, while others as-
sume all systems are closed. Bearing in mind the objective of our study, this assumption
is viewed as a scenario that represents a lower limit and presumes, for safety purposes,
that salt water should not be displaced.
If the values selected for our own estimate are now inserted into Formulas 7.1 and 7.2, a
CO2 storage capacity for aquifers (onshore) of 0.84 billion tonnes is obtained.
An aquifer area of 140,000 km2 and an average aquifer thickness of 50 m derived from (May
et al. 2005) are selected for our estimate.
If both variants of the efficiency factor (0.045 and 1 per cent) are used, storage capacities of
0.378 and 8.4 billion tonnes of CO2 are yielded.
Since this capacity estimate is based on the volumetric approach, i.e. no individual structures
are taken into consideration, the condition of a minimum size of an individual storage site
cannot be taken into account. Our own estimate of 0.84 billion tonnes (0.378–8.4 billion ton-
nes) must be seen alongside results by other authors amounting to 0.47–42 billion tonnes
(see Tab. 7-4). The large variation in the values is largely explained by the very different as-
sumptions regarding the efficiency factor.
7.5.3 Estimate of CO2 storage capacity in saline aquifers of the German North Sea
Estimates of the storage capacity for CO2 in aquifers of the German North Sea have only
recently been published. The first estimate, presented by (May 2009), produced values of
between 4 and 10 billion tonnes. However, the calculation used to gain these values was not
published. The GeoCapacity Final Report describes these formations in further detail. In this
report, a conservative estimate of storage potential of 2.9 billion tonnes was calculated using
the “bottom-up” approach (Vangkilde-Pedersen et al. 2009b). In the calculation, only storage
sites with a filling capacity of over 100 million tonnes of CO2 were included. This explicitly
conservative estimate seems to be plausible because site-specific analyses were performed,
details of which, however, are not given.
For this reason, we refrain here from conducting our own estimate. Instead, we assume the
basic value of 2.9 billion tonnes of CO2 with a range of fluctuation of 1.88–4.50 billion tonnes
of CO2 (Tab. 7-4).
Offshore storage, however, is very different to onshore storage, as described by (Schrag
2009). The pore water in aquifers below the ocean is similar to seawater. Hence, if this water
were to escape into the sea, it would not contaminate drinking water or terrestrial vegetation
close to the surface, let alone the local population. Storage beneath the seabed should,
therefore, be more likely to gain public acceptance. (Schrag 2009) assumes, however, that

Analysis of the options for storing CO2
Wuppertal Institute for Climate, Environment and Energy 157
pore water would have to be extracted prior to the injection of CO2 to ensure that the in-
crease in pressure remains controllable. The potential for CO2 storage could, therefore, be
significantly increased. Whether such a release of brine into the sea really is harmless, as
(Schrag 2009) maintains, should be examined in more detailed environmental analyses.
Here, local flow conditions and the varying salt contents in aquifer and sea water would have
to be taken into account.
7.5.4 Evaluation of CO2 storage capacity in depleted oil and natural gas fields
The CO2 storage capacity in natural gas fields is calculated using the previous cumulated
extraction of the natural gas. Since not all natural gas fields in Germany are depleted, the
quantity of natural gas in the reserves is also included in the calculation. This inclusion in-
creases the potential storage volume considerably. Below, we will explore how both calcula-
tions are computed in further detail.
Tab. 7-3 CO2 storage capacities for Germany in natural gas fields
JOULE II GESTCO BGR GeoCapacity Own estimate
1996 2004 2005 2009
Basic
value Variant
Size of gas
field > 10 Mt > 5 Mt > 10 Mt > 5 Mt > 10 Mt > 10 Mt
(*) 1.78 1.77 2.13 2.18 1.34a 1.61
b
(+) 2.34 2.23 2.75 2.81 1.62a 1.94
b
All quantities given in gigatonnes of CO2, unless otherwise stated.
* = based on the cumulative previous recovery of natural gas
+ = additional proportion of reserves
a = efficiency factor 75%
b = efficiency factor 90%
Source: Authors’ design
The difference between the various CO2 storage capacity estimates is lowest for natural gas
fields because all calculations are based on the cumulative recovery of natural gas (marked
with * in Tab. 7-3). However, stipulating the minimum storage size creates a difference. A
differentiation is made of between 5 and 10 million tonnes. This means that a natural gas
field must have space for at least 5 and 10 million tonnes of CO2, respectively, in order to be
considered as a storage site. It would not be profitable to construct the necessary infrastruc-
ture for fields that are too small. It can be seen from Tab. 7-3, however, that this stipulation
makes little difference to the estimates. JOULE II, for instance, calculates very similar values
for natural gas fields larger than 10 million tonnes to those yielded in GESTCO for fields lar-
ger than 5 million tonnes. This is also the case when comparing BGR (Federal Institute for
Geosciences and Natural Resources) with GeoCapacity. In the context of these many uncer-
tain assumptions, this difference can, therefore, be overlooked. However, the effect of the
upper limit of 50 and 100 million tonne minimum capacity on storage sites defined by (IEA
GHG 2009a and SCCS 2009b) should be examined because it would considerably restrict
potential.

RECCS plus – Update and Expansion of the RECCS Study
158 Final Report
The reserve fraction in the storage sites is significant and it is important to take this into ac-
count. This reserve fraction is the part of the natural gas still remaining in the gas fields and
which, according to current knowledge, can be extracted prior to potential CO2 injection. In
Tab. 7-3, this is marked with “+”. The proportion of potential CO2 storage to the total volume
already determined for the previous amount extracted is applied to the reserves. This addi-
tional proportion is then added to the values marked with “*”. If, on the other hand, the calcu-
lations of BGR and GeoCapacity are compared, approximately the same values are yielded
(2.75 billion tonnes compared to 2.81 billion tonnes). It is not clear, however, why
BGR/GeoCapacity have generated capacities 20 per cent higher than JOULE II/GESTCO,
regardless of whether or not reserves are considered.
For the purpose of our own estimate, the extraction data of German gas fields were reana-
lysed (based on LBEG 2008). A slightly lower extraction quantity was yielded than in the
comparative studies (for further details, see Höller 2009). In addition, a density of 600 kg/m3
was used, as chosen to calculate capacities in saline aquifers.
This is the only estimate that includes an efficiency factor below the conventionally assumed
value of 100 per cent. The range from 75 per cent to 90 per cent was chosen, which (Hollo-
way et al. 2006) also recommend, because it is highly unlikely that CO2 will completely fill the
pores that previously held natural gas (Hendriks et al. 2004). The approach we have chosen
has since been substantiated by the new IEA Report, where an efficiency factor of 75 per
cent is introduced (IEA GHG 2009a). A storage capacity in natural gas fields ranging from
1.34 to 1.61 billion tonnes of CO2 (excluding reserves) or 1.62 to 1.94 billion tonnes of CO2
(including reserves) is then yielded.
For the summary of the total storage capacities for Germany (Tab. 7-4), the value including
reserves was used for gas fields. For our own estimate, therefore, 1.62 billion tonnes of CO2
was used as the basis and 1.94 billion tonnes of CO2 as a variant.
The quantity of the storage capacity in German oil fields is irrelevant to CCS projects, and is,
therefore, not explored in further detail here.
7.5.5 Estimate of the total CO2 storage capacity for Germany
If all of the reviewed studies are compared, a wide range of values for CO2 storage capacities
in Germany, ranging from 3 to 44 billion tonnes, is produced (see Tab. 7-4 and Fig. 7-10).
If the total capacity is considered, the estimate from the JOULE II Report (van der Straaten et
al. 1996) is in the lower range of 3 billion tonnes of CO2. The European research project
GESTCO and various estimates by the BGR, on the other hand, yield higher capacities,
ranging from 19 to 41 billion tonnes of CO2. As explained above, however, these estimates
are based on general assumptions for the efficiency factor that are not substantiated in de-
tail. These values also appear in the current Final Report of the GeoCapacity project, which
was drawn up on behalf of the German side by the BGR. In that report, however, the conser-
vative lower region of the most formative estimate for Germany by (May et al. 2005) is con-
sidered realistic, and the maximum CO2 storage capacity is estimated to be 17 billion tonnes.
An initial estimate by RWE (Asmus and Dose 2008) has not been considered in the compi-
lation since it considers only the area of North-West Germany excluding the North Sea
(around 6 billion tonnes of CO2 when considering fields larger than 10 million tonnes).
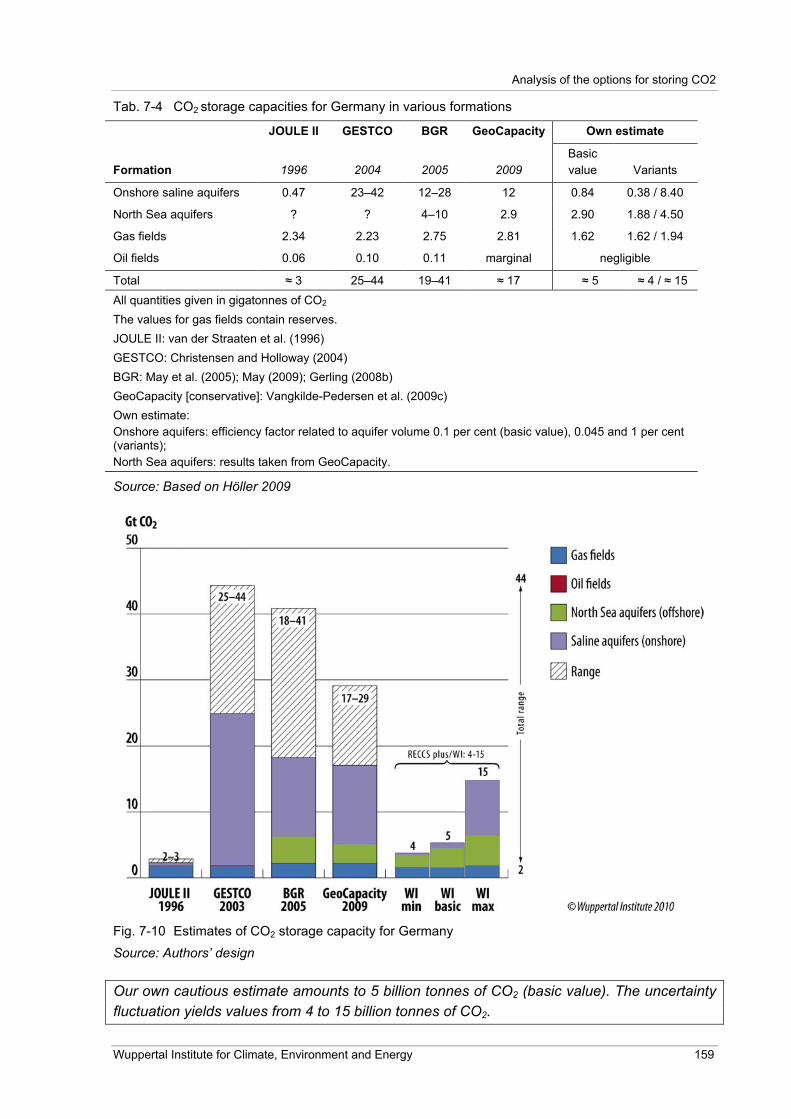
Analysis of the options for storing CO2
Wuppertal Institute for Climate, Environment and Energy 159
Tab. 7-4 CO2 storage capacities for Germany in various formations
JOULE II GESTCO BGR GeoCapacity Own estimate
Formation 1996 2004 2005 2009
Basic
value Variants
Onshore saline aquifers 0.47 23–42 12–28 12 0.84 0.38 / 8.40
North Sea aquifers ? ? 4–10 2.9 2.90 1.88 / 4.50
Gas fields 2.34 2.23 2.75 2.81 1.62 1.62 / 1.94
Oil fields 0.06 0.10 0.11 marginal negligible
Total & 3 25–44 19–41 & 17 & 5 & 4 / & 15
All quantities given in gigatonnes of CO2
The values for gas fields contain reserves.
JOULE II: van der Straaten et al. (1996)
GESTCO: Christensen and Holloway (2004)
BGR: May et al. (2005); May (2009); Gerling (2008b)
GeoCapacity [conservative]: Vangkilde-Pedersen et al. (2009c)
Own estimate:
Onshore aquifers: efficiency factor related to aquifer volume 0.1 per cent (basic value), 0.045 and 1 per cent (variants);
North Sea aquifers: results taken from GeoCapacity.
Source: Based on Höller 2009
Fig. 7-10 Estimates of CO2 storage capacity for Germany
Source: Authors’ design
Our own cautious estimate amounts to 5 billion tonnes of CO2 (basic value). The uncertainty
fluctuation yields values from 4 to 15 billion tonnes of CO2.

RECCS plus – Update and Expansion of the RECCS Study
160 Final Report
As a result of the analysis, with the basic value and the lower sensitivity analysis, German
offshore capacities are higher than the onshore value, although onshore German aquifers
are in principle considerably larger than offshore aquifers. The reason for this is that, due to a
lack of reliable data for offshore aquifers, it was not possible to carry out a comparable cau-
tious estimate, as was the case for onshore aquifers. Instead, the conservative estimate from
the GeoCapacity Final Report was assumed. If the cautious assumptions are moderated and
if, as in the upper sensitivity analysis, a higher increase in pressure is permitted, a different
relationship between onshore and offshore emerges.
Apparently, the greatest variation in the different estimates is also in the area of onshore sa-
line aquifers (ranging from 0.38 to 42 billion tonnes of CO2), which suggests that there are
considerable uncertainties in the estimates. The conservative estimate with regard to saline
aquifers of 12 billion tonnes contained in the GeoCapacity report has since also been ad-
opted by the German government, which estimated its storage potential to be “more in the
bottom area of this range” (of 20+/-8 billion tonnes) (BMWi 2009).
7.5.6 Comparison of the calculated storage potential with the quantity of CO2 emit-
ted in Germany
The estimates of storage capacities only become meaningful if the sources and sinks, i.e.
supply and demand for CO2 storage sites, are compared with one another. This is highlighted
using two different CO2 emissions scenarios:
• The total CO2 emissions caused by large point sources in Germany (power plants and
industry)59 were 388 million tonnes per annum in 2007. If additional energy expenditure
for the CCS technology chain of around 30 per cent (116 million tonnes per annum) and
a CO2 capture rate of 90 per cent are assumed, ultimately 454 million tonnes of CO2
would have to be stored annually. Provided that the total storage volume is available at
the beginning of the injection operation and the injection of the complete emissions for
one year is possible, the capacity of 17 billion tonnes computed in the GeoCapacity pro-
ject would suffice for 37 years. If the estimate of 5 billion tonnes presented here is con-
sidered, the entire quantity from these point sources could be stored for 12 years.
• If a “realistic” scenario is assumed, as presented for Germany in Chapter 10, a total of
1.2 billion tonnes of CO2 can be separated in the power plant sector by the year 205060.
It has been taken into account that not all emissions from combined heat and power
plants located in cities can be separated; in addition, the transportation of CO2 from
power plants and industrial plants in southern Germany (see Fig. 7-8) is likely to be un-
economical, due to the long distances involved. The quantities of CO2 incurred in this
scenario could be stored within Germany, even according to the conservative capacity
estimate. There would also be additional space for emissions from industry.
59 Determined via the European Pollutant Emission Register EPER, enquiry regarding electricity and heat
supply (all combustion plants with emissions > 1 million t/a), 2007, www.EPER.de 60
“REALISTISCH I” scenario for CCS in the power plant sector: new construction of 75 per cent of steam and
40 per cent of combined heat and power plants with CCS; retrofitting of 40 per cent of steam and of 20 per
cent of combined heat and power plants; CCS chain commercially operational from the year 2020.

Analysis of the options for storing CO2
Wuppertal Institute for Climate, Environment and Energy 161
Only the effective capacity, however, was used as the basis in each comparison. The practi-
cal capacity, generally lower than the effective capacity, would yield lower utilisation periods.
7.5.7 Conclusions from the analysis for Germany
The present estimates of the CO2 storage potential for Germany in saline aquifers and de-
pleted natural gas fields (both onshore and offshore) reveal a wide range of effective ca-
pacity of between 3 and 44 billion tonnes of CO2. The average can be taken as 17 billion
tonnes of CO2, which was the conservative estimate published in the GeoCapacity project for
Germany. The main reason for this extreme range is that the assumptions of storage effi-
ciency vary considerably.
• Efficiency in saline aquifers, which describes the proportion of water in the saturated
subsurface that can be displaced by the injected CO2, ranges from 0.1 to 40 per cent in
the analysed studies. Hence the range of fluctuation of capacities is also enormous – for
onshore aquifers alone, previous estimates vary between 0.47 billion tonnes (JOULE II),
12 billion tonnes (GeoCapacity), 28 billion tonnes (BGR) and 42 billion tonnes
(GESTCO).
• With natural gas fields, efficiency varies between 75 and 100 per cent of the cumulated
recovery of natural gas, and leads to a storage potential in the analysed studies of be-
tween 1.7 and 2.8 billion tonnes of CO2.
There is less deviation in the individual studies with regard to the values chosen for the den-
sity of CO2, the proportion of traps and porosity.
For our own cautious, conservative estimate, which seeks to illustrate a lower limit of the
potentially available capacity, in keeping with the objective of the study, the following results
can be summarised:
• With the deep saline aquifers, it is assumed that CO2 can only be injected in trap struc-
tures. Many authors justify this limitation because of its higher permanence, leading to
greater public acceptance. In addition, every system is viewed as being closed, resulting
in an efficiency factor, related to the total onshore aquifer volume, of 0.1 per cent. These
assumptions are confirmed by several new studies, which take the lower efficiency fac-
tors into account and advocate taking only closed underground systems into consider-
ation. Based on these assumptions, the conservative estimate of the storage capacity for
Germany in onshore saline aquifers amounts to 0.84 billion tonnes of CO2. The sensi-
tivity analyses with efficiency factors 0.045 per cent and 1 per cent yield a range of
fluctuation from 0.38 to 8.4 billion tonnes of CO2.
• The offshore aquifers had already been estimated conservatively in the GeoCapacity
report, which is why this calculation is assumed here. It gives an average capacity of 2.9
billion tonnes of CO2 (fluctuation of 1.88 to 4.4 billion tonnes of CO2). These values are
considerably higher than the capacities for onshore aquifers, even though German on-
shore aquifers are considerably larger than their offshore counterparts. The reason for
this is that, due to a lack of reliable data for offshore aquifers, it was impossible to carry
out a comparable cautious estimate, as had been the case for onshore aquifers. If the
cautious assumptions for onshore aquifers are moderated and if, as in the upper sensi-
RECCS plus – Update and Expansion of the RECCS Study
162 Final Report
tivity analysis, a higher increase in pressure is permitted, a different relationship between
onshore and offshore appears.
• A storage potential in depleted natural gas fields ranging from 1.34 to 1.61 billion tonnes
of CO2 (excluding reserves) and 1.62 to 1.94 billion tonnes of CO2 (including reserves)
was calculated by setting an efficiency factor of between 75 and 90 per cent. This as-
sumption seems to be justified because it is highly unlikely that the pores, previously
filled with natural gas, would be completely filled with CO2.
• Taking all formations together, the cautious, conservative estimate for Germany in this
study totals 5 billion tonnes of CO2 as the basic value. The uncertainty fluctuation yields
values from 4 to 15 billion tonnes of CO2.
If the total CO2 emissions caused by large point sources in Germany (power plants and in-
dustry) are considered (388 million tonnes per annum in 2007), then ultimately, 454 million
tonnes of CO2 would have to be captured annually. With the conservative estimate, these
emissions can be stored for 12 years (basic value) or for 8 or 33 years (sensitivity values). If
the “Realistisch I” scenario is assumed, as calculated in Chapter 10 for Germany, a total of
1.2 billion tonnes of CO2 could be captured in the power plant sector by the year 2050,
which, even under the assumption of the lowest estimate, could be stored within the geo-
graphic region of Germany. Only the effective capacity, however, was used as the basis in
each comparison. The practical capacity, generally lower than the effective capacity, would
yield lower utilisation periods.
Our analysis of the studies and the adoption of a conservative estimate show that there re-
main major uncertainties concerning the estimation of storage potential, particularly with re-
gard to saline aquifers. A further outcome is that the variation of individual parameters has a
considerable impact on the results of the calculation. We should point out that not only exist-
ing, but also our own estimates, are based on rough data. It is important to state a lower es-
timate, however, in the sense of a minimum value, to give politicians and industry a basis for
planning legislation and further investments.
Since the storage capacities analysed are merely approximate regional estimates, the pa-
rameters chosen should be checked and further research and geological investigations
should be undertaken to improve accuracy and knowledge. The objective should be to gain
extensive geological knowledge of all potential storage sites. This would subsequently estab-
lish the availability of potential storage and, therefore, the volume at sites. Although the Cata-
logue of Storage Capacities in Germany, currently under development, will help to improve
the database, it is by no means adequate with regard to the precise assessment of (site-
specific) storage options.
In addition, several geo-technical factors could not be taken into account in this study:
• In the discussion about the total quantity of effective storage capacity, it is often pres-
umed that all emissions from point sources can be injected. Instead of the cumulated
storage potential discussed here, however, the possible injection rate is likely to be the
limiting factor. (Gerling 2010), for instance, estimates the maximum quantity of CO2 that
can be injected annually into storage sites in Germany, based on assumptions by the
BGR, to be 50–75 million tonnes of CO2. Detailed examinations are required here to de-
termine which CCS potentials should, in fact, be implemented on the time line.

Analysis of the options for storing CO2
Wuppertal Institute for Climate, Environment and Energy 163
• How neighbouring structures are influenced by the injection of CO2 (for instance, with
regard to pressure) and the effect this has on total capacity are only rarely considered in
storage calculations. This interference should be examined further in practice, and
should be included in the calculations to refine this aspect.
• Underground seismic activity continues to be important. Areas that are susceptible to
natural earthquakes are precluded as storage sites. In addition, seismicity induced by
drilling and CO2 injection should also be analysed and avoided.
7.6 CO2 storage capacity in Europe
Following the detailed analysis of the storage options for CO2 within Germany, this section
now turns to the geology of Europe. We will first give an overview of existing studies for the
whole of Europe, before describing individual countries or groups of countries in further de-
tail. The analysis centres on Germany, and endeavours to determine whether neighbouring
countries have sufficient space for possibly accepting and storing German CO2 emissions. In
particular, the North Sea could serve as a potential storage site, and is explored separately.
A closer look is taken at the Utsira formation in the Norwegian North Sea. We will also exam-
ine the United Kingdom of Great Britain and Northern Ireland (UK), Norway, Denmark and
the Netherlands in more detail.
For each country, capacity estimates for saline aquifers, natural gas and oil fields will be
compiled, and a conservative estimate selected. In individual cases, we have added our own
analyses to this data. The capacity calculated in this way is not matched, however. If the
sources and sinks were scrupulously matched on the basis of potential transport routes, in-
frastructure considerations and issues of public acceptance, the available storage space
would be reduced further.
The results of the conservative estimate will then be compared with emissions from large
point sources (power plants and industrial plants) from the country in question (Tab. 7-6).
This comparison will enable us to state how much space could potentially be made available
for foreign greenhouse gas emissions. Here, the CO2 emissions from 2007 are used, despite
the fact that these figures neither consider the increased consumption of energy required to
capture CO2 nor the capture rate.
For reasons of clarity, the storage options in European countries that are at a greater dis-
tance from Germany, and therefore less significant in this context, are only explained briefly.
7.6.1 Overview of existing CO2 storage estimates for Europe
Europe has a wide range of geological structures. Porous sedimentary deposits, many of
which can be found in the North Sea region, are particularly suitable for the storage of CO2.
For this reason, the United Kingdom and Norway have the largest storage capacities. Tab.
7-5 gives an overview of the various estimates that already exist for Europe, by comparing
the estimates of the three large European research projects on CO2 storage capacities:
JOULE II (van der Straaten et al. 1996), GESTCO (Christensen and Holloway 2004) and
GeoCapacity (Vangkilde-Pedersen et al. 2009). In all, the storage estimates vary between 63
and 800 billion tonnes of CO2.

RECCS plus – Update and Expansion of the RECCS Study
164 Final Report
Saline aquifers
The range of estimates for saline aquifers is considered to be very wide. Calculations for oil
and natural gas fields fluctuate much less because better data sets are available for these
formations. JOULE II assumes a wide range for saline aquifers from 30 to 773 billion tonnes
of CO2. GESTCO adopts 71 to 116 billion tonnes of CO2 for Europe. ECOFYS (Hendriks et
al. 2004), on the other hand, is more cautious, and describes 10 billion tonnes as its “best
estimate” for saline aquifers from a range of 1 to 47 billion tonnes. GeoCapacity also includes
the North Sea, and therefore obtains a higher capacity of 100 to 350 billion tonnes of CO2.
Oil fields
With regard to the oil fields of Europe, storage capacities range from 6 billion tonnes of CO2
(JOULE II) to 16 billion tonnes of CO2 (ECOFYS). Many of these fields are in the North Sea,
and attempts are being made to increase recovery using CO2 injection. This process, called
“enhanced oil recovery”, will be described separately for Norway and the UK in Section 7.8.2.
Natural gas fields
Global estimates of the CO2 storage potential in depleted natural gas fields are being dra-
matically revised downwards since the publication of a study conducted by the IEA Green-
house Gas R&D Programme (IEA GHG 2009a). Formula 7.5, described in Section 7.4.2, is
used to calculate the effective capacity in the top-down approach, by applying an efficiency
factor of 75 per cent. With regard to this factor, (Pershad and Slater 2007) differentiate be-
tween whether water enters a gas field (“water drive”) or whether conditions prevail under
which it is emptied rapidly (“depletion drive”). If water enters the field, the efficiency factor for
the calculation is reduced to 65 per cent. If, on the other hand, “depletion drive” prevails, a 90
per cent replacement of the recovered natural gas is assumed. In uncertain cases, 65 per
cent is also applied.
Tab. 7-5 CO2 storage capacities in Europe (known estimates)
Formations JOULE II GESTCO ECOFYS GeoCapacity IEA GHG
Year 1996 2004 2004 2009 2009
Saline aquifers 30–773 71–116 10 100–350a -
Oil fields 6 6.8 15.9 -
Natural gas fields 27 30.2 58.8 25–30
37–62b
Coal fields - 0.6–1.2 12.1 1–1.5 -
Total 63–806 109–154 96.8 126–381.5
All quantities given in gigatonnes of CO2, unless otherwise stated.
ECOFYS’s “best estimate”; JOULE II ranges between conservative assumptions and theoretical capacity;
GeoCapacity ranges between conservative and effective estimate
– = not specified
a = including the North Sea
b = effective capacity = 62 gigatonnes of CO2, practical capacity = 37 gigatonnes of CO2, matched capacity =
11 gigatonnes of CO2
Source: Authors’ design
(IEA GHG 2009a) also calculates a practical capacity, based on the minimum size of a field.
According to this study, an onshore field must be able to hold at least 50 million tonnes of
Analysis of the options for storing CO2
Wuppertal Institute for Climate, Environment and Energy 165
CO2, while 100 million tonnes is required as the minimum size offshore. This requirement
reduces the potential by around 40 per cent. In addition, 1 per cent of the fields is excluded
to take into account potential cases of leakage.
On a European scale, a theoretical CO2 storage capacity in natural gas fields of 83 billion
tonnes is yielded. The effective capacity is 62 billion tonnes, and the practical capacity aver-
ages 37 billion tonnes of CO2 (IEA GHG 2009a). If the sources are now matched with sinks
(practical capacity), only 11 billion tonnes can be used in depleted natural gas fields in west-
ern Europe to store CO2 up to 2050. Furthermore, the majority of these gas fields are located
in the North Sea.
In comparison, ECOFYS (Hendriks et al. 2004) gives a “best estimate” of 59 billion tonnes of
CO2, which corresponds to the effective capacity. Higher estimates are given by Scottish
researchers (Haszeldine 2009b), who suggest 150 billion tonnes of CO2 for hydrocarbon
fields alone in the region of the United Kingdom (see Section 7.6.3). JOULE II, GESTCO and
the GeoCapacity report, on the other hand, provide lower values of between 25 and 30 billion
tonnes of CO2 for natural gas fields.
Coal fields
Very little research has been carried out into the injection of CO2 into coal fields. The poten-
tial quantity of CO2 that could be stored in these structures appears to be very limited (esti-
mates range from 0 to 12 billion tonnes of CO2 for Europe). Due to the uncertainties and the
estimated low potential, there is no further consideration of these storage sites in this study.

RECCS plus – Update and Expansion of the RECCS Study
166 Final Report
Tab. 7-6 European estimates of CO2 storage capacities and emissions from point sources in all European countries
Source: Authors’ design, using the European studies JOULE II from (van der Straaten et al. 1996); GESTCO from (Christensen et al. 2004); GeoCapacity from (Vangkilde-Pedersen et al. 2009a).

Analysis of the options for storing CO2
Wuppertal Institute for Climate, Environment and Energy 167
7.6.2 Important neighbouring countries for Germany regarding CO2 storage
If German storage sites are insufficient for storing the country’s captured CO2, a European
solution with regard to transport and storage could help. Germany’s direct neighbours – Po-
land and the Czech Republic to the east, the Netherlands and France to the west and
Denmark to the north – could then accept potential CO2 emissions and store them under-
ground. Due to their geological activity, the Alpine states south of Germany are unsuitable.
The neighbours to the north who have storage potential in the North Sea – Norway and the
UK – will be considered in detail in Section 7.6.3. Whether or not the cross-border transporta-
tion of CO2 will take place depends mainly on the storage capacity and emissions caused in
the respective country. For this to happen, clear political resolve and strong financial incen-
tives would be required (Haszeldine 2009a).
The other European states are too far away from German power plants. From today’s per-
spective, therefore, they can be excluded from being possible candidates for a CO2 transfer.
Average distances ranging from 200 to 500 km are usually assumed; beyond this distance,
transport costs increase considerably (UBA 2006). If the price of CO2, emissions trading or
other variables (such as the use of CO2 to enhance oil recovery) were to change, however,
the currently prohibitive factor of distance could also change.
The Netherlands
The older studies in JOULE II (1996) and GESTCO (2004) assume high CO2 storage capaci-
ties in saline aquifers in the Netherlands of 1 to 5 billion tonnes of CO2. According to the lat-
est findings, estimates are lower, ranging from 340 million tonnes (GeoCapacity) to 750 mil-
lion tonnes of CO2 (Faaij et al. 2009) (Tab. 7-7). Similar efficiency factors of 2 to 6 per cent
are applied. If stated, the density of CO2 is assumed to be 700 kg/m3. The structures identi-
fied are very small; none are able to store more than 50 million tonnes of CO2. For this rea-
son, (Faaij et al. 2009) set a minimum size of 5 million tonnes for trap structures. If, on the
other hand, 50 million tonnes of CO2 is defined as the minimum storage size, all aquifers
would be excluded.
Tab. 7-7 Comparison of CO2 storage capacities in the Netherlands
Formation JOULE II GESTCO GeoCapacity v.d. Broek et al. Faaij et al.
Year 1996 2004 2009 2009 2009
Aquifers 1–5 1.6 0.34 0.4 0.75 b
Efficiency factor (%) 4 2–6 2–6 - 2
Density of CO2 (kg/m3) 700 700 700 - -
Oil fields 0.03 0.04
Gas fields 9.28 a
10.96
a 1.7 2.7
2.75
Total 10.31–14.31 a 12.56
a 2.04 3.1 3.54
All quantities given in gigatonnes of CO2, unless otherwise stated.
– = not specified a = including Groningen gas field, with 7.4 gigatonnes of CO2.
b = structures > 5 million tonnes of CO2; with a minimum size of > 50 million tonnes, no storage capacity in aqui-
fers
Source: Authors’ design

RECCS plus – Update and Expansion of the RECCS Study
168 Final Report
As a large producer of natural gas, the Netherlands has the largest storage capacities in de-
pleted natural gas fields. Depending on the estimate, they range from 1.7 to over 10 billion
tonnes of CO2. In the estimates, the efficiency of the replacement of recovered gas by CO2 is
assumed to be 100 per cent. Since many of these fields are still in operation, however, the
capacity should be given from a certain point in time. The greatest potential is offered by
Groningen gas field, which has storage space for over 7 billion tonnes of CO2. The latest
evidence suggests that this field will only be depleted sometime between 2040 and 2050,
and cannot be used for the injection of CO2 beforehand (Faaij et al. 2009).
The potential for CO2 injection in oil fields is very low. The largest oil field would not be able
to store more than 34 million tonnes of CO2, and all other oil fields are excluded as potential
storage sites (JOULE II).
The three estimates for the total CO2 storage in the Netherlands from 2009 (GeoCapacity,
van den Broek et al. 2009, Faaij et al. 2009) range from between 2 and 3.5 billion tonnes of
CO2, which is considerably lower than earlier estimates (JOULE II at 14.31 billion tonnes of
CO2 and GESTCO at 12.56 billion tonnes of CO2) which, however, include Groningen gas
field (7.35 billion tonnes), amongst others (Tab. 7-7).
Summarising, a capacity of around 3 billion tonnes of CO2 is used as a conservative estimate
that meets the criteria set in this report.
The time dependence of the storage potential in natural gas fields is important for the Nether-
lands, because only a small amount of space would be available in the short term (around 1
to 2 billion tonnes of CO2 storage potential in 2020 (Faaij et al. 2009, Schreurs 2008)). Ac-
cording to (Schreurs 2008), this potential will increase by 2025 to around 2.2 billion tonnes of
CO2, because only a few gas fields will be completely depleted by then.
For domestic emissions from large point sources, amounting to 92 million tonnes of CO2/a
(GeoCapacity), however, this capacity would suffice at first sight (see Tab. 7-6).
There could, however, also be a conflict in the Netherlands over the storage of natural gas. If
the country’s role as the hub for European gas supply is to be further extended, potential for
the underground storage of natural gas could be reduced, because this appears to be more
commercially attractive than the storage of CO2 (Faaij et al. 2009). It is also debatable
whether the aquifers are at all suitable for storage. If storage sizes of 100 million tonnes are
required to place emissions from a large power plant into one single storage site for its entire
service life, the storage potential in the Netherlands would be zero. On the other hand, stor-
age sites with smaller capacity could be used if they were in the immediate vicinity of small
power plants or industrial plants.
Due to the long wait for several inland storage structures and the possible competition with
natural gas storage, the large storage potential in the UK waters of the southern North Sea
and in the Norwegian Utsira formation are being considered for the potential construction of
CCS infrastructure (van den Broek et al. 2009). To achieve this, a large pipeline project
would have to be initiated (see Section 7.6.3).
For the largest point sources in Germany, located in North Rhine-Westphalia, transporting
CO2 to the Netherlands and further on towards the North Sea would therefore be a potential
way of reducing CO2. However, Germany would have to assess whether this disposal route

Analysis of the options for storing CO2
Wuppertal Institute for Climate, Environment and Energy 169
would be economically prudent, because the Netherlands would also charge transmission
fees, which would have to be offset against the costs for its own infrastructure (van den
Broek et al. 2009).
France
A third of France is underlaid with deep sediments, which are subdivided into various basins,
the largest being the Paris Basin to the north of the country. Triassic and Jurassic deposits
have filled these basins. There are other large sedimentary covers in the Aquitaine Basin in
the south-west, in the Rhone Basin and in the Alsace Basin.
JOULE II calculated that the saline aquifers would be able to store 1.5 billion tonnes of CO2.
GESTCO generated a CO2 storage capacity of 670 million tonnes in trap structures of saline
aquifers (without considering the proportion of traps, the unrealistically high figure of 26 bil-
lion tonnes of CO2 was computed). GeoCapacity was less optimistic, obtaining a capacity in
suitable aquifers of around 8 billion tonnes of CO2, without the limitation to traps. With a 3 per
cent proportion of traps, this value would decrease to 0.24 billion tonnes of CO2.
All French gas and oil fields are onshore: gas is mainly located in the Aquitiane region, and
oil in the Paris Basin. According to JOULE II estimates, the storage capacity in these hydro-
carbon reservoirs is under 1 billion tonnes of CO2 (50 million tonnes in oil fields and 880 mil-
lion tonnes in gas fields). GESTCO, however, does not envisage any scope for storage in
hydrocarbon fields. According to GeoCapacity, on the other hand, 770 million tonnes of CO2
could be stored in depleted oil and gas fields, which roughly corresponds with the JOULE II
value.
In total, the storage capacity for France is given as 0.6 to 26 billion tonnes of CO2
(GESTCO). It is more realistic to assume, however, that the potential will not exceed 1 billion
tonnes of CO2 (GeoCapacity).
The figure stated in GeoCapacity of 1 billion tonnes of CO2 is therefore selected as the con-
servative estimate.
Since France is committed to nuclear power, only low CO2 emissions from large point sour-
ces are observed. In 2008, they amounted to 130 million tonnes of CO2/a (see Tab. 7-6). The
storage space generated for France, however, does not offer any long-term prospect for
CCS in France. With a capacity of 1 billion tonnes, emissions of 130 million tonnes of CO2
per annum could only be stored for 7 years. Increased emissions as a result of the additional
consumption for CO2 capture would be added to this amount, creating an even shorter time
span. Thus there is no space in French underground formations for German emissions.
Poland and the Czech Republic
If there was suitable storage potential in Poland and the Czech Republic, emissions in the
German province of Lusatia, especially from lignite-fired power plants, could be transported
over shorter distances to the east than to the storage sites of Schleswig-Holstein or the North
Sea. In the GeoCapacity report, these countries were investigated for the first time with re-
gard to their capacities for storing CO2.
For Poland, a potential of 1.76 billion tonnes of CO2 in aquifers and 0.76 billion tonnes of CO2
in hydrocarbon fields was generated. In addition, there is estimated to be 415 million tonnes
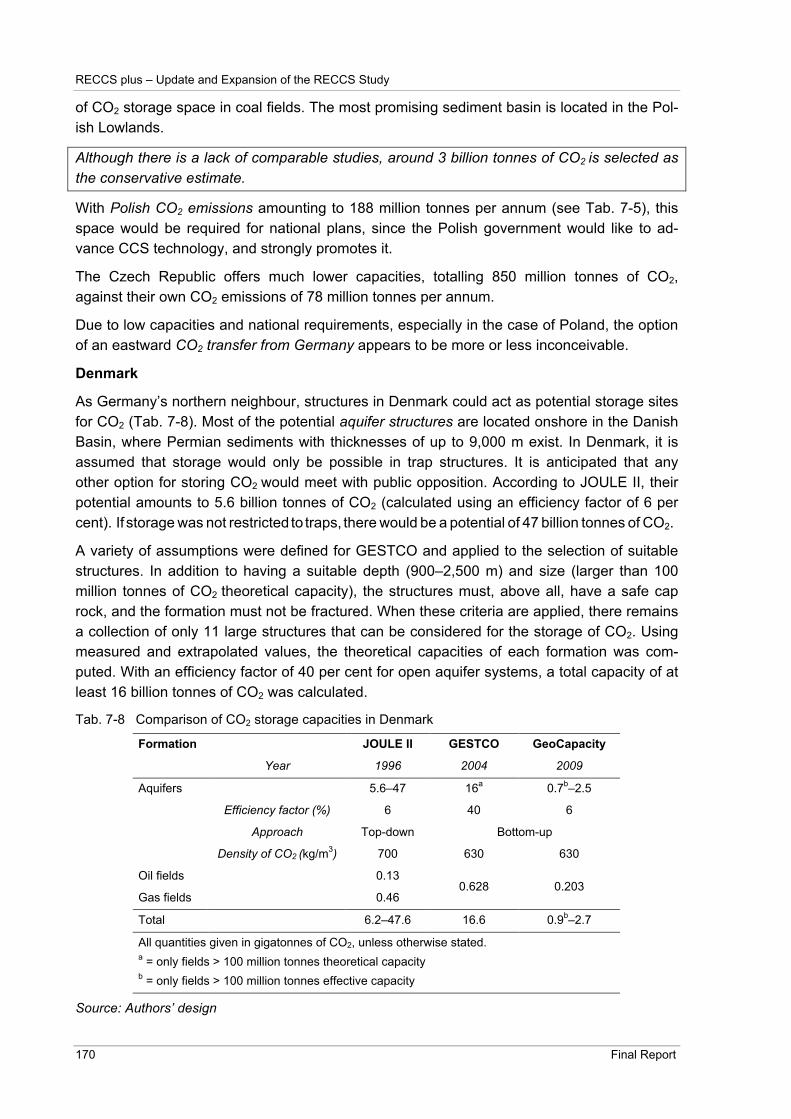
RECCS plus – Update and Expansion of the RECCS Study
170 Final Report
of CO2 storage space in coal fields. The most promising sediment basin is located in the Pol-
ish Lowlands.
Although there is a lack of comparable studies, around 3 billion tonnes of CO2 is selected as
the conservative estimate.
With Polish CO2 emissions amounting to 188 million tonnes per annum (see Tab. 7-5), this
space would be required for national plans, since the Polish government would like to ad-
vance CCS technology, and strongly promotes it.
The Czech Republic offers much lower capacities, totalling 850 million tonnes of CO2,
against their own CO2 emissions of 78 million tonnes per annum.
Due to low capacities and national requirements, especially in the case of Poland, the option
of an eastward CO2 transfer from Germany appears to be more or less inconceivable.
Denmark
As Germany’s northern neighbour, structures in Denmark could act as potential storage sites
for CO2 (Tab. 7-8). Most of the potential aquifer structures are located onshore in the Danish
Basin, where Permian sediments with thicknesses of up to 9,000 m exist. In Denmark, it is
assumed that storage would only be possible in trap structures. It is anticipated that any
other option for storing CO2 would meet with public opposition. According to JOULE II, their
potential amounts to 5.6 billion tonnes of CO2 (calculated using an efficiency factor of 6 per
cent). If storage was not restricted to traps, there would be a potential of 47 billion tonnes of CO2.
A variety of assumptions were defined for GESTCO and applied to the selection of suitable
structures. In addition to having a suitable depth (900–2,500 m) and size (larger than 100
million tonnes of CO2 theoretical capacity), the structures must, above all, have a safe cap
rock, and the formation must not be fractured. When these criteria are applied, there remains
a collection of only 11 large structures that can be considered for the storage of CO2. Using
measured and extrapolated values, the theoretical capacities of each formation was com-
puted. With an efficiency factor of 40 per cent for open aquifer systems, a total capacity of at
least 16 billion tonnes of CO2 was calculated.
Tab. 7-8 Comparison of CO2 storage capacities in Denmark
Formation JOULE II GESTCO GeoCapacity
Year 1996 2004 2009
Aquifers 5.6–47 16a 0.7
b–2.5
Efficiency factor (%) 6 40 6
Approach Top-down Bottom-up
Density of CO2 (kg/m3) 700 630 630
Oil fields 0.13
Gas fields 0.46 0.628 0.203
Total 6.2–47.6 16.6 0.9b–2.7
All quantities given in gigatonnes of CO2, unless otherwise stated. a = only fields > 100 million tonnes theoretical capacity
b = only fields > 100 million tonnes effective capacity
Source: Authors’ design

Analysis of the options for storing CO2
Wuppertal Institute for Climate, Environment and Energy 171
Based on this capacity (16.7 billion tonnes of CO2), a conservative estimate is given in the
GeoCapacity Final Report on the basis of efficiency factors for closed systems (0.1 to 12.2
per cent are calculated). Based on an efficiency factor of 6 per cent, 2.5 billion tonnes of CO2
is presented as a realistic figure.
Within this effective potential, only four structures are large enough to store more than 100
million tonnes of CO2, reducing the capacity to 2.3 billion tonnes. The Thisted formation
alone comprises over 72 per cent of this capacity. This could lead to difficulties because
GESTCO has shown a very low degree of permeability for this structure (< 2 mD), which
would make injections hard, or even impossible. For this reason, the Thisted structure is ex-
cluded from the conservative estimate, resulting in an effective potential for CO2 storage in
saline aquifers in Denmark of 700 million tonnes.
The oil and gas fields of the Danish North Sea offer virtually no significant capacities: esti-
mates vary between 203 million tonnes (GeoCapacity), 590 million tonnes (JOULE II) and
628 million tonnes of CO2 (GESTCO). The complete replacement of the hydrocarbons by
CO2 was assumed in each case. The GeoCapacity value was taken to be the conservative
estimate.
In summary, a capacity of around 1 billion tonnes of CO2 is used as the conservative esti-
mate.
A comparison with the annual emissions in Denmark from point sources (28 million tonnes of
CO2 in 2007, see Tab. 7-5) shows that emissions could be stored there for the next 32 years.
The Danish potential appears to be too low, however, for use as a possible storage site for
emissions from German point sources. In addition, the formations are a long way from Ger-
man industrial locations, at over 800 km from the Ruhr. The oil and gas fields are located in
the far west of the North Sea and in the (potentially unsuitable) Thisted structure in the north
of Denmark. The aquifer closest to the border of Germany has already been reserved for the
storage of natural gas (Toender).
7.6.3 The British and Norwegian North Sea
Infrastructure considerations
If CCS gains broad support in northern Europe, an integrated network to transport CO2 could
emerge. Amongst others, (van den Broek et al. 2009) consider whether emissions from the
Netherlands, Belgium and Germany could be transported over 750 km from the Dutch coast
to the Norwegian Utsira formation. The precondition for such transportation would be a Euro-
pean pipeline system, which would have to be financed by participating countries ((van den
Broek et al. 2009) reckon with ! 3.5 to ! 10 per tonne of CO2, depending on the scenario
development). Norway is in favour of a state authority operating and monitoring any neces-
sary CO2 pipelines. The approach involving joint infrastructure assumes there is sufficient
storage capacity in the Utsira formation, as discussed in detail below.

RECCS plus – Update and Expansion of the RECCS Study
172 Final Report
Fig. 7-11 Potential CO2 pipeline system in north-west Europe, including large point sources, oil and gas fields, and saline aquifers.
Source: Haszeldine 2009a
Fig. 7-11 presents a proposal for a CO2 pipeline system in Europe (Haszeldine 2009a). Ac-
cording to this proposal, an EU CCS continental pipeline could be established that would
transport CO2 emissions towards the North Sea via two routes. One possibility would be to
transport emissions from eastern German and Polish large point sources via the natural gas
fields of Lower Saxony. Another option envisages emissions from the Saar and Ruhr being
transported via the Netherlands to British and Dutch fields. The two lines would meet in
Dutch waters and then head together towards Norway (to Utsira and elsewhere). Great Brit-
ain would also be connected to this system. According to (Haszeldine 2009a), Utsira could
be established as a large pan-European storage site for future decades and could take in
emissions from north-west Europe and maybe elsewhere.
Plans for the infrastructure assume there is sufficient storage space in the North Sea. Sev-
eral authors assume in their studies that there is sufficient potential in Norway and the United
Kingdom. Estimates of the storage space for CO2 vary considerably, depending on the re-

Analysis of the options for storing CO2
Wuppertal Institute for Climate, Environment and Energy 173
spective assumptions, and those for these two North Sea states are discussed in detail be-
low. It could be easier, safer and possibly even cheaper to store CO2 offshore rather than
onshore (Schrag 2009) because these areas are uninhabited, and it would be very easy to
classify and investigate the structures.
United Kingdom of Great Britain and Northern Ireland
Deep saline aquifers
The storage capacity in deep saline aquifers is estimated using two approaches: a “top-
down” and a “bottom-up” approach. Only the geological formations beneath the British North
Sea are considered because there are virtually no storage conditions on land.
1. Top-down approach:
The most feasible geological option for storing CO2 in the North Sea is in saline aquifers. The
ACCSEPT Final Report (Anderson et al. 2007) explains the differences in the estimates
undertaken in the JOULE II Report, amongst others (van der Straaten et al. 1996). If the
absolute pore volume of all potential reservoirs is available for storage, a theoretical capacity
in aquifers in the British North Sea of 240 billion tonnes of CO2 is yielded. In the report, this
unsatisfactory approach is compared with a trap-based method in which only structural traps
in the aquifers can be used to store CO2. Then only part of the pore space is available,
leading to an effective capacity of 8.6 billion tonnes (3.6 per cent of the theoretical capacity).
GESTCO calculates the storage capacity in the largest aquifers of the UK to be 89.4 billion
tonnes of CO2 (with an efficiency factor E = 40 per cent). Restricting this amount to trap
structures would reduce this CO2 storage potential in the Rotliegend of the southern North
Sea to 14.3 billion tonnes of CO2. This figure is also confirmed in a study by (Bentham 2006).
The GeoCapacity report assumes comparative values – 14.9 billion tonnes of CO2 in all for-
mations (including the Irish Sea). In a rough estimate, the Irish Sea is initially excluded, leav-
ing only the southern North Sea with a value of 14.2 billion tonnes of CO2. This capacity is
reduced by a blanket rate of 50 per cent to exclude any uncertainties (for instance, storage
sites with unsuitable cap rock). A CO2 storage potential of 7.1 billion tonnes is then yielded
for aquifers in the United Kingdom (see Tab. 7-9).
Another estimate of the storage capacity of the British Rotliegend is generated in a model by
(Chadwick et al. 2009). The pore volume in closed structures is given as 110 billion m3,
which creates a capacity of approximately 70 billion tonnes of CO2.
2. Bottom-up approach:
The sinks for CO2 in suitable saline aquifers of the North Sea are estimated by the Scottish
Centre for Carbon Storage as being between 4.6 and 46 billion tonnes of CO2 (with efficiency
factors of 0.2 and 2 per cent, respectively) (SCCS 2009b). This estimate of the storage ca-
pacity is based on ten suitable formations considered to be representative for the Scottish
part of the North Sea.
According to BERR (Pershad and Slater 2007), 292 potential sinks in the whole of the North
Sea offer space for 35.5 billion tonnes of CO2. The saline aquifers in UK waters make up the
largest part, with 14.5 billion tonnes of CO2. Only 67 structures remain if those larger than
100 million tonnes alone are considered.

RECCS plus – Update and Expansion of the RECCS Study
174 Final Report
The theoretical capacity of 89.4 billion tonnes estimated by GESTCO (see above) would then
decrease to 86.4 billion tonnes of CO2, yielding an effective storage capacity of 13.8 billion
(rather than 14.3 billion) tonnes of CO2.
The British Geological Survey (BGS) regards the existing capacity estimate for saline aqui-
fers in the UK as not having been adequately addressed yet (Holloway 2009). “Several billion
tonnes of CO2” are given as quantitative data. Although the existing studies take the pore
volume and the saturation of CO2 in closed formations into account, they neglect the poten-
tially limiting factor of regional pressure propagation. This is particularly relevant when up-
scaling in the bottom-up approach, because a total capacity is drawn there from a certain
fixed number of smaller structures. Above all, the pore pressure is expected to play a deci-
sive role if the anticipated large quantities of CO2 are injected into the structures. It is re-
ported that injection into an aquifer would also influence the pressure regime in neighbouring
storage sites, which could reduce the potential there, leading to an overestimate of total stor-
age capacities.
(Haszeldine 2009b) mentions that the storage capacity would be reduced by the inefficient
migration of the CO2 in the reservoir. It is considered pertinent to restrict the process to trap
structures because the greenhouse gas in open formations could spread for tens of kilo-
metres in the course of a 30-year injection period, which would increase monitoring costs
considerably.
Because of this uncertainty, (Holloway 2009) is opposed to using theoretical storage capaci-
ties that are unable to withstand scrutiny. Instead, only adequately tested reservoirs with
suitable geological characteristics should be included in the total capacity. Even conservative
estimates show, however, that sufficient CO2 storage capacity exists to operate CCS
(Anderson et al. 2007).
Tab. 7-9 compares the most important findings of the top-down and bottom-up approaches.
Natural gas and oil fields
The calculations for CO2 storage capacities in hydrocarbon fields do not deviate as signifi-
cantly as those for saline aquifers. This is because they are based on more reliable data. The
storage possibilities for CO2 in oil or gas fields onshore are excluded because they are too
small (Pershad and Slater 2007, Holloway 2009).
In the JOULE II Report, the offshore potential in gas fields was assumed to be 4.9 billion ton-
nes of CO2. The Triassic Sherwood Sandstone 1, in particular, offers enormous potential.
(Holloway 2009) reports 1.2 to 3.5 billion tonnes of CO2 as the CO2 storage capacity in the
natural gas fields on the British continental shelf. The estimates by (Bentham 2006) and
(Christensen and Holloway 2004) – 2.8 and 3.1 billion tonnes of CO2 – are in a similar re-
gion.
According to JOULE II, oil fields contribute 2.6 billion tonnes of CO2 (van der Straaten et al.
1996). (Holloway 2009), on the other hand, goes as far as to state that up to 6.1 billion ton-
nes of CO2 could be stored in them. If CO2 EOR projects were realised prior to storage, how-
ever, almost 60 of these oil fields would no longer be available (Pershad and Slater 2007).
Nevertheless, after the completion of tertiary recovery, these could also be used to store
CO2.

Analysis of the options for storing CO2
Wuppertal Institute for Climate, Environment and Energy 175
Tab. 7-9 Comparison of CO2 storage capacities in the United Kingdom of Great Britain and Northern Ireland (UK)
Formation JOULE II GESTCO Bentham BERR GeoCapacity Holloway SCCS
Year 1996 2004 2006 2007 2009 2009 2009
Aquifersb 8.6–240 14.7
a 14.3 14.5 7.1 ? 4.6–46
Efficiency factor (%) 6 40 - - 40 - 0.2–2
Approach Top-down Top-down Bottom-up Bottom-up Top-down Bottom-up Bottom-up
Density of CO2 (kg/m3) 700 634 - - - - -
Oil fields 2.6 - 4.2 1.2–3.5 1.2–3.5
Gas fields 4.9 10.5
2.8 6 6.1 6.1 > 1
Sweep efficiency (%) 100 - - - 65–90 65–90 -
Totalc 16.1 25.2 17.1 24.7 14.4–16.7 > 7.3 > 5.6
All quantities given in gigatonnes of CO2, unless otherwise stated.
BERR = (Pershad und Slater 2007)
– = not specified
a = a restriction to structures > 100 million tonnes theoretical capacity reduces this to 13.8 gigatonnes of CO2
b = (Chadwick et al. 2009): 70 gigatonnes of CO2 in saline aquifers
c = (Haszeldine 2009b): altogether 150 gigatonnes of CO2
Source: Authors’ design

RECCS plus – Update and Expansion of the RECCS Study
176 Final Report
In total, the potential in hydrocarbon fields corresponds to 7.3 billion tonnes of CO2 (GeoCa-
pacity) or 7.5 billion tonnes (JOULE II). The result given in GeoCapacity is based on the as-
sumption that CO2 can only be stored in fields larger than 50 million tonnes. The capacity is
then reduced from 9.6 billion tonnes to 7.3 billion tonnes of CO2.
This restriction is also applied by (SCCS 2009b). Based on this, only 29 of 200 hydrocarbon
fields in the Scottish North Sea are suitable for CO2 injection. The six most promising forma-
tions provide a capacity of 300 to 1,000 million tonnes each. However, production for some
fields is predicted only to end sometime between 2020 and 2030. Short-term availability
must, therefore, also be taken into account. The oil fields are more likely to be used for CO2
EOR rather than for the “simple” storage of CO2. Brent oil field, however, offers a high ca-
pacity of 450 million tonnes of CO2 and could, therefore, also be designated as a storage site
(SCCS 2009b).
Total capacity
Overall, GESTCO yields a theoretical CO2 storage capacity for the southern North Sea of
17.4 billion tonnes of CO2. Encompassing the other North Sea areas, a total capacity of
around 25 billion tonnes of CO2 is generated, approximately the same amount estimated by
BERR. JOULE II and (Bentham 2006) are more cautious, stating total capacities of around
16 and 17 billion tonnes of CO2. The conservative approach of GeoCapacity results in just
14.4 billion tonnes of CO2, whereby the largest share can be found in the southern North
Sea. No differences between the top-down and bottom-up approach are discernible because
a similar range is covered by both methods.61
As a conservative estimate, the GeoCapacity approach with a storage capacity of around 15
billion tonnes of CO2 in the British North Sea is used.
Comparison with emissions and conclusion
The emissions from large point sources in the United Kingdom are currently around 260 mil-
lion tonnes of CO2 per annum (see Tab. 7-6). The conservative estimated capacity of 15 bil-
lion tonnes of CO2 would suffice to store these emissions for 60 years. In the event of a 40-
year service life, only 10.4 billion tonnes would be required – the remaining space could be
used for emissions from other European countries. Should this occur, (Haszeldine 2009a)
advocates making existing capacities available to other EU countries for a fee. He proposes
a price of £ 10 sterling per tonne of CO2 (currently around ! 13/t CO2).
Norway
The Norwegian mainland is an ancient crystalline continent that offers no possibilities at all
for storing CO2. However, it is a completely different matter when it comes to the offshore
area, where several basins are located in the North Sea: the Viking Graben, the Central Gra-
ben and the Norwegian-Danish Basin.
Aquifers
61 (Haszeldine 2009b) assumes completely different storage possibilities without, however, presenting the
basis of calculation in further detail: it is reported that there is enough space available in the North Sea to store 100 years’ worth of emissions of north-west Europe’s emissions. 150 gigatonnes of CO2 could be stored below British waters in saline aquifers and depleted oil and gas fields.

Analysis of the options for storing CO2
Wuppertal Institute for Climate, Environment and Energy 177
1. Top-down approach:
Several research projects have estimated the CO2 storage capacity in the saline aquifers of
the Norwegian North Sea (Tab. 7-10). JOULE II computes a potential of 476 billion tonnes, if
storage is not restricted to traps. Alternatively, if only closed structures are permitted for stor-
age, a capacity of 10.8 billion tonnes of CO2 is yielded.
GESTCO (2004) makes a more moderate estimate for the total Norwegian pore space in
aquifers to 280 billion tonnes of CO2 (E = 6 per cent for open and 2 per cent for closed aqui-
fers). This figure corresponds with a storage potential in traps of approximately 12.9 billion
tonnes of CO2, if an efficiency factor of 4 per cent and a 3 per cent proportion of traps is as-
sumed for all structures. The same method was also applied in the JOULE II Report. The
differences between the reports are accounted for by the variation in other parameters.
2. Bottom-up approach:
In the GESTCO Report, however, individual formations are also analysed. It remains unclear
why structures (totalling 760 million tonnes of CO2) classified as potentially unsuitable are
also included in the calculation. In addition, there is no minimum field size stipulation, as was
the case for the UK (Pershad and Slater 2007) and Denmark (GESTCO). If Norwegian struc-
tures must also be able to accept a minimum quantity of 100 million tonnes of CO2 effective
capacity, an additional 540 million tonnes of CO2 storage capacity would have to be ex-
cluded. The aquifer potential is then reduced to 11.6 billion tonnes of CO2. It should also be
mentioned that there is only sparse geological knowledge for over half of the structures. This
is the case in most estimates, however, and could only be remedied by undertaking field
studies.
The GeoCapacity study (Vangkilde-Pedersen et al. 2009) refers to the GESTCO data, with-
out providing a new calculation. The figure there, however, is given as 26 billion tonnes of
CO2.
Tab. 7-10 Comparison of CO2 storage capacities in Norway
Formation JOULE II GESTCOa GeoCapacity
Year 1996 2004 2009
Aquifers 10.8–476 12.9b–280 26.0
Efficiency factor (%) 4 4 -
Approach Top-down Top-down/Bottom-up Bottom-up
Density of CO2 (kg/m3) 623–769 769 -
Oil fields 3.1 3.4
Gas fields 7.2 9.2 3.2
Total 21–486 25–289 29.2
All quantities given in gigatonnes of CO2, unless otherwise stated.
– = not specified a = BERR (Pershad and Slater 2007) adopts these results
b = a restriction to structures > 100 million tonnes reduces the capacity to 11.6 gigatonnes
Source: Authors’ design

RECCS plus – Update and Expansion of the RECCS Study
178 Final Report
The deviations in the estimates for the Utsira formation will now be presented as an example
of a formation that could be the destination of a pan-European CO2 pipeline infrastructure for
many years.
An in-depth analysis of the Utsira formation
Utsira is a much-discussed geological formation in the Norwegian North Sea (see Fig. 7-11,
top centre). It has excellent permeability and porosity values, enabling CO2 to be stored
there.
Since 1996, around 1 billion tonnes of CO2 have been separated annually offshore during
gas recovery at the Sleipner West gas field and buried underground between two natural gas
fields in the Utsira formation. This has been necessary because the recovered natural gas
has a CO2 content of 4 to 9.5 per cent. For this reason, it must be cleaned prior to sale
(Moniz 2008). The main reason behind this CO2 injection is to avoid having to pay the Nor-
wegian CO2 tax for creating emissions. This would comprise almost 3 per cent of the total
emissions of Norway if it were not injected underground. Injection takes place in a 150 to 200
m thick sandstone reservoir at a depth of 800 to 1,000 m. So far, small quantities have been
stored there without any problems.
According to (Riis 2007), the entire emissions created by Europe over the next 500 years
could be deposited in the Utsira formation. For this to happen, the formation would have to
have the capacity to contain 600 billion tonnes of CO2 (Christensen 2007). (ZEP 2006) re-
ports that 2 billion tonnes of CO2 have to be injected into Utsira annually. With this high po-
tential, there would be sufficient potential for 200 to 300 years of emissions storage.
However, this figure reflects only the theoretical capacity that could be realised by the com-
plete exchange of the formation water in the pore space by CO2. Safe storage can only be
achieved by injecting into trap structures, and taking into account the increased pressure in
the formation, using an efficiency factor (van der Meer and Yavuz 2009).
JOULE II (1996) has estimated the effective storage capacity of the Utsira formation to be
only 50 billion tonnes of CO2, provided that the whole aquifer is made available. This calcula-
tion was carried out according to Equation 7.1 (Section 7.4.1) with a pore volume of 1,092
km3, a CO2 density of 769 kg/m3 and an efficiency factor of 6 per cent. If only closed struc-
tures were used for storage, which make up 3 per cent of the volume, capacity would be re-
duced to 1 billion tonnes of CO2, applying an efficiency factor of 4 per cent.
In the GESTCO project (2004), the estimated pore volume was 10 per cent lower (919 km3),
although all other assumptions were adopted. Hence the entire Utsira aquifer could hold
around 42 billion tonnes of CO2. If, on the other hand, storage was restricted to trap struc-
tures (3 per cent), as recommended in the report (E = 4 per cent), there would only be space
for 0.85 billion tonnes of CO2.
If smaller aquifers are considered (area smaller than 4,000 km2), then lower efficiency factors
of 0.2 to 2 per cent are produced, according to (SCCS 2009b), depending on whether they
were computed dynamically or statically. In the case of dynamic calculations, the heteroge-
neity of a reservoir is taken into account (E = 0.56 per cent) or a maximum increase in pres-
sure is defined (E = 0.2 per cent). Static analyses, on the other hand, yield higher values of
up to 2 per cent. Such low efficiency factors would reduce the aforementioned estimate even

Analysis of the options for storing CO2
Wuppertal Institute for Climate, Environment and Energy 179
further. This suggestion is supported by (Thibeau 2009), who gives 1.4 per cent as a conser-
vative efficiency factor for aquifers in the North Sea (based on Equation 7.4).
Tab. 7-11 CO2 storage capacities in Utsira
Unit JOULE II GESTCO Lindeberg Nooner
Year 1996 2004 2009 2007
Area km2 32,000 25,000 25,000 -
Thickness km 0.15 0.15 - -
Net-to-gross % 65 70 - -
Porosity % 35 35 - -
Pore volume km3 1,092 919 - 919
Denseness of CO2 kg/m3 769 769 - 530
Proportion of traps % 3 3 - 3
Efficiency factor % 4 4 7 4
Total capacity in traps
Million
tonnes of
CO2 1,008 848 40,000a 584
– = not specified a = condition: recovery of the same magnitude of formation water
Source: Authors’ design
In their reservoir models, (Lindeberg et al. 2009) assume an efficiency factor of 7 per cent,
producing a storage capacity of 40 billion tonnes of CO2 in the pore space. Here, however,
an increase in pressure is balanced out by the recovery of water from the formation. An injec-
tion of 150 million tonnes of CO2/a would have to be balanced out with a recovery of around
160 million tonnes of formation water (3 per cent salinity) annually to avoid endangering the
safety of the storage site. This water would have to be pumped straight into the North Sea. It
would have to be assessed whether injecting more than 40 billion tonnes of salt water over
the course of the years could cause ecological problems, if the whole capacity were used.
Since a much larger quantity of fresh water flows into the sea from rivers every year (296 to
354 km"), it is anticipated that the balance should not be disturbed. Problems could occur,
however, due to localised high concentrations of salt. (Lindeberg et al. 2009 and Schrag
2009) do not think that this injection would be problematic, because large quantities of salt
water (even impure salt water) are also pumped into oceans during oil recovery (see Section
7.5.3).
(Nooner et al. 2007) regard the density of CO2 as one of the greatest uncertainties in esti-
mating the mass of CO2 that can be injected underground. Due to the increased temperature
sensitivity in the Utsira formation, a density of 530 kg/m3 is considered suitable (instead of
the 769 kg/m3 previously assumed). There is a significant proportion of impurities in the in-
jected CO2 (1.7 per cent), which means that the density could decline even further. This as-
pect of the process was nevertheless not taken into consideration. The lower density of CO2
would reduce the effective capacity estimates in traps even further from 848 million tonnes
(GESTCO) to 584 million tonnes of CO2.

RECCS plus – Update and Expansion of the RECCS Study
180 Final Report
(Haugan 2009) believes that CCS technology is associated with great uncertainties. He
points out the danger of leakage during or after the injection of CO2, and believes that moni-
toring would be too lax. One example of such a lack of knowledge is the Tordis field to the
north of the Sleipner field. Impure water is pumped into or below the Utsira formation during
oil recovery. In May 2008, excessive water was injected under too high pressure, which led
to the formation of a 30 to 40 m long and approximately 7 m deep fissure or crack. Oily water
escaped from the formation into the North Sea. Investigations by Statoil and the Norwegian
Petroleum Directorate (NPD) revealed that the Tordis field contains only offshoots of the Ut-
sira formation and that this sediment cap was no longer existent, which was the cause of the
problem. According to the (NPD 2009), however, this incident should not be used to under-
mine the suitability of the Utsira formation as a CO2 storage site, as stated in (Bjureby et al.
2009). Nonetheless, the incident caused alarm because monitoring failed to register the es-
cape in good time.
The estimate in JOULE II of around 1 billion tonnes of CO2 storage capacity, taken from Tab.
7-11, is adopted as the conservative estimate for the Utsira formation.
Natural gas and oil fields
In GeoCapacity, the natural gas and oil fields are estimated as having a CO2 potential of 3.2
billion tonnes, although the calculation is based on the same data as in GESTCO, which cal-
culates 12.6 billion tonnes of CO2 (with a 100 per cent exchange of the hydrocarbons)
(Schuppers et al. 2003). Of this amount, slightly over 10 billion tonnes are in fields with a
capacity greater than 100 million tonnes of CO2. Norway is in a positive position economi-
cally in that many of these fields have not yet been depleted, and their availability has to be
consolidated with the available quantities of captured CO2 emissions. However, the maxi-
mum rate of production was already exceeded in 2001 (Schindler and Zittel 2008). The time
aspects of oil recovery are addressed in further detail in Section 7.8 in connection with en-
hanced oil recovery.
Total capacity
The calculation for the example of the Utsira formation shows that the unusually high figures
for the total storage potential for Norway of up to 486 billion tonnes (GESTCO) are most
probably overestimated and that much less space is in fact available for the storage of CO2.
A reduction in capacities in the Utsira formation (conservative estimate of 1 billion tonnes of
CO2) and other saline aquifers lowers the total potential to between 21 and 29 billion tonnes,
which is considered to be much more realistic.
The estimate of 21 billion tonnes of CO2 can therefore be called a conservative effective ca-
pacity.
Comparison with emissions and conclusion
Norway has only very low emissions of 28 million tonnes of CO2/a (compare Tab. 7-6). This
shows that even the conservative estimate is considerably higher than the sinks required. If
we take the figures from the GeoCapacity report (29 billion tonnes), which correspond to a
quarter of the total CO2 storage capacity in Europe, Norwegian emissions could be stored for
over 1,000 years.

Analysis of the options for storing CO2
Wuppertal Institute for Climate, Environment and Energy 181
This figure illustrates that a European pipeline system could potentially use Norwegian stor-
age sites, even if Utsira is, in all probability, unable to hold large quantities of CO2. In con-
trast, there is the “acceptable” calculation of capacity by the (IEA GHG 2009a), which esti-
mates a figure of less than 11 billion tonnes of CO2 available for the whole of the North Sea
up to 2050.
7.6.4 The rest of Europe
As mentioned in the introduction, only Germany’s immediate neighbours could realistically
have a part to play in the potential export of CO2. Nonetheless, the storage capacities of
other countries are outlined here briefly (Tab. 7-6).
Italy
Italy’s geology is very much determined by the formation of the Alps. It holds two large sedi-
mentary basins where CO2 could potentially be stored in saline aquifers. These are the
Mesozoic carbonates of Tuscany and the Miocene-Quaternary sediments in the Po Valley. A
capacity of 0.45 billion tonnes of CO2 (JOULE II) to 4.7 billion tonnes of CO2 (GeoCapacity)
appears possible.
The oil and natural gas fields are geographically dispersed and, according to JOULE II, make
up a capacity of 1.8 billion tonnes of CO2. This figure was endorsed by GeoCapacity.
In total, therefore, up to 6.5 billion tonnes of CO2 could be injected (GeoCapacity). Compared
with the low annual emissions from large point sources of 140 million tonnes of CO2, this
capacity could suffice for many years. The high seismic activity in Italy, however, should be
taken into account in all process steps of the CCS chain, possibly restricting the usable po-
tential and transport routes. For reasons of safety and distance, the transportation of German
CO2 via the Alps to suitable storage structures appears to be impracticable.
Spain
There is substantial storage potential in Spain, particularly in the Duero Basin in northern
Spain. (Hurtado et al. 2008) estimated a storage capacity in saline aquifers there of between
1.67 and 11.96 billion tonnes of CO2. Another important basin that could be used to store
CO2 is the Ebro Basin (Prado et al. 2008).
JOULE II adds to this list the Cuenca-Albacete Basin and the fringe of the Pyrenees. The first
suitable estimate at the European level, however, was only achieved in the GeoCapacity
report, which calculated a capacity for the storage of CO2 in saline aquifers of around 14 bil-
lion tonnes. Less significantly, the hydrocarbon fields offer only minor capacities in the lower
range.
With calculated capacities of 14 billion tonnes of CO2, Spain has one of the largest CO2 stor-
age capacities in Europe. A comparison with the emissions from large point sources (160
million tonnes of CO2/a) shows that the storage opportunities considerably outweigh the
sources, meaning that domestic emissions could be injected for decades. Spain could utilise
its high geological potential to import emissions from other countries for a fee. This undertak-
ing, however, is restricted by its geographical location, because the Iberian Peninsula is on
the edge of Europe and 1,500 km from Germany. For this reason, Spain is irrelevant as a
potential recipient of German CO2.
RECCS plus – Update and Expansion of the RECCS Study
182 Final Report
(South-)East Europe
The CO2 storage capacities for several eastern and south-eastern European countries were
estimated for the first time in the GeoCapacity report. These capacities are therefore subject
to considerable uncertainty as they have only recently started to be explored. Nonetheless, it
was revealed that CCS could be an option for reducing national emissions in several of the
investigated countries since, in theory, sufficient storage space appears to be available. This
is the case for Bulgaria (2.1 billion tonnes of CO2), Croatia (2.9 billion tonnes of CO2), Roma-
nia (9.0 billion tonnes of CO2) and Slovakia (1.7 billion tonnes of CO2), with emissions rang-
ing from 5 to 67 million tonnes of CO2/a.
Other countries with lower or no storage capacities
There are many countries in Europe with little or no storage capacities for CO2. These in-
clude small countries such as Luxembourg, which is unable to store CO2 due to the meta-
morphic bedrock in the north and the flat sediments in the south-west, and seismically highly
active zones in south-eastern Europe, such as Greece and Albania.
Greece has a very low storage potential since the geological bedrock was greatly over-
printed, folded and displaced by the Alpine orogenesis. Furthermore, the molasse formed
during these processes does not offer suitable aquifers either. Seismic activities generally
rule out many areas for safety reasons. Nonetheless, the potential has been estimated to be
as much as 2.2 billion tonnes, at least half of which is made up of the offshore Prinos struc-
ture (GESTCO). GeoCapacity contradicts this result, and estimates that the total storage
capacity would be only 250 million tonnes of CO2, which would be insufficient for realistically
considering the establishment of a CCS infrastructure. The same applies to Albania, for
which GeoCapacity computes a capacity of 130 million tonnes of CO2, and Bosnia and Her-
zegovina, with just below 200 million tonnes of CO2.
The storage capacity for CO2 in Belgium is extremely low, if not negligible. The London-
Brabant Massif dominates the greatest part of the country and its ocean space. These
metamorphic rocks have no porosity, and therefore do not meet any of the conditions for CO2
storage. On the north-eastern edge of the Massif are also sedimentary layers that could pos-
sibly be used to store CO2. Due to a lack of data, the storage capacity could not be estimated
in the JOULE II Report. In more recent studies, the capacity in saline aquifers has been es-
timated at 100 million tonnes (GESTCO) and 200 million tonnes of CO2 (GeoCapacity). The
storage option of using coal seams is disputed. GESTCO mentions a potential of 432 million
tonnes, whereas it is neglected in GeoCapacity.
The Republic of Ireland could store a total of only 160 million tonnes of CO2 in offshore gas
fields. This means that CCS is unlikely to play a major role there, contrary to its large neigh-
bour, the UK. Portugal has small sedimentary basins which, however, lack suitable cap
rocks. Small-scale CO2 injections could be possible there offshore, however. As it is the Lusi-
tanian country’s policy not to recover hydrocarbons, this option of storing CO2 can be elimi-
nated.
Other negligible CO2 storage capacities can be found in the Baltic States of Estonia, Latvia
and Lithuania (Shogenova et al. 2009), as well as Macedonia, Hungary and Slovenia.

Analysis of the options for storing CO2
Wuppertal Institute for Climate, Environment and Energy 183
7.6.5 Conclusions from the analysis for Europe
In order to estimate the CO2 storage potential in Europe, existing publications were assessed
and their central assumptions compiled. According to these estimates, capacities in Europe
are distributed very unevenly. Depending on the assumptions made in the studies, a total of
between 60 and 800 billion tonnes of CO2 storage potential is available. The potential in
neighbouring countries and the North Sea are especially relevant to Germany.
As we were unable to carry out our own cautious estimates for this study, as in the case of
Germany, instead we adopted the conservative estimates of the investigated studies. Some
of these estimates were supplemented by our own analyses. These estimates yielded an
effective storage capacity of 44 billion tonnes of CO2 for Germany’s “neighbouring states”:
the Netherlands, France, Denmark, the United Kingdom, Norway and Poland (see Tab.
7-12). The majority of this capacity is available in Norway, with 21 billion tonnes of CO2 (48
per cent), followed by the United Kingdom, with 15 billion tonnes of CO2 (34 per cent). The
other countries explored have only small potential at their disposal.
The Utsira formation, with 1 billion tonnes of CO2, is part of Norway’s storage capacity. This
conservative estimate assumes an effective capacity with an efficiency factor of 4 per cent
and storage only in closed structures.
If the conservative estimate for Germany from Section 7.5 is added to this figure, the total
capacity amounts to 49 billion tonnes of CO2. Compared with the cumulated emissions of the
analysed countries over 40 years (47.6 billion tonnes of CO2), a virtual balance is achieved.
The CO2 storage potential would therefore have to be virtually exhausted in order to elimi-
nate all CO2 emissions.
Tab. 7-12 Overview of conservative capacity estimates of CO2 storage in Germany’s neighbouring countries compared with emissions from large point sources
Unit Nether-
lands France
Den-
mark UK
c
Nor-
wayc
Po-land
Sum Ger-
many d
Total
Emissions a Mt/a 92 131 28 258 28 188 725 465 1,190
Emissions in
40 years Gt 3.7 5.2 1.1 10.3 1.1 7.5 28.9 18.6 47.6
Conservative
storage
capacity
Gt
3 1 1 15 21b 3 44 5
49
Remainder Gt -0.7 -4.2 -0.1 4.7 19.9 -4.5 15.1 -13.6 1.4
a = emissions from large point sources from power plants and industry (> 0.1 million tonnes of CO2/a)
b = including Utsira, with approximately 1 gigatonne of CO2
c = only offshore
d = the difference to the emissions given in Section 7.5.6 is explained by the fact that only sources with emis-
sions exceeding 1 million t/a were considered there.
Source: Authors’ design
RECCS plus – Update and Expansion of the RECCS Study
184 Final Report
This simplified comparison, however, disregards several difficulties:
• The increased demand for energy caused by the capture of CO2 and the CO2 capture
rate have not been included in the estimate. If these are set at 30 and 90 per cent, re-
spectively, the emissions needing to be captured and stored increase by 17 per cent.
• The capacities listed are effective, meaning that the necessary geographical matching of
sources and sinks would reduce this potential yet further.
• It was assumed in the comparison that the whole quantity of emissions could be stored,
which is a highly optimistic assumption if potential injection rates are scrutinised in more
depth.
• In addition, the viability and costs of the necessary pipeline system should be reviewed
(national studies on the costs of CO2 transport generally only allow for transportation
within one’s own country).
• Moreover, such an approach would be a centralistic solution, since the majority of ca-
pacities are located in the North Sea, signalling a significant dependence on just one
combined main pipeline route. It can be assumed that economic issues and public ac-
ceptance would be the decisive factors when considering a pan-European CO2 pipeline
system.
• (Lindeberg et al. 2009 and Schrag 2009) argue that the underground injection of CO2 is
only possible if the same volume of salt water is recovered. This generally rules out the
storage of CO2 onshore because the recovered water would also have to be stored or,
after being desalinised, would lead to considerable occurrences of salification. The au-
thors, however, believe that the recovery of salt water from deep aquifers beneath the
North Sea and the resulting input of CO2 is a possibility.
• As in Germany, other countries would not be able to capture the whole quantity of cur-
rent emissions from large point sources for CO2 storage (for the simple reason that there
are legally binding targets for the growth of renewable energies in all EU countries). In
order to be able to assess storage capacities realistically, therefore, similar power plant
scenarios to those for Germany should be generated for other countries, and a “realistic”
quantity of CO2 matched with the conservative estimates of the storage sites.
This wide range of issues and difficulties described here show that, in all, the storage poten-
tial will probably be insufficient for the storage of all emissions. However, it appears the North
Sea would have sufficient capacity to at least store some of the northern European emis-
sions.
7.7 Atlases and cadastres on CO2 storage capacity
A diverse range of projects are being carried out worldwide to evaluate and assess storage
capacities (see Tab. 2-1). Some of the findings vary significantly, and there is a lack of clear
data. For this reason, several countries are developing an atlas or cadastre on the specific
subject of CO2 storage. These atlases are being produced centrally and at the state level for
the whole country.

Analysis of the options for storing CO2
Wuppertal Institute for Climate, Environment and Energy 185
In Germany, the BGR is currently involved in creating a comprehensive “storage cadastre”.
With a planned publication date of spring 2011, it is not intended to resolve the question of
how potential storage structures should be used. This shows that there is competition for the
use of geological formations, which needs to be addressed more clearly.
In Great Britain the storage capacity is being thoroughly investigated by the Energy Technol-
ogy Institute (ETI) in the CO2 Storage Appraisal Project (UKSAP). The project was launched
in October 2009 with an investment value of ! 4 million. The study is expected to be com-
pleted in March 2011. In the project, potential offshore storage sites for CO2 will be appraised
and the capacities for the United Kingdom generated.
In collaboration with Norway, the UK plans to investigate CO2 storage by matching sources
and sinks in the “one North Sea” project. Its aim is to determine the scale of European de-
mand for storage space and when this demand will arise. In addition, the project considers
the development of a CO2 infrastructure to coordinate the transboundary transport of the
greenhouse gas. An atlas is to be produced providing recommendations for possible actions.
A publication by the U.S. DoE for the USA has been very successful. In addition to identifying
suitable structures, the publication also gives an overview of the methods used to estimate
the storage potential (Frailey 2008). A similar atlas is currently being prepared by the Council
for Geoscience for South Africa. Its completion has been postponed to mid 2010.
7.8 The potential role of enhanced oil recovery (EOR) for CCS
In Section 7.6.3, the possibilities for storing CO2 in the North Sea aquifers of Norway and the
United Kingdom were considered to be immense. However, an international CO2 pipeline
infrastructure would have to be constructed in order to exploit this potential. Enhanced oil
recovery (EOR) using CO2 could start the ball rolling for this deployment. We will now pro-
ceed to give a detailed description of EOR, focusing on these two countries.
7.8.1 The different stages of oil production
Commercially, the most promising aspect of CO2 storage is in the area of the tertiary recov-
ery of oil and natural gas. In the first recovery stage, the natural reservoir drives cause the
hydrocarbons to “bubble out” of the reservoir. In this process, between 10 and 15 per cent
(North 1985) and 30 per cent (Bellona 2005) of the available oil is recovered. At 75 to 95 per
cent, the production quota for natural gas is considerably higher.
In the second recovery stage, water is inserted to force out more oil. This process raises
production quotas to between 30 and 35 per cent (JOULE II) or 45 and 55 per cent (SCCS
2009b). In some fields, 70 per cent of the oil originally in the reservoir can be recovered. In
Norway, this rate averages at 46 per cent (Bellona 2005). In most of the oil fields in the North
Sea, sea water is injected to enhance the second recovery period, whereby the injected
water keeps the pressure in the field constant. This process involves a considerable amount
of treatment because the water in the field blends with the oil, which could have a significant
negative impact on the environment if released into the ocean without cleaning. For this rea-
son, the polluted water is often pumped back into the formation.
RECCS plus – Update and Expansion of the RECCS Study
186 Final Report
In the third recovery period, gases or fluids with various chemical properties are injected into
the formation to maximise oil or gas production. Today, CO2 is mainly used to lower the vis-
cosity of the oil and to force it out. This way, the amount recovered can be increased by a
further 5 to 16 per cent of the oil originally available in the formation (Bellona 2005; SCCS
2009b). So far, naturally occurring CO2, recovered especially, is used for such purposes,
since the degree of purity plays a major role, and capture plants are not yet able to produce
pure CO2. EOR projects are proving particularly successful in the USA, and have led to the
construction of a pipeline system for CO2 of over 3,000 km. Most of the projects are located
in the Texan Perm Basin. The longest pipeline (McElmo Dome) stretches 800 km (Moniz
2008). The additional recovery rates achieved there are 4 to 12 per cent of the oil originally
available in the formation. This recovery method has not yet been tested offshore (SCCS
2009b).
There are different assumptions regarding the quantity of oil that can be additionally recov-
ered using a tonne of CO2: (Pershad and Slater 2007) cite 3 barrels of oil per tonne of CO2
over a 25-year period of injection. (Moniz 2008) states 2.5 to 3.3 barrels, while (Balbinski et
al. 2003) assume a range of between 1.3 and 6 barrels. Calculations based on (Jaramillo et
al. 2009) and (Ferguson et al. 2009) show that around 60 per cent of the injected CO2 re-
mains underground. The remainder comes out with the recovered oil, and could be recycled.
The total quantities of CO2 required for EOR would therefore decrease.
(Holloway 2009) considers it probable that any storage of CO2 in British oil fields will be
linked to EOR, since the profit gained from the additionally recovered oil will exceed the costs
of CCS. The basic requirement for the deployment of this technology is an adequate infra-
structure to reliably deliver the required CO2 at low cost. In addition, the oil price would have
to remain at a high level (above US$ 100/barrel) to make enhanced oil recovery financially
worthwhile (Haszeldine 2009a; Pershad and Slater 2007; SCCS 2009b). In this case, EOR
could be used as a jump start for CCS.
The increased deployment of EOR could also give CCS general impetus if the storage of
CO2 is continued using the existing infrastructure once oil production has stopped (Bellona
2005). It should be pointed out, however, that large amounts of water are pumped into the oil
reservoir in the course of the second recovery stage, considerably reducing the ultimate
storage capacity of the formation if it is not pumped out again prior to the injection of CO2
(SCCS 2009b).
7.8.2 Potential for EOR in Norway and the UK
Norway
The Norwegian NGO Bellona has stated that there is a great potential for EOR in Europe.
According to this foundation, 175 million tonnes of CO2 are required annually to tap an EOR
potential of an additional 17 per cent of oil. In total, a production quota of 63 per cent of oil
deposits would be achieved (Bellona 2005). The CO2 would then be used gainfully as a re-
source. It must be said, however, that Norway has a greater potential than the UK, which is
why the Scandinavian country is particularly interested in a comprehensive supply of CO2.
The method of calculating the stated potential, however, is highly simplified, because the
Analysis of the options for storing CO2
Wuppertal Institute for Climate, Environment and Energy 187
same quantity is not used over the whole injection period. Nonetheless, this rough estimate
is useful for making an initial assessment of the North Sea EOR potential.
Until now, only 17 million tonnes of CO2 are emitted annually from Norwegian point sources.
Further emissions amounting to 9 million tonnes per annum could be made available from
gas-fired power plants on the Norwegian coast. The electricity generated by these plants
could be exported to its neighbouring European countries. 5 GW are currently being planned.
It is not yet clear whether this additional power generated from fossil fuels would have a mar-
ket, given the massive future expansion of renewable energies in the EU. On the other hand,
Norwegian natural gas has a high CO2 content. This gas would be ideal for combustion in a
plant with CO2 capture because this resource’s disadvantage would then be transformed into
a positive feature.
An obstacle for the large-scale use of EOR in Norway is therefore the lack of CO2 sources.
Transport to Norway proves to be difficult because EOR platforms are a long distance from
the coast. In its analysis, (Bellona 2005) concludes that Norway needs as much CO2 as pos-
sible to recover oil on the Norwegian continental shelf. Captured emissions from Denmark
and Germany could also be included, which could be transported via pipeline to large EOR
fields in southern Norway (Pershad and Slater 2007).
UK
The United Kingdom is also eager to realise and expand its planned CO2 EOR projects. Ac-
cording to calculations, 15 to 20 million tonnes of CO2 are required annually to tap the poten-
tial. The total injection for all possible EOR fields therefore amounts to around 1 billion ton-
nes of CO2 (SCCS 2009b). This quantity could easily be supplied by capturing existing CO2
emissions.
Christensen (GEUS) predicts an additional production of 5 to 6 billion barrels of oil through
EOR in the whole of the North Sea (NPD 2007). (Pershad and Slater 2007) quantifies this
potential at 3.8 billion barrels. (Holloway 2009) states that the potential for the United King-
dom is 2 billion barrels of oil that could be produced using CO2 EOR. This amount could also
increase to up to 3.7 billion barrels using additional economic incentives. This would corres-
pond roughly to the deployment of 1 billion tonnes of CO2 (SCCS 2009b).
7.8.3 “Window of opportunity” for CCS
(Pershad and Slater 2007) emphasise the strong time dependence of EOR sinks. Many EOR
projects would be unviable because the conventional production would end several years
before the establishment of a possible CO2 infrastructure. These fields would then no longer
be operated for cost reasons, and the platform would be shut down. If efficient EOR technol-
ogy is to be installed, production must have ended and the associated infrastructure disman-
tled. Once the infrastructure has been dismantled, it is highly improbable that CO2 will be
stored there in future.
The authors divide the potential introduction of EOR in the North Sea into five phases. The
first “EOR project phase” in the North Sea is set to begin in 2013, and the last to end in 2037.
The fields available during the third phase (2023–2028) offer the largest capacities. (SCCS
2009b) considers it necessary to commence with EOR before 2017. This so-called “window
of opportunity” will close, the more extraction advances and the end of production ap-

RECCS plus – Update and Expansion of the RECCS Study
188 Final Report
proaches (Balbinski et al. 2003). It makes good economic sense to commence with EOR
roughly three years before production ends in a field. For large fields in the north of the
United Kingdom, in other words, injections would have to start as early as in 2011, for which
large quantities of CO2 are required as quickly as possible (Holloway 2009). Since the peak
of oil extraction has already passed in Norway, no time should be lost there either if the
maximum quantity of oil is to be produced. It should also be mentioned that no minimum size
requirement for fields in EOR projects has yet been agreed.
The offshore storage of CO2, however, is only considered possible in fields larger than 100
million tonnes.
According to (Haszeldine 2009b), EOR works well onshore, as the USA has shown. Tax in-
centives are given in various states there to promote EOR with CO2. Offshore, however, the
functionality of the technology has not yet been proved. Since 2000, investigations into many
fields in the North Sea have been carried out to determine their suitability for CO2 EOR. All of
them, however, failed for economic reasons (Bushby et al. 2008). This was due to the inse-
cure supply of CO2, the extortionate costs of converting North Sea platforms and the high
investment risk, because the costs invested can only be translated into profit in the long term.
So far, it has been cheaper to deploy conventional methods to produce more oil there (such
as additional boreholes). (Meadowcroft 2010) also stresses that analyses of EOR activities in
Norway have shown they are not financially viable, which is why CO2 EOR projects are cur-
rently being given less attention.
7.8.4 Analogy of EOR for gas production
Enhanced gas recovery, EOR’s counterpart, to extract more natural gas from storage sites is
undertaken only rarely (Sim et al. 2008). To date, there is no commercial application, al-
though the concept has already been under discussion for 15 years. Besides the previous
lack of availability of pure CO2, the greatest concern is that the injected greenhouse gas will
blend with the natural gas, thereby contaminating it. In CCS pilot plants, however, some pro-
jects are also implemented using EGR (for instance, in In Salah, Algeria, see Tab. 2-1).
7.8.5 Advantages and disadvantages of EOR
The advantages and disadvantages of EOR will be compared briefly below:
Advantages of EOR
• The use of CO2 for EOR would lead to the establishment of a suitable infrastructure; the
technology is tested and further developed when the capture, transport and injection of
CO2 is demonstrated. This could accelerate the introduction of CCS.
• The technical advancement would lead to a reduction in the costs of CCS due to CO2
EOR and profits for the oil companies, which could give CCS projects a jump start.
• It is pointed out that the use of power plant emissions for EOR could replace the use of
naturally occurring CO2, produced especially for this purpose, creating double potential
for saving costs (Jaramillo et al. 2009).

Analysis of the options for storing CO2
Wuppertal Institute for Climate, Environment and Energy 189
Disadvantages of EOR
• It is highly improbable that EOR activities will lead to the construction of an adequate
pipeline system by 2020 because the time of deployment for commercial CCS plants is
continually being postponed towards 2030, meaning that such an enormous project
could not be financed. The 12 planned demonstration plants are not sufficient because
they are spread across various EU countries and a multitude of (short) pipelines would
have to be erected from the different sites to the North Sea.
• Even if the 12 planned demonstration plants were in operation in 2020, they would only
supply around 30 million tonnes of captured CO2 annually62. The total amount of CO2 re-
quired for EOR in Norway and the UK, however, is approximately 200 million tonnes an-
nually. There would be an additional annual need of 170 million tonnes of CO2 from
2020. Twenty large power plants would be required for this. The quantity of CO2 cap-
tured from these plants would be needed for EOR production in the North Sea alone63.
• The whole life cycle assessment linked to the storage of CO2 through EOR (Jaramillo et
al. 2009) concludes that between 3.7 and 4.7 tonnes of CO2 are emitted for every tonne
of injected CO2. This amount is made up of the emissions that occur in the production,
transportation, processing and combustion of oil. Unlike with the storage of pure CO2 (if
it is assumed no leakage occurs), EOR is not an option for reducing CO2 emissions, and
would therefore be at odds with climate protection (Luhmann 2009).
7.8.6 Conclusions from the analysis of EOR
There appears to be potential for enhanced oil recovery using CO2 in the North Sea. The
obstacles that need to be overcome for a large-scale deployment of CO2 EOR offshore are
the long-term, safe supply of CO2 and a stable oil price above US$ 100/barrel. The largest
capacities will probably be required in the 2020s, by which time it is highly unlikely that a CO2
pipeline infrastructure will be in existence.
The economic incentive of EOR could promote the introduction of CCS as a climate protec-
tion option. If the EOR infrastructure is later used for CCS, the time window in which a plat-
form can be converted must be taken into account. It must also be assessed economically
whether it is worthwhile for the company to convert the platform once oil production has fi-
nally ended. If the conversion is too expensive, the infrastructure will be abandoned and the
storage site may no longer remain usable.
If the life cycle assessment of EOR is considered, it is clear that it cannot contribute to cli-
mate protection. On the contrary: for every tonne of CO2 stored, the production and subse-
quent use of the oil releases a four-fold amount of CO2 into the atmosphere. The only advan-
tage would be that by using industry emissions for EOR, the naturally occurring quantities of
CO2 previously used would remain underground and would not be tapped.
62 This value is calculated from 12 plants the size of the planned coal-fired power plant in Hürth (capture of
around 2.5 million tonnes of CO2 per annum with a net power of 330 MWel).
63 Calculated using 5 to 10 million tonnes of CO2 per annum per power plant, on average 7.5 million tonnes of
CO2.

RECCS plus – Update and Expansion of the RECCS Study
190 Final Report

An environmental assessment of CCS compared with renewable energies
Wuppertal Institute for Climate, Environment and Energy 191
8 An environmental assessment of CCS compared with renew-
able energies
8.1 Review of the results of the RECCS study
In the RECCS study, life cycle assessments (LCAs) were carried out for the first time for the
three conventional capture routes. These LCAs were then compared with selected renew-
able energy plants and other innovative concepts for the use of fossil fuels. Anticipated effi-
ciency levels for 2020 were used for both the reference power plants and CCS power plants.
Although the life cycle assessments were performed in line with ISO 14.040ff, they can only
qualify as screening LCAs. This is because it proved impossible to obtain precise assess-
ments for some of the processes, especially the chemical processes involved in the capture
and storage of CO2. In this study, we present the latest developments of the past three years
and relevant works published after the completion of the RECCS study.
8.2 Life cycle assessments along the whole CCS chain
8.2.1 Complete overview
Our initial comparison includes life cycle assessments along the whole CCS chain. Studies
that included either only greenhouse gas emissions or only the power plant without the up-
stream and downstream chains were not included in this exercise. The minimum criteria
were:
• Life cycle assessment according to, or in line with, the relevant standards (ISO 14.040ff);
• Consideration of relevant environmental impact categories, as portrayed in (Guinée et al.
2002), for example: consumption of limited resources, greenhouse effect, acidification of
soils and bodies of water, nutrient input in soils and bodies of water (eutrophication),
photochemical smog, particles and dust;
• Modelling the whole chain: recovery and transport of primary energy, power plant pro-
cesses (with/without CO2 capture), transport of CO2, storage of CO2;
• Inclusion of second- and third-order processes, i.e. the upstream chains for individual
materials (for instance, the solvent MEA) and plant infrastructure (for instance, the con-
struction of the power plant).
Tab. 8-1 provides a comprehensive overview of the most important assumptions and findings
of the studies described in the next section. Please note, however, that only the key param-
eters were analysed in the direct comparison. The study results may deviate from one an-
other, due to their assuming different values. These have not been analysed in detail.
• Utrecht University: Hard coal-fired steam power plant in the Netherlands, including post-
combustion (MEA capture), current situation, 50 km pipeline, natural gas storage facility
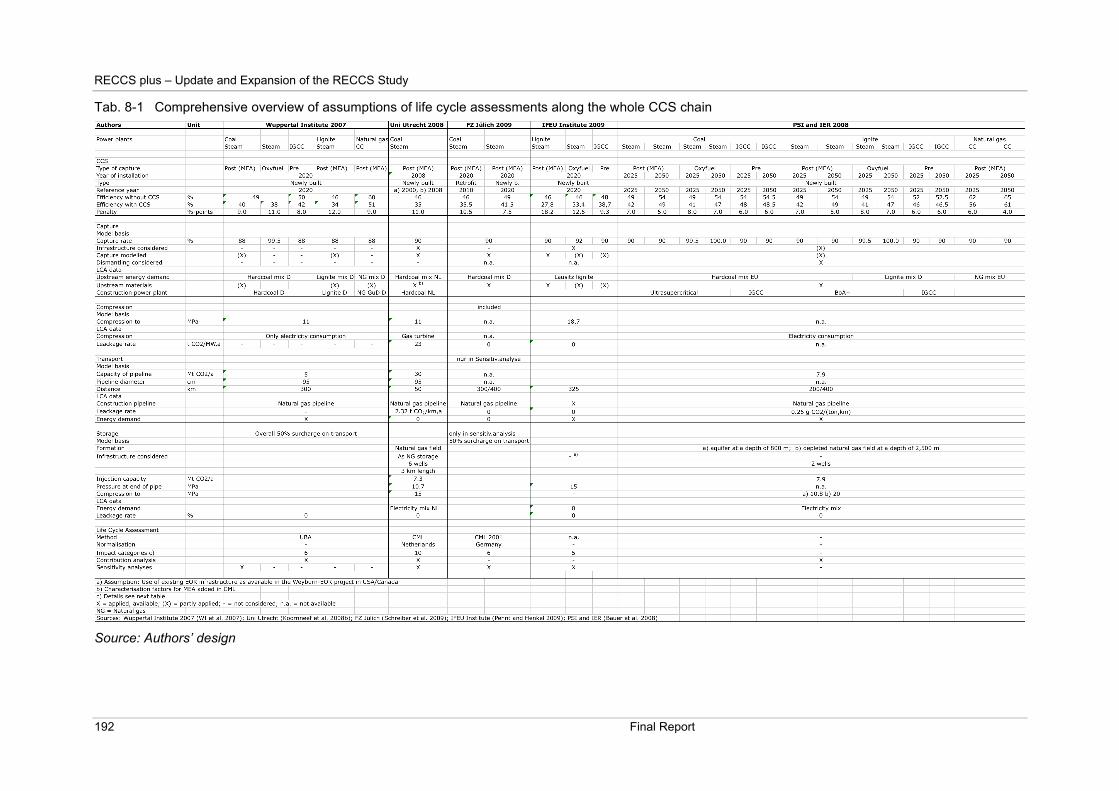
RECCS plus – Update and Expansion of the RECCS Study
192 Final Report
Tab. 8-1 Comprehensive overview of assumptions of life cycle assessments along the whole CCS chain
Source: Authors’ design

An environmental assessment of CCS compared with renewable energies
Wuppertal Institute for Climate, Environment and Energy 193
• Forschungszentrum Jülich: Hard coal-fired steam power plants, including post-
combustion reference case, situation in 2020
- steam power plant from 2010, retrofitted with MEA capture in 2020,
- steam power plant in 2020 with MEA capture (new construction)
• IFEU Institute Heidelberg: Lignite-fired power plants in eastern Germany (Lusatia), situa-
tion in 2020, 325 km pipeline, natural gas storage facility
- steam power plant with post-combustion technology based on MEA capture,
- steam power plant (oxyfuel),
- IGCC with pre-combustion technology based on Selexo
• Paul Scherrer Institute (PSI), Villigen, Switzerland / Institute of Energy Economics and
the Rational Use of Energy (IER), University of Stuttgart: Hard coal-, lignite- and natural
gas-fired power plants, 200 and 400 km pipeline, 2,500 m natural gas storage facility
and 800 m aquifer
- hard coal with post-combustion, pre-combustion and oxyfuel technology,
- lignite with post-combustion, pre-combustion and oxyfuel technology
- natural gas with post-combustion technology.
8.2.2 Overview of the individual studies
Hard coal (Utrecht University)
A detailed and very well documented life cycle assessment analysis for a hard coal-fired
steam power plant, including post-combustion and subsequent transportation and storage of
the CO2, was published in 2008 by scientists at Utrecht University (Koornneef et al. 2008b).
Three cases were explored:
1. Reference case: average hard coal-fired steam power plant operating in the Netherlands
in 2000 (subcritical, 460 MWel),
2. State-of-the-art hard coal-fired steam power plant (ultra-supercritical, 660 MWel),
3. as in Case 2, but fitted with MEA-based, downstream CO2 separation (post-combustion,
capture rate 90 per cent, net 450 MWel, capture of 3.6 million tonnes of CO2/a).
In contrast to the RECCS analysis, rather than modelling a future situation in 2020
(with/without CCS), an analysis was made of what a state-of-the-art coal-fired power plant
(with/without CCS) could achieve compared to actual reality. The model focused on the cap-
ture of CO2. To this end, existing life cycle assessment modules for hard coal-fired power
plants were first updated using as their model the state-of-the-art system in flue gas cleaning
in the Netherlands to create a starting point for Case 3. As an upstream chain, the average
hard coal mix for the Netherlands from 2004 was used.
With regard to CO2 capture, the equipment required for the infrastructure was modelled ac-
cording to manufacturers’ data. This model excluded energy expenditure for construction and
dismantling, and also energy consumption and material costs for maintenance, excluding
later disposal. In addition, the demand for heat and electricity was determined. The capture
RECCS plus – Update and Expansion of the RECCS Study
194 Final Report
process was modelled in detail using data from published works (consumption of MEA and
degradation to salts, reaction with other emissions in addition to CO2, consumption of other
materials).
The compression process was modelled using LCA data for a gas turbine; the energy ex-
penditure for compression with an initial pipeline pressure of 11 MPa was calculated in detail.
Based on the IPCC method (IPCC 2006), a leakage rate in the compression of 23 t
CO2/(MW,a) was established. With an assumed capture quantity of 3.6 million tonnes of
CO2/a (or 0.011 million tonnes of CO2/(MW,a)), this constitutes a 0.4 per cent loss of CO2.
A distance of 50 km was assumed for the transport. This distance was considered represen-
tative of a pipeline from a coastal location to one of several possible onshore storage sites in
northern Holland. The infrastructure was modelled in line with the natural gas pipeline. A
leakage of 2.32 t CO2/(km,a) was assumed. With a total transport of 30 million tonnes per
annum, for which the pipeline was designed, this produces a leakage rate of 0.0000077 per
cent per kilometre transported.
When assessing CO2 storage in a depleted natural gas storage site, the infrastructure was
modelled based on experience gained from storing natural gas (excluding energy expendi-
ture for construction and later dismantling, excluding energy expenditure and material costs
for maintenance, excluding subsequent disposal). In addition, the installation and operating
expenses for six 3 km boreholes were included. It was taken into account that the pressure
at the end of the pipeline is insufficient for injecting and that a pressure boost from 10.7 MPa
to 15 MPa is required, using electricity from the grid. Instead of modelling leakage, a leakage
rate of zero or an “insignificant amount” was assumed.
The life cycle impact assessment was carried out using the CML process, one of the most
commonly used methods of analysis. Ten different environmental impact categories were
considered and standardised for the Netherlands. In addition, sensitivity analyses were per-
formed for six critical parameters.
The key conclusions drawn from the study are:
State-of-the-art hard coal-fired power plants (Case 2) improve all impact categories com-
pared with the average power plant fleet in the Netherlands (Case 1) by 23 to 83 per cent. It
is not possible to make such unequivocal statements for CCS-based power plants because
there are a number of trade-offs: if applied today, CCS could reduce the greenhouse gas
emissions of a hard coal-fired power plant to 243 g (CO2-eq)/kWhel. Compared to Cases 1
and 2, this constitutes a 78 and 71 per cent reduction, respectively. This is much less than
expected for a CO2 capture rate of 90 per cent because of the additional emissions from the
hard coal upstream chain, and other processes. These figures correspond roughly with the
results in the RECCS study, which determined a reduction of 67 per cent for power plants in
2020 (for which a 49 per cent initial degree of utilisation and a CO2 capture rate of 88 per
cent were assumed).
In this context, the authors introduce the term avoidance efficiency. The avoidance efficiency,
68 per cent in this example, implies that only 68 tonnes of CO2 would be avoided if 100 ton-
nes of CO2 were stored. They correctly point out that this should be taken into account in the
calculation of CO2 allowances.

An environmental assessment of CCS compared with renewable energies
Wuppertal Institute for Climate, Environment and Energy 195
The impact of infrastructure expenses (capture, transport and storage) on the total green-
house gas emissions is very low at 0.3 per cent.
If we compare Case 3 (CCS) and Case 2 (state of the art) with the other impact categories,
the authors conclude that only “marine aquatic ecotoxicity” is reduced (by 27 per cent). This
was caused by the reduced emissions of hydrogen fluoride. All other impact categories dete-
riorate by 27 to 181 per cent, although the direct emissions of dust, SO2, hydrogen chloride
and hydrogen fluoride also decline, due to CO2 scrubbing.
Despite the detailed modelling of the various stages in the process, many uncertainties re-
main. For this reason, the authors call their study “advanced screening LCA”. Thus the MEA
upstream chain taken from the ecoinvent database is considered to be highly uncertain. It
was also not possible to explicitly model the entire capture process (the quantity of MEA
used, for instance). Sensitivity analyses show that the variation for some of the parameters
(for example, the CO2 capture rate or the capture efficiency of other chemicals) has a con-
siderable impact on the computed results. For this reason, the authors recommend the intro-
duction of a comprehensive measurement programme for the first CCS power plants to gain
information about the actual emissions caused or reduced due to capture, and about their
interaction with other scrubbing technologies. In this sense, the aim of their study has also
been to expose which areas have an urgent need for action.
Hard coal (Forschungszentrum Jülich)
Hard coal-fired steam power plants, including post-combustion, were also the focus of an
analysis published by scientists from Forschungszentrum Jülich in 2009 (Schreiber et al.
2009). Five cases were explored:
1. Reference case: A hard coal-fired steam power plant (500 MWel) installed in the 1990s,
but still in operation in 2005,
2. A state-of-the-art hard coal-fired steam power plant, installed in 2010 (552 MWel),
3. A hard coal-fired steam power plant projected to standards for 2020 (697 MWel),
4. As in Case 2, but retrofitted in 2020 with MEA scrubbing (90 per cent capture rate, net
426.5 MWel),
5. As in Case 3, but fitted with MEA scrubbing (90 per cent capture rate, net 592 MWel).
As in the previous study, a comparison was drawn between a brand new, state-of-the-art
coal-fired power plant (both with and without CCS) and a more realistic, older plant. To this
end, the power plant was divided into its various modules, and the individual units – such as
the generator, flue gas scrubbing and dust scrubbing – were projected and supplemented by
CO2 scrubbing, including CO2 compression for Cases 4 and 5. The average hard coal mix for
Germany was used as the upstream chain. Neither transport nor storage was considered in
either of the basic variants for CCS. The presentation of results focused on the separation of
emissions and consumption in the actual power plant process and all upstream and down-
stream processes.

RECCS plus – Update and Expansion of the RECCS Study
196 Final Report
The additional need for heat and electricity was determined with regard to CO2 capture.64 In
Case 5 (CCS new construction), the SOx concentration in the flue gas was reduced from 150
to 29 mg/m3 for the capture process. The consumption of NH3 and limestone, as well as MEA
and caustic soda (for CO2 capture), was varied. The infrastructure was not modelled. The
energy demand for compression was included, but not explained in further detail. Leakages
were not taken into account.
The life cycle impact assessment was also carried out using the CML method. Six different
environmental impact categories were considered and standardised for Germany. The im-
pact of other hard coal upstream chains, the addition of transport (300 km) and storage, a
longer transportation distance (400 km) and a higher CO2 absorption rate of the MEA were
investigated in sensitivity analyses.
The key conclusions drawn from the study are:
State-of-the-art or future state-of-the-art hard coal-fired power plants (Cases 2 and 3, without
CCS) improve all impact categories compared to power plant generation from the 1990s.
Retrofitting with CO2 capture (Case 4) and the construction of a new CCS power plant (Case
5) generated a 27(*) and 20(*) per cent higher cumulated energy consumption than for refer-
ence power plants 2 and 3.65 The greenhouse gas emissions were reduced from around
800(*) and 770(*) g (CO2-eq)/kWhel to 210(*) and 190(*) g (CO2-eq)/kWhel, i.e. by 74(*) and 75 per
cent(*). The relatively low additional consumption and the relatively high greenhouse gas re-
duction in Case 5 are due to the low efficiency loss of just 7 per cent. Retrofitting with losses
of just 10.5 per cent was probably also calculated too generously because these values have
already been exceeded by other authors for newly constructed power plants.
If Case 4 (CO2 retrofitting) is compared with Case 2 (state of the art) with regard to the other
impact categories, the authors conclude that all categories would worsen by 6(*) to 210(*) per
cent. If, on the other hand, Case 5 (CCS new construction in 2020) is compared with Case 3
(new construction in 2020), the summer smog category improves by 13(*) per cent, whereas
the other categories deteriorate by 5(*) to 90(*) per cent.
Sensitivity analyses show that the consequences of transport and storage66 have only a mi-
nor effect on all impact categories. Varying the solvent’s absorbency does not cause any
noticeable change. Only the use of Australian or South African coal instead of the German
hard coal mix leads to a 40(*) to 120(*) per cent reduction in acidification, summer smog and
eutrophication.
Lignite (IFEU Institute)
Shortly afterwards, scientists from the Institute for Energy and Environmental Research, Hei-
delberg, published a detailed life cycle assessment analysis for various CCS-based lignite
power plants (Pehnt and Henkel 2009). The analysis is based on the work of (Henkel 2006)
64 No sources were given for this, however.
65 All of the following values marked with (*) can only be estimated since they are not available as numerical
values, but have to be measured from diagrams. 66
Storage is modelled in accordance with the approach in the RECCS study, in which, for cost estimates, 50
per cent of the energy consumption and the emissions balanced for transport were applied for storage.

An environmental assessment of CCS compared with renewable energies
Wuppertal Institute for Climate, Environment and Energy 197
and (Idrissova 2004). The analysis refers to 2020 and lignite mined in Lusatia. The following
were analysed:
1. A steam power plant with and without post-combustion technology based on MEA cap-
ture (90 per cent CO2 capture rate),
2. An oxyfuel-based steam power plant (92 per cent CO2 capture rate),
3. An IGCC with and without pre-combustion technology based on Selexo (90 per cent CO2
capture rate),
all of which were designed with a capacity of between 500 and 800 MWel. As in the RECCS
study, the current state-of-the-art example was first projected on to 2020 for the steam power
plant and IGCC (efficiency and emissions) to model the capture of CO2 and then expanded
by a CCS variant. In addition to these reference conditions, “slower development” and “faster
development” routes were considered (with/without CCS) as a sensitivity analysis. Lusatian
lignite was used as the upstream chain.
The CO2 capture was modelled in different ways:
• Steam power plant (post-combustion): MEA manufacture, consumption and degradation,
CO2 capture rate and energy consumption, capture of other emissions, infrastructure.
Compared to all other studies, the very high level of energy consumption is conspicuous
(18.2 per cent efficiency losses, which lead to an increased consumption of 66 per cent).
• Steam power plant (oxyfuel): oxygen requirement and energy consumption for air sepa-
ration, CO2 capture rate, SOx separation, 92 and 100 per cent retention of all other
emissions in sensitivity analyses, infrastructure.
• IGCC (pre-combustion): capture rate and energy consumption, SOx emissions, infra-
structure.
For compression and transportation, data was imported from the Weyburn EOR project
(USA/Canada), as this was deemed to be representative for Germany, too: 325 km pipeline
transportation, compression to 18.7 MPa at the power plant using electricity to ensure a
pressure of 15 MPa, sufficient for the injection, is achieved at the end of the pipeline. No CO2
losses are assumed during compression and transportation; the infrastructure is not mod-
elled.
No expenditure was assumed for CO2 storage in a depleted natural gas storage site. Instead,
it was assumed that the existing infrastructure from the previous recovery of natural gas
could continue to be used. Since the pipeline pressure is adequate, no energy consumption
is required for storage either. No leakages were modelled.
Six different environmental impact categories were considered when carrying out the life cy-
cle impact assessment. Emissions in water and the soil were not included. All results were
given for the reference case and two sensitivity cases “slower development” and “faster de-
velopment”.
The key conclusions drawn from the study are:
Depending on the technology, between 24 (IGCC) and 66 per cent (steam power plant) addi-
tional consumption of primary energy is required for the CCS-based power plants.

RECCS plus – Update and Expansion of the RECCS Study
198 Final Report
The greenhouse gas emissions can be reduced from approximately 940 g (CO2-eq)/kWhel to
190(*) (post-combustion) and 120(*) g (CO2-eq)/kWhel (oxyfuel), or around 80(*) and 87(*) per
cent.67 The IGCC power plant was 880 g (CO2-eq)/kWhel and is reduced to 140(*)g (CO2-
eq)/kWhel, i.e. by 84(*) per cent. The difference to the assumed CO2 reduction rates of 90 to
92 per cent is revealed by the expenses incurred by the additional energy consumption. In
contrast to hard coal-fired power plants, most emissions occur directly at the power plant (79
per cent with post-combustion and oxyfuel, and 98 per cent with pre-combustion) and not in
the upstream fuel chain.
The values for the steam power plant correspond with those of the RECCS findings (al-
though there not such a high additional consumption was assumed); the other two routes
were only considered for hard coal and not for lignite in RECCS.
Potential leakages were not modelled. Nevertheless, it is assumed that CO2 is released (“it is
clear that leakage will not be zero”), albeit at a much later stage. However, it is pointed out
that some research suggests that a delayed release of CO2 emissions could have a positive
impact on climate change (the slow escape of small quantities instead of higher rates at the
present time). It is also stressed that the lower the permeability of the storage site, the more
CO2 is dissolved, which is then unable to reach any leakage points. This, however, contra-
dicts the catalogue of available criteria for the selection of suitable storage sites (see Tab. 7-
2). One of these criteria is that a sufficiently high level of permeability is required to be able to
store huge quantities of CO2 from power plants within a short space of time.
At 2.3 to 2.6 per cent, the proportion of infrastructure expenses within the overall greenhouse
gas emissions is low. However, it is still one order of magnitude higher than the values of-
fered by (Koornneef et al. 2008b), even though transport and storage have not been recon-
ciled. If compression is assigned to the power plant, transport and storage (without infrastruc-
ture), it constitutes 0.1 to 2.8 per cent of the total impact.
As with (Koornneef et al. 2008b), there is a wide variety of trade-offs in the case of other im-
pact categories. Depending on the technology, very different results are produced, which are
analysed in detail by the authors and can only be given here for the reference case:
• Steam power plant (post-combustion): With the steam power plant, the environmental
impacts in the reference case increase more or less substantially, with the exception of
acidification (summer smog +250 per cent, eutrophication +98 per cent(*), acidification -5
per cent(*), health effects +26 per cent(*)). The main causes are the additional energy
consumption, the CO2 capture process and the manufacture of the solvent.
• Steam power plant (oxyfuel): In contrast, oxygen combustion generates the lowest emis-
sions (summer smog -56 per cent(*), eutrophication -80 per cent(*), acidification -76 per
cent(*), health effects -22 per cent(*)) in the reference case (92 per cent retention of all
emissions).
• IGCC (pre-combustion): The environmental impacts of an IGCC without CCS are 33 to
66 per cent lower in the reference case than a steam power plant without CCS. With
CO2 capture, the environmental impacts increase in the reference case, as with the
67 All of the following values marked with (*) can only be estimated since they are not available as numerical
values, but have to be measured from diagrams.
An environmental assessment of CCS compared with renewable energies
Wuppertal Institute for Climate, Environment and Energy 199
steam power plant (summer smog +40 per cent(*), eutrophication +20 per cent(*), acidifi-
cation +66 per cent(*), health effects +27 per cent(*)), but nevertheless remain far below
the values for the steam power plant without CCS in all categories.
In the case of the steam power plant, the results are comparable to those computed in the
RECCS study; the other two routes were only modelled with regard to energy consumption in
RECCS.
The authors point to the considerable uncertainties that must be taken into account when
interpreting the results, in particular because IGCC and oxyfuel combustion are technologies
that are still in their infancy, or have not yet been constructed. In addition, the results of the
oxyfuel power plant are heavily reliant on whether non-CO2 emissions can be fully retained,
as with CO2, or not at all. In the former case, realistically an oxyfuel power plant would be a
“near zero”-emission power plant. In the latter case, it would be assessed as being similar to,
or worse than, the post-combustion process.
Hard coal, lignite, natural gas (EU NEEDS study by PSI and IER)
The most extensive study, also published in 2008, was carried out within the EU NEEDS68
project, part of a global framework to derive new “external cost” factors for future power gen-
eration systems in Europe. The potential of various CCS technologies was modelled within
the context of long-term scenarios up to 2050 (2005, 2025 and 2050). Based on the scenario
development, costs were computed and their life cycle assessments (or life cycle inventories)
determined (Bauer et al. 2008). Three main scenarios representing potential developments
from the perspective of CCS technology were considered: “pessimistic”, “optimistic-realistic”
and “very optimistic”. The “optimistic-realistic” option, analysed below, was taken to be the
most likely, as with the other technologies explored in the NEEDS study. In addition, driving
and constraining forces, as well as the general role of fossil electricity generation in future
energy systems, were analysed.
The dynamics applied in NEEDS are its main distinguishing feature compared with all other
published studies: by linking life cycle assessments to development scenarios, relevant
“learning effects” on the technical side (and hence the material balance) could be taken into
account. Double dynamics are created due to the fact that the background processes are
also adjusted decade for decade by, for instance, including higher recycling rates for steel or
an altered energy mix based on European energy scenarios in the manufacture. The path for
the 440 ppm (climate protection) scenario was chosen for the following situation.
In this study, the three processes of post-combustion, pre-combustion and oxyfuel were con-
sidered for hard coal- and lignite-fired power plants; the post-combustion process was ap-
plied for the natural gas combined cycle (NGCC). The date of application for IGCC (pre-
combustion) was assumed to be 2015. The complete life cycle (upstream chains of the en-
ergy sources; the manufacture, operation and dismantling of the power plants; storage) was
calculated. Life cycle assessment modules from the ecoinvent database were used through-
out. These modules describe the actual situation in Europe or the transportation there. Fu-
ture periods were modelled in accordance with (ESU and IFU 2008). All results were divided
into the manufacture, operation, fuel and dismantling of the plant.
68 NEEDS = New Energy Externalities Developments for Sustainability, http://www.needs-project.org/.

RECCS plus – Update and Expansion of the RECCS Study
200 Final Report
The following assumptions were made for the reference power plants (without CCS):
1. Hard coal-fired steam power plant reference: Rostock power plant (ultra-supercritical,
350, 600, 800 MWel)
2. Hard coal-fired IGCC reference: Puertollano power plant (Spain), projected (450 MWel)
3. Lignite-fired steam power plant reference: Niederaussem K power plant, Bergheim (lig-
nite-fired power plant with optimised plant technology, 950 MWel)
4. Lignite IGCC reference: Vrespva power plant (Czech Republic, 400 MWel)
5. Natural gas reference: Mainz-Wiesbaden power plant (400 MWel).
The power plants were projected according to the three different technology scenarios
“pessimistic”, “optimistic-realistic” and “very optimistic” to 2025 and 2050. Several CCS vari-
ants were also modelled.69 The degree of utilisation (with or without CCS), the CO2 capture
rate and the use of chemicals for CO2 scrubbing are considered to be the key parameters for
CO2 capture. The infrastructure of the capture plants was not modelled because it generally
has only a minor impact on the results of the life cycle assessment.
• The degree of utilisation was projected according to bibliographical references. Depend-
ing on the source of primary energy, the technology and scenario, efficiency losses be-
tween 6 and 10 percentage points were assumed for 2025 and between 4 and 10 per-
centage points for 2050. If the values for 2025 are compared with those of the RECCS
study, between 25 and 40 per cent lower losses than in the power plants modelled for
2020 in RECCS were assumed.
• For the CO2 capture rates, 90 per cent was assumed with post- and pre-combustion
(RECCS: 88 per cent), as well as 99.5 per cent with oxyfuel (coal) and 100 per cent
(natural gas) (RECCS: 99.5 per cent for coal).
• The consumption of MEA, caustic soda (NaOH) and activated carbon was modelled for
the post-combustion capture process, but not projected to the future, due to a lack of
data. Assumptions about the behaviour of NOx and SOx emissions were made. For the
oxyfuel combustion, only the energy consumption of the air separation was computed.
Two different distances (200 and 400 km) were assumed for the transport. Compression at
200 km was calculated for the 400 km long pipeline. The resulting power requirement was
taken from (Wildbolz 2007, Doka 2007). The infrastructure model was based on natural gas
pipelines. A leakage rate of 0.26 g/thousand km was assumed, which corresponds with a
value of 0.0052 per cent per 200 km, or 0.000026 per cent per km transported.
To model CO2 storage, the power requirement to establish the necessary injection pressure,
calculated in (Wildbolz 2007, Doka 2007), was included for two different storage formations
(aquifer at a depth of 800 m and depleted natural gas storage site at a depth of 2,500 m).
Leakages were not modelled. Instead, a leakage rate of zero was adopted, and it was as-
69 Although hard coal- and lignite-fired steam power plants were modelled differently for the actual situation, no
differentiation is made any longer between lignite and hard coal for future steam power plants. This means
that lignite has to develop more rapidly than hard coal, in particular with regard to the degree of utilisation.
An environmental assessment of CCS compared with renewable energies
Wuppertal Institute for Climate, Environment and Energy 201
sumed that other storage sites would not be authorised and that tests and monitoring would
be able to detect any leakages.
Unlike “complete” life cycle assessments, the last step – the life cycle impact assessment –
was not carried out in NEEDS. The greenhouse gas potential was merely summarised from
the impact factors of the IPCC. All life cycle inventory results can be retrieved from the
NEEDS website, and can therefore be further processed as required.
The key conclusions drawn from the study are:
Depending on the fuel, the technology used and the scenarios considered, the application of
CCS by 2050 can reduce greenhouse gases emissions from fossil fuel-fired power plants by
70 to 95 per cent, i.e. significantly. Between 26 and 192 g (CO2-eq)/kWhel were computed as
resulting values for all scenarios. In the “optimistic-realistic” scenario, the lowest value in
2050 – 28 g (CO2-eq)/kWhel – was achieved for the oxyfuel steam power plant fired by lignite.
By contrast, NGCC achieved 77, lignite IGCC 118 and the hard coal-fired steam power plant
(post-combustion) 168 g (CO2-eq)/kWhel. Transport and storage comprise only a fraction of
the total emissions.
The low greenhouse gas emissions must be seen in the context of an increased energy ex-
penditure (plus 10 to 20 per cent in 2050) and a corresponding increase in all emissions
caused by the recovery and transportation of energy sources. As also shown in RECCS, this
particularly concerns the hard coal and natural gas upstream chain. A higher burden is then
yielded in the total amount with numerous emissions than without CCS. It is not possible to
draw more detailed conclusions from this because the study did not calculate any envi-
ronmental impact parameters.
Compared to the RECCS study, a greater reduction in emissions and a lower energy ex-
penditure are generally yielded. This is due, in particular, to the approximately 25 to 40 per
cent lower efficiency losses assumed in 2025 and further improvements in efficiency by
2050. The energy expenditure of lignite-fired power plants modelled was too low: although
the capture expenditure for lignite is much higher than for hard coal-fired power plants, due
to the higher CO2 emissions, the same efficiency losses were used for both.
8.2.3 Comparison of findings
Development of emissions
The findings of the RECCS study were mainly confirmed for post-combustion processes,
even if in the latest studies (in particular, by Koornneef et al. 2008b) the capture and, in part,
transport and storage were modelled in more detail. Substantial new findings were generated
for pre-combustion and oxyfuel, despite the fact that the capture processes have not yet
been considered in detail. All of the results of the emissions calculation are presented in Tab.
8-3.
The only value given in all of the studies is that of greenhouse gas emissions, consisting
mainly of CO2, CH4 and N2O emissions. They are particularly relevant in the case of hard
coal- and natural gas-fired power plants because considerable methane emissions (CH4) are
created here in the upstream chains. This effect is intensified by the increased energy con-
sumption of CCS power plants. Fig. 8-1 presents an overview of the development of green-

RECCS plus – Update and Expansion of the RECCS Study
202 Final Report
house gas emissions in the various studies (the sensitivity analyses contained in all studies
are not shown). The capture rates and initial emissions in 2020 are generally assumed to be
identical in all studies. Considerable deviations are visible, however, in the reduction of
greenhouse gas emissions. The reason for this is that varying assumptions are made on the
additional energy consumption caused by capture, and hence the reduction in the degrees of
utilisation. In the NEEDS study (Bauer et al. 2008), in particular, significantly lower losses
than in other studies are assumed.
The following rates of reduction of greenhouse gases are given for 2020/2025:
• Hard coal: steam (67 to 72 per cent), oxyfuel (78 and 85 per cent), IGCC (68 and 67 per
cent)
• Lignite: steam (78 to 81 per cent), oxyfuel (87 and 95 per cent), IGCC (83 and 84 per
cent)
• Natural gas: steam (67 and 75 per cent).
With regard to the other environmental impact categories, some of the values for post-
combustion and pre-combustion increase considerably, while they also decline in some
categories due to the simultaneous reduction of individual emissions during the CO2 capture
process. A considerable decrease in all environmental impacts can generally be assumed
with oxyfuel capture.
Harmonisation
There is a need for harmonisation in life cycle assessment for CCS technology. We have
witnessed the wide range of assumptions for capture, transport and storage, timing of the
CCS process, the type of reference power plant, the choice of parameter and the varying
environmental impact categories. Following the American example of assessing all state
plans according to standard “Carbon Capture and Sequestration Systems Analysis Guide-
lines” (NETL 2005), life cycle assessment guidelines should be drawn up and used in all in-
vestigations. In Germany, the “Network on Life Cycle Inventory Data” would lend itself to this
aim of uniformity. The objective of this network is to provide harmonised life cycle assess-
ments, including in the energy sector, in collaboration with relevant stakeholders (BMBF
2008).
Data availability
Some authors recommend installing a comprehensive monitoring programme for the first
CCS power plants. This way, we could gain information about the actual emissions caused
or reduced by the capture of CO2. Such information would considerably improve our under-
standing of the individual chemical processes, and how to model them.
Time frame
Most of the studies neglect to take into account that a commercial use of CCS (including
transport and storage) is only expected to become available in 2025, or more likely in 2030.
Only the NEEDS study includes a balance for the periods 2025 and 2050, albeit based on
the commercial introduction of CCS in 2020.

An environmental assessment of CCS compared with renewable energies
Wuppertal Institute for Climate, Environment and Energy 203
Calculation of captured and avoided CO2
Even though in scientific studies the captured quantities are differentiated from the quantities
of CO2 that are actually avoided, this is not common practice.70 For this reason, the avoid-
ance efficiency coefficient, as suggested by (Koornneef et al. 2008b), should be stated in all
CO2 avoidance calculations. This coefficient plays a particularly important role when CO2
allowances are later offset within the meaning of the amended ETS Directive (see Section
6.1.2.7).
8.3 Comparison of electricity from CCS and from renewable energies
The development of fossil technologies, including CCS, will now be compared with renew-
able energies. Only greenhouse gas emissions are taken into account because no standard-
ised data exists for the other environmental impact categories for CCS.
We use the results from the aforementioned EU NEEDS study, in which not only future fossil
energy technologies, but also a number of renewable energies, were investigated in terms of
their future development. Life cycle assessments for three stages of development were also
generated, namely current technology, the situation in 2025 and the situation in 2050. As
previously mentioned, the background processes were simultaneously adjusted to energy
mixes arising from the various pan-European energy scenarios. From these scenarios, we
use the 440 ppm climate protection scenario here. The minimum and maximum values from
the three technology scenarios “pessimistic”, “optimistic-realistic” and “very optimistic” are
selected. Offshore wind power (DONG Energy 2008), photovoltaics (Frankl et al. 2008) and
solar thermal power plants (Viebahn et al. 2008) are used for the comparison with CCS
power plants. Their greenhouse gas emissions (CO2, CH4 and N2O) are shown in Tab. 8-2.
The values describe a mix of various technologies, which can be referred to in the cited
sources.
Tab. 8-2 Greenhouse gas emissions from solar thermal power plants, photovoltaics and offshore wind (current situation, 2025 and 2050)
Source: DONG Energy 2008, Frankl et al. 2008, Viebahn et al. 2008, IPCC 2007 (conversion to CO2 equivalents)
70 For instance, a representative of a large utility company declared at the Loccum CCS Conference in October
2009 that they have not yet included the additional CO2 emissions in their calculations.

RECCS plus – Update and Expansion of the RECCS Study
204 Final Report
Tab. 8-3 Comprehensive overview of results of life cycle assessments along the whole CCS chain – evaluation of five different studies
Source: Authors’ design
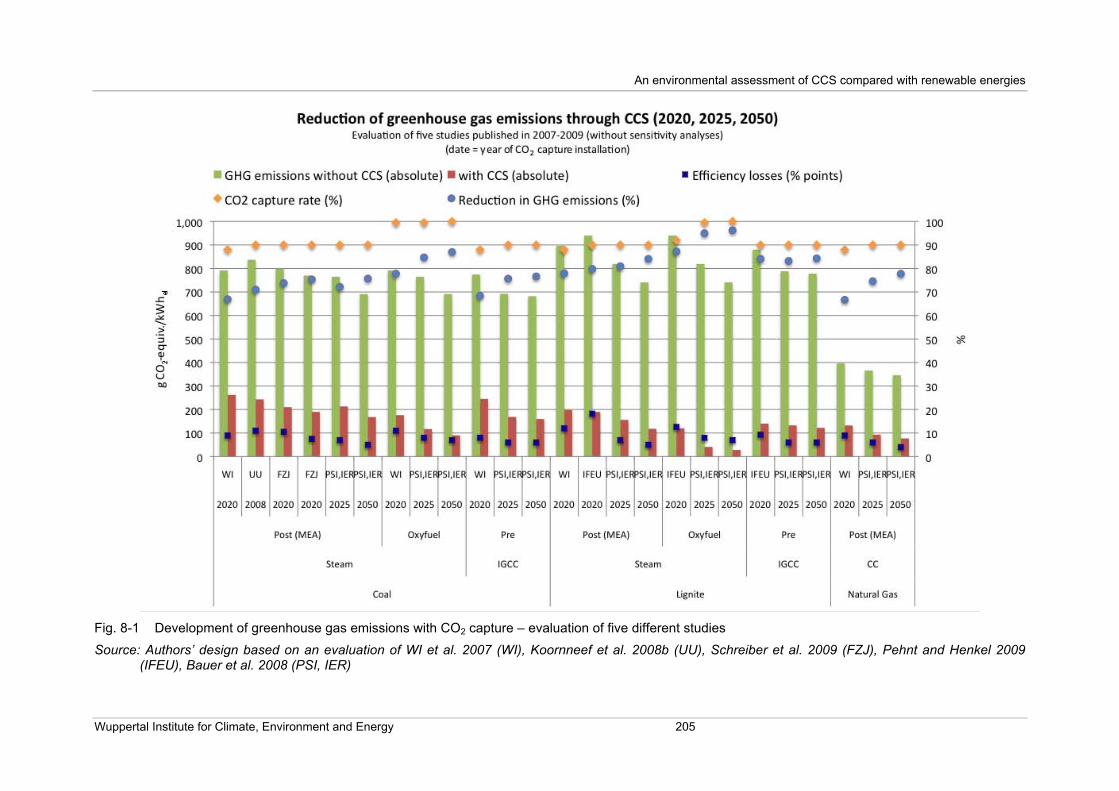
An environmental assessment of CCS compared with renewable energies
Wuppertal Institute for Climate, Environment and Energy 205
Fig. 8-1 Development of greenhouse gas emissions with CO2 capture – evaluation of five different studies
Source: Authors’ design based on an evaluation of WI et al. 2007 (WI), Koornneef et al. 2008b (UU), Schreiber et al. 2009 (FZJ), Pehnt and Henkel 2009 (IFEU), Bauer et al. 2008 (PSI, IER)

RECCS plus – Update and Expansion of the RECCS Study
206 Final Report
In Fig. 8-2, electricity generation from renewable energies is compared with CCS power
plants in 2020/2025 and 2050. The minimum and maximum values and the mean of all op-
tions considered are given. The range given for fossil fuel-fired power plants results from
combining steam power plants and IGCC from Tab. 8-3. For renewable energies, the range
stems from the minimum and maximum values presented in Tab. 8-2.
Fig. 8-2 Greenhouse gas emissions from fossil fuel-fired power plants with CCS in comparison with electricity from renewable energies (solar thermal power plants, photovoltaics and offshore wind (2020/2025 and 2050))
Source: Authors’ design
Even compared to CCS power plants, renewable energies create only a fraction of green-
house gas emissions (most of which originate from the construction of the plant). The chart
shows that in 2025, offshore wind creates only 5 to 8 per cent, solar thermal energy 11 to 18
per cent and photovoltaics 14 to 24 per cent of the emissions of CCS power plants. By 2050,
photovoltaics improve, in particular, releasing only 7 to 12 per cent of the emissions of CCS
power plants; offshore wind creates 9 to 15 per cent and solar thermal energy 13 to 23 per
cent.
8.4 Direct environmental impact outside LCA
Several environmental impacts cannot be evaluated using life cycle assessments. The con-
sumption of water and cooling water, for instance, is not included in the CML method. The
use of land, caused by the additional infrastructure installation and, in particular, increased
coal mining, is not taken into account (Koornneef et al. 2008b).
The risks that could occur due to the transportation and temporary storage of chemicals
(MEA) or the captured carbon dioxide were also neglected. These are subject to risk as-
sessment (Koornneef et al. 2008b).

An environmental assessment of CCS compared with renewable energies
Wuppertal Institute for Climate, Environment and Energy 207
The consequences of salt water being released offshore following the injection of CO2, dra-
matically increasing the local concentration of salt water, have also not yet been considered.
It would have to be examined whether this would directly affect the area around the point of
leakage or whether its rapid dilution with the sea water would mean that its impact was negli-
gible (see Utsira aside in Section 7.6.3). If CO2 is injected to enhance oil recovery, large
quantities of contaminated salt water would also be released into the oceans (Lindeberg et
al. 2009). Applied to onshore potentials, this argument is even more far-reaching: if it were
necessary to extract salt water on the same scale as CO2 is injected to keep the increase in
pressure under control in aquifers, it would be extremely difficult to utilise the onshore stor-
age capacity.
The spatial and long-term impact of the balanced emissions has not yet been considered in
any of the life cycle assessments. For example, SO2 and NOx emissions caused by the
transport of coal by sea, which have a considerable effect on the acidification and eutrophi-
cation category (Koornneef et al. 2008b), should be assessed differently to the same emis-
sions released straight from the power plant.
Furthermore, the extent to which amines, used in the CO2 scrubbing process, have an impact
on health and the environment has not yet been adequately clarified. The gaps in our know-
ledge on this subject are highlighted in a study carried out by the Norwegian environmental
organisation Bellona (Bellona 2009). Bellona proposes seven points that need to be clarified
before CCS technology is used commercially in order to minimise or, better still, to avoid al-
together, the risk of damage being caused to the environment by amines:
1. Close the gaps in our knowledge – determine the degradation routes, the degradation
quantity and the retention times of the decay products of amines in the atmosphere. De-
termination of toxic contamination thresholds for humans, also with regard to setting tol-
erance limits. Determination of the degree of ecotoxicology of amines on terrestrial and
aquatic ecosystems.
2. Development of amines with a low environmental impact – continuous improvement of
amine scrubbing by lower energy expenditure, fewer amine-related emissions and fewer
decay products than amines used previously.
3. Development of scrubbing methods with lowest possible residual emissions – the current
capture rate of 85 to 90 per cent using amines in power plants should be improved even
further.
4. Ensuring that the waste products from the amines are dealt with properly, because
enormous quantities of hazardous waste would be created if this method were used glo-
bally.
5. Development of alternative processes – research into other capture processes, such as
using membranes or chemical looping combustion, involving only minor losses of the
separating agent used (see also Chapter 3).
6. Entrenchment of binding regulations – once the gaps in the knowledge outlined above
have been closed, binding regulations for the operation of CCS power plants should be
devised to cause minimal harm to the environment.
RECCS plus – Update and Expansion of the RECCS Study
208 Final Report
7. Use of CCS demonstration programmes to clarify remaining questions regarding amine
scrubbing as the capture process in a CCS power plant, and its potential environmental
impact.
8.5 Indirect environmental impact of coal mining and social aspects
Coal mining is generally linked to drastic, extensive changes to the landscape. In most
cases, the consequences of such a restructuring of the landscape are a lowering of the water
table, contamination of the water by mine drainage and the creation of enormous slag heaps
that have a negative impact on groundwater supply for agriculture and the surrounding eco-
systems. In addition, enormous quantities of water are consumed to wash the coal and to
cool coal-fired power plants. In some areas, this has led to significant water shortages in riv-
ers and streams.
Due to the resettlement or displacement of the population, cultivable land is lost, homes and
entire village communities are destroyed, resulting in social and cultural problems. Often
residents are unwilling to leave voluntarily, and forced evictions occur, often with the threat or
use of violence, or even, in some extreme cases, murder.
Although the latter is not the case in Germany, resettlement causes considerable problems
here, too. In the region of Lusatia in Germany, more than 100 villages with a total of over
100,000 residents have been subject to (forced) eviction for coal mining (Tagesspiegel
2009). One of the last villages to fall victim to this process was Horno, a village of around 300
residents who lost their homes despite 25 years of constant fierce resistance. In western
Germany, around 7,000 people were resettled for the Garzweiler II mining project. Part of the
village community disappeared, and, even though a new housing estate with newly planted
gardens may seem aesthetically appealing, it will not be able to replace the sense of com-
munity and wildlife habitats, which usually take centuries to create (Welt online 2004). By
deploying CCS technology in the generation of power, this problem would be aggravated
further, because an 18 to 35 per cent increase in coal would be required (see Section 10.3).
In the mining process itself, sulphur, methane and dust emissions are released. Coal miners
are often directly exposed to such emissions, because there are no or only inadequate safety
precautions in many coal-producing countries. These emissions lead to acid rain and the
formation of smog. Workers are also at risk from gas and dust explosions, as well as from
flooding. In the regions affected by coal mining, increasing occurrences of respiratory dis-
eases and skin rashes are diagnosed among workers and local residents. Once mining is
abandoned, subsidence and collapses often occur, creating devastating damage to the exist-
ing infrastructure and the surrounding houses (Greenpeace 2008). When coal is combusted,
residuals are created containing significant concentrations of heavy metals, radioactive sub-
stances and other substances that are harmful to nature, soils and bodies of water.
Let us now move the focus to China, which is the world’s largest producer of coal. This coal
output is used to meet 75 per cent of the country’s electricity generation. Coal fires caused
by uncontrolled mining in China lead to an average of around 6,000 fatalities per year. These
fires are caused by the spontaneous combustion of coal when it comes into contact with air.
In China, 10 to 20 million tonnes of coal are combusted annually, endangering workers and

An environmental assessment of CCS compared with renewable energies
Wuppertal Institute for Climate, Environment and Energy 209
local residents by the heat and emissions generated, not to mention the global damage to
the climate caused by the release of CO2 (Scinexx 2008).
Most of the world’s coal fires occur in India, resulting in rising temperatures and toxic dis-
charge into water, soil and the air. The flue gases from coal fires contain carbon monoxide,
carbon dioxide, sulphur dioxide and nitrogen oxides which, together with the ever-present
carbon dust, cause a variety of lung and skin diseases. The once densely populated coal-
mining areas of Jharia, Ranigani and Singareni, for instance, have now degenerated into
wasteland. As long as there is a supply of oxygen, these coal fires are considered to be inex-
tinguishable (Greenpeace 2008).
8.6 Possible impact of CO2 storage on subterranean ecosystems
It is not yet apparent whether the transportation of large quantities of carbon dioxide will have
a biogeochemical impact on the microbial biota in deep rock formations. Drilling to depths of
3.5 km has revealed bacteria, viruses and fungi. These microbes can be found in quantities
of up to one hundred million per gram of sediment or ground water in tiny cracks and pores in
the rock (Scinexx 2004).
This field of research is very much in its infancy. Many of these types of bacteria found in
deep rock formations are completely unknown. The research into their role within this eco-
system has hardly begun. It is known, however, that the metabolism of some better-known
types of bacteria changes chemical compounds in deep rock. Some gain their energy by
converting manganese, sulphur, nitrogen, phosphor, iron and carbon compounds (Scinexx
2004).
Several types of bacteria can transform carbon dioxide into methane. Whether these bacteria
could perhaps be used to generate energy is currently the subject of a project in the GEO-
TECHNOLOGIES – Recobio II research programme “Investigation of the biogeochemical
transformation of injected CO2 in the deep subsurface” (see also Section 2.1.1). In this pro-
ject, the significance of reduction by autotrophic bacteria for the sequestration of carbon diox-
ide is being explored, particularly taking into account the processes that occur in methano-
genesis and acetogenesis. In addition, the impact of impurities in the carbon dioxide of these
biogeochemical processes will be determined. The results will be presented once the project
has been completed in spring 2011.
During a pilot storage test in a saline aquifer (Frio Brine) near Houston, Texas, research re-
sults on the mobilisation of metals and organic compounds before, during and after the injec-
tion of CO2 were compiled by (Kharaka et al. 2009) between 2004 and 2008. It was shown
that the injection of CO2 led to considerable changes in the chemical and isotopic compo-
sition, including a dramatic shift of the pH value from 6.3 to 3.0. In addition, iron, manganese,
lead and aromatic hydrocarbons reacted to the increased concentration of CO2, and their
concentrations in the formation water rose sharply.
8.7 Conclusions from the environmental assessment
In the RECCS study, life cycle assessments were carried out for the first time for the three
conventional capture routes. These LCAs were then compared with selected renewable en-
ergy plants and other progressive concepts for the use of fossil fuels. The individual pro-

RECCS plus – Update and Expansion of the RECCS Study
210 Final Report
cesses involved in the capture of CO2 were modelled in detail for post-combustion plants. For
pre-combustion and oxyfuel, however, only the additional energy consumption is included.
No new life cycle assessments were generated in this update. However, several new com-
prehensive life cycle assessments covering all prevalent capture routes applied to lignite-,
hard coal- and natural gas-fired power plants have been presented by a number of institu-
tions. Most of these studies were compiled in 2008. The selected studies, however, were
restricted to those in which life cycle assessments of the entire CCS chain were created,
following the respective ISO standards for life cycle assessments. An analysis was made of
the precision with which the individual steps in the process – capture, compression, transport
and storage – were modelled and also of what assumptions were made in the process.
The findings of the RECCS study were principally confirmed in the newer studies, and devel-
oped significantly. If the entire process chain, including the upstream chains of substances
and energies used, is considered, the greenhouse gas emissions from CCS power plants
operational in 2020 will only be reduced in total by around 68 to 87 per cent (in exceptional
cases up to 95 per cent).
However, other environmental impacts should be considered in addition to greenhouse gas
emissions. The higher energy consumption required in all of the processes and the materials
used in the capture processes can be perceived in direct proportion to the various impact
categories of the life cycle assessment. This factor was only modelled for the post-
combustion process in the RECCS study. More recent studies, however, also present find-
ings for pre-combustion (for both lignite and hard coal) and for oxyfuel. Amongst other things,
these studies have explored summer smog, eutrophication, soil and water acidification, ma-
rine ecotoxicity and particle emission. Depending on the assumptions made in the studies,
the various interactions in the capture processes lead to many trade-offs in the individual
environmental impact categories. In some studies, all emissions increase in accordance with
the additional energy consumption. Other studies, however, model trade-offs that arise from
the simultaneous reduction of other emissions in the course of the CO2 capture process.
As in the RECCS study, most of the studies conclude that for the post-combustion process
increases are observed with virtually all of the environmental impacts (+26 to 250 per cent).
The individual processes cannot yet be modelled in detail for pre-combustion and oxyfuel;
rough estimates for IGCC show 20 to 66 per cent increases for all environmental impacts
and 22 to 80 per cent decreases in all environmental impacts with oxyfuel.
The proportion related to the manufacture of the infrastructure, i.e. the plant required to cap-
ture, transport and store the gas, is analysed as being very low (0.3 to 2.6 per cent) in all of
the studies. Transportation of the CO2 is modelled more or less uniformly, even if assump-
tions regarding the transport distance vary. Leakages of CO2 in the compression and trans-
portation processes were only partially modelled. Leakages at the CO2 storage site were
neglected by all studies. It is assumed in some studies that the storage site would otherwise
not have been approved. Other studies assume that CO2 would indeed be released, albeit
with a long delay, which would be significantly better for the environment than the current
high rates of emission. The injection is either not modelled at all, or it is modelled only for the
purpose of power requirements or for the required infrastructure.
The largely different assumptions for the CCS chain, the time of use of CCS, the type of re-
ference power plants, the selection of various parameters and the heterogeneous choice of

An environmental assessment of CCS compared with renewable energies
Wuppertal Institute for Climate, Environment and Energy 211
environmental impact categories are particularly conspicuous. As in many other life cycle
assessments, this reveals a need for action to harmonise life cycle assessments for CCS
technology. Together with the German “Network on Life Cycle Inventory Data”, it is proposed
that the aim of harmonising life cycle assessments should be to develop standard guidelines
and to then create standard life cycle assessments for CCS reference plants based on these
guidelines.
The recommendations of some authors to install a comprehensive monitoring programme for
the first CCS power plants should not be restricted just to life cycle assessments. Such a
programme would be important for gaining information about the actual emissions caused or
reduced due to the capture of CO2. Such information would considerably improve our under-
standing of the individual chemical processes, and how they should be modelled.
Even compared to CCS power plants, renewable energies create only a fraction of green-
house gas emissions. In 2025 (2050), it is estimated that offshore wind will create only 5 to 8
(9 to 15) per cent, solar thermal energy 11 to 18 (13 to 23) per cent and photovoltaics 14 to
24 (7 to 12) per cent of the emissions of CCS power plants. All renewable energies will have
improved in absolute terms by 2050, but show higher percentages, with the exception of
photovoltaics, because CCS technologies will also improve.
Further aspects are also neglected in life cycle assessment. These include the fundamental,
extensive changes to the landscape caused by coal mining, the consequences of a decline in
the ground water table, water contamination by water from mines and the creation of enor-
mous slag heaps that have a negative impact on groundwater supply for agriculture and the
surrounding ecosystems. The resettlement or displacement of the population results in the
loss of agricultural land and homes. Entire village communities are destroyed, leading to so-
cial and cultural problems.
It is not yet apparent whether the transfer of large quantities of carbon dioxide will have a
biogeochemical impact on the microbial biota in deep rock formations. Drilling to depths of
3.5 km has revealed bacteria, viruses and fungi. Many of the types of bacteria found in these
deep rock formations are completely unknown. Their “function” within this ecosystem has not
nearly been researched to a sufficient extent.

RECCS plus – Update and Expansion of the RECCS Study
212 Final Report

Economic comparison of CCS power plants with renewable energy technologies
Wuppertal Institute for Climate, Environment and Energy 213
9 Economic comparison of CCS power plants with renewable
energy technologies
9.1 Update on electricity generating costs from CCS power plants and re-
newable energies
9.1.1 Future price trajectories for fossil fuels and CO2 emission permits
Updated energy price trajectories are the most influential factor in recalculating electricity
generating costs. The RECCS study focused on the situation prior to the oil price hike, as
well as the increases in prices of natural gas and hard coal. In the RECCS study, a low price
trajectory and a moderately higher “DLR 2004” price trajectory were used. In the RECCS
study, the impact of prices for CO2 emission permits was addressed in the form of a “CO2
penalty”. Taken together, these factors indicate the fuel-specific costs of using (combusting)
fossil fuels, or, in simpler terms, “fuel prices (with and without penalties)”.
The following recalculation is based on the cost and price calculations from the Lead Scen-
ario 2008 (BMU 2008a). It covers a range of trajectories for future “energy prices” – a term
which can be misleading, as it actually also includes the cost of combusting energy sources,
determined by the prices of CO2 permits. The lower limit of the price trajectories in the recal-
culation corresponds with trajectories that in 2005 were considered “high price scenarios”.
The energy price trajectories can generally be characterised as follows (see also Fig. 9-1):
• Price trajectory C (“very low”): The lowest variant – the representative development –
adopts the values of the “oil price variant”, used by EWI and Prognos in their Energy
Report IV, adding a “high price variant” (EWI and Prognos 2006). Even this variant,
however, greatly underestimated the development of the oil price. Since it is assumed in
this variant that crude oil will not rise above a medium-term price level of $200550-60/b by
2020/2030, it was given here, and in the Lead Scenario, as a “very low” scenario.
Whereas natural gas prices remain virtually constant, a subtle increase in the price of
hard coal is perceptible.
• Price trajectory B (“moderate”): The moderate variant takes into account a “moderate
increase” in the prices of fossil fuels, and resembles the high price trajectory in the World
Energy Outlook 2007 (IEA 2007). Based on the 2007 average, it was then projected for-
wards into the future. From today’s perspective, however, it too probably underestimated
the future rise in prices (BMU 2008a).
• Price trajectory A (“considerable”): For this reason, an upper variant with a “consider-
able increase” was devised, slightly above the high price trajectory in (IEA 2007). On the
basis of real prices, it constitutes a doubling of the natural gas price and a more than
three-fold increase in the price of hard coal.
The future price ratios of crude oil to natural gas and of crude oil to hard coal, and the longer-
term development of the euro/dollar exchange rate are also taken from the Lead Scenario
2008. These rates were taken from policy scenarios (UBA 2007, Horn and Diekmann 2007)
and projected ahead to 2050. It was assumed in the policy scenarios “that hard coal will not

RECCS plus – Update and Expansion of the RECCS Study
214 Final Report
be decoupled from the price increase of crude oil but, on the contrary, will increase by 2010
to around 40 per cent of the thermal equivalent price of oil and will remain at this level. Natu-
ral gas will also adopt the price increases of crude oil more strongly than in the past, and will
peak at up to 85 per cent of the respective price of crude oil.” In a departure from considering
individual costs, a feasibility principle was pursued for both natural gas and hard coal.71
Fig. 9-1 shows the range for the three scenarios (real values in 2005 prices). The oil price
trend is not shown here because it is not directly used in this study. The price trajectory for
lignite, however, is included. Since lignite is mined in Germany, its price increases only mar-
ginally. It is relevant, however, as soon as price penalties for CO2 allowances are considered.
The values shown in the following graphs can be found in the Appendix in Tab. 13-1.
Fig. 9-1 Prices for natural gas, hard coal and lignite at power plant for price trajectories A, B and C (without CO2 penalty)
Source: Based on BMU 2008a
In addition to the increase in actual fuel prices, the price trends for CO2 allowances must also
be taken into account. The prices chosen are taken from the Lead Scenario which, in turn,
were based on policy scenarios (Horn and Diekmann 2007):
• Price trajectory C (“very low”): In this scenario, CO2 penalties increase from ! 15/t in
2010 to ! 20/t in 2020 and to no more than ! 28/t in 2050. As such, they represent the
lower limit of expected future prices.
• Price trajectory B (“moderate”): In the moderate scenario, the prices of ! 20/t (2010),
! 30/t (2020) and ! 45/t (2050) are mid-range.
71 This means that hard coal prices no longer follow actual costs, but feasible costs that could be achieved
compared with an oil price development.
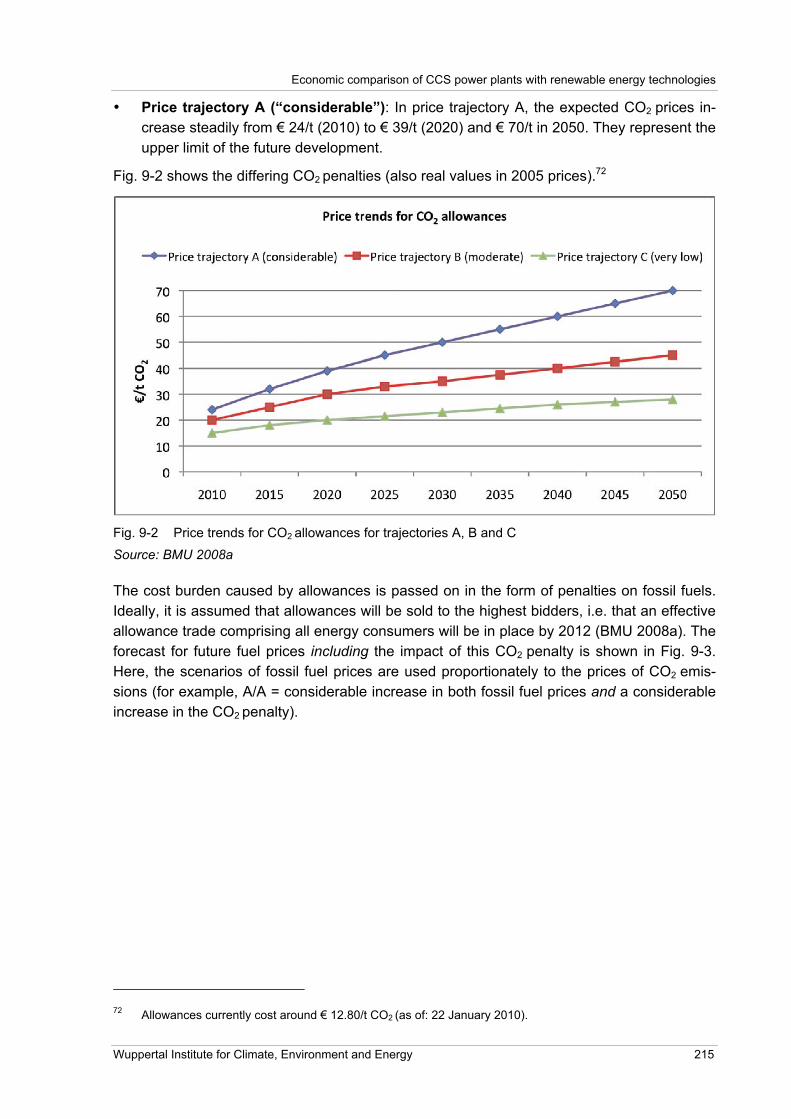
Economic comparison of CCS power plants with renewable energy technologies
Wuppertal Institute for Climate, Environment and Energy 215
• Price trajectory A (“considerable”): In price trajectory A, the expected CO2 prices in-
crease steadily from ! 24/t (2010) to ! 39/t (2020) and ! 70/t in 2050. They represent the
upper limit of the future development.
Fig. 9-2 shows the differing CO2 penalties (also real values in 2005 prices).72
Fig. 9-2 Price trends for CO2 allowances for trajectories A, B and C
Source: BMU 2008a
The cost burden caused by allowances is passed on in the form of penalties on fossil fuels.
Ideally, it is assumed that allowances will be sold to the highest bidders, i.e. that an effective
allowance trade comprising all energy consumers will be in place by 2012 (BMU 2008a). The
forecast for future fuel prices including the impact of this CO2 penalty is shown in Fig. 9-3.
Here, the scenarios of fossil fuel prices are used proportionately to the prices of CO2 emis-
sions (for example, A/A = considerable increase in both fossil fuel prices and a considerable
increase in the CO2 penalty).
72 Allowances currently cost around ! 12.80/t CO2 (as of: 22 January 2010).
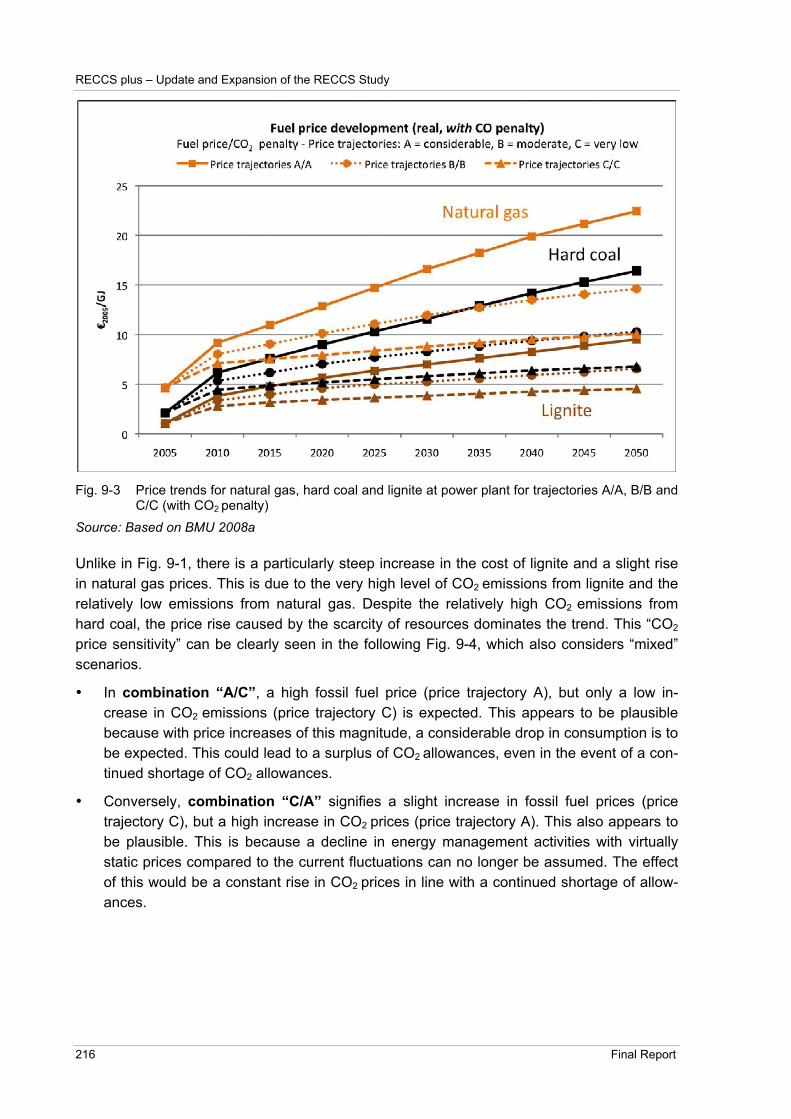
RECCS plus – Update and Expansion of the RECCS Study
216 Final Report
Fig. 9-3 Price trends for natural gas, hard coal and lignite at power plant for trajectories A/A, B/B and C/C (with CO2 penalty)
Source: Based on BMU 2008a
Unlike in Fig. 9-1, there is a particularly steep increase in the cost of lignite and a slight rise
in natural gas prices. This is due to the very high level of CO2 emissions from lignite and the
relatively low emissions from natural gas. Despite the relatively high CO2 emissions from
hard coal, the price rise caused by the scarcity of resources dominates the trend. This “CO2
price sensitivity” can be clearly seen in the following Fig. 9-4, which also considers “mixed”
scenarios.
• In combination “A/C”, a high fossil fuel price (price trajectory A), but only a low in-
crease in CO2 emissions (price trajectory C) is expected. This appears to be plausible
because with price increases of this magnitude, a considerable drop in consumption is to
be expected. This could lead to a surplus of CO2 allowances, even in the event of a con-
tinued shortage of CO2 allowances.
• Conversely, combination “C/A” signifies a slight increase in fossil fuel prices (price
trajectory C), but a high increase in CO2 prices (price trajectory A). This also appears to
be plausible. This is because a decline in energy management activities with virtually
static prices compared to the current fluctuations can no longer be assumed. The effect
of this would be a constant rise in CO2 prices in line with a continued shortage of allow-
ances.
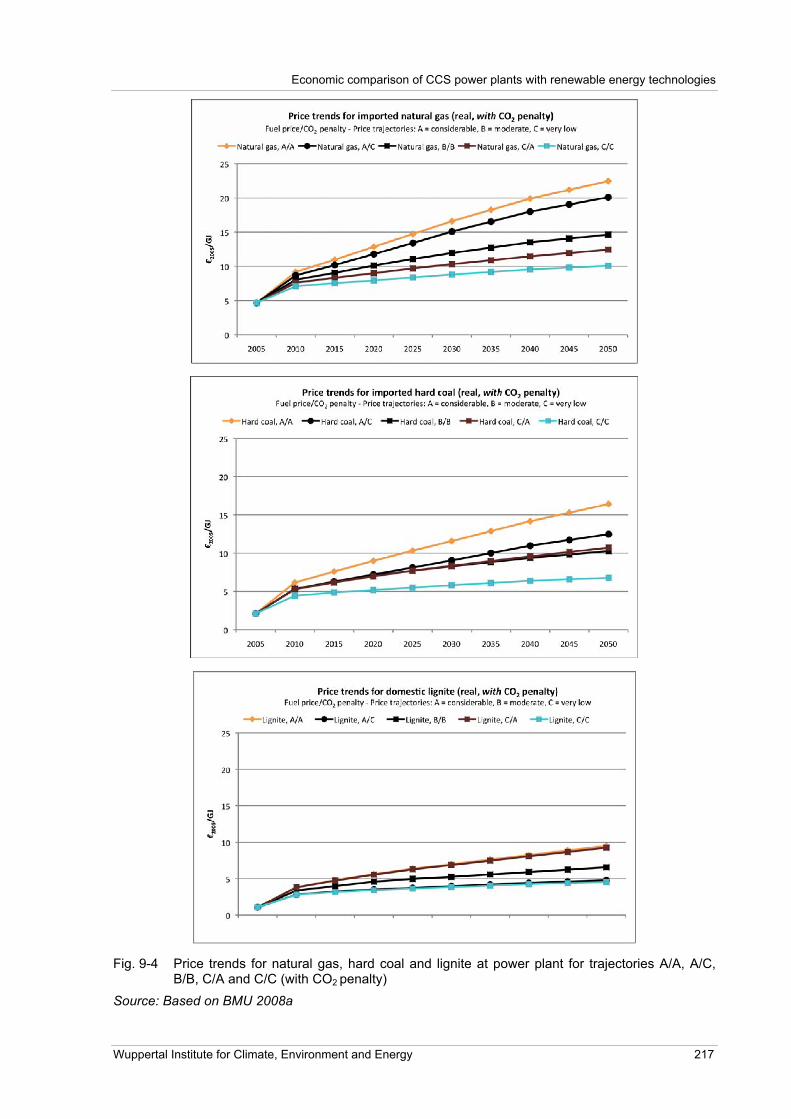
Economic comparison of CCS power plants with renewable energy technologies
Wuppertal Institute for Climate, Environment and Energy 217
Fig. 9-4 Price trends for natural gas, hard coal and lignite at power plant for trajectories A/A, A/C, B/B, C/A and C/C (with CO2 penalty)
Source: Based on BMU 2008a

RECCS plus – Update and Expansion of the RECCS Study
218 Final Report
Fig. 9-4 clearly shows that with natural gas, the scarcity of resources is responsible for the
inflation, and that CO2 prices have only a minor impact. Conversely, lignite is highly sensitive
to CO2 fluctuations, due to the relatively constant price for its extraction and the high CO2
emissions. The scarcity of resources is also the main influence with hard coal, albeit not to
the same extent as with natural gas. For natural gas and hard coal, these two combinations
limit the ranges generated (upwards and downwards); for lignite they reverse the ratio, since
only the second inflater (CO2 prices) is relevant here: scenario C/A is on a par with high price
scenario A/A, and scenario A/C with low price scenario C/C.
9.1.2 Cost assumptions and other parameters of CCS power plants and their refer-
ence power plants
Fossil fuel-fired power plants without CCS
The electricity generating costs of a fossil fuel-fired power plant are calculated using the for-
mula
where
and
EGC = electricity generating costs, [EGC] = EUR/kWhel
Inv = specific investment expenditure, [Kinv] = EUR/kWel
af = annuity factor, [af] = %/a
I = real interest rate, [interest] = %
n = depreciation period, [n] = a
CO&M = specific operating and maintenance costs, [CO&M] = EUR/kWel
Cfuel = specific fuel costs (including CO2 penalty), [CFuel] = EUR/kWhel
capacity = full load hours, [operating life] = h/a
All cost data in this report refer to 2005.
• Investment expenditure: The total amount invested is allocated to individual years on
an annuity basis. Both the expected real interest rate and the depreciation period are in-
cluded in the annuity formula. In this study, a 6 per cent per annum (real) interest rate
and a 25-year depreciation period are assumed, producing an annuity factor of af = 7.8
per cent per annum. The expenditure for one year is therefore related to a kilowatt hour,

Economic comparison of CCS power plants with renewable energy technologies
Wuppertal Institute for Climate, Environment and Energy 219
using the number of annual full load hours. The investment expenditure for newly built
power plants is taken from (BMU 2008a)73.
• Operating and maintenance costs: These costs describe the auxiliary and operating
materials required, as well as annual maintenance costs. They are also allocated using
the number of annual full load hours. The data is taken from the RECCS study.
• Fuel costs: The fuel costs were already determined in Section 9.1.1. Since there they
apply to primary energy (EUR/GJth), they are converted to electricity generated
(EUR/kWhel) via the average power plant efficiency.
• CO2 penalty: The cost of CO2 allowances (EUR/t CO2) is allocated to the primary energy
via the calorific value of the energy source (GJth/t). This was already added to the fuel
costs in Section 9.1.1.
• Full load hours: Both the investment expenditure and the operating and maintenance
costs are allocated to a kilowatt hour generated via the number of annual full load hours
(see below).
Fossil fuel-fired power plants with CCS
A penalty is imposed on the investment expenditure and operating and maintenance costs to
calculate the electricity generating costs of CCS power plants. The figure for the lower de-
gree of utilisation is also included in the fuel costs. Finally, a penalty is imposed for the trans-
port of CO2 and storage costs. However, usage fees for storage sites (“storage fee”), as
called for by several federal states and (SRU 2009a), have yet to be included. Tab. 9-1 pro-
vides an overview of all assumptions for CCS power plants and their reference power plants.
The penalties on the investment expenditure are adopted more or less directly from the
RECCS study. This seems justifiable because no commercial power plant has been built in
the past three years, just various pilot and demonstration plants. The data from the original
study are based on an extensive analysis of the literature, and the values used in it are con-
verted into euros. Data was supplied for 2020 and 2040. The year 2020 was assumed to be
the earliest time when commercial CCS power plants would be ready for operation. For this
reason, this data describes “market-ready” power plants. The data referring to 2040 de-
scribes “mature” CCS power plants that have benefited from a learning curve. For this, the
cost reductions derived in RECCS are based on learning rates according to (Rubin 2004)
(reduction of typical CCS components by 11 to 13 per cent with a doubling of installed ca-
pacity).
Besides the additional expenditure, the degrees of utilisation and the anticipated reductions
due to CO2 capture are taken directly from the RECCS study. The assumed degrees of utili-
sation represent a situation in 2020 (projected on to 2040) for newly built power plants, and
therefore already assume a considerably improved conversion compared with the current
situation.
73 The degrees of utilisation of lignite steam power plants were slightly higher (closing at 50 instead of 47.5 per cent in 2050). This is because, according to information provided by companies, the future use of pre-dried lignite, which is considerably more efficient from the overall efficiency perspective, will become standard practice.
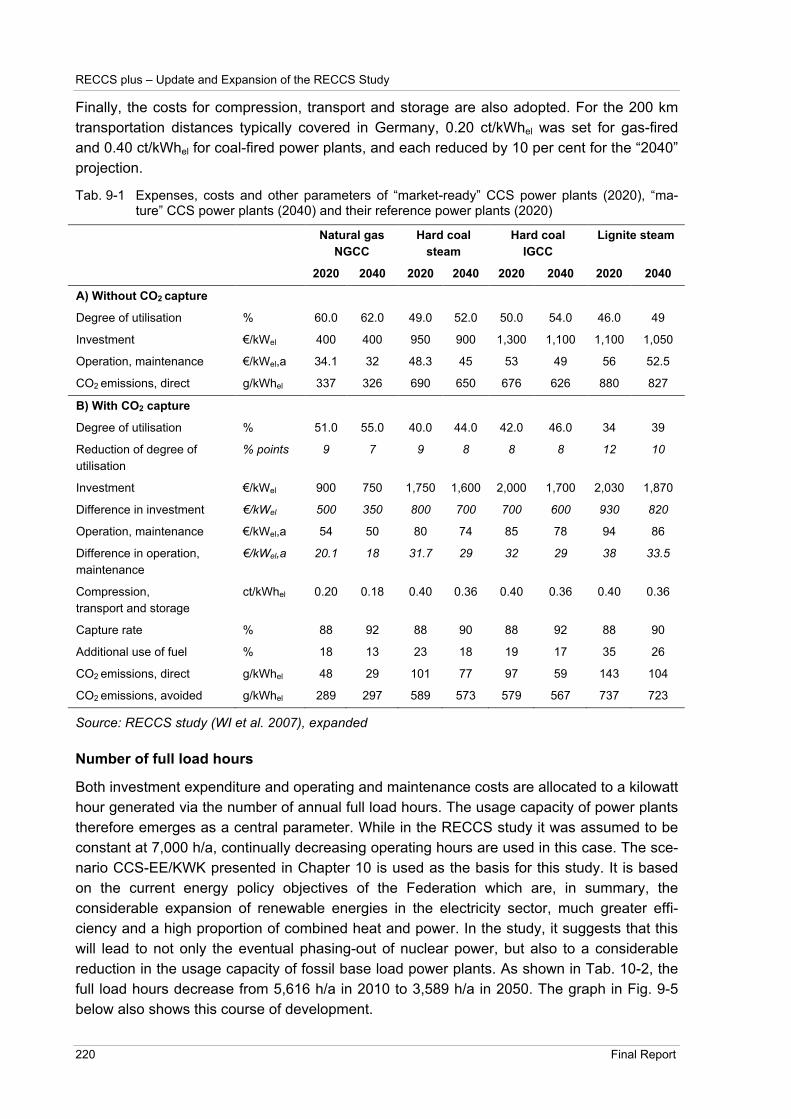
RECCS plus – Update and Expansion of the RECCS Study
220 Final Report
Finally, the costs for compression, transport and storage are also adopted. For the 200 km
transportation distances typically covered in Germany, 0.20 ct/kWhel was set for gas-fired
and 0.40 ct/kWhel for coal-fired power plants, and each reduced by 10 per cent for the “2040”
projection.
Tab. 9-1 Expenses, costs and other parameters of “market-ready” CCS power plants (2020), “ma-ture” CCS power plants (2040) and their reference power plants (2020)
Natural gas
NGCC
Hard coal
steam
Hard coal
IGCC
Lignite steam
2020 2040 2020 2040 2020 2040 2020 2040
A) Without CO2 capture
Degree of utilisation % 60.0 62.0 49.0 52.0 50.0 54.0 46.0 49
Investment !/kWel 400 400 950 900 1,300 1,100 1,100 1,050
Operation, maintenance !/kWel,a 34.1 32 48.3 45 53 49 56 52.5
CO2 emissions, direct g/kWhel 337 326 690 650 676 626 880 827
B) With CO2 capture
Degree of utilisation % 51.0 55.0 40.0 44.0 42.0 46.0 34 39
Reduction of degree of
utilisation
% points 9 7 9 8 8 8 12 10
Investment !/kWel 900 750 1,750 1,600 2,000 1,700 2,030 1,870
Difference in investment !/kWel 500 350 800 700 700 600 930 820
Operation, maintenance !/kWel,a 54 50 80 74 85 78 94 86
Difference in operation,
maintenance
!/kWel,a 20.1 18 31.7 29 32 29 38 33.5
Compression,
transport and storage
ct/kWhel 0.20 0.18 0.40 0.36 0.40 0.36 0.40 0.36
Capture rate % 88 92 88 90 88 92 88 90
Additional use of fuel % 18 13 23 18 19 17 35 26
CO2 emissions, direct g/kWhel 48 29 101 77 97 59 143 104
CO2 emissions, avoided g/kWhel 289 297 589 573 579 567 737 723
Source: RECCS study (WI et al. 2007), expanded
Number of full load hours
Both investment expenditure and operating and maintenance costs are allocated to a kilowatt
hour generated via the number of annual full load hours. The usage capacity of power plants
therefore emerges as a central parameter. While in the RECCS study it was assumed to be
constant at 7,000 h/a, continually decreasing operating hours are used in this case. The sce-
nario CCS-EE/KWK presented in Chapter 10 is used as the basis for this study. It is based
on the current energy policy objectives of the Federation which are, in summary, the
considerable expansion of renewable energies in the electricity sector, much greater effi-
ciency and a high proportion of combined heat and power. In the study, it suggests that this
will lead to not only the eventual phasing-out of nuclear power, but also to a considerable
reduction in the usage capacity of fossil base load power plants. As shown in Tab. 10-2, the
full load hours decrease from 5,616 h/a in 2010 to 3,589 h/a in 2050. The graph in Fig. 9-5
below also shows this course of development.

Economic comparison of CCS power plants with renewable energy technologies
Wuppertal Institute for Climate, Environment and Energy 221
Fig. 9-5 Decline in the full load hours of fossil fuel-fired power plants in the scenario family CCS-EE/KWK (zero point is suppressed)
Source: Authors’ design based on calculations in Chapter 10
A 50 per cent reduction in the full load hours compared with the situation in 2000 leads to a
two-fold increase in kilowatt hour-related investment expenditure and operating and mainte-
nance costs in 2050. On the other hand, the electricity generating costs are dominated by the
development of fuel prices and the CO2 penalties, as will be seen in the following section.
The assumption that the full load hours will decline therefore leads to only a slight increase in
the total electricity generating costs by 2050.
9.1.3 Calculation of electricity generating costs for CCS power plants
The following graphs (and Tab. 13-2 in the Appendix) show the development of electricity
generating costs using the example of two “moderate” scenario combinations:
• Price scenario A/C: considerable increase in fossil fuel prices / slight increase in prices
for CO2 penalties
• Price scenario C/A: very slight increase in fossil fuel prices / considerable increase in
prices for CO2 penalties.
As explained above, these two combinations illustrate realistic ratios of energy prices to CO2
prices. Due to their different capital requirements and the CO2 intensity of the fuels and their
power plants, however, they have a different impact on the development of electricity gener-
ating costs.
In addition, the costs of non-CCS power plants are compared to the potential trends for CCS
power plants. Natural gas (NGCC), hard coal (steam), hard coal (IGCC) and lignite (steam)
power plants are considered.

RECCS plus – Update and Expansion of the RECCS Study
222 Final Report
Price scenario A/C
Fig. 9-6 and Fig. 9-7 compare the composition of electricity generating costs for fossil fuel-
fired power plants both with and without CCS in scenario A/C.
• Power plants without CCS
With the exception of lignite, the electricity generating costs of fossil fuel-fired power
plants are already largely determined by the cost of the fuel. Although natural gas power
plants have the highest fuel costs, they involve low investment expenditure and, due to
their lower CO2 content, lower CO2 costs. In comparison, hard coal-fired power plants
have higher investment expenditure, but save on fuel and pay higher CO2 penalties. Al-
though lignite power plants have the lowest fuel costs (see above), they have higher CO2
penalties due to their higher CO2 emissions.
The rising fuel and CO2 costs are explained by the scenario assumptions. Conversely,
investment expenditure and operating costs are assumed to fall initially, due to the in-
stalled capacity. In terms of the power output, however, they increase because the full
load hours between 2010 and 2050 are halved (Fig. 9-6).
Fig. 9-6 Composition of electricity generating costs (new plants) for natural gas (combined cycle), hard coal (steam), hard coal (IGCC) and lignite (steam) power plants (price trajectory A/C) (without CCS)
Source: Authors’ design
• Power plants with CCS
Different impacts are yielded when we calculate the electricity generating costs of CCS
power plants: in general, the investment expenditure and fuel costs rise, whereas the
CO2 costs specifically (per kilowatt hour) decline. The latter, however, cannot be reduced
to the same extent as the CO2 capture rate, due to the additional consumption of primary
energy. This means that, despite a capture rate of 88 to 92 per cent net, CO2 emissions
can be reduced by only 70 to 80 per cent (see Chapter 8).

Economic comparison of CCS power plants with renewable energy technologies
Wuppertal Institute for Climate, Environment and Energy 223
The extent of this impact varies (Fig. 9-7): with natural gas-fired power plants with low
investment expenditure but high fuel costs, the electricity generating costs in a high price
scenario increase at a disproportionately high rate. With hard coal-fired power plants, the
two components are balanced out, whereas with lignite-fired power plants even a high
price scenario has only a minor impact. Due to the simultaneously assumed low CO2
penalties, lignite continues to be favoured.
Fig. 9-7 Composition of electricity generating costs (new plants) for natural gas (combined cycle), hard coal (steam), hard coal (IGCC) and lignite (steam) power plants (price trajectory A/C) (with CCS)
Source: Authors’ design
If we now compare power plants with and without CCS, the following cost increases arise in
the period from 2020 to 2050 due to the CCS chain (including transport and storage):
• Natural gas (NGCC): between 1.95 and 2.24 ct/kWhel
• Hard coal (steam): between 2.02 and 2.22 ct/kWhel
• Hard coal (IGCC): between 1.73 and 2.73 ct/kWhel
• Lignite (steam): between 1.24 and 1.50 ct/kWhel
Tab. 9-2 shows the differential costs and resulting CO2 avoidance costs for 2020 and 2040.

RECCS plus – Update and Expansion of the RECCS Study
224 Final Report
Tab. 9-2 Differential costs of electricity generating costs and CO2 avoidance costs (new plants) for natural gas (combined cycle), hard coal (steam), hard coal (IGCC) and lignite (steam) power plants (price trajectory A/C) (with/without CCS)
Natural gas
NGCC
Hard coal
steam
Hard coal
IGCC
Lignite steam
2020 2040 2020 2040 2020 2040 2020 2040
A) Without CO2 capture
Electricity generating costs ct/kWhel 8.40 12.05 7.78 10.52 8.32 10.74 5.62 6.66
CO2 emissions, direct g/kWhel 337 326 690 650 676 626 880 827
B) With CO2 capture
Electricity generating costs ct/kWhel 10.35 13.83 9.80 12.57 10.05 12.56 7.11 7.90
Difference in cost ct/kWhel 1.95 1.78 2.02 2.04 1.73 1.82 1.49 1.24
CO2 emissions, direct g/kWhel 48 29 101 77 97 59 143 104
CO2 emissions, avoided g/kWhel 289 297 589 573 579 567 737 723
CO2 avoidance costs !/t CO2 67 63 34 36 30 33 20 17
Source: Authors’ design
Price scenario C/A:
In contrast to the above scenario, Fig. 9-8 and Fig. 9-9 compare the elements of electricity
generating costs in the case of very low energy prices, but high CO2 penalties.
• Power plants without CCS
Fuel costs continue to strongly influence natural gas power plants, whereas coal-fired
power plants are dominated by CO2 costs. With lignite power plants, in particular, CO2
costs comprise at least half of the electricity generating costs. In accordance with the
scenario assumptions, the fuel costs are considerably lower throughout than in the A/C
scenario.
• Power plants with CCS
The situation of CCS power plants in scenario C/A contrasts with that in scenario A/C
(Fig. 9-9). CO2 emissions are reduced as sharply as those in scenario A/C. However,
due to the high CO2 penalties there is a considerable reduction in the electricity generat-
ing costs for CCS power plants. On the other hand, the energy costs rise only slightly
because of the low price scenario. Although they are generally higher than for power
plants without CCS, due to the high efficiency losses, the decrease in CO2 costs are in-
creasingly less able to compensate for this beyond 2020.

Economic comparison of CCS power plants with renewable energy technologies
Wuppertal Institute for Climate, Environment and Energy 225
Fig. 9-8 Composition of electricity generating costs (new plants) for natural gas (combined cycle), hard coal (steam), hard coal (IGCC) and lignite (steam) power plants (price trajectory C/A) (without CCS)
Source: Authors’ design
Fig. 9-9 Composition of electricity generating costs (new plants) for natural gas (combined cycle), hard coal (steam), hard coal (IGCC) and lignite (steam) power plants (price trajectory C/A) (with CCS)
Source: Authors’ design
This leads to a gradual alignment of the costs for plants with and without CCS, ultimately
making CCS power plants cheaper than their reference plants. As is shown by the negative
differential costs in Fig. 9-12, this process begins shortly after 2020 for lignite, between 2030

RECCS plus – Update and Expansion of the RECCS Study
226 Final Report
and 2040 for hard coal, and shortly after 2040 for natural gas. In 2050, lignite power plants
with CCS have a considerable advantage (1.6 ct/kWhel) over the reference variant. In sum-
mary, the CCS chain leads to the following cost increases or savings:
• Natural gas (NGCC): between 0.99 and 0 ct/kWhel
• Hard coal (steam): between 0.57 and -0.85 ct/kWhel
• Hard coal (IGCC): between 0.41 and -0.62 ct/kWhel
• Lignite (steam): between 0.07 and -1.62 ct/kWhel
Tab. 9-3, in turn, shows the differential costs and resulting CO2 avoidance costs for 2020 and
2040.
Tab. 9-3 Differential costs of electricity generating costs and CO2 avoidance costs (new plants) for natural gas (combined cycle), hard coal (steam), hard coal (IGCC) and lignite (steam) power plants (price trajectory C/A) (with/without CCS)
Natural gas
NGCC
Hard coal
steam
Hard coal
IGCC
Lignite steam
2020 2040 2020 2040 2020 2040 2020 2040
A) Without CO2 capture
Electricity generating costs ct/kWhel 6.72 8.25 7.6 9.56 8.15 9.81 7.23 9.34
CO2 emissions, direct g/kWhel 337 326 690 650 676 626 880 827
B) With CO2 capture
Electricity generating costs ct/kWhel 7.71 8.40 8.17 8.71 8.50 9.19 7.3 8.8
Difference in cost ct/kWhel 0.99 0.15 0.57 -0.51 0.35 -0.62 0.07 -1.52
CO2 emissions, direct g/kWhel 48 29 101 77 97 59 143 104
CO2 emissions, avoided g/kWhel 289 297 589 573 579 567 737 723
CO2 avoidance costs !/t CO2 34 5 10 -9 6 -11 1 -17
Source: Authors’ design
9.1.4 Electricity generating costs of renewable energies
The electricity generating costs of CCS power plants are compared with renewable energies
that generate power. This is a climate protection option that, unlike CCS, has already shown
significant success in Germany. In 2007, for example, the share of renewables in electricity
generation in Germany was 14.2 per cent, leading to the avoidance of 66 million tonnes of
CO274 (UBA 2009b). The question is, however, how this development will progress in the
future, and whether renewable energies represent a real alternative to CCS in terms of cost.
To resolve this, we need to consider their long-term development, rather than the actual
situation; otherwise distorted results would be produced.
The cost trend of renewable energies is taken from the Lead Study 2009 (BMU 2009a) (see
Tab. 13-3 in the Appendix). In that study, technology-specific learning effects were illustrated
using learning curves,75 developed using knowledge gained from global developments over
74 In 2008, the share was already 15.1 per cent; it is expected to reach 16 per cent in 2009.
75 An introduction to learning curves and examples from the power generation sector can be found in Juninger
et al. 2008, McDonald and Schrattenholzer 2001 and IEA 2000.

Economic comparison of CCS power plants with renewable energy technologies
Wuppertal Institute for Climate, Environment and Energy 227
the last decades. As a result of this study, it was found that it had been possible to reduce
the cost of generating power from onshore wind turbines and photovoltaic plants by around
one third between 1985 and 2005 (BMU 2009a). A similarly rapid cost degression is ex-
pected for offshore wind power stations. Their electricity generating costs are currently
around 16.5 ct/kWhel, and could fall to 5 to 6 ct/kWhel in the long term. According to (BMU
2008a), other significant cost regressions are expected for photovoltaics, geothermal energy
and technologies for exploiting biomass. With the latter two sources, electricity generating
costs are reduced further by increasing heat credits, if the waste heat is used in combined
heat and power plants. A reverse trend was factored in to fuel prices for the use of biomass.
For evidence from the past, empirically determined learning rates were estimated to be
somewhere between 10 and 25 per cent; for future development up to 2050, learning rates
are estimated to be between 5 and 12 per cent: photovoltaics 10 per cent, biomass 5 per
cent, solar thermal power plants 11.5 per cent and wind 9 per cent. These estimates are
based on an ambitious global dynamic market growth of renewable energies, resulting in a
proliferation of installed capacity. Fig. 9-10 shows the development of electricity generating
costs for newly built plants based on these assumptions.
Fig. 9-10 Future cost trend of electricity-generating renewable energy technologies (new plants) and the mean of the whole mix of renewable energies (with/without photovoltaics; zero point is suppressed)
Source: Based on BMU 2009a
In the long term, electricity generating costs averaging 7 ct/kWhel will be achieved; the indi-
vidual technologies will range from 5.1 to 9.1 ct/kWhel. The greatest cost reduction takes
place between 2010 and 2020. It then slows down up to 2030, after which the learning poten-
tial is only very low for most technologies.

RECCS plus – Update and Expansion of the RECCS Study
228 Final Report
9.1.5 Cost comparison of CCS power plants and renewable energies
Developing the previous two sections, we will now proceed to compare the cost curves for
fossil fuel-fired CCS power plants with selected renewable energies. The economic perspec-
tives of both options will then be discussed in the context of energy supply in Germany. The
following energy technologies are chosen from Fig. 9-10 for the comparison:
• representative mix of new plants
• representative mix of new plants excluding photovoltaics
• offshore wind power stations
• Solar thermal power plants are also likely to play a major role in Germany in the medium
to long term (in the Lead Study 2008, power plants from the European electricity supply
grid are expected to constitute around 15 per cent of the total in 2050). As Fig. 9-10
shows, however, the cost curve of future solar thermal power plants from 2035 is more
or less identical to the representative mix of renewable energies. For this reason, this
technology is not presented in the following comparisons, keeping the figures as simple
as possible.
Fig. 9-11 gives a general overview of all the cost trends; Fig. 9-12 presents the results for
each individual technology (natural gas, hard coal steam power plants and lignite steam
power plants).
One main difference between fossil fuel-fired power plants and renewable energies is initially
that the cost trend of renewables is dependent only on technological factors and the as-
sumed learning curves (based on assumed market volumes). In contrast, the future electri-
city costs from fossil fuel-fired power plants will be determined mainly by the price trend of
fuels and the strength of climate policy (expressed in CO2 prices). This is most certainly the
case for CCS power plants which, due to their 35 per cent additional demand for fuel, is
heavily dependent on future increases in fuel prices. Conversely, the costs of protecting the
climate are considerably reduced by CO2 capture.
Scenarios A/C and C/A, described above, are used again for the following comparisons:
• Price scenario A/C: considerable increase in fossil fuel prices / slight increase in prices
for CO2 penalties
• Price scenario C/A: very slight increase in fossil fuel prices / considerable increase in
prices for CO2 penalties.

Economic comparison of CCS power plants with renewable energy technologies
Wuppertal Institute for Climate, Environment and Energy 229
Fig. 9-11 Development of future electricity generating costs (new plants) for renewable energies and fossil fuel-fired power plants (with/without CCS) for price trajectories A/C and C/A (CCS from 2020, including transport and storage)
Source: Authors’ design

RECCS plus – Update and Expansion of the RECCS Study
230 Final Report
Fig. 9-12 Development of future electricity generating costs (new plants) for renewable energies and fossil fuel-fired power plants (with/without CCS) for price trajectories A/C and C/A – detailed portrayal of natural gas (combined cycle), hard coal and lignite steam power plants
Source: Authors’ design

Economic comparison of CCS power plants with renewable energy technologies
Wuppertal Institute for Climate, Environment and Energy 231
Power plants without CCS compared with renewable energies
Fig. 9-11 initially shows that, with the selected price assumptions, electricity generating costs
for fossil fuel-fired power plants without CCS will also be more expensive than renewable
energies in Germany in the short to medium term. In the event of a very low increase in fossil
fuel prices (scenario C/A), electricity from hard coal will already be more expensive than
electricity from renewable energies in the period 2020-2025; natural gas will follow between
2025 and 2030. Lignite will also no longer be cost-effective by 2025 (due to the high CO2
penalties).
If a considerable increase in fuel prices is assumed (scenario A/C), natural gas-fired power
plants will be more expensive than renewable energies from as early as around 2020. The
development of hard coal is the same as above in that period. Lignite-fired power plants, on
the other hand, will only be cheaper sources of production than renewable energies up to
sometime between 2035 and 2040 (due to the currently low CO2 prices).
Power plants with CCS compared with renewable energies
If CO2 separation and storage are included, two opposite effects are observed, as shown in
the previous section. If fuel prices rise considerably (scenario A/C), the electricity generating
costs of fossil fuel-fired CCS power plants will increase by between 1.50 and 2 ct/kWhel. This
will have the effect of renewable energies being cost-effective considerably earlier than had
been anticipated: natural gas- and hard coal-fired power plants from 2020, lignite from 2025
(offshore wind) or 2030 (renewables mix).
In the case of very low energy prices (scenario C/A), the situation is reversed: whereas the
generating costs of CCS power plants are initially (in 2020) 0.07 to 1 ct/kWhel higher than
without CCS, the difference in cost is increasingly reduced and is reversed in 2050 to a re-
duction of between 0 and 1.6 ct/kWhel. In other words, CCS power plants will increasingly be
able to produce cheaper electricity than their reference plants due, in particular, to the high
CO2 penalties for the plants without CO2 capture. Nevertheless, fuel costs also rise in this
scenario which, together with the ever-declining operational lifetimes, lead to a steady in-
crease in electricity generating costs. On the other hand, renewable energies can further
exploit their advantage and continually reduce their costs, albeit at a slower rate due to the
deceleration in learning rates. All these aspects mean that fossil fuel-fired CCS power plants
will produce electricity more expensively than renewable energies from 2020 in this scenario,
too. The one exception is lignite-fired power plants, where cost parity is only achieved from
2025. The high CO2 penalty, which cannot be fully compensated by CO2 capture, has a par-
ticularly high impact in this case.
Later deployment of CCS (2025, 2030)
All calculations in this chapter are based on the assumption that CCS technology will be
commercially viable by 2020. If it turns out that it cannot be realised, the cost increases that
the figures show for 2020 with the planned introduction of CCS would be postponed to later
years (2025 or 2030). This would mean, however, that renewable energies would be able to
produce energy more cheaply in both the low and high price scenario as early as when CCS
is first introduced. On the other hand, renewable energies would then also have more scope
for flexibility if their cost reduction (based on the assumption of learning rates) was also de-
layed by five to ten years.

RECCS plus – Update and Expansion of the RECCS Study
232 Final Report
9.2 An aside: Reflections on the suitable cost term and scope of the sys-
tem – definition of break-even point
9.2.1 Suitability of the annuity approach
In the present study, we follow the usual method for determining the break-even point of the
costs of generating electricity using two competing power generation technologies, as de-
scribed, for example, in (Nitsch 2009). In this example, a comparison was made between
regenerative energy technologies on the one hand and power generation technologies using
fossil fuels, coupled with downstream CCS, on the other.
This usual procedure is based on the financial mathematical principle of “annuity”. Annuity is
one of three possible financial mathematical methods for transforming a cost curve over time
into a one-dimensional cost value. A break-even point can only be determined after a pro-
cedure such as this. What is helpful about choosing the “annuity” procedure is that it is also
incorporated into the widely used unit “costs of producing electricity (including transport) per
kilowatt hour” (ct/kWhel). Determining power generation costs on an annuity basis is gener-
ally used to ascertain a fixed price for the product over the lifetime of the generating plant,
guaranteeing a financial mathematical economic balance of expenditure and revenue for this
lifespan. It does not appear, however, that the annuity is appropriate for accurately calculat-
ing the break-even point of competing technologies.
Bearing this in mind, we should reflect on the real reasons for determining the break-even
point. At first sight, there is some doubt about the financial mathematical parameter, used in
its standard form, since annuity is not the criterion generally applied when it comes to making
investment decisions, where the capital value criterion is usually applied.
The objective pursued by determining the break-even point is to ascertain the point at which
there is a change in decision-making from one power generation technology to another. It is
the investors in power plants alone who create this switch, and yet they do not necessarily
follow the “annuity” approach. The pertinent question is, therefore, at what point will power
plant investors consider renewable energy technologies to be preferable over more tradi-
tional power generation technology, i.e. that based on fossil fuels. Or, to be more precise:
since there is a gap of several years between calculations and the start of construction, or
initial operation on the basis of a different calculation, the crucial question is when this
change with respect to the construction of new power plants will take place. This point in time
can be very different to that determined in the usual way of using average costs on an an-
nuity basis. The direction of this deviation is not generally predictable, nor can it be predicted
whether, quantitatively, it will be high. That would require an in-depth exploration of the issue
outlined here, which was not part of the remit of the present study.
9.2.2 Suitability of the section of the system selected to determine costs: the rel-
evance of stock market orientation in electricity price building versus CO2 al-
lowance prices
If it is agreed that the objective of determining the break-even point of “production costs” is to
establish at which point the technology change will actually take place, and if it is assumed
that this point in time is obtained from the calculations of power plant investors, it follows that
Economic comparison of CCS power plants with renewable energy technologies
Wuppertal Institute for Climate, Environment and Energy 233
there must also be an examination of whether the parameters within the section of the sys-
tem that influences production costs in the calculation correspond with that section, regard-
less of the financial mathematical approach selected for processing the chosen cost param-
eters. By choosing correctly, they will accurately and relevantly influence the calculation, and
not distort it.
There is some doubt as to whether the section of the system chosen in the standard form of
the result is correct. The reason for this is the debate about the influence of the prices for
CO2 permits on the relevant production costs in investors’ calculations. This debate revealed,
or reminded us, that it can no longer be generally, or readily, assumed that price formation is
oriented towards production costs in the given structure of the electricity market and with the
prevailing practices of (market-related) pricing. This stock market-led approach to electricity
pricing causes complex interrelationships to dominate, creating a situation that can be diffi-
cult for the layperson to interpret. The method of mark-up pricing for estimating costs would
be more universally understood. What’s more, if the newly established price formation
mechanism is considered or anticipated by power plant investors in their calculations, it could
transpire that certain parameters included by definition in the production costs are in fact
viewed as items in transit and are, therefore, no longer relevant to the decision-making pro-
cess.
The fact is that as long as older coal-fired power plants represent the marginal cost for power
plants in the German power market most of the time and, in this capacity, determine the
wholesale prices for electricity, the risk of cost ineffectiveness for new coal-fired power plants
due to rising or volatile prices of CO2 allowances is negligible. As a result, it is overlooked in
investors’ calculations. An increase in CO2 prices caused by higher emissions or a change in
political circumstances, or the risk of volatile CO2 prices leads to higher costs for new power
plants when considering matters in the traditional (isolated) way (see Section 9.1.3). How-
ever, as was widely expected, the higher costs for the power plants that set the wholesale
market price (that are less efficient and therefore involve higher CO2 costs) are reflected in
the electricity price building at the stock exchange – this leads to a higher electricity revenue
and compensates the (increased) CO2 costs. The price for CO2 permits is consequently con-
sidered to be an in-transit item, and therefore does not influence power plant investors’ cal-
culations (in Germany). This is how interrelations are represented on the basis of a suitable,
non-restricted calculation (according to Prognos et al. 2009).
The significance of shifting the perspective of a calculation, as suggested, is that the prices
of CO2 permits would have to be deleted from the calculation and the (real) break-even point
would be reached eventually. However, a correction to the calculation by neutralising the
influence of the prices of CO2 permits should only be made if the prices for fossil fuels and
those of CO2 permits are each viewed independently. It may be the case that many market
participants (still) see it like this. The present study, however, refrained from adopting this
viewpoint for the relevant cases. Here, using the definition of scenarios A/C and C/A, it was
assumed that CO2 prices do influence fuel prices, and, indeed, generally in the opposite di-
rection.
These observations show that since even the method of the prevailing calculation can be
defective and is (therefore) open to interpretation, any substantial elaboration of this point

RECCS plus – Update and Expansion of the RECCS Study
234 Final Report
requires broad dialogue with power plant investors regarding their calculations. This, too,
requires a detailed exploration that goes beyond the scope of the present study.
9.2.3 The impact of CCS power plants on determining price in an electricity stock
market-oriented calculation
With an electricity stock market-based approach to electricity pricing, the (purchasing) costs
(for electricity consumers) are not equal to the sum of the production costs (of electricity pro-
ducers) plus a mark-up. The figures are not even similar because it is not a case of neglect-
ing profit in the sense of a risk premium. From the perspective of power plant investors, it is
also the case that the anticipated return on a power plant, when conceived as a commodity
with a redeemable price and full load period of usage, is as an integral of the deployment of
the power plant or the feed-in of its capacity, evaluated using the stock market price of the
product at that time. Consequently, the deployment of power plants, and hence their rev-
enue, is crucially dependent on the relationship between the marginal costs of the options of
production used, i.e. their “merit order” at a particular time. The expected return on a power
plant is thus determined to a lesser extent by its average costs, as in the customary method
of determining break-even point, and to a greater extent by its marginal costs. In addition, it
is context-sensitive, i.e. dependent on the relationship of its own marginal costs with the
marginal costs of competing power plants. This competitive relationship ultimately deter-
mines the realised capacity utilisation. It is therefore a major step forward that these relation-
ships have been described in essence (Sensfuß 2009a,b), (Sensfuß and Ragwitz 2006,
2008), (Sensfuß et al. 2008).
Fig. 9-13 Schematic diagram: the marginal costs effect of renewable energies influences the average generating costs of electricity according to their usage characteristics
Source: Sensfuß and Ragwitz 2007 (left) and Morthorst 2007 (right)
The principle of this new method of determining costs, even if in another part of the system,
is presented in Fig. 9-13. Using this diagram, the authors have derived that “for 2006 … the
sum of the market value and the merit order effect ... [is] higher than the entire Renewable
Energy Law allowance,” (Sensfuß and Ragwitz 2007:14). They therefore prove empirically
that, despite their higher average production costs, renewable energy technologies have led
to lower electricity prices (average costs for electricity consumers) than would have been the
case at a power plant site without renewables, i.e. at a power plant site with lower average
Economic comparison of CCS power plants with renewable energy technologies
Wuppertal Institute for Climate, Environment and Energy 235
costs. Hence the change in the average production costs of power generation technologies
cannot be applied linearly to the change in average production costs that affect electricity
consumers’ bills, and yet the latter cost term is the more economically significant of the two.
For the present study, it is important to start with these results and then to develop them a
step further. Now we will turn to how this situation changes when, on the fossil power gen-
eration technology side, CCS is installed downstream (particularly to coal-fired power plants)
and viewed as a new type of power plant, and when renewable energy beyond wind is on the
market. The crucial element is how the marginal costs change on both sides. Power plant
operators consider marginal costs to be variable, i.e. they do not apply when the operational
power plant is not in use. In general, these are (mainly) the costs for the energy source used:
• For renewable energy technologies, the following principally applies: provided that the
source of energy is free, the “energy costs”, and therefore marginal costs, equal zero.
The validity of this principle is reduced if storage processes play a role, i.e. in the case of
hydropower (with the exception of run-of-river power stations) or also in the case of so-
lar-thermal electricity generation with night or peak sharing.
• For fossil power generation technologies, the fuel costs are generally considered to be
the marginal costs. As a surcharge, the costs for CO2 permits that may (or may not) be
incurred, must be added to this, as measured by their (volatile) stock market price. The
question is now how adding downstream CCS changes this marginal calculation.
This has already been touched upon for coal-fired power plants with downstream CCS.
However, the form of this investigation was such that it would be inappropriate to transfer the
results to the present discussion (Prognos 2009). In their model, which is stylised, the areas
of fossil fuel-fired power plants and renewable energy technologies were isolated from one
another – cost-driven substitutional competition between the two types of electricity genera-
tion is not an option in the model. A substitution is only permitted within the area of fossil fuel-
based electricity generation, the share of which is set beforehand (the assumption was that
nuclear power was excluded). The only remaining options for a substitution are therefore
natural gas (with imported, high-price natural gas, the price of which rose even during the
research) and coal-fired CCS power plants (it is assumed that the price of coal is declining).
Electricity generation from renewable energies, on the other hand, was exogenously given as
a share (which therefore contradicts the growth targets set by politicians).
The result of the investigation is that a considerable expansion of coal-fired power plants are
equipped with CO2 capture, and are therefore more expensive, leading to a reduction in the
wholesale prices of electricity by 17 per cent (! 32 billion) or 22 per cent (! 66 billion) com-
pared to the case “without CCS.” In other words, this is once again a change of sign in the
relationship of costs between the two variants and further proof of the relevance of Sensfuß’s
perspective. This result is based here on a change in the price-determining type of power
plant in the merit order between natural gas power plants and coal-fired power plants. With-
out the CCS option (for coal), natural gas (in the purely fossil part of the power plant fleet)
would, in wide areas of application, replace coal which, due to CO2 charges, would have
higher marginal costs in future. With CO2 capture, the marginal costs of coal-fired power
plants remain low – with its downstream “chemical factory”, the CCS plant is extremely capi-
tal-intensive, and therefore marginal cost-extensive. The downstream CCS plant therefore
impedes the change to natural gas power plants, with higher marginal costs, in many areas.
RECCS plus – Update and Expansion of the RECCS Study
236 Final Report
As a result, we reach another different angle, depending on the cost term used. If the princi-
ple of mark-up pricing applies with regard to costs for CO2 permits, they increase the produc-
tion costs for fossil-based power generation technology with CCS compared to that without
CCS, and change the competitive situation vis-à-vis renewable energy power generation
technologies in favour of the latter. If, on the other hand, cost-setting with merit order applies,
they decrease the average production costs for fossil-based power generation technology
with CCS compared to that without CCS, and therefore change the competitive situation vis-
à-vis renewable energy power generation technologies at the expense of the latter.
The crucial question, however – which of the two climate protection options (CCS or renew-
able energies) has the greatest impact on the overall decreasing prices of electricity – was
not examined. Since the marginal costs of renewable energies tend towards zero and there-
fore remain lower than those of CCS power plants, they should also be able to offer a crucial
advantage here, too.
9.3 Conclusions from the economic analysis
After successfully demonstrating the entire CCS chain (the capture, transport and, in particu-
lar, storage of CO2), according to our calculations, electricity generating costs from CCS
power plants of between 7.30 and 10.35 ct/kWhel (at power plant) can be achieved by 2020
(assumed real interest rate 6 per cent per annum). The price range depends on both the
technology taken into consideration and the price trends of fuel and CO2 allowances up to
2020. The usage fees for storage sites (“storage fee”), as called for by several federal states
and the German Advisory Council on the Environment, have not yet been included.
Two scenarios were considered: very low increasing fuel costs with high CO2 penalties
(scenario C/A) and considerably rising energy costs that cause a surplus of and, therefore,
decreasing CO2 penalties (scenario A/C). In the latter case, considered to be the more
realistic scenario, CO2 avoidance costs in 2020 of ! 68/t CO2 (natural gas), ! 43/t CO2 (hard
coal) and ! 20/t CO2 (lignite) are produced.
Depending on further price trends, the long-term cost projections of CCS range from 8.10 to
13.80 ct/kWhel in 2040 and from 8.80 to 15.40 ct/kWhel in 2050. Lignite steam power plants
are in the lower region, hard coal power plants (steam and gasification) are in the medium to
high range, and natural gas in the top range. Despite increasing running costs, CO2 avoid-
ance costs decrease due to learning effects by 2040 to ! 61/t CO2 (natural gas), ! 36/t CO2
(hard coal) and !17/t CO2 (lignite). With the exception of lignite, therefore, they are still a long
way from achieving the costs of around ! 20/t CO2 to which the power industry aspires.
The average electricity generating costs of renewable energies are presently around 12
ct/kWhel, assuming a representative mix (also calculated at a real interest rate of 6 per cent
per annum). When photovoltaics are excluded from the mix, the average costs amount to
around 10 ct/kWhel. If they continue to be launched at a similar speed as before, average
electricity generating costs of approximately 8.8 ct/kWhel (including photovoltaics) and 8.2
ct/kWhel (excluding photovoltaics) can be achieved by 2020. A sustained global increase in
market penetration and learning effects give reasons to expect further significant cost de-
gressions for renewable energies over time. By 2050, therefore, the level of costs in the in-
vestigated characteristic mix could be around 8.8 ct/kWhel. Technologies such as offshore
Economic comparison of CCS power plants with renewable energy technologies
Wuppertal Institute for Climate, Environment and Energy 237
wind power or geothermal energy could achieve electricity costs of around 5 ct/kWhel if their
learning curve continues to be used for the further expansion of global markets.
If the dynamics of the expansion of renewables in the electricity sector remains high, as as-
sumed in the scenario family CCS-EE/KWK (Chapter 10), individual renewable energy tech-
nologies (offshore and onshore wind power, solar thermal power plants) will be able to com-
pete with CCS power plants as early as in 2020, which is considered to be the potential start-
ing point for CCS power plants. The average mix is partially competitive even now. If fuel
prices increase considerably, the generating costs of CCS-based natural gas- and hard coal-
fired power plants will be higher from 2020 than for renewable energies. Lignite-fired CCS
power plants will follow from 2025 (offshore wind/solar thermal energy) and 2030 (mix of re-
newable energies). Even in the case of very small increases in energy prices, the additional
costs incurred by CCS would be so high that renewable energies would remain competitive
at the same time as in the high price scenario. The high CO2 penalty, which cannot be fully
compensated by CO2 capture, has a particularly powerful impact on lignite.
The whole calculation is based on the assumption that CCS technology will be commercially
viable by 2020. If CCS is not made available until a later stage, the increases in costs previ-
ously assumed for the year 2020 during the introduction of CCS would be postponed to later
years (2025 or 2030). This would mean, however, that renewable energies would be able to
produce energy more cheaply in both the low and high price scenario as early as when CCS
is first introduced On the other hand, renewable energies would then also have more room
for manoeuvre if their cost reduction (based on the assumption of learning rates) was also
delayed by five to ten years.
Banking analysts confirm the basic assertion of the calculations presented here. In its 2009
industry report on photovoltaics, for instance, the Landesbank Baden-Württemberg also
modelled other options of CO2 reduction using scenarios. Regarding CCS, they conclude that
this technology is “not practicable on commercial and economic grounds, not even in Central
Europe. Solar electricity generation is not more expensive than CCS (and much cheaper
from 2020).” (LBBW 2009:6). It raises the question: “Which technology should be subsidised
in future from taxpayers’ money: ‘cleaning’ conventional, fossil fuel-fired power plants, which
have an expiration date, by CCS or supplying industrial society with solar electricity, which is
arguably more sustainable.” (LBBW 2009:54).
According to the assumptions made, therefore, there is no compelling incentive from an eco-
nomic perspective to favour CCS technologies over the further expansion of renewable en-
ergies for power generation. Further considerations show, however, that the issue of gener-
ating costs and the break-even point between CCS-based power plants and renewable en-
ergies are no longer the only decisive factors from the viewpoint of investors. Our calculation
of the electricity costs on an annuity basis is not necessarily the calculation used by inves-
tors. The traditional mark-up method in electricity pricing, which enables additional invest-
ments, the higher fuel costs and an increasing price for CO2 permits to be included in our
calculation, has now been superseded by the stock market approach. This leads to effects
such as the additional CO2 costs being factored into the price, causing them to be considered
as only an item in transit, meaning that they do not influence the calculations of power plant
investors. In fact, the current price for electricity is determined by the stock market price,
which, in turn, is dependent on the merit order of operational power plants. While research

RECCS plus – Update and Expansion of the RECCS Study
238 Final Report
has subsequently proved that renewable energies have led to a decrease in electricity prices,
despite their currently higher capital expenditure (since their marginal costs are virtually zero,
unlike with expensive natural gas), it remains to be seen how they will influence CCS-based
power plants.
Systems-analytical assessment of CCS in national scenarios
Wuppertal Institute for Climate, Environment and Energy 239
10 Systems-analytical assessment of CCS in national scenarios
10.1 Review of the scenarios in the RECCS study
In the RECCS study, three different scenarios were developed in order to analyse the role of
CCS in the energy sector in comparison to renewable energies in Germany (WI et al. 2007,
Chapter 14). These three scenarios will be mentioned below before proceeding to the new
scenarios developed in this study. In all three scenarios, energy-related CO2 emissions in
Germany were reduced to 240 million tonnes per annum by 2050, which corresponds with an
approximately 75% reduction compared with 1990 levels. The scenarios were based on the
following assumptions:
• CCS-MAX as the main element of a climate protection strategy with “maximum use” of
CCS technologies from 2020 within the framework of a development that otherwise
largely follows current trends (relatively small mobilisation of efficiency potentials and
limited implementation of the expansion potentials of renewables). According to the re-
sults of the scenario calculation, such a strategy runs into structural and capacity limits.
The earliest date when CCS is expected to be ready for commercial implementation is
2020, which is too late for the current first wave of the power station replacement pro-
gramme in Germany. This scenario would necessitate extremely rapid growth rates for
CCS plants (new construction and retrofitting older power plants) between 2020 and
2050. It would not be possible to achieve the climate protection targets in 2050 with CCS
alone. The transport sector would have to achieve additional reductions, necessitating
the construction of a hydrogen infrastructure (based on coal gasification with CO2 sepa-
ration). By 2050, hydrogen would be the dominant form of energy, supplying 47 per cent
of final demand.
• CCS-BRIDGE as “bridging technology” if, despite efficiency increases and renewables
being implemented more consistently than in the business-as-usual conditions, major
players in energy policy and management assume from the outset that these strategy
elements will not suffice to achieve the “-80 per cent” target. Such a strategy would give
CCS technology the chance to establish itself in the German power supply after 2020.
For 2050, this results in a quite balanced mix of electricity from renewables (245 TWh/a),
CCS electricity (146 TWh/a) and conventionally generated electricity from fossil fuels
(150 TWh/a). However, this scenario is also unable to meet the climate protection tar-
gets in the electricity sector, although it is more successful than under CCS-MAX condi-
tions. The requirements for introducing a hydrogen infrastructure in the transport sector
are less extensive than in CCS-MAX, because the required contributions of CCS and
hydrogen may still be relatively low up to 2030. Hydrogen would make up 29 per cent of
energy sources in 2050. As in the CCS-MAX scenario, CCS-BRIDGE would also require
a considerably larger supply of primary energy.
• NaturschutzPlus as a path with a vigorous and ecologically optimised expansion of
renewables and across-the-board exploitation of energy efficiency potentials. This scen-
ario was one of the forerunners of the Lead Scenarios subsequently published by the
RECCS plus – Update and Expansion of the RECCS Study
240 Final Report
BMU (BMU 2007, BMU 2008a, BMU 2009a). This scenario describes a development
that gives a long-term perspective to the expansion of renewable energies, introduced
by energy policy, and which increasingly combines it with growing contributions of a
more efficient conversion (combined heat and power, CHP) and use of energy. The use
of CCS technologies is not necessary for climate protection purposes; the scheduled
phasing out of nuclear energy is adhered to. An expansion of CHP is an important char-
acteristic of this scenario, which enables it to transfer the consumption of natural gas
from the heating sector to the electricity sector, and even to continually reduce it from
2020.
The new scenario developed in this study incorporates elements from both CCS-MAX and
NaturschutzPlus. As in the NaturschutzPlus scenario, it is assumed that energy management
targets set by the German government, such as the expansion of renewables and CHP, will
indeed be implemented. However, as in CCS-MAX, it is assumed that the necessary effi-
ciency measures will only be implemented to a moderate extent. The varying use of CCS is
envisaged for the remaining demand for electricity from fossil sources. This use is depicted in
a “scenario family” CCS-EE/KWK, comprising six variants, based on the BMU’s Lead Scen-
ario 2008.
10.2 Lead Scenario 2008 and definition of the CCS-relevant variant D
The Lead Scenario 2008 in (BMU 2008a) describes a scenario that shows how greenhouse
gas emissions caused by the electricity, heat and transport sector in Germany can be re-
duced to around 20 per cent of the 1990 level by 2050. The Zwischenziele der Bundes-
regierung (Interim Targets of the German government) for 2020 are also portrayed in the
Lead Scenario against the backdrop of this general objective. These interim targets are:
• to reduce CO2 emissions to 35 to 40 per cent of 1990 levels,
• to double the 1990 rate of energy productivity,
• for renewables to make up 18 per cent of overall energy consumption (30 per cent of
electricity)
• to considerably expand combined heat and power, as stipulated in the resolutions of the
German government, applicable laws and EU Commission regulations;
• finally, to adhere to the legally determined phasing out of nuclear power.
The Lead Scenario describes the structural change of energy supply in Germany necessi-
tated by these objectives.
Scenarios generally demonstrate the potential future developments of energy systems under
the assumption that the conditions set for the scenario construction will come true, that set
targets will be achieved and, moreover, that no unforeseeable events will occur that funda-
mentally change the whole system. However, it also makes sense to model missed targets or
the non-fulfilment of desired conditions. The quantitative effect enables us to gain information
on the significance of action taken or on the degree to which targets have been missed.
Missed targets with regard to the intended efficiency increases in all sectors were modelled
in two variants D1 and D2 in (BMU 2008a). In scenario D2, a coal-oriented investment strat-

Systems-analytical assessment of CCS in national scenarios
Wuppertal Institute for Climate, Environment and Energy 241
egy was additionally assumed in the power plant sector, which approximately represents
energy suppliers’ current plans. Combined with inadequate efficiency successes, the imple-
mentation of these plans would have dramatic effects on the desired path for reducing CO2.
In 2020, CO2 emissions from the entire energy supply, at 743 million tonnes per annum,
would be around 100 million tonnes per annum higher than those in the Lead Scenario 2008,
which would be merely a 25 per cent reduction compared to 1990. By 2050, CO2 emissions
would only be reduced to approximately 400 million tonnes of CO2 per annum, despite the
same expansion of renewables as in the Lead Scenario 2008, i.e. twice the amount required
to meet the “-80 per cent” target (see Fig. 10-1 for the course of D2). In this scenario, how-
ever, it must be borne in mind that the co-existence of a huge expansion of renewables and
a respective plan to expand coal-fired power plants will lead to a continual reduction of the
running time (full load hours) of coal-fired power plants (see below). For this reason, they
may no longer be economically viable, even without CO2 capture.
Fig. 10-1 Development of CO2 emissions in the Lead Scenario 2008 and in variants D2 (coal-oriented) and D (plus reduced efficiency), comparison with the business-as-usual conditions of Energy Report IV and the reduction targets of the German government for 2020 and 2050
Source: BMU 2008a; EWI and Prognos 2005
The development outlined in scenario variants D1 and D2 can also be used to illustrate the
impact of capturing and retaining carbon dioxide from power plants (CCS technology) and to
monitor whether the climate protection targets can still be achieved or whether they should
be approached in a different way. Unlike the considerations in (BMU 2008a), a scenario vari-
ant is developed in this study (variant D) that only takes missed targets and various invest-
ment strategies in the electricity sector into account to enable the impact of a varying degree
of use of CCS technologies to be clearly portrayed. In scenario D, therefore, the heat and
transport sector is identical to that in the Lead Scenario 2008, and “only” considers the ef-
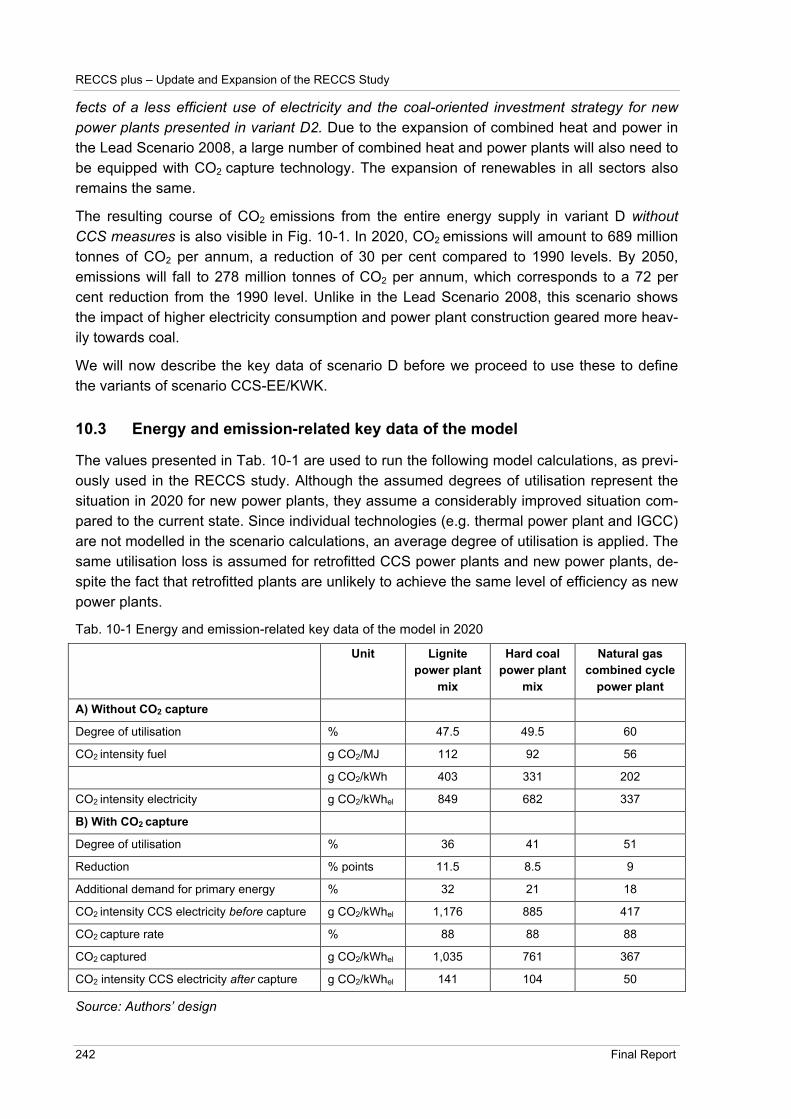
RECCS plus – Update and Expansion of the RECCS Study
242 Final Report
fects of a less efficient use of electricity and the coal-oriented investment strategy for new
power plants presented in variant D2. Due to the expansion of combined heat and power in
the Lead Scenario 2008, a large number of combined heat and power plants will also need to
be equipped with CO2 capture technology. The expansion of renewables in all sectors also
remains the same.
The resulting course of CO2 emissions from the entire energy supply in variant D without
CCS measures is also visible in Fig. 10-1. In 2020, CO2 emissions will amount to 689 million
tonnes of CO2 per annum, a reduction of 30 per cent compared to 1990 levels. By 2050,
emissions will fall to 278 million tonnes of CO2 per annum, which corresponds to a 72 per
cent reduction from the 1990 level. Unlike in the Lead Scenario 2008, this scenario shows
the impact of higher electricity consumption and power plant construction geared more heav-
ily towards coal.
We will now describe the key data of scenario D before we proceed to use these to define
the variants of scenario CCS-EE/KWK.
10.3 Energy and emission-related key data of the model
The values presented in Tab. 10-1 are used to run the following model calculations, as previ-
ously used in the RECCS study. Although the assumed degrees of utilisation represent the
situation in 2020 for new power plants, they assume a considerably improved situation com-
pared to the current state. Since individual technologies (e.g. thermal power plant and IGCC)
are not modelled in the scenario calculations, an average degree of utilisation is applied. The
same utilisation loss is assumed for retrofitted CCS power plants and new power plants, de-
spite the fact that retrofitted plants are unlikely to achieve the same level of efficiency as new
power plants.
Tab. 10-1 Energy and emission-related key data of the model in 2020
Unit Lignite
power plant
mix
Hard coal
power plant
mix
Natural gas
combined cycle
power plant
A) Without CO2 capture
Degree of utilisation % 47.5 49.5 60
CO2 intensity fuel g CO2/MJ 112 92 56
g CO2/kWh 403 331 202
CO2 intensity electricity g CO2/kWhel 849 682 337
B) With CO2 capture
Degree of utilisation % 36 41 51
Reduction % points 11.5 8.5 9
Additional demand for primary energy % 32 21 18
CO2 intensity CCS electricity before capture g CO2/kWhel 1,176 885 417
CO2 capture rate % 88 88 88
CO2 captured g CO2/kWhel 1,035 761 367
CO2 intensity CCS electricity after capture g CO2/kWhel 141 104 50
Source: Authors’ design

Systems-analytical assessment of CCS in national scenarios
Wuppertal Institute for Climate, Environment and Energy 243
Here, 88 per cent is taken as the CO2 capture rate, the average value derived in the RECCS
study. The quantities of CO2 to be captured and the remaining emissions at the power plant
are yielded from the capture rate and efficiency loss. Please note that, in this case, quantities
to be captured are not identical to the avoided quantities of CO2 because CO2 emissions in-
itially rise proportionately to higher consumption of primary energy.
10.4 Power plant-related key data of scenario D and the scenario family
CCS-EE/KWK
The necessary construction of new fossil fuel-fired power plants up to 2050 can be deter-
mined from the decommissioning of existing power plants (including the phasing out of nu-
clear power), as assumed in (BMU 2008a), the future total gross demand for electricity and
the assumed expansion of renewable energy plants. The resulting expansion of capacity
from 2005 is shown in Tab. 10-2.
Development of the power plant mix
In scenario D, the need for new fossil fuel-fired power plants increases to a total of 47 GW up
to 2040. After then, it decreases again slightly up to 2050 due to the further considerable
expansion of renewable energies. Only large-scale power plants are affected by this reduc-
tion because the capacity of decentralised CHPP will steadily increase up to 2050. By 2050,
all of the “old power plants” (power plants up to 2005) will have been replaced by new plants
(maximum service life of 40 years for large-scale power plants). For this reason, the values in
the column headed “2050” in Tab. 10-2 also correspond with the total capacity from power
plants installed in this year (with the exception of larger hydro-electric power plants with
longer service lives).
In scenario D, associated with a coal-oriented expansion strategy, almost 41 GW fossil fuel-
fired power plants are in operation in 2050 which, in principle, could be fitted with CCS tech-
nologies. Of this amount, 24.7 GW are from hard coal-fired power stations (12.7 of which as
CHPP), 9.3 GW from lignite-fired power stations (3.2 GW of which as CHPP) and 6.8 GW
from natural gas power stations (4.8 GW as CHPP). These values lay the foundations for
further investigations into the possibilities of using CCS technologies in the area of electricity.
The quantities of electricity that can be generated in these power plants (compare Tab. 10-2)
are the result of the concurrence of all power-generating plants to meet the respective de-
mand. The significant expansion of renewables and the intended higher share of CHP will
have an increasing impact on the utilisation period of fossil fuel-fired power plants because
the base load operation will gradually decrease. Their efficiency will decrease from an aver-
age of 5,600 h/a in 2010 to 3,600 h/a in 2050. This factor must be taken into account in eco-
nomic analyses regarding CCS and the mode of operation, since CCS power plants require
base load operation due to the chemical processes that occur during capture. An incompati-
bility is already visible between capital-intensive large-scale power plants, operated with the
longest possible utilisation period, and a rapidly growing contribution of renewables to the
future power supply. This conflict will intensify with CCS power plants. A power plant mix
from the perspective of optimum CCS operation would therefore have a much smaller share
of renewable energies than assumed in scenario D – derived from the Lead Scenario 2008 –
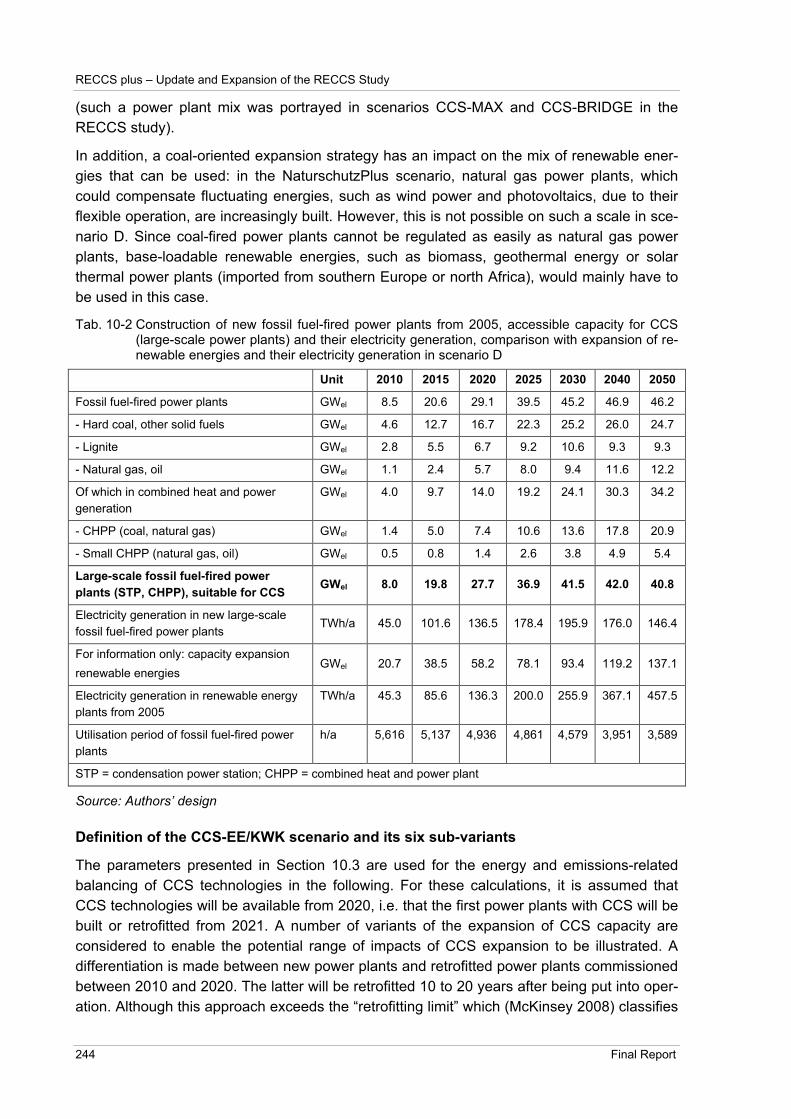
RECCS plus – Update and Expansion of the RECCS Study
244 Final Report
(such a power plant mix was portrayed in scenarios CCS-MAX and CCS-BRIDGE in the
RECCS study).
In addition, a coal-oriented expansion strategy has an impact on the mix of renewable ener-
gies that can be used: in the NaturschutzPlus scenario, natural gas power plants, which
could compensate fluctuating energies, such as wind power and photovoltaics, due to their
flexible operation, are increasingly built. However, this is not possible on such a scale in sce-
nario D. Since coal-fired power plants cannot be regulated as easily as natural gas power
plants, base-loadable renewable energies, such as biomass, geothermal energy or solar
thermal power plants (imported from southern Europe or north Africa), would mainly have to
be used in this case.
Tab. 10-2 Construction of new fossil fuel-fired power plants from 2005, accessible capacity for CCS (large-scale power plants) and their electricity generation, comparison with expansion of re-newable energies and their electricity generation in scenario D
Unit 2010 2015 2020 2025 2030 2040 2050
Fossil fuel-fired power plants GWel 8.5 20.6 29.1 39.5 45.2 46.9 46.2
- Hard coal, other solid fuels GWel 4.6 12.7 16.7 22.3 25.2 26.0 24.7
- Lignite GWel 2.8 5.5 6.7 9.2 10.6 9.3 9.3
- Natural gas, oil GWel 1.1 2.4 5.7 8.0 9.4 11.6 12.2
Of which in combined heat and power
generation
GWel 4.0 9.7 14.0 19.2 24.1 30.3 34.2
- CHPP (coal, natural gas) GWel 1.4 5.0 7.4 10.6 13.6 17.8 20.9
- Small CHPP (natural gas, oil) GWel 0.5 0.8 1.4 2.6 3.8 4.9 5.4
Large-scale fossil fuel-fired power
plants (STP, CHPP), suitable for CCS GWel 8.0 19.8 27.7 36.9 41.5 42.0 40.8
Electricity generation in new large-scale
fossil fuel-fired power plants TWh/a 45.0 101.6 136.5 178.4 195.9 176.0 146.4
For information only: capacity expansion
renewable energies GWel 20.7 38.5 58.2 78.1 93.4 119.2 137.1
Electricity generation in renewable energy
plants from 2005
TWh/a 45.3 85.6 136.3 200.0 255.9 367.1 457.5
Utilisation period of fossil fuel-fired power
plants
h/a 5,616 5,137 4,936 4,861 4,579 3,951 3,589
STP = condensation power station; CHPP = combined heat and power plant
Source: Authors’ design
Definition of the CCS-EE/KWK scenario and its six sub-variants
The parameters presented in Section 10.3 are used for the energy and emissions-related
balancing of CCS technologies in the following. For these calculations, it is assumed that
CCS technologies will be available from 2020, i.e. that the first power plants with CCS will be
built or retrofitted from 2021. A number of variants of the expansion of CCS capacity are
considered to enable the potential range of impacts of CCS expansion to be illustrated. A
differentiation is made between new power plants and retrofitted power plants commissioned
between 2010 and 2020. The latter will be retrofitted 10 to 20 years after being put into oper-
ation. Although this approach exceeds the “retrofitting limit” which (McKinsey 2008) classifies

Systems-analytical assessment of CCS in national scenarios
Wuppertal Institute for Climate, Environment and Energy 245
as when a power plant is 10 to 12 years old, it considers the fact that a very high “CCS ca-
pacity” would otherwise have to be installed within a short period (2030 to 2035).
A further differentiation is made between large-scale condensation power stations and com-
bined heat and power plants, which generally have less capacity (Tab. 10-3). It is further-
more assumed that new fossil fuel-fired power plants built between 2005 and 2010 will be
replaced by new CCS power plants at the end of their service life, i.e. between 2045 and
2050. The following six variants of the CCS-EE/KWK scenario are defined:
Tab. 10-3 Proportion of power plants equipped with CCS in the investigated variants of scenario CCS-EE/KWK
Scenario variants New
STP
Retrofitting
STP
New
CHPP
Retrofitting
CHPP
1. Maximal – Theoretisch 100% 100% 100% 100%
2. Maximal – Realistisch 100% 65% 75% 35%
3. Maximal – Neu 100% - 75% -
4. Realistisch I 75% 40% 40% 20%
5. Realistisch I (only Kohle) 75% 40% 40% 20%
6. Realistisch II 50% 30% 30% 15%
STP = condensation power station; CHPP = combined heat and power plant
Source: Authors’ design
1. Maximal – Theoretisch: The share is systematically reduced, based on the theoretical
upper limit, which assumes that all large-scale power plants fired by fossil fuel and com-
bined heat and power plants will be fully equipped with CCS in 2050.
2. Maximal – Realistisch: It is initially assumed that combined heat and power plants, as
condensation power stations, can only be equipped with CCS to a small extent. On the
one hand, they usually have a relatively low capacity of around 200 MWel. On the other
hand, they are often located in cities, which means there is little space available for cap-
ture plants and transport infrastructure. In addition, the acceptance of CCS plants is
likely to be much lower in cities than for large-scale power plants on the edge of towns.
3. Maximal – Neu: One sub-variant considers only new plants because retrofitting is dis-
advantageous compared to new constructions, from an energy and economic perspec-
tive.
4. Realistisch I: Not all sites are suitable for being connected to CO2 pipelines. Since the
potential CO2 storage locations are situated in northern Germany (see Fig. 7-8), all
power plants south of the Main are simply excluded from CCS operation. (McKinsey
(2008) does not include the southern German power plants in their European-wide clus-
ter either, due to a lack of storage possibilities, see Fig. 10-8.) Approximately 75 per cent
of the power plant capacity from fossil fuels installed in Germany then remains. Roughly
this share is combined with the factors in variant 2.
5. Realistisch I – only Kohle: One sub-variant considers only coal-fired power plants.
6. Realistisch II: In the last variant, the potential share of power plants north of the Main
that may be viable for CCS is reduced by another third compared to variant 4. This (fixed

RECCS plus – Update and Expansion of the RECCS Study
246 Final Report
amount) accounts for the fact that individual power plants may not be able to be con-
nected to a transport network or that not all power plants can be equipped with CCS for
capacity and economic reasons.
10.5 Results of the variant calculation in CCS-EE/KWK
The overall result with regard to the reduction in CO2 is illustrated in Fig. 10-2. It first be-
comes apparent that the considerable contribution electricity generation makes to CO2 emis-
sions today, amounting to around 310 million tonnes of CO2 per annum, will generally decline
significantly due to the substantial growth of renewable energies. In the Lead Scenario 2008,
emissions from the entire electricity sector will decline to 28 million tonnes of CO2 per annum
in 2050, since by then there will only be very little power-generation capacity from fossil fuels,
mainly in the form of CHP plants and natural gas condensation power stations.
In scenario D (without CCS), the CO2 emissions from the electricity sector are reduced to 96
million tonnes of CO2 per annum. They account for 35 per cent of the then existing CO2
emissions, 278 million tonnes of CO2 per annum. CCS can be employed in this segment.
Since the average capture rates in CCS power plants are assumed to be 88 per cent, the
remaining emissions in scenario D can be reduced by a maximum of 85 million tonnes of
CO2 per annum to approximately 11 million tonnes per annum, the theoretical upper limit. In
this theoretical border case, the remaining CO2 emissions would fall below the value of CO2
emissions in the Lead Scenario 2008.
Fig. 10-2 Range of the development of total CO2 emissions, subdivided into the electricity sector and the sectors of consumption “heat + fuels” for two variants of scenario CCS-EE/KWK and comparison with the Lead Scenario 2008
Source: Authors’ design

Systems-analytical assessment of CCS in national scenarios
Wuppertal Institute for Climate, Environment and Energy 247
A comparison of CO2 emissions in the different variants of the CCS-EE/KWK scenario in the
electricity sector alone is given in Fig. 10-3. First of all, it becomes apparent that the CO2
reduction potential of the expansion of renewables in scenario D is considerably larger that
than of a potential reduction through CCS power plants (curve “renewables frozen”). This is
the result of the assumed considerable expansion of renewable energies in this scenario,
which generally reduces the share of electricity generated by fossil fuels by a considerable
extent.
In this scenario, however, the considerably higher CO2 emission from electricity generation
occurring up to 2020 will be significantly reduced compared to the Lead Scenario 2008, de-
pending on the intensity of the expansion of CCS up to 2050. In case 2 (Maximal –
Realistisch), the state of the Lead Scenario is virtually reached, at approximately 28 million
tonnes of CO2 per annum. In the more realistic variants 4 (Realistisch I) and 6 (Realistisch
II), levels of 50 and 63 million tonnes of CO2 per annum, respectively, are achieved. The
level of the Lead Scenario (28 million tonnes of CO2 per annum) is hence exceeded by 22
million tonnes of CO2 per annum (variant 4, plus 80 per cent) and 35 million tonnes of CO2
per annum (variant 6, plus 125 per cent), respectively.
Fig. 10-3 Course of CO2 emissions in the electricity sector in the different variants of scenario CCS-EE/KWK, in the Lead Scenario 2008 and in the hypothetical case of freezing the contribu-tion of renewables at today’s level
Source: Authors’ design
The complete comparison of the most important key data of the variant calculation according
to Tab. 10-3 is shown in Tab. 10-4 (a detailed overview of the key data of the six scenarios
can be found in Tab. 13-4 to 13-9 in the Appendix). The following are presented in addition to
the avoided CO2 – compared to the CO2 emissions of the standard operation of fossil fuel-
fired power plants: the “net capacity” of the power plants accessible for CCS measures; the
quantity of electricity that can be produced; the resulting capacity of the CCS power plants,
including the additionally required power to compensate for the reduced efficiency of power
plants due to the capture of CO2; the total quantity of CO2 to be captured and the additional
need for fuel.

RECCS plus – Update and Expansion of the RECCS Study
248 Final Report
Tab. 10-4 The effects of using CCS technology in the new construction and retrofitting of fossil fuel-fired power plants for various framework conditions
Unit 2025 2030 2040 2050
CCS – capacity *) GWel 10.9 17.3 37.7 50.1
Net capacity GWel 8.8 14.0 30.9 40.8
Net electricity generation TWh/a 42.9 64.0 121.9 146.4
Avoided CO2 *) Million t/a 26.5 39.1 69.3 85.1
CO2 to be captured *) Million t/a 36.7 54.1 94.5 116.5
1. Maximal – Theoretisch
CCS for 100% new STP and new CHPP; Retrofitting also at 100%
Additional demand for fuel PJ/a 80 118 206 254
CCS – capacity *) GWel 9.9 15.4 26.3 37.7
Net capacity GWel 8.0 12.4 21.5 30.6
Net electricity generation TWh/a 40.7 59.7 88.1 116.0
Avoided CO2 *) Million t/a 25.4 36.9 50.6 68.6
CO2 to be captured *) Million t/a 35.2 51.2 69.0 94.6
2. Maximal – Realistisch CCS for 100% new STP and 75% new CHPP; Retrofitting for 65% STP and 35% CHPP
Additional demand for fuel PJ/a 77 112 150 208
CCS – capacity *) GWel 9.9 15.4 19.7 29.6
Net capacity GWel 8.0 12.4 16.0 23.8
Net electricity generation TWh/a 40.7 59.7 67.5 91.0
Avoided CO2 *) Million t/a 25.4 36.9 40.1 54.4
CO2 to be captured *) Million t/a 35.2 51.2 55.4 75.8
3. Maximal – Neu
CCS for 100% new STP and 75% new CHPP; no retrofitting
Additional demand for fuel PJ/a 77 112 122 171
CCS – capacity *) GWel 6.8 10.3 16.2 24.2
Net capacity GWel 5.5 8.3 13.2 19.6
Net electricity generation TWh/a 29.0 41.9 56.0 77.0
Avoided CO2 *) Million t/a 18.3 26.2 32.5 46.1
CO2 to be captured *) Million t/a 25.4 36.5 44.5 63.8
4. Realistisch I
CCS for 75% new STP and 40% new CHPP; Retrofitting for 40% STP and 20% CHPP
Additional demand for fuel PJ/a 56 80 97 141
CCS – capacity *) GWel 6.5 9.6 13.4 20.3
Net capacity GWel 5.2 7.7 10.8 16.3
Net electricity generation TWh/a 28.1 40.1 48.9 68.6
Avoided CO2 *) Million t/a 18.0 25.7 30.5 43.7
CO2 to be captured *) Million t/a 25.1 35.8 41.9 60.8
5. Realistisch I – only KOHLE as in variant 4, but without gas power plants
Additional demand for fuel PJ/a 55 78 89 132
CCS – capacity *) GWel 4.7 7.1 11.7 17.2
Net capacity GWel 3.8 5.7 9.6 13.9
Net electricity generation TWh/a 19.7 28.5 40.2 53.9
Avoided CO2 *) Million t/a 12.3 17.8 23.3 32.1
CO2 to be captured *) Million t/a 17.2 24.7 31.6 44.4
6. Realistisch II
CCS for 50% new STP and 30% new CHPP; Retrofitting for 30% STP and 15% CHPP
Additional demand for fuel PJ/a 38 54 69 98
*) taking into consideration the additional required capacity and higher emissions due to the reduction of efficiency
in CO2 capture (“penalty load”), compared to the reference power plant without CCS
Source: Authors’ design
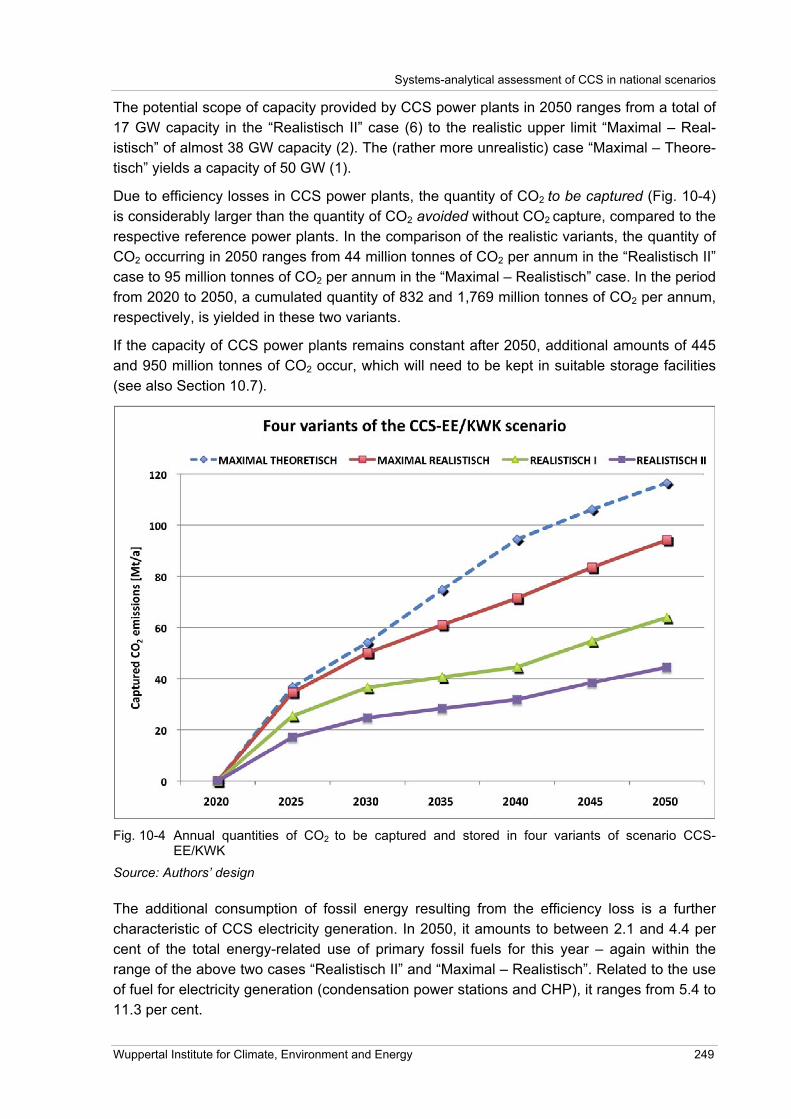
Systems-analytical assessment of CCS in national scenarios
Wuppertal Institute for Climate, Environment and Energy 249
The potential scope of capacity provided by CCS power plants in 2050 ranges from a total of
17 GW capacity in the “Realistisch II” case (6) to the realistic upper limit “Maximal – Real-
istisch” of almost 38 GW capacity (2). The (rather more unrealistic) case “Maximal – Theore-
tisch” yields a capacity of 50 GW (1).
Due to efficiency losses in CCS power plants, the quantity of CO2 to be captured (Fig. 10-4)
is considerably larger than the quantity of CO2 avoided without CO2 capture, compared to the
respective reference power plants. In the comparison of the realistic variants, the quantity of
CO2 occurring in 2050 ranges from 44 million tonnes of CO2 per annum in the “Realistisch II”
case to 95 million tonnes of CO2 per annum in the “Maximal – Realistisch” case. In the period
from 2020 to 2050, a cumulated quantity of 832 and 1,769 million tonnes of CO2 per annum,
respectively, is yielded in these two variants.
If the capacity of CCS power plants remains constant after 2050, additional amounts of 445
and 950 million tonnes of CO2 occur, which will need to be kept in suitable storage facilities
(see also Section 10.7).
Fig. 10-4 Annual quantities of CO2 to be captured and stored in four variants of scenario CCS-EE/KWK
Source: Authors’ design
The additional consumption of fossil energy resulting from the efficiency loss is a further
characteristic of CCS electricity generation. In 2050, it amounts to between 2.1 and 4.4 per
cent of the total energy-related use of primary fossil fuels for this year – again within the
range of the above two cases “Realistisch II” and “Maximal – Realistisch”. Related to the use
of fuel for electricity generation (condensation power stations and CHP), it ranges from 5.4 to
11.3 per cent.

RECCS plus – Update and Expansion of the RECCS Study
250 Final Report
Fig. 10-5 and Fig. 10-6 show the relationship between CCS electricity generation and CCS
capacity, compared with the overall system of power supply in the event of the implementa-
tion of scenario variant D. The constant expansion of renewable energies dominates the
electricity supply. The desired expansion of CHP in the decentralised area further restricts
the scope for the use of CCS technology. Even in the relatively optimistic case “Realistisch I”,
electricity generation from CCS power plants therefore only makes up a 12 per cent share of
the total power generation in 2050. The achievable proportion of capacity is lower, at 10.6
per cent.
Fig. 10-5 Overall electricity generation in variant D of the Lead Scenario 2008 and contribution of CCS in two variants of scenario CCS-EE/KWK
Source: Authors’ design
It must also be taken into consideration that an assumption has been made, in favour of
CCS, that all “new power plants” fired by fossil fuels (maximum 8 GW) constructed between
2005 and 2010 will also be replaced by CCS plants by 2050, after their 40-year service life.
These CCS power plants would remain on the grid up to the period of 2085 to 2090, which of
course would have an impact on the further expansion of electricity generation from renew-
ables from 2050.
Fig. 10-7 shows the CCS capacity to be installed according to power plant types in the
“Realistisch I” case. On average, 1 GW CCS capacity must be installed annually between
2020 and 2030; the value drops to an average of 0.55 GW/a between 2030 and 2050. Of the
24 GW CCS power plants installed in 2050, 13 GW are from hard coal-fired power plants, 7
GW from lignite-fired power plants and 4 GW from natural gas power plants. Compared with
the “Maximal – Theoretisch” case, it can be seen that almost 50 per cent of all large-scale
power plants fired by fossil fuel existing in 2050 will be equipped with CCS in the “Realistisch
I” case.
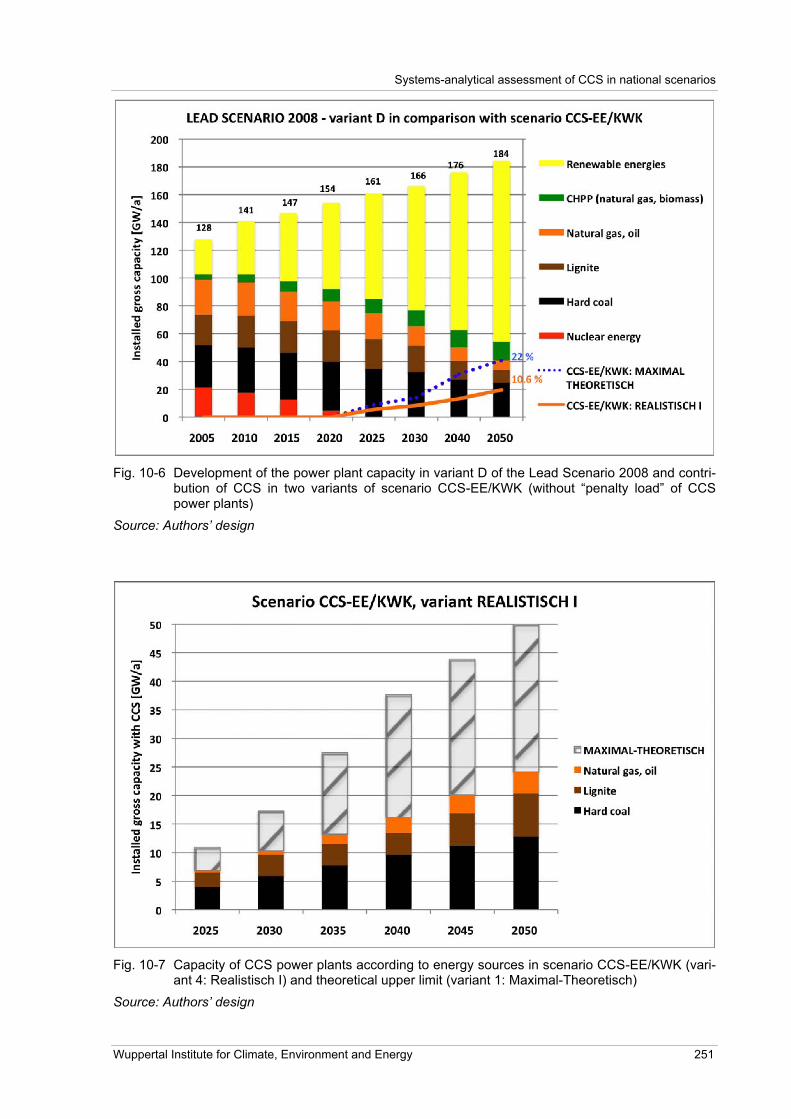
Systems-analytical assessment of CCS in national scenarios
Wuppertal Institute for Climate, Environment and Energy 251
Fig. 10-6 Development of the power plant capacity in variant D of the Lead Scenario 2008 and contri-bution of CCS in two variants of scenario CCS-EE/KWK (without “penalty load” of CCS power plants)
Source: Authors’ design
Fig. 10-7 Capacity of CCS power plants according to energy sources in scenario CCS-EE/KWK (vari-ant 4: Realistisch I) and theoretical upper limit (variant 1: Maximal-Theoretisch)
Source: Authors’ design

RECCS plus – Update and Expansion of the RECCS Study
252 Final Report
10.6 Conclusions from the scenario analysis
The potential role of CCS in the context of a German climate protection strategy largely de-
pends on previously selected energy strategies. In the occurrence of a continued significant
expansion of renewables and a steadily increasing share of combined heat and power gen-
eration in the German power supply, as shown in variant D of the Lead Scenario 2008, the
scope for a further reduction of CO2 in the remaining fossil segment of power supply using
CCS is considerably restricted. In the ideal case, variant “Realistisch I”, with an installed CCS
capacity of 24 GW, an average of 46 million tonnes of CO2 could be saved annually up to
2050, compared with an equally sized electricity generation without CCS. This amount con-
stitutes 18 per cent of the total avoidable CO2 emissions in the electricity sector between
2005 und 2050, and 8 per cent of that within the entire power supply.
The CO2 reductions achieved by expanding renewable energies and increasing efficiency in
the supply of heat and fuel are considerably larger for the same period. Even if there is a
great deal of uncertainty surrounding the costs involved, there is much to suggest that an
energy path characterised more strongly by renewable energies would be cheaper in the
medium to long term. However, it would necessitate a considerable restructuring of the
power industry and infrastructure – including the need for not only completely different net-
work structures but also energy storage facilities. In any case, CO2 reductions created by
efficiency improvements in the electricity sector can be achieved economically with high re-
turns.
The Lead Scenario 2008 and scenario variant D are based on the assumption of a scheduled
phasing out of nuclear energy. This leads to the creation of a demand for power plant ca-
pacity to fill this gap. This could then be met by renewable energies and carbon capture tech-
nologies. However, energy policy-makers are discussing the possible extension of the
operational life of nuclear power plants. If this were to happen, the opportunity for implement-
ing CCS is significantly reduced. This would impact upon the objective to realise a consider-
able expansion in the share of renewable energies in electricity generation.
Consequently, there may only be a “suboptimal” contribution left for potential CCS power
plants if it is assumed that considerable financial resources will be required for further re-
search, development and demonstration before CCS is commercially available. If, moreover,
the earliest opportunity for deployment remains around 2020, it is vital to enable the new
fossil fuel-fired power plants to be retrofitted as far as possible – even for medium-sized
combined heat and power plants – otherwise the achievable segment would be reduced
even further.76 In addition, a completely different mix of renewable energies, compatible with
an appropriate CCS power plant fleet, would be necessary, a mix that is not suitable for
compensating for fluctuating energies.
It follows from the analysis that the existing energy policy objectives of considerable im-
provements in efficiency (a doubling of energy productivity by 2020 compared to 1990 levels;
a 25 per cent share of combined heat and power generation in 2020) and the required sig-
76 However, it would be conceivable to postpone the coal-fired power plants currently at the planning stage and to initially concentrate on the planned expansion of renewable energies (50% share of power generation in 2030). If CCS power plants were commercially available on a suitable scale in 2030, no power plants would have to be retrofitted, but could be directly built from scratch.

Systems-analytical assessment of CCS in national scenarios
Wuppertal Institute for Climate, Environment and Energy 253
nificant expansion of renewable energies (a 30 to 35 per cent share of renewable energies in
electricity generation by 2020 and an approximately 50 per cent share by 2030) leave only
minimal scope for the substantial use of CCS technology, even in the case of ambitious cli-
mate protection targets. On the other hand, use of CCS technology would be prudent in a
future energy supply that only achieves moderate successes in increasing efficiency and
further expanding renewable energies, and which shows only little change compared to the
current situation with regard to its structural features.
10.7 Infrastructure expenditure for the transport and storage of the captured
carbon dioxide
Requirements concerning infrastructure planning
Finally, we will take a look at the infrastructure required to transport and store the captured
CO2. For this purpose, the scenarios considered in the RECCS study and the aforemen-
tioned scenario family CCS-EE/KWK, with its six sub-variants, will be explored. It is essential
to analyse the issue of infrastructure because, in practice, three challenges must be met si-
multaneously at the time of the CCS injection, as considered in the scenarios:
• It must be ensured that capture plants can be installed on a large scale within short pe-
riods of time.
• Suitable storage facilities must be available for the planned quantities of captured carbon
dioxide. To this end, each individual storage formation must first be examined to ascer-
tain its suitability. Then injection devices must be installed. Once storage has com-
menced, a monitoring programme is set up to establish, over the period of around five
years, whether the storage is indeed suitable for depositing CO2.
• By the time the individual power plants are ready for operation, a transport system (pre-
sumably pipelines) must also be in place. Since the volumes of storage formations are
generally restricted, and 600 million tonnes of CO2 can be captured from a power plant
the size of Neurath (2,200 MWel) alone throughout its life, one single pipeline to a
storage facility will not suffice – a network of pipelines with a number of basins will be
necessary.
It must be considered for all three aspects that appropriate capacities must be planned and
constructed not only in Germany, but presumably also in the Netherlands, Poland, England,
Spain and Denmark.
Overview of the quantities of captured carbon dioxide in the scenarios
In order to enable an assessment of the impact on a CO2 infrastructure to be made, Tab. 10-
5 shows the annually occurring quantities of captured CO2 for the RECCS scenarios “CCS-
MAX” and “CCS-BRIDGE” and the aforementioned scenario family CCS-EE/KWK, with its six
sub-variants. For information only, the results of a study commissioned by the Federal State
of North Rhine-Westphalia is also presented. In this study, the impact of a “CCS-Max strat-
egy” for NRW was analysed (WI 2009). In addition, the cumulated quantities of CO2 up to
2050 are given in the right-hand column.
While the annual quantities of captured CO2 from all power plants determine the capacity of
the pipeline(s) (and hence their diameter and width), the quantities calculated over the entire
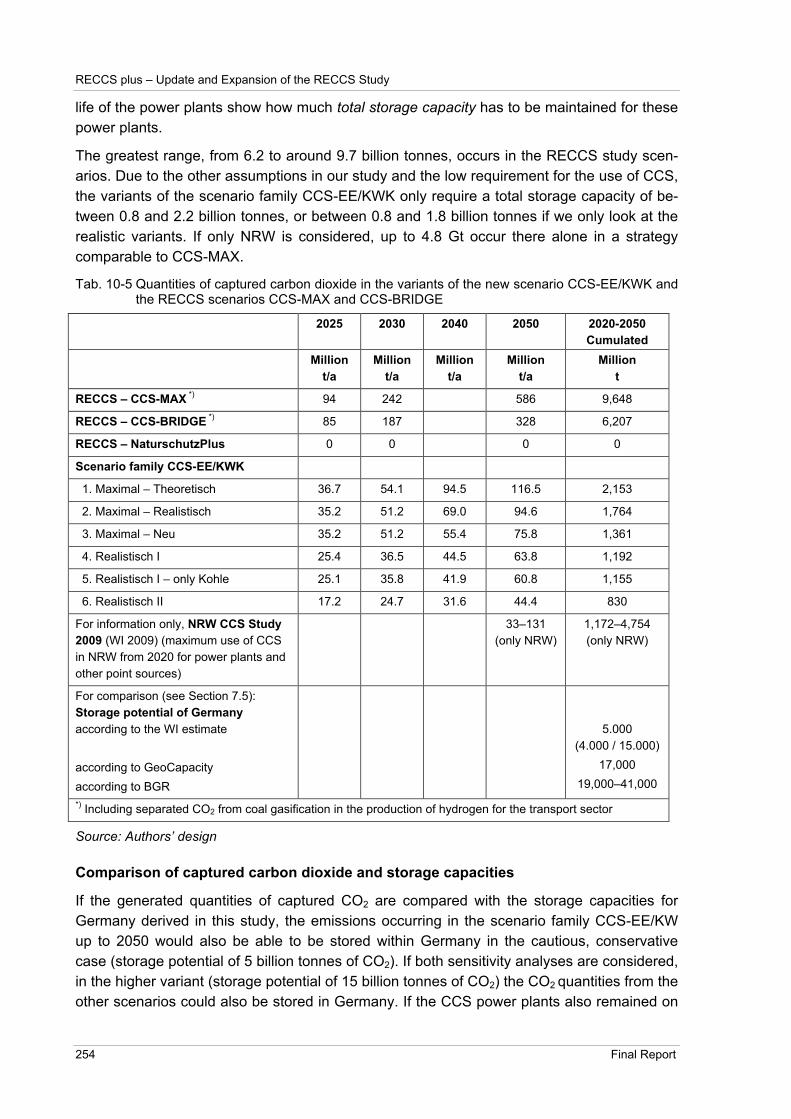
RECCS plus – Update and Expansion of the RECCS Study
254 Final Report
life of the power plants show how much total storage capacity has to be maintained for these
power plants.
The greatest range, from 6.2 to around 9.7 billion tonnes, occurs in the RECCS study scen-
arios. Due to the other assumptions in our study and the low requirement for the use of CCS,
the variants of the scenario family CCS-EE/KWK only require a total storage capacity of be-
tween 0.8 and 2.2 billion tonnes, or between 0.8 and 1.8 billion tonnes if we only look at the
realistic variants. If only NRW is considered, up to 4.8 Gt occur there alone in a strategy
comparable to CCS-MAX.
Tab. 10-5 Quantities of captured carbon dioxide in the variants of the new scenario CCS-EE/KWK and the RECCS scenarios CCS-MAX and CCS-BRIDGE
2025 2030 2040 2050 2020-2050
Cumulated
Million
t/a
Million
t/a
Million
t/a
Million
t/a
Million
t
RECCS – CCS-MAX *)
94 242 586 9,648
RECCS – CCS-BRIDGE *)
85 187 328 6,207
RECCS – NaturschutzPlus 0 0 0 0
Scenario family CCS-EE/KWK
1. Maximal – Theoretisch 36.7 54.1 94.5 116.5 2,153
2. Maximal – Realistisch 35.2 51.2 69.0 94.6 1,764
3. Maximal – Neu 35.2 51.2 55.4 75.8 1,361
4. Realistisch I 25.4 36.5 44.5 63.8 1,192
5. Realistisch I – only Kohle 25.1 35.8 41.9 60.8 1,155
6. Realistisch II 17.2 24.7 31.6 44.4 830
For information only, NRW CCS Study
2009 (WI 2009) (maximum use of CCS
in NRW from 2020 for power plants and
other point sources)
33–131
(only NRW)
1,172–4,754
(only NRW)
For comparison (see Section 7.5):
Storage potential of Germany
according to the WI estimate
according to GeoCapacity
according to BGR
5.000
(4.000 / 15.000)
17,000
19,000–41,000
*) Including separated CO2 from coal gasification in the production of hydrogen for the transport sector
Source: Authors’ design
Comparison of captured carbon dioxide and storage capacities
If the generated quantities of captured CO2 are compared with the storage capacities for
Germany derived in this study, the emissions occurring in the scenario family CCS-EE/KW
up to 2050 would also be able to be stored within Germany in the cautious, conservative
case (storage potential of 5 billion tonnes of CO2). If both sensitivity analyses are considered,
in the higher variant (storage potential of 15 billion tonnes of CO2) the CO2 quantities from the
other scenarios could also be stored in Germany. If the CCS power plants also remained on
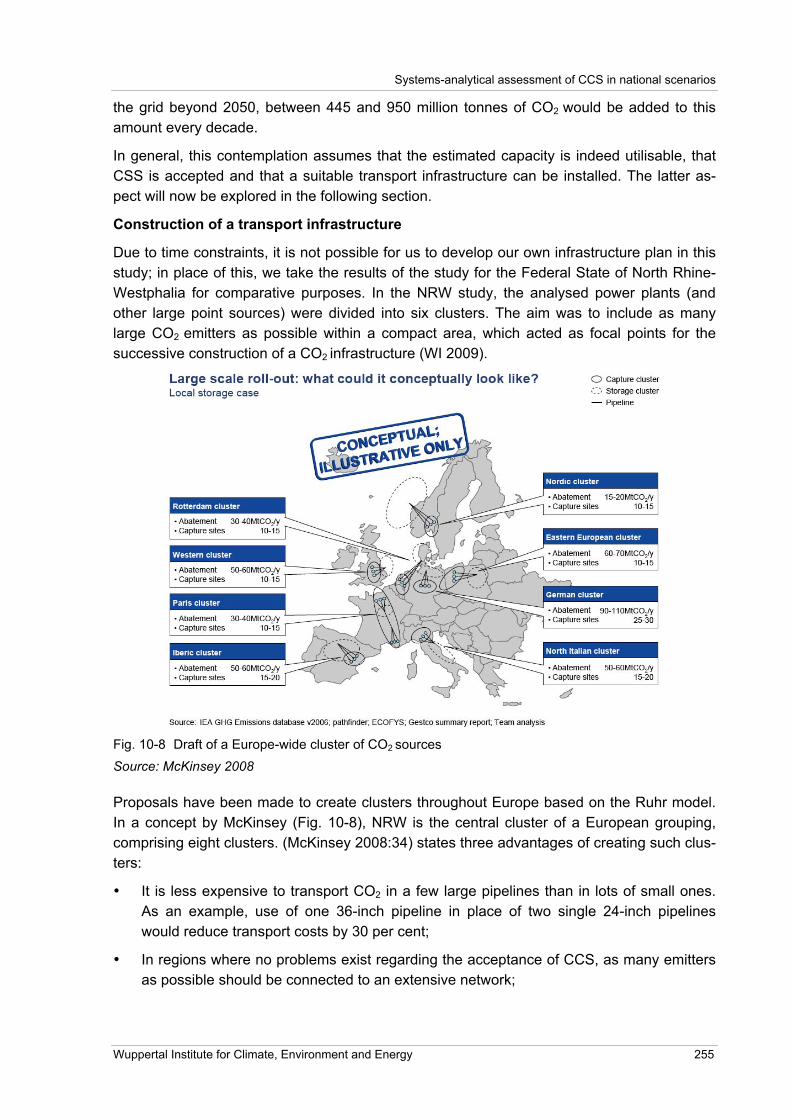
Systems-analytical assessment of CCS in national scenarios
Wuppertal Institute for Climate, Environment and Energy 255
the grid beyond 2050, between 445 and 950 million tonnes of CO2 would be added to this
amount every decade.
In general, this contemplation assumes that the estimated capacity is indeed utilisable, that
CSS is accepted and that a suitable transport infrastructure can be installed. The latter as-
pect will now be explored in the following section.
Construction of a transport infrastructure
Due to time constraints, it is not possible for us to develop our own infrastructure plan in this
study; in place of this, we take the results of the study for the Federal State of North Rhine-
Westphalia for comparative purposes. In the NRW study, the analysed power plants (and
other large point sources) were divided into six clusters. The aim was to include as many
large CO2 emitters as possible within a compact area, which acted as focal points for the
successive construction of a CO2 infrastructure (WI 2009).
Fig. 10-8 Draft of a Europe-wide cluster of CO2 sources
Source: McKinsey 2008
Proposals have been made to create clusters throughout Europe based on the Ruhr model.
In a concept by McKinsey (Fig. 10-8), NRW is the central cluster of a European grouping,
comprising eight clusters. (McKinsey 2008:34) states three advantages of creating such clus-
ters:
• It is less expensive to transport CO2 in a few large pipelines than in lots of small ones.
As an example, use of one 36-inch pipeline in place of two single 24-inch pipelines
would reduce transport costs by 30 per cent;
• In regions where no problems exist regarding the acceptance of CCS, as many emitters
as possible should be connected to an extensive network;

RECCS plus – Update and Expansion of the RECCS Study
256 Final Report
• Most of the largest emitters are situated in highly industrialised regions. In this case, a
CCS cluster could also serve as a focal point for the advancement or diversification of
existing industry.
The transport routes portrayed in Fig. 13-1 (see Appendix) give an example of transport ex-
penditure if the quantities of CO2 captured in the maximum case for NRW, 131 million tonnes
of CO2 per annum, would have to be transported. They are in the same range as the maxi-
mum quantities of 117 million tonnes of CO2 per annum generated for the Maximal – Theore-
tisch variant.
Three cases can be differentiated here:
a) Onshore storage in (randomly selected) formations in northern Germany (total pipeline
length 4,330 km)
b) Offshore storage in the Utsira formation near Norway (8,380 km)
c) Transfer to the planned Dutch CO2 network and transit to Dutch offshore formations
(1,140 km, German section only).
Depending on the density of the routes, generated using a geographic information system
and highlighted in different colours, up to ten parallel pipelines are required. If the “Maximal-
Theoretisch” variant were implemented, a transport expenditure of the same high magnitude
would be expected. It goes without saying that other power plant sites would have to be
taken into consideration – this presentation merely highlights the infrastructural requirements
for such a CCS strategy.

Conclusive integrated assessment of CCS for fossil fuel-fired power plants and research recommendations
Wuppertal Institute for Climate, Environment and Energy 257
11 Conclusive integrated assessment of CCS for fossil fuel-fired
power plants and research recommendations
11.1 Objectives
The development and demonstration of CCS for fossil fuel-fired power plants has become
increasingly prominent in Germany, the rest of the European Union and many other countries
(China, the USA and Australia were analysed).
Particularly at the international level, CCS is considered to be vital for meeting global targets
for reducing CO2. In its “Blue Map” scenario of “Energy Technology Perspectives”, for exam-
ple, the International Energy Agency estimates that a 50 per cent reduction in global CO2
emissions by 2050 (compared to current levels) would require a 48 gigatonne reduction in
CO2 compared to the business-as-usual path (IEA 2008). It has been calculated that CCS
can make a 19 per cent contribution to this decrease, with the CO2 being captured from
power stations and industrial sites in roughly equal measures. The maximum reduction in
CO2 as a result of using CCS is 9.1 gigatonnes. Consequently, CCS would make a substan-
tial contribution to achieving the 50 per cent reduction target.77
The European Union also supports the development and take-up of CCS technology. One of
the aims, triggered also by deliberations about improving the security of supply, is to be able
to use the resource potential of coal without multiplying greenhouse gas emissions. Never-
theless, the European Commission has stated that it believes CCS to be “highly important”
from a global perspective. This is because coal reserves will have to be used in future, not
only to supply energy to Europe, but also to meet the ever-increasing need for energy in de-
veloping and transition countries (European Commission 2008). In the SET Plan (“European
Strategic Energy Technology Plan”), adopted in 2007, CCS is listed as one of six key tech-
nologies to be supported in terms of industrial policy up to 2020. To work towards achieving
this target, the EU has devised a “CCS Directive” within the space of just one year. This di-
rective came into force in June 2009 as part of the “Green Package” (see Sections 2.1.2 and
6.1).
Although no quantitative targets have yet been set in Germany, a variety of development
projects have been funded by the German Federal Ministries of Economics and Technology
(BMWi) and Education and Research (BMBF). The further development of the climate-
friendly generation of electricity from coal is identified as an important task in the integrated
energy and climate protection programme. With a few exceptions, political parties, trade un-
ions and industry associations are in favour of further testing and gradually implementing
CCS technology. The “energy concept”, which is expected to be passed by the German gov-
ernment in autumn 2010, is likely to provide at least a basic statement on the potential share
of CCS in German reduction targets.
77 According to findings from climate research, a 50 per cent reduction target will not suffice to limit the rise in temperature to 2 degrees. In fact, the IPCC assumes that a minus 50 to minus 85 per cent global reduction in greenhouse gas emissions in 2050 compared to 2000 is quite likely to be required to restrict the tempera-ture limit (IPCC 2007).
RECCS plus – Update and Expansion of the RECCS Study
258 Final Report
Numerous capture processes are being developed worldwide using the various available
individual technological options. The majority of the research projects are concentrating on
the post-combustion process, for which there are also the most suppliers. In addition to a
variety of capture processes within the absorption, adsorption and membrane methods, re-
cent interest has focused on biological processes (using algae or enzymes). Despite the fact
that post-combustion technology is the least efficient of these processes, research into this
technology has been prioritised with a view to potentially retrofitting power stations.
11.2 Factors determining the introduction of CCS
If we focus on the state of the technical development, policy frameworks and previously pub-
lished scientific research, six crucial factors determining the introduction of CCS should be
highlighted. It is vitally important to consider CCS as part of an over-arching analysis of sev-
eral climate protection options, rather than from an individual perspective.
1. Large-scale availability of the technology
Numerous uncertainties exist with regard to the applicability of CCS and the resulting (quanti-
tative) role of CCS for climate protection. One of these main uncertainties is the issue of how
much time will elapse between the end of testing and actual commercial realisation.
Previous experience has shown that upgrading from pilot plant stage to large-scale commer-
cial availability (here 700 to 2,000 MWel power plant capacity) cannot usually be achieved in
anything less than ten years. This difficulty is compounded by the fact that there is consider-
able need for further research and development before CO2 separation can be deployed.
Moreover, in the case of CCS, it is not simply “just” about the actual power plant and CO2
capture. The other links in the CCS chain must also be ready for operation at the same time:
a CO2 transport infrastructure must be established; operational and safe storage sites must
be available, which must be able to absorb the enormous quantities of CO2 emitted from a
large-scale power plant (100 to 400 million tonnes for the duration of its lifespan) from the
moment they occur. Taking just one aspect of the process, the European Technology Plat-
form estimates that it will probably take up to 6.5 years for a storage site to be approved; it
expects the whole chain of one single CCS project to be realised in 6.5 to 10 years (ZEP
2008:23).
For this reason, commitment to the timescale for commercial availability of the whole CCS
chain (separation, transport and storage) is consistently being deferred in the latest publica-
tions and announcements by industry. The years between 2025 and 2030 are now increas-
ingly being referred to as the time by which the technology will be ready for operation (MIT
2007, ZEP 2008, Greenpeace 2008). The uncertainties regarding the availability of the tech-
nology are reflected in individual companies’ business activities. Dong Energy, for instance,
announced that it intends to follow a different course beyond fossil fuels in the medium term
in Germany. Other companies believe the commercialisation phase of CCS will not begin
until 2030 at the earliest.
From the perspectives of the power industry and climate policy, the implications of a later
implementation of CCS should be reviewed in the context of the call by climate scientists that
global CO2 emissions must peak sometime between 2010 and 2020 to trigger a reduction
towards a 450 ppm path in time (IPCC 2007). For this reason, the agenda for global climate

Conclusive integrated assessment of CCS for fossil fuel-fired power plants and research recommendations
Wuppertal Institute for Climate, Environment and Energy 259
protection must be set in the next ten years. Essentially, this can only succeed using tech-
nologies that are established and basically applicable now.
These include the whole range of technologies to increase energy efficiency and, primarily,
renewables. To this end, the European Union has already adjudicated that its Member States
feed 20 per cent of their total energy requirements from renewable energies by 2020; the
figure is expected to increase steadily after this date. In Germany, this signifies a commit-
ment to cover 18 per cent of final energy consumption and, following exemplary calculations
to this end, at least 30 per cent of power consumption from renewable energies by 2020.
This figure is by no means overambitious if renewable energies continue to expand any way
near as dynamically as they have done over the last 15 years. Even if considerable effort is
still required to achieve these targets with regard to establishing a suitable infrastructure (ex-
pansion of power networks, power storage), this potential outcome nevertheless leads to
conclusions that:
• the use of CCS for power plants (assuming the later availability of the technology) in-
creasingly loses the potential role ascribed to it as a bridging technology;
• CCS for power stations could primarily play a supplementary role (for example, if the
further expansion of renewable energies should stagnate, or the full potential of energy
efficiency be exhausted) or
• the implementation of CCS technology will increasingly focus on other large point sour-
ces from the industrial sector, where the fields of application of renewables and other
climate protection measures are limited.
2. Available potential for CCS
The potential role of CCS depends not only on the expected timing of its application but also
on general developments in the fossil fuel-fired power plant sector. Due to the current power
plant regeneration programme, CO2 capture has arrived too late to be included directly in the
planning phase of the majority of fossil fuel-fired power installations in Germany. For this
reason, the issue of retrofitting power plants is of major importance for the implementation of
CCS technology in Germany. Various economic criteria are involved here, including an ad-
equate remaining service life or, expressed differently, an adequate maximum age of the
plants, as a prerequisite. In McKinsey’s analyses, for instance, a lifespan of 12 years is as-
sumed, after which it is not worth retrofitting a power plant with CO2 capture facilities (McKin-
sey 2008).
It is crucial, therefore, that power stations currently under construction can be retrofitted at a
later stage. Capture readiness is mandatory for new power plants according to the CCS Di-
rective of the European Union. Tests must prove that suitable storage sites are available,
that transport facilities are technically and economically feasible and that CO2 capture instal-
lations can be retrofitted. The draft of the German CCS law (and subsequently the amend-
ment of the 13th Federal Immission Control Ordinance), however, only specified that suitable
space must be set aside at the site. Permits granted would then also be considered valid if
no suitable CO2 storage sites were available, or if there was technical and economical rea-
sonable access to CO2 pipelines, or if it was not technically possible or economically reason-
able to retrofit CO2 capture plants.

RECCS plus – Update and Expansion of the RECCS Study
260 Final Report
In spite of the current wisdom about the maximum age for retrofitting power stations, in the
scenario analysis presented here, an optimistic outlook is presented, assuming that the retro-
fit could be carried out even 20 years after the construction of the plant. Furthermore, it as-
sumes that CCS will be available from 2020. In the best outcome, (scenario “Realistisch I”),
an average of 46 million tonnes of CO2 can be avoided annually up to 2050 with an installed
CCS capacity of 24 gigawatts (new construction of 75 per cent of steam and 40 per cent of
combined heat and power stations with CCS; retrofitting of 40 per cent of steam and 20 cent
of combined heat and power plants), totalling 1.2 billion tonnes by 2050. This amount consti-
tutes 18 per cent of the total avoidable CO2 emissions in the electricity sector between 2005
and 2050, and 8 per cent of that within the entire power supply system. It is assumed here
that, by complying with existing basic political goals, not only the above-mentioned targets to
expand the share of renewable energies, but also the doubling of energy productivity by
2020 (compared to 1990 levels) and the share of combined heat and power, rising to 25 per
cent, will be detrimental to exploiting the full potential of CCS. The analysis therefore shows
that
• even with ambitious climate protection targets, there is little room for a substantial use of
CCS technology (in power plants) in Germany if the stipulation of expanding CHP and
increasing energy productivity is to be adhered to simultaneously;
• this potential is reduced considerably further if the commercial implementation of CCS is
postponed to 2025 or 2030 (whilst retaining the intention to achieve a dramatic rise in
the share of renewable energies by 205078);
• an extension of the operating lives of nuclear power plants is currently under discussion,
which would significantly reduce the potential for introducing CCS (in power plants) in
Germany.
3. Development of the relative costs of power plants with CCS and renewable ener-
gies
The economic assessment of power plants with downstream CCS depends not only on the
question of when the additional costs for CO2 capture are lower than the costs for acquiring
CO2 allowances. It is more about determining relative cost effectiveness. To this end, the
timing of competing climate protection options, such as renewables, must also be taken into
account. The analysis carried out in the present study principally confirms the findings of the
first RECCS study. Although the costs of fossil fuel-fired power plants and renewable ener-
gies are higher than in the previous study, the break-even point at which the electricity gen-
erating costs of renewables will be cheaper than those of CCS power plants will still fall be-
tween 2020 and 2030. If the dynamics of the expansion of renewables in the electricity sector
remain high, individual renewable energy technologies (offshore and onshore wind power,
solar thermal power plants) will be able to compete with CCS power plants as early as in
2020. An average mix of renewable energies assumed here is showing signs of being par-
tially competitive already.
78 According to a statement by the German Minister of the Environment Dr. Röttgen, the new German gov-ernment has “stated the objective to almost entirely convert power generation to renewable sources by 2050” (BMU 2009b).

Conclusive integrated assessment of CCS for fossil fuel-fired power plants and research recommendations
Wuppertal Institute for Climate, Environment and Energy 261
• If fuel prices increase considerably and the cost of CO2 permits remains low, the gener-
ating costs of CCS-based natural gas and hard coal-fired power plants will be higher
than with renewable energies from 2020. Lignite-fired CCS power plants will follow from
2025 (offshore wind/solar thermal energy) and 2030 (mix of renewable energies).
• Even in the case of very low increases in energy prices (but higher CO2 penalties), the
additional costs incurred by CCS would be so high that renewable energies would re-
main competitive at the same time as in the high price scenario. The high CO2 penalty,
which cannot be fully compensated by CO2 capture, has a particularly significant impact
on lignite.
• If CCS can only be realised later, the increases in costs previously assumed for 2020
during the introduction of CCS would be postponed to later years (2025 or 2030). This
would mean, however, that renewable energies would be able to produce energy more
cheaply in both the low and high price scenarios as early as from when CCS is first in-
troduced.
• In addition to the assumed increases in energy prices, the economics of CCS power
plants are also affected by the fact that their full load hours will be halved by 2050, due
to the assumed premise of the increased production of renewable energies.
4. Holistic assessment of environmental impacts
Only CO2 emissions created directly at the power plant are generally included in the debate
on CCS as a climate protection option. If a potential capture of 90 per cent is assumed, this
would lead us to expect a high impact on climate. As already shown in the first RECCS
study, however, it is also necessary to take a holistic approach with regard to environmental
impacts that should additionally take the following aspects into account:
• CO2 capture involves a considerable additional consumption of non-renewable re-
sources, with all of the associated consequences;
• due to the additional consumption of primary energy, CO2 emissions in the power plant
process initially rise, so that the actual quantity of CO2 avoided is considerably lower
than the quantity of CO2 captured (called the avoidance efficiency by Koornneef et al.
(2008b));
• when determining the greenhouse gas avoidance efficiency, the whole CCS chain, in-
cluding the upstream chain of the individual energy and material flows, must be taken
into account in addition to the power plant processes;
• political goals focus on a reduction in emissions of all greenhouse gases. Due to the
additional consumption of primary energy and the other stages in the process chain,
there would be a rise in non-CO2 emissions, in particular, which cannot be collected by
the capture process. It was shown in the previous study that greenhouse gas emissions
from CCS power stations due to be operational by 2020 will only be reduced in total by
around 68 to 87 per cent, depending on the technology (up to 95 per cent only in excep-
tional cases of specific combinations of technologies and fuels79);
79 95 per cent net reduction of greenhouse gases could be achieved with lignite-fired steam power plants equipped with oxyfuel technology if a 99.5 per cent CO2 capture rate is possible.
RECCS plus – Update and Expansion of the RECCS Study
262 Final Report
• some of the other numerous environmental factors increase considerably (and can only
be effectively reduced by pure oxygen combustion). This is also due to the additional
consumption of energy.
As this analysis shows, when looking holistically at the environmental picture, CCS technol-
ogy is in itself neither beneficial nor sustainable. It is the responsibility of politicians to delib-
erate about whether a reduction in CO2 emissions can be reconciled with the consequences
described here or whether other energy technologies without these disadvantages are pre-
ferable. Besides renewable energies, these include existing fossil technologies, such as CHP
plants based on natural gas, which already achieve the emission targets set for the future for
CCS technologies.
5. Storage site capacity and public acceptance
As investigations have shown, the availability of long-term, stable storage sites, in particular,
will be pivotal in determining the acceptance of CCS technology by the general public. There
is likely to be a groundswell of protest from bodies such as NGOs, churches and the federal
state governments from the areas earmarked as potential storage locations. In terms of
transport, the debate has focused on RWE’s planned pipeline from Hürth to North Frisia,
although the first exploration tests by utility companies were carried out in Brandenburg and,
most prolifically, in Schleswig-Holstein. Compared to the first RECCS study, therefore, the
range of stakeholders has been extended to political and social stakeholders from the stor-
age regions. The issue of public acceptance has risen far higher up the agenda than was the
case three years ago. If CCS technology should prove to be technically viable, commercially
available and even competitive, in spite of the presented cost scenarios, the decisive factors
are likely to be the question of the availability of suitable storage sites and gaining public ac-
ceptance of their use on a large scale.
Scientifically, the question of the availability of potential storage sites for CO2 emissions from
Germany ultimately remains unanswered. The scope of this analysis was, therefore, not re-
stricted to Germany, but was extended to Germany’s neighbours where there may be scope
for their storing German CO2 emissions. The objectives were:
• to systematically analyse and compare existing estimates of storage site capacities with
regard to their methods and assumptions, and
• to present a conservative estimate, a lower limit, as a benchmark for potential investors
and politicians.
The main findings of the analysis are that:
• there are significant uncertainties surrounding the information about storage potentials
(this applies explicitly to the conservative calculation, too);
• the specific basic assumptions from the existing studies could not always be applied
adequately to this analysis, thereby making it difficult to produce a comparative study;
• according to existing studies, the storage potential within Germany is estimated to be up
to 44 billion tonnes;

Conclusive integrated assessment of CCS for fossil fuel-fired power plants and research recommendations
Wuppertal Institute for Climate, Environment and Energy 263
• taking a cautious, conservative estimate, the available storage capacity must be as-
sumed to be significantly limited (5 billion tonnes of CO2 was estimated, assuming
closed systems and a subsequent efficiency factor of 0.1 per cent for saline aquifers);
• in the event of higher demands, it would be necessary to switch storage to areas in Brit-
ish and Norwegian waters of the North Sea, where there is expected to be sufficient po-
tential;
• even using the conservative estimate, however, the emissions projected in this scenario,
which are intended to be realistic, calculate 1.2 billion tonnes of CO2 up to 2050 for the
power plant sector that could need storing, in addition to further industrial emissions;
• EOR (enhanced oil recovery) could act as an inroad for CCS in Europe, if sufficient CO2
could be made available by 2020. However, this would not be appropriate as an inde-
pendent climate protection option;
• guidelines for a standardised and documented estimate of storage potentials are re-
quired because huge deviations exist in the approach pursued by individual studies, both
in their assumption of central parameters and, in particular, in the documentation of
these assumptions.
The “storage cadastre”, currently being drawn up by the BGR, is expected to constitute a
considerable improvement in terms of clarifying data availability, since all existing geological
investigations at federal state level will be brought together. Nonetheless, considerable un-
certainty will remain until potential storage sites for CO2 are not investigated individually.
Regardless of the eventual realisable capacity, the question of whether this potential could
be exploited quickly enough remains unanswered. It has not yet been explored whether there
will be sufficient quantities of CO2 in a short space of time, as might be expected from a con-
stant flow from large-scale power plants, that can be injected into a storage site. Based on
BGR’s assumptions on storage sites in Germany, (Gerling 2010) estimates the maximum
quantity of CO2 that can be injected annually to be 50 to 75 million tonnes. This amount
would suffice for the “Realistisch I” scenario, but not for any larger capture quantities. For this
reason, it is recommended that there is an investigation of the infrastructure required and the
quantities of CO2 to be transported and injected, using various capacity scenarios for storage
sites (RECCS plus, GeoCapacity, BGR), coupled with emissions scenarios (for example from
Chapter 10). The production capacity available to plants for the capture and injection of CO2
should also be included in the timeline. There has already been a basic study of this for
North Rhine-Westphalia in the present analyses (WI 2009). Such a study could be developed
by using scenarios to show which CCS potential in Germany would realistically have to be
available.
6. CCS legislation
A decisive factor affecting the introduction of CCS is the relevant legislation, since it affects
the timescale of the implementation. The European “CCS Directive” is considered to be the
framework for all activities along the CCS chain. In June 2009, the European Union adopted
the CCS Directive, which is to be incorporated into the national law of all Member States
within two years. This Directive, along with other modified legislation, constitutes a compre-
hensive policy for the use of CCS technology valid in all EU Member States that is suitable

RECCS plus – Update and Expansion of the RECCS Study
264 Final Report
for achieving the pursued objectives. By integrating the entire CCS process chain into the
European emission trading system, a tool for CCS will be activated that can be used to pro-
vide incentives to investors from both an investment security and an economic perspective.
The Directive does not provide guidelines on how authorities should prioritise between differ-
ent competing projects requiring the same geological formation to be present (for instance,
geothermal energy or gas storage versus CO2 storage). Nor does it prescribe which project
the respective authority should prioritise.
Regarding available applicable law in individual countries and the planned transposition of
the EU Directive, it can be said that
• the applicable law is not suitable for capturing the whole CCS process chain, in particu-
lar with regard to storage;
• the prompt creation of a suitable legal framework for CCS is necessary to provide legal
and investment security;
• given the gaps in the knowledge, a CCS law should provisionally only enable R&D and
demonstration projects and then be scheduled for subsequent review;
• provisions in anticipation of the need to detect, assess and solve conflicts of interest as a
result of a large-scale use of the CCS process should be accommodated.
11.3 CCS in the international focus
In view of the limitations presented here, the position of focusing on CCS as an option in the
power plant sector while simultaneously retaining the current energy policy priorities (expan-
sion of renewable energies and CHP, exhaustion of efficiency potentials and possibly ex-
tending the lifespan of nuclear power plants) is becoming increasingly untenable. Although
most of the results from the present study relate to Germany, similar conclusions may well be
applicable for the rest of Europe, in view of EU guidelines to expand renewable energies and
increase energy efficiency.
Nevertheless, globally, CCS remains an important climate protection technology: coal-
consuming countries such as China and India are increasingly moving centre stage into the
debate, and these countries may not have the option of rapidly expanding renewable ener-
gies. For this reason, research, development and demonstration in the power plant sector
continue to be important activities, as long as they are not at the expense of funding for re-
newable energies. But the questions set out above are also increasingly coming to the fore,
drawing attention to the timeline: what potential does the fossil power plant mix offer in the
medium to long term? Which power stations will possess the necessary criteria to make them
eligible for retrofitting? Alternatively, should they be rebuilt as CCS power plants if the CCS
chain is potentially only available for use from 2030? These questions will be explored in the
follow-up project “CCS global”, which was launched at the end of 2009 in collaboration with
Deutsche Gesellschaft für Technische Zusammenarbeit (GTZ) GmbH.
11.4 CCS in industry and in the use of biomass
In Germany, the debate is increasingly being directed towards alternative applications of
CCS. Whereas politicians, utility companies and lobby groups still focus mainly on CCS in

Conclusive integrated assessment of CCS for fossil fuel-fired power plants and research recommendations
Wuppertal Institute for Climate, Environment and Energy 265
the power plant sector, research institutes, advisory bodies and NGOs are increasingly em-
phasising that the capture of CO2 at industrial point sources and biomass power plants out-
weigh this in importance (see the analysis of stakeholders in Chapter 5). These options for
use have only been touched upon in the present study (Section 2.2), but should nevertheless
be considered briefly here.
1. CO2 capture at industrial point sources
Whereas only greenhouse gas emissions with a target of minus 80 per cent were usually
considered in national climate scenarios, in light of higher reductions now being demanded
(90 to 95 per cent by 2050), industry will also have to considerably reduce its emissions.
In general terms, steelworks, the glass industry, the cement industry, parts of the chemical
industry and mineral oil and gas refineries are viewed as industrial point sources with a po-
tential for CCS. In many processes, CO2 is emitted in a highly concentrated state (3 to 25 per
cent), and could therefore be separated more easily than from the flue gases of power sta-
tions (3 to 5 per cent). In addition, unlike with CCS in the power plant sector, in the industrial
context there are virtually no alternative options available that could assist in a further reduc-
tion of CO2 emissions. Industry can only resort to using electricity and heat from renewable
energies, where they are used directly (for example, in electricity powered steelworks). In
contrast, a significant share of emissions is process-immanent, and cannot be avoided by
applying measures such as renewable energies. There is still a definite need for research
into the fields of application of CCS in industry across all sectors.
There has not yet been any estimate of the CCS potential for industrial point sources in
Germany, hence the proposal of the following research programme:
• For all process steps in which CO2 is emitted but cannot be replaced directly by renew-
able energies, an investigation must be carried out into which alternative methods have
already been applied, together with the timeline, costs and reduction rates involved in
developing such methods.
• From the remaining processes, we must then identify which processes emit CO2 in such
a concentrated state that it can be separated and then linked to economic estimates.
• With regard to alternative possibilities, there should be investigations into the extent to
which other products and processes can be devised and applied that can lead to a de-
creased occurrence of CO2 emissions (for example, through enhanced technology,
higher efficiency, other raw materials, etc.).
2. CO2 capture at biomass power plants
The application of CCS in biomass plants (power and heat production, fuels) is of interest
because “negative” CO2 emissions can be achieved. By separating the CO2 absorbed by
plants during growth, CO2 could not only be avoided, but extracted long-term from the at-
mosphere. This could become relevant if it proves to be impossible to achieve the set reduc-
tion targets in other areas. The Bellona scenario, for instance, calculates for “carbon negative
energy” an 18 per cent share in the total reductions in 2050 (Bellona 2008); in the current
scenarios with the aim of stabilising greenhouse gas emissions at 400 ppm CO2 equivalents,
“the use of biomass in combination with CCS plays a crucial role,” whereby the biomass po-
tential determines the costs of this climate protection option (Edenhofer et al. 2010).

RECCS plus – Update and Expansion of the RECCS Study
266 Final Report
Whereas also (Vuuren et al. 2007) and (Schellnhuber 2009) point to relevant scenarios,
there is a need for research into the specific CCS potential that could be implemented in
Germany. To this end, it must be taken into account that
• biomass plants for generating electricity currently have a maximum capacity of 30 MWel,
and the degree of utilisation is only around 20 per cent, meaning that there is consider-
able potential for development to link them to an option that is primarily applicable on a
large scale, such as CO2 capture;
• here, again, not only avoided CO2 emissions, but all of the environmental impacts that
occur along the whole cultivation and use chain must be taken into account (for instance,
the considerably more powerful greenhouse gas N2O is created in this case);
• the use of biomass for energy purposes is associated with a multitude of other problems,
such as deforestation, monocultures, interactions with the agri-food sector, water short-
ages or, in the long term, a lack of nutrients in soils.
Due to the limited availability of suitable CO2 storage sites, the potential use of CCS should
mainly occur in the industrial sector and for biomass plants. So far, there are no clear, reli-
able figures for the capacities that could in fact be used in suitable geological formations. If
conservative estimates should turn out to be realistic, this space should initially be reserved
for these applications. For biomass, however, these storage potentials would only be used in
around 40 years. Any usage strategy that allocates them without respect for future require-
ments with instead cost efficiency being the focus, i.e. along the lines of “whoever comes first
will receive the most favourable storage complexes for free” must be rejected in favour of
intergenerational justice. Storage complexes are a scarce good; parallels can be drawn be-
tween them and the earth’s atmosphere as a store for greenhouse gas emissions.
The separation of CO2 in industry and for biomass plants would have the added advantage
that they generally create fewer emissions than large power stations, enabling the gases to
be injected into smaller storage sites. With power plants, however, between 100 and 400
megatonnes can be emitted in their lifetime, meaning that emissions from such plants will
rarely be deposited at one single storage site.
Based on the results of this study, it is therefore recommended that major attention is given
first to the two options of industry and biomass, rather than to power plants, and that their
CCS potential for Germany is explored.

References
Wuppertal Institute for Climate, Environment and Energy 267
12 References
Anderson, J.; de Coninck, H.; Curnow, P.; Flach, T.; Reiner, D.; Richardson, P.; Shackley, S.; Upham, P.; Sigurthorsson, G. (2007): The ACCSEPT project: Summary of the Main Findings and Key Recommendations. Det Norske Veritas. Abgerufen von www.accsept.org. Last access 10.01.2010.
Anderson, J. L.; Dixon, J.K.; Muldoon, M.; Brennecke, J.F.; Maginn, E.J. (2007): Ionic Liquids as CO2 Capture Media, Präsentation vom 11. Juli 2007 auf der Chemrawn XVII. http://www.chem.queensu.ca/Conferences/CHEMRAWN/Anderson_54.ppt. Last access 30.09.2009.
Andrus (2009): Chemical Looping Combustion Coal Power Technology Development Prototype. Prä-sentation auf der „CO2 Capture Technology Conference” am 24.03.2009, Pittsburgh.
Asmus, S. (2008): CO2-Verbringung in tiefe geologische Formationen. Presentation. Braunkohlentag 2008. http://www.braunkohle.de/pages/veranstaltungen.php?page=734. Last access 30.09.2009.
Asmus, S.; Dose, T. (2008): Storing CO2 deep underground. World of Mining - Surface and Under-ground, 60(5)294–303.
Ausfelder, F.; Bazzanell, A. (2008): Verwertung und Speicherung von CO2, Dechema Diskussionspa-pier, Oktober 2008.
Australian Coal Association (2009): Coal 21 & Other Initiatives – Other Initiatives, http://www.australiancoal.com.au/coal21-and-other-initiatives_other-initiatives.aspx. Last access 04.09.2009.
AWi (Alfred-Wegener-Institut für Polar- und Meeresforschung) (2009): Polarsternexpedition Lohafex gibt neue Einblicke in die Planktonökologie – wenig atmosphärisches Kohlendioxid im Südli-chem Ozean gebunden. Pressemitteilung vom 23.03.2009.
Baake, R.; Ziehm, C. (2009): CCS-Gesetzentwurf widerspricht Europarecht und effektivem Klima-schutz, Solarzeitalter 1/2009, S. 19-24.
Bachu, S.; Bonijoly, D.; Bradshaw, J.; Burruss, R.; Christensen, N. P.; Holloway, S.; Mathiassen, O. M. (2007): Task Force for Review and Identification of Standards for CO2-Storage Capacity Esti-mation. Phase II Final Report, Carbon Sequestration Leadership Forum.
Balbinski, E.; Goodfield, M.; Goodyear, S.; Jayasekera, T.; Woods, C. (2003): Potential for Enhanced Oil Recovery from CO2 Injection into UKCS Oil Fields. 24th IEA Symposium on Enhanced Oil Recovery.
Barzantny, K.; Achner, S.; Vomberg, S.; Groscurth, H.-M.; Böhling, A.; Breuer, T. (2009): Energie. Klimaschutz: Plan B 2050. Energiekonzept für Deutschland (Langfassung). Hrsg. Greenpeace e.V. 2009. Hamburg.
Bauer, Chr.; Heck, Th.; Dones, R.; Mayer-Spohn, O.; Blesl, M. (2008): Final report on technical data, costs, and life cycle inventories of advanced fossil power generation systems. Deliverable 7.2., NEEDS (New Energy Externalities Developments for Sustainability) http://www.needs-project.org/. Last access 06.11.2009.
BDEW (Bundesverband der Energie- und Wasserwirtschaft e.V.) (2009): Stellungnahme: Zum Regie-rungsentwurf für ein Gesetz zur Regelung von Abscheidung, Transport und dauerhafter Spei-cherung von Kohlendioxid (CO2ATSG). 27.04.2009. Berlin.
BDI (2009): Stellungnahme. Entwurf der Bundesregierung für ein Gesetz zur Regelung von Abschei-dung, Transport und dauerhafter Speicherung von Kohlendioxid. 19.5.2009.

RECCS plus – Update and Expansion of the RECCS Study
268 Final Report
Beck, K. (2008): RWE startet CO2-Konversions-Pilotanlage auf Basis einer von der Jacobs University optimierten Meeresalgentechnologie. Idw Informationsdienst Wissenschaft vom 06.11.2008 http://idw-online.de/pages/de/news287240. Last access 20.01.2010.
Bellona (2005): CO2 for EOR on the Norwegian shelf - A case study (Bellona Report). Oslo.
Bellona (2008): How to combat global warming. An ambitious but necessary approach to reduce greenhouse gas emissions. http://www.bellona.org/reports/How_to_Combat_Global_Warming. Last access 13.01.2010.
Bellona (2009): Amines used in CO2 Capture – Health and Environment Impacts, Bellona Report Sep-tember 2009. http://www.bellona.org/files/fil_Bellona_report_September__2009_-_Amines_used_in_CO2_capture.pdf. Last access 13.01.2010.
Bensmann, M. (2008): Glibber aus Neptuns Garten. Neue energie 03/08, S. 69-72.
Bentham, M. (2006): An assessment of carbon sequestration potential in the UK – Southern North Sea case study. Tyndall Centre Working Paper No. 85.
Bielinski, A.; Kopp, A.; Schütt, H.; Class, H. (2008): Monitoring of CO2 plumes during storage in geo-logical formations using temperature signals: Numerical investigation. Int. J. of Greenhouse Gas Control, 2(3)319-328. doi:10.1016/j.ijggc.2008.02.008.
Biello, D. (2008): Cement from CO2: A concrete cure for global warming? http://www.scientificamerican.com/article.cfm?id=cement-from-carbon-dioxide. Last access 20.01.2010.
Bjureby, E.; Rochon, E.; Gulowsen, T. (2009): Reality check on carbon storage - Recent develop-ments in the Sleipner project and Utsira formation. Amsterdam: Greenpeace International.
BMBF (2007): Die Hightech-Strategie für Deutschland – Erster Fortschrittsbericht, Bundesministerium für Bildung und Forschung, Berlin.
BMBF (2008): Netzwerk Lebenszyklusdaten. Daten für die Innovationen von morgen. http://www.netzwerk-lebenszyklusdaten.de/.
BMU (2007): Leitstudie 2007 – Ausbaustrategie erneuerbare Energien – Aktualisierung und Neube-wertung bis zu den Jahren 2020 und 2030 mit Ausblick bis 2050. Untersuchung von J. Nitsch im Auftrag des Bundesministeriums für Umwelt, Naturschutz und Reaktorsicherheit in Zusammen-arbeit mit DLR Stuttgart, Abt. Systemanalyse und Technikbewertung, Stuttgart. http://www.bmu.de/erneuerbare_energien/downloads/doc/38787.php. Last access 30.09.2009.
BMU (2008a): Leitstudie 2008 – Weiterentwicklung der „Ausbaustrategie erneuerbare Energien” vor dem Hintergrund der aktuellen Klimaschutzziele Deutschland und Europas. Untersuchung von J. Nitsch im Auftrag des Bundesministeriums für Umwelt, Naturschutz und Reaktorsicherheit in Zusammenarbeit mit DLR Stuttgart, Abt. Systemanalyse und Technikbewertung, Stuttgart. http://www.bmu.de/erneuerbare_energien/downloads/doc/42383.php. Last access 22.01.2010.
BMU (2008b): Referentenentwurf des Bundesministeriums für Umwelt, Naturschutz und Reaktorsi-cherheit für ein Gesetz zur Regelung von Abscheidung, Transport und Ablagerung von Kohlen-dioxid, Bearbeitungsstand: 19.12.2008 (unveröffentlicht).
BMU (2009a): Leitstudie 2009 – Langfristszenarien und Strategien für den Ausbau erneuerbarer Energien in Deutschland. Untersuchung von J. Nitsch und B. Wenzel im Auftrag des Bundesmi-nisteriums für Umwelt, Naturschutz und Reaktorsicherheit in Zusammenarbeit mit DLR Stutt-gart, Abt. Systemanalyse und Technikbewertung, Stuttgart und Ingenieurbüro für neue Energien (IfnE) Teltow. http://www.bmu.de/erneuerbare_energien/downloads/doc/45026.php. Last access 22.01.2010.
BMU (2009b): „Mit BASTA-Politik wird es nicht gehen“. Interview mit Umweltminister Röttgen in der taz vom 10.12.2009. http://www.bmu.de/presse/artikel_und_interviews/doc/36313.php. Last ac-cess 09.01.2010.
References
Wuppertal Institute for Climate, Environment and Energy 269
BMWi (Bundesministerium für Wirtschaft und Technologie) (2008a): Der Stellenwert der CCS-Techno-logien (CO2-Abscheidung und Einlagerung) in der deutschen Energie- und Klimapolitik. Vortrag von Peer Hoth auf dem Workshop „Der energie- und klimapolitische Hintergrund und die techni-schen Grundlagen der CO2-Abscheidung und -Einlagerung” am 28.01.2008 an der Uni Jena (Energierechtsinstitut). www.rewi.uni-jena.de/data/rewi_/Energierechtsinstitut/Hoth-ueberarbeitet.pdf. Last access 05.10.2009.
BMWi (2008b): Energiedaten. Stand 10.07.2008.
BMWi (2009a): Bundeskabinett beschließt Gesetzentwurf zur Kohlendioxidabscheidung und -speicherung. Pressemitteilung, 1.4.2009, Berlin.
BMWi (2009b): Zahlen und Fakten. Energiedaten. Nationale und internationale Entwicklung, Berlin.
BMWi (2009c): Antwort auf die kleine Anfrage der Bundestagsfraktion der Grünen betreffend CO2
Abscheidung und Lagerung. BT-Drucksache 16/12540, Berlin.
BMWi; BMU (2009): Gemeinsamer Referentenentwurf eines Gesetzes zur Regelung von Abschei-dung, Transport und dauerhafter Speicherung von Kohlendioxid von BMWi und BMU, Stand: 23.02.2009.
BMWi; BMU; BMBF (2007): Entwicklungsstand und Perspektiven von CCS-Technologien in Deutsch-land, Gemeinsamer Bericht des BMWi, BMU und BMBF für die Bundesregierung, 19. Septem-ber 2007.
Bradshaw, J.; Bachu, S.; Bonijoly, D.; Burruss, R.; Christensen, N. P.; Mathiassen, O. M. (2005): Task Force for Review and Identification of Standards for CO2 Storage Capacity Measurement. Pha-se I Final report, Carbon Sequestration Leadership Forum.
Brandt, A. (2009): Besteht eine Pflicht zur Anwendung der Abfallrahmenrichtlinie vor Ablauf der Um-setzungsfrist? AbfallR 4/2009, S. 167 ff.
BSOZD (Bund Soziales Zentrum Deutschland e. V.) (2008): Klimaschutz und Kraftwerkstechnik: TÜV NORD CERT bescheinigt E.ON-Kraftwerken Carbon Capture Readiness. News vom 18.09.2008, http://www.bsozd.com/?p=916. Last access 07.10.2009.
Bündnis 90/Die Grünen (2009a): Der grüne neue Gesellschaftsvertrag. Klima – Arbeit – Gerechtigkeit – Freiheit. Berlin.
Bündnis 90/Die Grünen (2009b): Klare Regeln für CCS-Technik – Vorrang für erneuerbare Energien. Positionspapier zur CCS (Carbon Capture and Storage) Technologie. Fraktionsbeschluss vom 3. März 2009. Berlin.
Bundesrat (2009): Stellungnahme des Bundesrates. Entwurf eines Gesetzes zur Regelung von Ab-scheidung, Transport und dauerhafter Speicherung von Kohlendioxid. Drucksache 282/09, 15.5.2009, Berlin.
Bundesregierung (2007): Eckpunkte für ein integriertes Energie- und Klimaprogramm, Berlin.
Bundestag (2009): Entwurf – Gesetz zur Regelung, Abscheidung und dauerhafter Speicherung von Kohlendioxid in der vom Bundeskabinett am 1. April 2009 verabschiedeten Fassung, Berlin.
Bundestag (2009): Deutscher Bundestag. Stenografischer Bericht 219. Sitzung. Plenarprotokoll 16/219, 6.5.2009, Berlin.
Bundesverband Geothermie (2009): CCS-Gesetz: Vorrang von CCS vor Erneuerbaren Energien muss verhindert werden! Stellungnahme des Bundesverbandes Geothermie e.V. zum Entwurf eines Gesetzes zur Regelung von Abscheidung, Transport und dauerhafter Speicherung von Kohlen-dioxid (CCS) vom 23.02.2009. http://www.geothermie.de/fileadmin/useruploads/wissenswelt/gesetze/ccs-gesetz.pdf. Last ac-cess 22.01.2010.

RECCS plus – Update and Expansion of the RECCS Study
270 Final Report
Burks, S. K.; James, R. A.; Moeller, E. V. (2009): Department of Energy Announces $ 1.4 Billion in Recovery Act Funding for Industrial Carbon Capture and Storage. Client Alert vom 12. Juni 2009, Palo Alto/Washington D.C./San Francisco.
Bushby, Y. E.; Gilfillan, S. M.; Haszeldine, R. S. (2008): Carbon Capture and Storage in the UK. In Energy and the Natural Heritage, Scottish Natural Heritage. Edinburgh: TSO (The Stationery Office). Abgerufen von http://www.tsoshop.co.uk/bookstore.asp?FO=1159966&Action=Book&ProductID=9780114973414&From=SearchResults.
CDU/CSU (2009a): Energiepolitik. Für eine saubere, sichere und bezahlbare Energieversorgung.
CDU/CSU (2009b): Wir haben die Kraft – Gemeinsam für unser Deutschland. Regierungsprogramm 2009-2013, Berlin.
CDU/CSU; FDP (2009): Wachstum. Bildung. Zusammenhalt. Der Koalitionsvertrag zwischen CDU, CSU und FDP. 17. Legislaturperiode. Berlin.
CDU Schleswig-Holstein; FDP Schleswig-Holstein (2009): Koalition des Aufbruchs. Koalitionsvertrag zwischen der Christlich Demokratischen Union (CDU) und der Freien Demokratischen Partei (FDP) für die 17. Legislaturperiode des Schleswig-Holsteinischen Landtags. Kiel.
Chadwick, R. A.; Noy, D. J.; Holloway, S. (2009): Flow processes and pressure evolution in aquifers during the injection of supercritical CO2 as a greenhouse gas mitigation measure. Petroleum Geoscience, 15(1)59-73. doi: 10.1144/1354-079309-793.
China Daily (2009): China launches first coal-to-liquids-project, 1. Juni 2009, http://www.chinadaily.com.cn/bizchina/2009-01/06/content_7371483.htm. Last access 04.09.2009.
Christensen, N. P. (2007): Geological Storage of CO2 from Power Generation (Risø-R Nr. 1608). Roskilde: GEUS.
Christensen, N. P. (2009): The EU GeoCapacity Project – Assessing European Capacity for Geologi-cal Storage of Carbon Dioxide. Presentation at the ZEP Government Group Meeting Brussels 12 March 2009. http://www.geology.cz/geocapacity/publications. Last access 02.10.2009.
Christensen, N. P.; Holloway, S. (2004): GESTCO - Geological Storage of CO2 from Combustion of Fossil Fuel (Summary Report). Brüssel: Europäische Kommission.
Coninck, H. de (2008): Trojan horse or horn of plenty? Reflections on allowing CCS in the CDM. En-ergy Policy 36(3)929-936. doi:10.1016/j.enpol.2007.11.013.
CO2CRC (Cooperative Research Centre for Greenhouse Gas Technologies) (2009): CCS Activity in Australia 2009. Canberra/Bentley. https://extra.co2crc.com.au/modules/pts2/download.php?file_id=2059&rec_id=1120. Last ac-cess 05.10.2009.
Crotogino, F., Donadei, S., Dietrich, L. (2009): Nutzungskonkurrenz bei Speichern im geologischen Untergrund, Solarzeitalter 4/2009, S. 22-30.
CRUST Legal Task Force (2001): Legal aspects of underground CO2 buffer storage, a legal analysis of legislation and regulations relating to the CRUST project, 2001, not available anymore.
CSLF (2009): Carbon Sequestration Leadership Forum. Projects. www.cslforum.org/projects/. Last access 30.09.2009.
DECHEMA (2009): Produktion von Sauerstoff und Stickstoff: Weitere Fortschritte bei Luftzerlegungs-technologien. Trendbericht Nr. 10: Industriegase, Presseinformation für „ACHEMA 2009 – 29. Internationaler Ausstellungskongress für Chemische Technik, Umweltschutz und Biotechnolo-gie” vom 11.-15. Mai 2009, Frankfurt am Main.
References
Wuppertal Institute for Climate, Environment and Energy 271
Department of Primary Industries (2009): Discussion Paper April 2009, Greenhouse Gas Geological Sequestration Regulations, State Government Victoria.
Der Inselbote (2009): Kommunen sagen Nein zu CO2-Endlager, 17.7.2009.
Deutsche Umwelthilfe (2009): Stellungnahme der Deutschen Umwelthilfe e. V. zum CCS Gesetzent-wurf der Bundesregierung vom 1. April 2009, Deutschland soll Kohleland bleiben – ohne Rück-sicht auf Verluste. http://www.duh.de/uploads/media/DUH_zu_CCS_Gesetzentwurf_STN_010409.pdf. Last access 22.01.2010.
DGB (2009): Stellungnahme des Deutschen Gewerkschaftsbundes vom 3.3.2009 zum Entwurf eines Gesetzes zur Regelung von Abscheidung, Transport und dauerhafter Speicherung von Kohlen-dioxid (CCS), Referentenentwurf von BMWi und BMU vom 23.02.2009. Berlin.
Die Linke (2009a): Konsequent sozial. Für Demokratie und Frieden. Bundestagswahlprogramm 2009. Berlin.
Die Linke (2009b): Technologieversprechen CCS verlängert Kohleära und bremst Energiewende. http://www.bulling-schroeter.de/nc/presse/detail/artikel/technologieversprechen-ccs-verlaengert-kohleaera-und-bremst-energiewende/ Last access 2.12.2009.
Die Linke Brandenburg (2009): Wahlprogramm 2009, Potsdam.
Dietrich, L. (2006): CO2-Abscheidung und Ablagerung: eine auch energierechtliche Frage? Energie-wirtschaftliche Tagesfragen, 56(4)92-93.
Dietrich, L. (2007): CO2-Abscheidung und Ablagerung (CAA) im deutschen und europäischen Ener-gieumweltrecht. Forum Energierecht, Band 12. Zugl.: Osnabrück, Univ., Diss., 2006/2007. Ba-den-Baden, Nomos-Verlag.
Dietrich, L. (2008): Regulating Carbon Capture and Storage in the European Union – An Economic and Legal Analysis, Commentary, Carbon and Climate Law Review (CCLR) 2008, S. 191 ff.
Dietrich, L. (2009): Entwurf zum CCS-Gesetz lässt noch Fragen offen und bedarf der Konkretisierung, Dow Jones Energy Weekly, Nr. 11 vom 13.03.2009, S. 8 f.
Dietrich, L.; Bode, S. (2005): CO2-Abscheidung und Ablagerung (CAA): ordnungsrechtliche Aspekte und Implikationen im Rahmen des EU-Emissionshandels, HWWA Discussion Paper 327. Ham-burg.
Dietrich, L.; Bode, S. (2008): Richtlinienentwurf der EU-Kommission zur CO2-Speicherung – Quo va-dis CCS?, ew – das magazin für die energie wirtschaft, Heft 19/2008, S. 54 ff.
Dietrich, L.; Brück von Oertzen, M. (2008): Rechtliche Implikationen der Wiederverstromung von Windenergie in Druckluftspeicherkraftwerken, Energiewirtschaftliche Tagesfragen, 4/2008, S. 85 ff.
Dietrich, L.; Schäperklaus, S. (2009): Der Raum wird knapp: über die Steuerbarkeit von Nutzungskon-flikten unter Tage, Zeitschrift Erdöl Erdgas Kohle, 1/2009, S. 20 ff.
DIW (2006): CO2-Emissionen in Deutschland nach Branchen Stand 2005, Deutsches Institut für Wirt-schaftsforschung, DIW-Wochenbericht 12/2006.
DOE (U.S. Department of Energy) (2008): DOE’s Fossil Energy Budget - Fiscal Year 2008. Washing-ton D.C.
DOE (2009a): US-China Clean Energy Research Center Announced, Pressemitteilung vom 15. Juli 2009, http://www.energy.gov/news2009/7640.htm. Last access 04.09.2009.
DOE (2009b): Department of Energy takes another step forwards on FutureGen Project in Mattoon, Illinois. Pressemitteilung vom 14.07.2009, Washington D.C.
DOE (2009c): DOE selects 19 CO2 Storage Projects. Carbon Capture Journal 10, Juli/August, 2009.
RECCS plus – Update and Expansion of the RECCS Study
272 Final Report
Doka, G. (2007): Critical Review of Life Cycle Assessment of Selected Technologies for CO2 Trans-port and Sequestration, Diploma Thesis No. 2007 MS05 by C. Wildbolz, ETHZ.
DONG Energy (2008): Final report on offshore wind technology. EU-NEEDS. www.needs-project.org. Last access 08.02.2010.
Doppelhammer, M. (2008): Richtlinienvorschlag der Europäischen Kommission zur geologischen Speicherung von Kohlendioxid, ZUR 2008, S. 252 ff.
Dose, T. (2008): A consistent approach to CO2 storage capacity estimation for deep saline formations. DGMK/ÖGEW-Frühjahrstagungsbericht 2008-1, Fachbereich Aufsuchung und Gewinnung, Cel-le, 10./11. April 2008, ISBN 978-3-936418-79-8.
DUH (2009): Stellungnahme der Deutschen Umwelthilfe e.V. zum CCS-Gesetzesentwurf der Bundes-regierung vom 1. April 2009. Deutschland soll Kohleland bleiben – ohne Rücksicht auf Verluste. 1.4.2009. Berlin.
E.On (2009): Post-Combustion-Capture. Projekte für eine saubere Zukunft der Energie, http://www.eon.com/de/unternehmen/26498.jsp#1. Last access 08.09.2009.
ECCP II (The Second European Climate Change Programme) (2006): Final Report of the working Group 3: Carbon Capture and Geological Storage (CCS), as agreed on 01 June 2006.
Ecofys (2007): Making large-scale Carbon Capture and Storage CCS in the Netherlands work. An Agenda for 2007-2020, Policy, Technologie and Organisation. http://www.energiened.nl/_upload/bestellingen/publicaties/272_MakingCCSworkCompleet.pdf.
ECRA (2007): European Cement Research Academy GmbH: Technical Report TR 044/2007: Carbon Capture Technology – Options and Potentials for the Cement Industry.
Edenhofer, O.; Knopf, B.; Kalkuhl, M. (2009): CCS: CO2-Sequestrierung: Ein wirksamer Beitrag zum Klimaschutz? In: Ifo-Schnelldienst, 62, Jg., Nr. 3.
Edenhofer, O.; Knopf, B.; Barker, T.; Baumstark, L.; Bellevrat, E.; Château, B.; Criqui, P.; Isaac, M.; Kitous, A.; Kypreos, S.; Leimbach, M.; Lessmann, L.; Magné, B.; Scrieciu, S.; Turton, H.; van Vuuren, D.P. (2010): The Economics of Low Stabilization: Model Comparison of Mitigation Strategies and Costs. The Energy Journal, Volume 31 (Special Issue 1). Last access 02.02.2010.
ef.ruhr (2009): Analyse zur Nachrüstung von Kohlekraftwerken mit einer CO2-Rückhaltung. Ab-schlussbericht an das Ministerium für Wirtschaft, Mittelstand und Energie des Landes Nord-rhein-Westfalen. Förderkennzeichen 64.65.69-T-221. Duisburg.
EGEC (2009): Position Paper of the European Geothermal Energy Council. EGEC´s Position on „Car-bon Capture and Storage". 15.12.2009, Brüssel.
Ehlig-Economides, C.; Economides, M. J. (2010): Sequestering carbon dioxide in a closed under-ground volume. J. of Petroleum Science and Engineering, 70(1-2)123-130. doi: 10.1016/j.petrol.2009.11.002.
ENCAP (Enhanced Capture of CO2) (2009): High Temperature O2 Generation for Power Cycles, http://www.encapco2.org/technoHTO2GPC.htm. Last access 08.09.2009.
Energiewirtschaftliche Tagesfragen (2009): Kohleverstromung und CCS – Chancen und Herausforde-rungen. 59. Jg., Nr. 8.
Ennis-King, J.; Paterson, L. (2007): Coupling of geochemical reactions and convective mixing in the long-term geological storage of carbon dioxide. Int. J. of Greenhouse Gas Control, 1(1)86-93. doi:10.1016/S1750-5836(07)00034-5.
EPA (Environmental Protection Agency) (2008): Federal Requirements under the Underground Injec-tion (UIC) Control Program for Carbon Dioxide (CO2) Geologic Sequestration (GS) Wells. Pro-posed Rule, in: Federal Register, Vol. 73, No. 144, 25. Juni 2008.

References
Wuppertal Institute for Climate, Environment and Energy 273
EPA (Environmental Protection Agency) (2009): Federal Requirements under the Underground Injec-tion (UIC) Control Program for Carbon Dioxide (CO2) Geologic Sequestration (GS) Wells; No-tice of Data Availability and Request for Comment. Washington D.C.
EPHC (Environment Protection and Hertiage Council) (2009): Climate Change – Environmental Guidelines for Carbon Dioxide Capture and Geolocial Storage – May 2009. http://www.ephc.gov.au/node/340. Last access 05.10.2009.
Epple, B.; Ströhle, J. (2008): CO2 Capture Based on Chemical and Carbonate Looping. VGB Power-Tech – Int. J. for Electricity and Heat Generation. 88(11)85-88.
EPRI (Electric Power Research Institute) (2007): Assessment of Post-Combustion Capture Technol-ogy Developments, Paolo Alto.
ESU, IFEU (2008): LCA of Background Processes. Deliverable 15.1, NEEDS (New Energy Externali-ties Developments for Sustainability) http://www.needs-project.org/. Last access 23.11.2009.
Europäische Kommission (2008): Mitteilung der Kommission an das Europäische Parlament, den Rat, den Europäische Wirtschafts- und Sozialausschuss und den Ausschuss der Regionen. 20 und 20 bis 2020, Chancen Europas im Klimawandel, Brüssel.
European Commission (2010): Member States back funding allocation rules for CCS, renewable energy demonstration projects. Midday Express of 2010-02-05. http://europa.eu/rapid/. Last ac-cess 10.02.2010.
Ewers, J. (2008): CO2-Abtrennung und -Speicherkonzept der RWE. Präsentation auf der E-World in Essen am 20. Februar 2008.
Ewers, J.; Renzenbrink, W. (2005): Bestandsaufnahme und Einordnung der verschiedenen Technolo-gien zur CO2-Minderung. VGB PowerTech – Int. J. for Electricity and Heat Generation. 85(4)46-51.
EWI, Prognos (2005): Energiereport IV – Die Entwicklung der Energiemärkte bis zum Jahr 2030. Un-tersuchung im Auftrag des Bundesministeriums für Wirtschaft und Arbeit. Köln, Basel, April 2005.
EWI; Prognos (2006): Auswirkungen höherer Energiepreise auf Energieangebot- und nachfrage. Öl-preisvariante der energiewirtschaftlichen Referenzprognose 2030. Untersuchung im Auftrag des BMWA. Köln, Basel, August 2006.
Faaij, A.; Damen, K.; Turkenburg, W. (2009): Pathways towards large-scale implementation of CO2 capture and storage: A case study for the Netherlands. Int. J. of Greenhouse Gas Control, 3(2)217-236. doi: 10.1016/j.ijggc.2008.09.005.
FDP (2006): Energie braucht Wettbewerb – Energiepolitisches Grundsatzprogramm der FDP. Be-schluss des Bundesparteitags der FDP am 13.-14. Mai 2006, Rostock.
FDP (2008): Für eine sichere, bezahlbare und klimafreundliche Energieversorgung. Tendenzbe-schluss. Verabschiedetet auf der Herbstklausur der FDP-Bundestagsfraktion am 11. September 2008, Wiesbaden.
FDP (2009): Die Mitte stärken. Deutschlandprogramm der Freien Demokratischen Partei. Hannover.
Ferguson, R. C.; Nichols, C.; Leeuwen, T. V.; Kuuskraa, V. A. (2009): Storing CO2 with enhanced oil recovery. Energy Procedia, 1(1)1989-1996. doi: 10.1016/j.egypro.2009.01.259.
Figueroa, J. D.; Fout, T.; Plasynski, S.; McIlvried, H.; Srivastava R. D. (2008): Advances in CO2 Cap-ture Technology – The U.S. Department of Energy’s Carbon Sequestration Program. Int. J. of Greenhouse Gas Control, 2(2)9-20. doi:10.1016/S1750-5836(07)00094-1.
Fischedick, M.; Günster, W.; Fahlenkamp, H.; Meier, H-J.; Neumann, F.; Oeljeklaus, G.; Rode, H.; Schimkat, A.; Beigel, J.; Schüwer, D. (2006): CO2-Abtrennung im Kraftwerk – ist eine Nachrü-stung für bestehende Anlagen sinnvoll? VGB PowerTech 4/2006. Essen.

RECCS plus – Update and Expansion of the RECCS Study
274 Final Report
Frailey, S. (2008): Estimation of the storage efficiency factor for saline formations. Appendix 1 in Methodology for Development of carbon sequestration capacity estimates. Appendix B. In Car-bon Sequestration Atlas of the United States and Canada. U.S. Department of Energy and the National Energy Technology Laboratory.
Franke, P. (2010): Die Einlagerung von CO2 in unterirdischen geologischen Formationen unter beson-derer Berücksichtigung des Bergrechts, in: Ehricke, U.; Kühne, G. Bergrecht zwischen Tradition und Moderne, Baden Baden, im Druck.
Frankl, P.; Menichetti, E.; Raugei, M. (2008): Final report on technical data, costs and life cycle inven-tories of PV applications. Deliverable no. 11.2-RS Ia, EU-NEEDS. www.needs-project.org. Last access 08.02.2010.
Freytag, K.; Thiem, H.-G. (2006): Forschungsprojekt CO2-Speicherung am Standort Ketzin, Glückauf 142 (2006), S. 213 ff.
Froboese (2007): Kunststoffe aus Kohlendioxyd, Pressemitteilung in „OpenPR” vom 23.04.2007 http://www.openpr.de/news/131319/Kunststoffe-aus-Kohlendioxid.html. Last access 20.01.2010.
Gaßner, H. (2009): Brief des Bundesverbandes Geothermie e.V. an die Mitglieder der SPD und der CDU/CSU im Ausschuss für Umwelt, Naturschutz und Reaktorsicherheit. Berlin, 08.06.2009.
Gaßner, H.; Buchholz, G. (2009): Aufsuchungserlaubnisse für CO2-Ablagerung: Unvereinbar mit Berg-recht! Kurzstellungnahme vom 24.06.2009, abrufbar unter: http://www.geothermie.de/uploads/media/09-06-24_CCS-Kurzstellungnahme.pdf. Last access 22.01.2010.
GDCh (2003): Positionspapier der Fachgruppe Umweltchemie und Ökotoxikologie zu dem Beschluss des Rats für Nachhaltige Entwicklung „Perspektiven der Kohle in einer nachhaltigen Energie-wirtschaft” vom 30.09.2003.
Gerling, J. P. (2008): Geologische CO2-Speicherung als Beitrag zur nachhaltigen Energieversorgung. Bergbau, Nr. 10, S. 472–475.
Gerling, J. P. (2010): Panel „Perspektiven der CO2-Speicherung“ auf dem 2. IZ Klima Kongress am 28.01.2010 in Berlin.
Germanwatch (2009): Germanwatch-Stellungnahme zum Entwurf eines Gesetzes zur Regelung von Abscheidung, Transport und dauerhafter Speicherung von Kohlendioxid (CCS), Empfehlungen zur CCS-Debatte bei der 858. Sitzung des Bundesrates am 15. Mai 2009 Bonn, Germanwatch e.V. vom 13.5.2009. http://www.germanwatch.org/klima/ccsges09.pdf. Last access 22.01.2010.
Germanwatch (2009): Germanwatch-Stellungnahme vom 13.5.2009 zum Entwurf eines Gesetzes zur Regelung von Abscheidung, Transport und dauerhafter Speicherung von Kohlendioxid (CCS). Empfehlungen zur CCS-Debatte bei der 858. Sitzung des Bundesrates am 15. Mai 2009. Bonn.
Global CCS Institute (2009a): Strategic Analysis of the Global Status of Carbon Capture and Storage, Report 3: Country Studies – The United States of America. http://www.globalccsinstitute.com/downloads/Reports/2009/worley/17-United-States-of-America-Report-Three-rev0.pdf. Last access 04.12.2009.
Global CCS Institute (2009b): Strategic Analysis of the Global Status of Carbon Capture and Storage, Report 3: Country Studies – Australia. http://www.globalccsinstitute.com/downloads/Reports/2009/worley/01-Australia-Report-Three-rev0.pdf. Last access 04.12.2009
Graaf, K. De; Jans, J. H. (2009): Environmental Law and CCS in Europe and the Netherlands; The Implications of Chapter 7 of Directive 2009/31 (February 26, 2009). http://ssrn.com/abstract=1265042. Last access 29.09.2009.
Graus, W.; Roglieri, M.; Jaworski, P.; Alberio, L. (2008): Efficiency and Capture-Readiness of New Fossil Power Plants in the EU. ecofys.
References
Wuppertal Institute for Climate, Environment and Energy 275
Green Car Congress (2007): Canadian Companies Developing CO2 Capture with Algae Photo Bioreactor System. http://www.greencarcongress.com/2007/07/canadian-compan.html. Last ac-cess 8.9.2009.
Greenpeace (2008): False Hope. Why carbon capture and storage won’t save the climate. http://www.greenpeace.org/raw/content/international/press/reports/false-hope.pdf. Last access 13.01.2010.
Greenpeace (2009): Stellungnahme zum Referentenentwurf Gesetz zur Regelung von Abscheidung, Transport und dauerhafter Speicherung von Kohlendioxid, Greenpeace e.V. vom 03.03.2009. http://www.greenpeace.de/fileadmin/gpd/user_upload/themen/klima/CCS-stellungnahme-final.pdf. Last access 22.01.2010.
Grotzinger, J.; Jordan, T. (2010): Understanding Earth, 6e; WH Freeman Publishers; Copyright year 2010.
Grünwald, R. (2007): CO2-Abscheidung und Lagerung bei Kraftwerken, Sachstandsbericht zum Moni-toring „Nachhaltige Energieversorgung“, Arbeitsbericht des TAB Nr. 120. Berlin.
Grünwald, R. (2008): Treibhausgas – ab in die Versenkung? Möglichkeiten und Risiken der Abschei-dung und Lagerung von CO2. Studien des Büros für Technikfolgen-Abschätzung beim Deut-schen Bundestag Nr. 25. ISBN 978-3-8360-8125-2.
Guinée, J.B.; Gorree, M.; Heijungs, R.; Huppes, G.; Kleijn, R.; Sleeswijk, A.W.: Haes, H.A.U.D.; Bruijn, J.A.D.; Duin, R.V.; Huijbregts, M.A.J., (2002): Handbook on Life Cycle Assessment: Operational Guide to the ISO Standards- Kluwer Academic Publishers, Dordrecht.
Gupta, R. P. (2009): Overview of Carbon Dioxide Capture. Vortrag vom 24. Februar 2009 bei „The United States Energy Association Technology Series, 'Carbon Capture and Storage'”.
Hassel, B. van; Li, J.; Wilson, J.; Degenstein, N.; Shah, M.; Christie, M.; Venkateswaran, V. (2008): Oxygen Transport Membrane Based OxyCombustion for CO2 Capture from Coal Power Plants. Präsentation. http://www.netl.doe.gov/technologies/coalpower/ewr/co2/pubs/43088%20Praxair%20OTM%207th%20CCS%20conference%202008.pdf. Last access 30.09.2009.
Haszeldine, R. S. (2009a): Carbon Capture and Storage: How Green Can Black Be? Science, 325(5948)1647-1652. doi: 10.1126/science.1172246.
Haszeldine, S. (2009b): Carbon capture and storage: UK’s fourth energy pillar, or broken bridge? Presentation at British Science Festival, Guildford. Abgerufen von www.erp.ac.uk/sccs.
Haugan, P. (2009): CO2-lagring på norsk kontinentalsokkel. Presentation at Geofysisk Institutet, Uni-versitetet Bergen, Bergen, Norwegen. Abgerufen von http://www.npd.no/global/norsk/1%20-%20aktuelt/nyheter/%5Bpdf-vedlegg%5D/foredragene%20til%20klimakur%202020/10_uib.pdf.
Haydock, H. (2008): NZEC – Carbon Capture and Storage. Präsentation im Rahmen des „2nd Annual European CCS Summit“, 2.-3. Dezember 2008.
Hellriegel, M. (2008a): CO2-Abscheidung und Ablagerung: Teil 2: Richtlinienvorschlag der Europäi-schen Kommission, RdE 2008, S. 319 ff.
Hellriegel, M. (2008b): CO2-freies Kraftwerk: Rechtsrahmen für CO2-Abscheidung und -Ablagerung, in: Frenz, W., 10 Jahre Berg- und Umweltrecht: Habitatschutz – Mineralische Abfälle – Emissions-handel, Clausthal-Zellerfeld S. 103 ff.
Helmholtz-Gemeinschaft (2009): Eckpunkte und Leitlinien zur Weiterentwicklung der Energiefor-schungspolitik der Bundesregierung. Empfehlungen der Helmholtz-Gemeinschaft, Berlin.
Hendriks, C.; Graus, W.; van Bergen, F. (2004): Global carbon dioxide storage potential and costs (Nr. EEP-02001). Utrecht: ECOFYS in Cooperation with TNO.

RECCS plus – Update and Expansion of the RECCS Study
276 Final Report
Hendriks, C.; Mace, M.J.; Coenraads, R. (2005): Impacts of the EU and international law on the im-plementation of carbon dioxide and geological storage in the European Union. Int. J. of Green-house Gas Control 1(2)253-260.doi:10.1016/S1750-5836(07)00028-X.
Henkel, J. (2006): Life Cycle Assessment of Carbon Dioxide Capture and Storage. Diploma Thesis, Institute for Energy and Environmental Research and Berlin University of Technology, Heidel-berg.
Hermann, A.; Barth, R. (2008): Rechtliche Rahmenbedingungen für die Ablagerung von CO2 in tiefen geologischen Schichten: Vorschläge zur Ausgestaltung des Rechtsrahmens, DVBl. 2008, S. 1417 ff.
Herzog, H.; Meldon, J.; Hatton, A. (2009): Advanced Post-Combustion CO2 Capture. Paper für die U.S.-amerikanische „Clean Air Task Force“.
Höller, S. (2009): Assessment of methodologies for estimating the capacity for geological sequestra-tion of CO2 with special emphasis on the capacity calculation for Germany. Diplomarbeit, Uni-versität Trier und Wuppertal Institut für Klima, Umwelt, Energie.
Hohmuth, T. (2008): CCS und Emissionshandel – Technologie zur Abscheidung und Ablagerung von Kohlendioxid im Recht des Emissionshandels, ZUR 2008, S. 295 ff.
Hohmuth, T.; Kahle, C.; Kohls, M. (2009): Rechtliche Vorgaben für CCS - das Kohlendioxid-Speicherungsgesetz, Energiewirtschaftliche Tagesfragen 6/2009, S. 59 ff.
Holloway, S.; Vincent, C.; Bentham, M.; Kirk, K. (2006): Top-down and bottom-up estimates of CO2
storage capacity in the UK sector of the southern North Sea basin. Environmental Geosciences, 13(2)71–84. doi:10.1306/eg.11080505015.
Holloway, S. (2009): Storage capacity and containment issues for carbon dioxide capture and geologi-cal storage on the UK continental shelf. Proceedings of the Institution of Mechanical Engineers, Part A: J. of Power and Energy, 223(3)239-248. doi:10.1243/09576509JPE650.
Horn, M.; Diekmann, J. (2007): Rahmendaten für Politikszenarien V. Präsentation beim Kick-Off-Meeting, UBA Dessau, 7. Dezember 2007.
Hunt, J. M. (1995): Petroleum geochemistry and geology. 743 p., W.H.Freeman and Co Ltd, San Francisco, 2nd edition.
Hurtado, A.; Eguilior, S.; Prado, A. J.; Ruiz, C.; Campos, R.; Lomba, L.; Pelayo, M.; del Villar, L. P.; Recreo, F. (2008): Almacenamiento geológico de CO2: Metodología de estimación de Ca-pacidades.
Idrissova, F. (2004): Lify Cycle Assessment of Selected Carbon Dioxide Capture, Transportation and Storage Options from Coal-fired Power Plants. Master Thesis, Faculty of Business Administra-tion and Economics, Technische Universität Freiberg, Freiberg.
IEA (International Energy Agency) (2000): Experience Curves for Energy Technology Policy. www.iea.org/textbase/nppdf/free/2000/curve2000.pdf . Last access 23.01.2010.
IEA (2005): Legal aspects of storing CO2 www.iea.org/textbase/nppdf/free/2005/CO2_legal.pdf. Last access 02.10.2009.
IEA (2007): World Energy Outlook 2007. OECD/International Energy Agency (IEA). Paris.
IEA (2008): Energy Technology Perspectives 2008. In Support of the G8 Plan of Action. Scenarios and Strategies to 2050. http://www.iea.org/techno/etp/index.asp. Last access 08.02.2010.
IEA GHG (2009a): CO2 storage in depleted gas fields (Technical study Nr. 2009/01). IEA Greenhouse Gas R&D Programme.
IEA GHG (2009b): Developments of storage coefficients for carbon dioxide storage in deep saline formations (Technical study Nr. 2009/13). IEA Greenhouse Gas R&D Programme, Energy and Environmental Research Centre.

References
Wuppertal Institute for Climate, Environment and Energy 277
IG BCE (2008): Position für eine nachhaltige Industrie-, Energie- und Klimapolitik. 11.03.2008. Han-nover.
IPCC (2005): IPCC Special report on carbon dioxide capture and storage. 442 p., Cambridge Univer-sity Press for the Intergovernmental Panel on Climate Change (IPCC), Cambridge, United Kingdom and New York, USA.
IPCC (2006): Chapter 4: Fugitive emissions, in: 2006 IPCC Guidelines for National Greenhouse Gas Inventories, vol. 2, Energy. IGES, Japan, Prepared by the National Greenhouse Gas Inventories Programme.
IPCC (2007): Climate Change 2007: Synthesis Report. Contribution of Working Groups I, II and III to the Fourth Assessment Report of the Intergovernmental Panel on Climate Change [Core Writing Team, Pachauri, R.K and Reisinger, A. (eds.)]. IPCC, Geneva, Switzerland, 104 pp.
Irons, R.; Sekkapan, G.; Panesar, R.; Gibbins, J.; Lucquiaud, M. (2007): CO2 capture ready plants. Prepared for IEA Greenhouse Gas R&D Programme. Technical study, IEA GHG Report No. 2007/4, Mai 2007.
IZ Klima (2009a): Erste Lesung des CCS-Gesetzentwurfs im Bundestag sowie erste Reaktionen. Pressemitteilung vom 08.05.2009.
IZ Klima (2009b): CCS Monitor. Ausgabe 10/2009. http://www.iz-klima.de/uploads/media/IZ_Klima_CCS_monitor_10_2009.pdf. Last access 14.11.2009.
IZT (Institut für Zukunftsstudien und Technologiebewertung): Wasserverband Nord; Wasserverband Norderdithmarschen (2009): CO2-Speicherung: Wasserversorgung im Raum Flensburg in Ge-fahr? Gemeinsame Pressemitteilung, 23.10.2009.
Jansen, D. (2009): Ökologisches Feigenblatt CCS. CO2-Abscheidung ist kein Beitrag zum Klima-schutz. Reihe BUNDhintergrund Juni 2009. Düsseldorf.
Jaramillo, P.; Griffin, W. M.; McCoy, S. T. (2009): Life Cycle Inventory of CO2 in an Enhanced Oil Re-covery System. Environmental Science & Technology, 43(21)8027-8032. doi: 10.1021/es902006h.
Junginger, M.; Lako, P.; Lensink, S.; van Sark, W.; Weiss, M. (2008): Technological learning in the energy sector. Report number 500102 017 of University Utrecht and ECN within the framework of the Netherlands Research Programme on Scientific Assessment and Policy Analysis for Cli-mate Change (WAB). http://www.pbl.nl/en/publications/2008/Technological-learning-in-the-energy-sector.html. Last access 23.01.2010.
Kerr, T.; Havercroft, I.; Dixon, T. (2009): Legal and regulatory developments associated with carbon dioxide capture and storage: A global update. Energy Procedia 1(1)4395-4402. doi:10.1016/j.egypro.2009.02.254.
Kharaka, Y.; Cole, D.; Hovorka, S.; Gunter, W.; Knauss, K.; Freifeld, B. (2006): Gas-water-rock inter-actions in Frio Formation following CO2 injection: Implications for the storage of greenhouse gases in sedimentary basins. Geology, 34(7)577–580. doi:10.1130/G22357.1.
Kharaka, Y.; Thordsen, J.; Kakouros, E. (2009): Potential environmental impacts of geologic storage of carbon dioxide: Mobilization of metals and organic compounds, 27-29.05 2009 Paris.
Kirchenkreis Nordfriesland (2009): Erklärung der Synode des Kirchenkreises Nordfriesland zum CCS-Projekt in Nordfriesland. Bewahrung der Schöpfung – Keine CO2-Einlagerung! KKSyn NF 04.07.2009.
Kohls, M., Kahle, C. (2009): Klimaschutz durch CO2-Speicherung – Das neue CCS-Gesetz, RdE 2009, S. 197 ff.
Koornneef, J.; Faaij, A.; Turkenberg, W. (2008a): The screening and scoping of environmental impact assessment and stategic environmental assessment of carbon capture and storage in the Neth-erlands. Environmental Impact Assessment Review 2008, S. 392 ff.
RECCS plus – Update and Expansion of the RECCS Study
278 Final Report
Koornneef, J.; van Keulen, T.; Faaij, A.; Turkenburg, W. (2008b): Life cycle assessment of a pul-verized coal power plant with post-combustion capture, transport and storage of CO2. Int. J. of Greenhouse Gas Control 2(4) 448-467. doi:10.1016/j.ijggc.2008.06.008.
Koster, M.R. (2008): CO2-opslag in Nederland: de nieuwe CCS-richtlijn, het huidige Nederlands wette-lijke kader, risico`s en aansprakelijkheid, Nederlands Tijdschrift for Energierecht, S. 316 ff.
Kühne, G. (2009): Unterirdische Grundstücknutzungen als Gegenstand des Zivil-, Berg-, Energie- und Umweltrechts, RdE 2009, S. 14 ff.
Lagoni, R. (2008): Haftungsfragen der CO2-Speicherung im Meeresuntergrund, ZUR 2008, S. 293 ff.
Landtag NRW (Nordrhein-Westfalen) (2009): Keine Politik gegen 100% der Bevölkerung – Entschei-dung über das CCS-Gesetz aussetzen. Aktuelle Stunde auf Antrag der Fraktion Bündnis 90/Die Grünen, Drucksache 14/9458, Düsseldorf.
Landtag Schleswig-Holstein (2009a): Landtag einig: CCS-Versuchsprojekte einstellen. Pressemittei-lung vom 16.7.2009, Kiel.
Landtag Schleswig-Holstein (2009b): CO2-Endlager verbieten. Antrag der Abgeordneten des SSW sowie der Fraktionen von SPD und Bündnis 90/Die Grünen. Drucksache 16/2810 vom 1.9.2009, Kiel.
Landtag Schleswig-Holstein (2009c): Änderungsantrag der Fraktionen der FDP und der CDU zum Antrag CO2-Endlager verbieten, Drucksache 16/2878, 17.9.2009, Kiel.
Landtag Schleswig-Holstein (2009d): Unterirdische Lagerung von CO2 bundesweit verbieten. Plenar-protokoll der 3. Sitzung des schleswig-holsteinischen Landtags, 19.11.2009, Kiel.
Larsen, J; Kelly, A. Heilmayr, R. (2009): World Resources Institute, WRI Summary of H.R. 2454, the American Clean Energy and Security Act (Waxman-Markey). http://pdf.wri.org/wri_summary_of_aces_0731.pdf. Last access 29.09.2009.
LBBW (Landesbank Baden-Württemberg) (2009): Solardarwinismus – die Besten bleiben. Branchen-analyse Photovoltaik 2009. Equity Sales. Stuttgart.
Lenz, R. (2008): Abscheidung und Speicherung von CO2 im nationalen und europäischen Umwelt-recht, Glückauf 144 (2008), S. 237 ff.
Lindeberg, E.; Vuillaume, J.; Ghaderi, A. (2009): Determination of the CO2 storage capacity of the Utsira formation. Energy Procedia, 1(1)2777-2784. doi: 10.1016/j.egypro.2009.02.049.
Luhmann, H.-J. (2009): CCS: Ein wirksamer Beitrag zum Klimaschutz? ifo Schnelldienst, 62:13–16.
Maaßen, U. (2009): Informationen und Meinungen. Ein Informationsservice des DEBRIV. Bundesver-band Braunkohle. Ausgabe 2.2009. 25.03.2009. Köln.
Martinsen, D.; Linssen, J.; Markewitz, P.; Vögele, S. (2006): CCS: A Future Mitigation Option for Ger-many? A Bottom Up Approach, Jülich.
May, F. (2003): GESTCO Final report – Work Package 2, study area F: coal mines. Final report, Bun-desanstalt für Geowissenschaften und Rohsto!e (BGR), Hannover.
May, F. (2005): Überwachung und Sicherheit von CO2-Speichern, in: Kuckshinrichs, W., Markewitz, P., Hake, J.-F. (Hrsg.): CO2-Abscheidung und -Speicherung: Eine Option für die Deutsche Kli-maschutzstrategie? – Dokumentation CCS-Tagung Jülich, 10./11. November 2005, erschienen in STE-Arbeitsbericht Nr. 4, 2005, S. 103 ff.
May, F. (2009): Aquifer storage: an option for emission reduction in Germany. Presentation at the IFP conference on Deep Saline Aquifers for Geological Storage of CO2 and Energy in Paris.
May, F.; Müller, C.; Bernstone, C. (2005): How much CO2 can be stored in deep saline aquifers in Germany? VGB PowerTech, 85(6)32–37.

References
Wuppertal Institute for Climate, Environment and Energy 279
McDonald, A.; Schrattenholzer, L. (2001): Learning rates for energy technologies. Energy Policy 29(4)255-261. doi:10.1016/S0301-4215(00)00122-1.
McKinsey (2008): Carbon Capture & Storage: Assessing the Economics. Studie von McKin-sey&Company. September 22, 2008. http://www.mckinsey.com/clientservice/ccsi/pdf/CCS_Assessing_the_Economics.pdf. Last ac-cess 29.09.2009.
Meadowcroft, J. (2010): Caching the Carbon: The Politics and Policy of Carbon Capture and Storage. Edward Elgar Publishing Ltd.
Merkel, A. (2009): Rede von Bundeskanzlerin Dr. Angela Merkel auf dem Kongress des Bundesver-bandes der Energie- und Wasserwirtschaft e.V., 24.6.2009. Berlin.
Meyer, R.; May, F.; Müller, C.; Geel, K.; Bernstone, C. (2008): Regional search, selection and geo-logical characterization of a large anticlinal structure, as a candidate site for CO2-storage in northern Germany. Environmental Geology, 54(12)1607-1618. doi:10.1007/s00254-007-0939-8.
Mißling, S. (2008): Die Gestaltung des deutschen Ordnungsrahmens für die geologische Speicherung von CO2, ZUR 2008, S. 286 ff.
MIT (2007): The Future of Coal. Options for a carbon-constrained world. An interdisciplinary MIT Study. http://web.mit.edu/coal/. Last access 25.11.2009.
Moniz, E. J. (2008): Climate Change and Energy Pathways for the Mediterranean (Bd. 15). Dordrecht: Springer Netherlands. Abgerufen von http://nora.nerc.ac.uk/3543/. Last access 05.02.2009.
Morse, R. K.; Varun, R.; He, G. (2009): The Real Drivers of Carbon Capture and Storage in China and Implications for Climate Policy. Working Paper. Standord. http://iis-db.stanford.edu/pubs/22621/WP_88_Morse_He_Rai_CCS_in_China.pdf. Last access 05.10.2009.
Morthorst, P.E. (2007): Impact of wind power on power spot prices. http://www.optres.fhg.de/events/workshop-2006-10-12/Copenhagen/Morthorst%20Cph(1206). pdf. Last access 31.03.2010.
MOST (Ministry of Science and Technology); NDRC (National Development and Reform Commission) et al. (2007): China’s Scientific & Technological Actions on Climate Change, Beijing. http://www.ccchina.gov.cn/WebSite/CCChina/UpFile/File199.pdf. Last access 05.10.2009.
Much, S. (2007): Rechtsfragen der Ablagerung von CO2 in unterirdischen geologischen Formationen, ZUR 2007, S. 103 ff.
MWME NRW (Ministerium für Wirtschaft, Mittelstand und Energie Nordrhein-Westfalen) (2009): Chri-sta Thoben – Ministerin für Wirtschaft, Mittelstand und Energie des Landes Nordrhein-Westfalen. Impulsreferat zur Tagung CCS – Landespolitischer Impuls für Klimaschutz und si-chere Energieversorgung. „Klimaschutz durch Kohlendioxidspeicherung – Potenziale und Per-spektiven für die neue CCS-Technologie“, 29.6.2009, Düsseldorf.
n-21 (2010): Technikatlas Niedersachsen: http://www.technikatlas.de/~tb4/fraktionier.htm. Last access 18.01.2010.
NABU (Naturschutzbund Deutschland) (2009): Aktualisierte Stellungnahme zum Entwurf eines Geset-zes zur Regelung von Abscheidung, Transport und dauerhafter Speicherung von Kohlendioxid (CO2ATSG). 16.4.2009. Berlin.
NETL (National Energy Technology Laboratory) (2005): Carbon Capture and Sequestration Systems Analysis Guidelines. http://www.netl.doe.gov/technologies/carbon_seq/Resources/Analysis/. Last access 11.11.2009.

RECCS plus – Update and Expansion of the RECCS Study
280 Final Report
NETL (National Energy Technology Laboratory) (2009): Carbon Sequestration. Regional Carbon Se-questration Partnerships, http://www.netl.doe.gov/technologies/carbon_seq/partnerships/partnerships.html. Last access 04.09.2009.
Neue Energie (2009a): Halligkonferenz gegen Einlagerung von CO2. Nr. 12, 10.6.2009.
Neue Energie (2009b): Kommunalvertreter gegen geplante CO2-Speicherung. Nr. 12, 10.6.2009.
Nitsch, J. (2009): Was kostet der Ausbau erneuerbaren Energien? Manuskript. Stuttgart 21. 12. 2009.
Nooner, S. L.; Eiken, O.; Hermanrud, C.; Sasagawa, G. S.; Stenvold, T.; Zumberge, M. A. (2007): Constraints on the in situ density of CO2 within the Utsira formation from time-lapse seafloor gravity measurements. Int. J. of Greenhouse Gas Control, 1(2)198-214. doi: 10.1016/S1750-5836(07)00018-7.
North, F. (1985): Petroleum Geology. Kluwer Academic Publishers.
NPD (2007): Norwegian Continental Shelf (Nr. 2). Stavanger: Norwegian Petroleum Directorate. Abge-rufen von http://www.npd.no/Global/Engelsk/3%20-%20Publications/Norwegian%20Continental%20Shelf/PDF/2007-no.%202.pdf.
NPD (2009): Norwegian Continental Shelf (Nr. 2). Stavanger: Norwegian Petroleum Directorate. Abge-rufen von http://www.npd.no/en/Publications/Norwegian-Continental-Shelf/No2-2009/.
Öko-Institut (2007): CO2-Abscheidung und -Ablagerung bei Kraftwerken Rechtliche Bewertung, Regu-lierung, Akzeptanz, Endbereicht, von Matthes, F., Repenning, J., Hermann, A. und weiteren, Berlin/Darmstadt 2007. http://www.oeko.de/oekodoc/759/2007-222-de.pdf. Last access 22.01.2010.
Öko-Institut (2009): Regulierung von CO2-Abscheidung und –Ablagerung (CCS) – Der Entwurf für das Kohlendioxid-Speicherungsgesetz (KSpG), Stellungnahme zum Entwurf für das KSpG zur An-hörung des Ausschusses für Umwelt, Naturschutz und Reaktorsicherheit des 16. Deutschen Bundestages am 25.05.2009, Ausschuss-Drucksache 16(16)632(F). http://www.bundestag.de/bundestag/ausschuesse/a16/anhoerungen/91_Sitzung/A-Drs_16-16-632_F_.pdf. Last access 22.01.2010.
Pehnt, M.; Henkel, J. (2009): Life cycle assessment of carbon dioxide capture and storage from lignite power plants. Int. J. of Greenhouse Gas Control 3(1) 49-66. http://dx.doi.org/10.1016/j.ijggc.2008.07.001.
Pershad, H.; Slater, S. (2007): Development of a CO2 transport and storage network in the North Sea (Report to the North Sea Basin Task Force). Department for Business, Enterprise and Regula-tory Reform (BERR), Element Energy, BGS and Pöyry Energy.
Plass, L. (2002): CO2-Abtrennung/Nutzung/Deponierung, BMWi Workshop zum Sachstand in ARGE II.
Pollak, M. F.; Johnson, J. A.; Wilson, E. J. (2009): The geography of CCS regulatory development in the U.S., Energy Procedia 1(2009)4543-4550. doi:10.1016/j.egypro.2009.02.273.
Prado, A. J.; Pérez del Villar, L.; Pelayo, M. (2008): Selección de formaciones favorables para el al-macenamiento geológico de CO2 y cálculo de la capacidad de almacenamiento en la Cuenca del Duero. VII Congreso Geológico de España. GEO-TEMAS, 101238.
Prognos AG (2009): Ökonomische Effekte der Einführung von CCS in der Stromerzeugung. Basel, 17. Februar 2009; Studie von M. Schlesinger. http://www.iz-klima.de/fileadmin/website/downloads/Prognos-CCS-Studie_090217.pdf. Last access 23.01.2010.
Prognos AG; Öko-Institut; Ziesing, H.-J. (2009): Modell Deutschland. Klimaschutz bis 2050: Vom Ziel her denken. Basel; http://www.wwf.de/downloads/publikationsdatenbank/ddd/32874/. Last ac-cess 23.01.2010.

References
Wuppertal Institute for Climate, Environment and Energy 281
Pruess, K. (2009): Numerical modeling of coupled processes in aquifer storage of greenhouse gases. Presentation at the IFP conference on Deep Saline Aquifers for Geological Storage of CO2 and Energy in Paris.
Radgen, P.; Kutter, S.; Kruhl, J. (2009): The legal and political framework for CCS and its implications for a European Utility, Energy Procedia 1(2009)4601-4608. doi:10.1016/j.egypro.2009.02.280.
Rasmussen, M. (2008): Carbon dioxide capture with algae. Präsentation vom 20. August 2008. http://www.sartec.com/co2capture.pdf. Last access 30.09.2009.
Rat für nachhaltige Entwicklung (2003): Perspektiven der Kohle in einer nachhaltigen Energiewirt-schaft. Leitlinien einer modernen Kohlepolitik und Innovationsförderung, Berlin.
Rat für nachhaltige Entwicklung (2008): Positionen des Nachhaltigkeitsrat zu aktuellen Fragen der Klima- und Energiepolitik, 27.10.2008, Berlin.
Rat für nachhaltige Entwicklung (2009a): Hauff fordert Forschungsinitiative für zu Kohendioxid-Recycling. Pressemitteilung vom 5.6.2009, Berlin.
Rat für nachhaltige Entwicklung (2009b): Hauff kritisiert Umweltgutachter: Provinzielles Denken beim Klimaschutz. Pressemitteilung vom 14.5.2009, Berlin.
Rat für nachhaltige Entwicklung (2009c): „Saubere Kohle“: Nachhaltigkeitsexperten drängen auf deut-sche Vorreiterrolle. Pressemitteilung vom 20.11.2009, Berlin.
Redeker (2008): Vorschlag für ein Gesetz über Anlagen zur Abscheidung, zum Transport und zur Speicherung von Kohlendioxid (Kohlendioxid-Anlagengesetz) vom 03.09.2008, Kanzlei Rede-ker, Sellner, Dahs & Widmaier (unveröffentlicht).
Riis, F. (2007): Carbon containment in the spotlight. Abgerufen von http://www.npd.no/English/Aktuelt/Nyheter/2007.10.29+Store+muligheter+for+lagring+av+CO2.htm.
Robin Wood: Erneuerbare Energien statt Kohle. Saubere Kohle wird es nicht geben! http://www.robinwood.de/german/energie/braunkohle/Positionspapier%20Clean%20Coal.pdf. Last access 18.12.2009.
Roggenkamp, M. (2008): CCS: Regulating Subsoil Storage of CO2, Vortrag, http://www.rug.nl/Rechten/onderzoek/GCEL/PPGCELstorage.ppt. Last access 29.09.2009.
Rubin, E.S.; Yeh, S.; Hounshell, D.; Taylor, M.R. (2004): Experience curves for power emission con-trol technologies. Int. J. of Energy Technology and Policy 2(1/2)52-59 Doi:10.1504/IJETP.2004.004587.
SCCS (2009a): Where is CO2 Storage Taking Place? Scottish Centre for Carbon Storage. http://wbw.geos.ed.ac.uk/sccs/storage/storageSitesFree.html. Last access 30.09.2009.
SCCS (2009b): Opportunities for CO2 Storage around Scotland - an integrated strategic research study. Edinburgh: Scottish Centre for Carbon Storage. Abgerufen von http://www.geos.ed.ac.uk/sccs.
Schäfer, S. (2009): CO2-Minderung aus Sicht der Zementindustrie. Forschungsinstitut der Zementin-dustrie. Vortrag auf der 11. Sitzung des Kompetenz-Netzwerks Kraftwerkstechnik.
Schellnhuber, J. (2009): TheMAD Challenge: Towards a Great Land-UseTransformation? Plenary presentation at the International Scientific Congress on Climate Change 2009. Available online at: http://climatecongress.ku.dk/presentations/congresspresentations/. Last access 31.01.2010.
Schill, W-P.; Dieckmann, J.; Kemfert, C. (2009): Energie- und Klimaschutzpolitik: USA holen nur lang-sam auf, DIW-Wochenbericht Nr. 46/2009 vom 11.11.2009, S. 796 ff.
Schindler, J.; Zittel, W. (2008): Zukunft der weltweiten Erdölversorgung. Berlin: Energy watch group.

RECCS plus – Update and Expansion of the RECCS Study
282 Final Report
Schleswig-Holsteinischer Zeitungsverlag (2009a): „Der Dreck wird nur unter den Teppich gekehrt“, 11.7.2009.
Schleswig-Holsteinischer Zeitungsverlag (2009b): Stadt spricht sich gegen CO2-Speicher aus, 23.7.2009.
Scholz, F.; Hasse, U. (2008): Permanent Wood Sequestration: The Solution to the Global Carbon Dioxide Problem (p NA). ChemSusChem 1(5)381-384, Doi:10.1002/cssc.200800048.
Schrag, D. P. (2009): Storage of Carbon Dioxide in Offshore Sediments. Science, 325(5948)1658-1659. doi: 10.1126/science.1175750.
Schreiber, A.; Zapp, P.; Kuckshinrichs, W. (2009): Environmental assessment of German electricity generation from coal-fired power plants with amine-based carbon capture. Int J Life Cycle As-sess 14(6)547-559. doi:10.1007/s11367-009-0102-8.
Schreurs, H. (2008): Carbon Capture and Storage: An update from the Netherlands. Presentation at Kompetenz-Netzwerk Kraftwerkstechnik NRW, Vortrag, Gelsenkirchen.
Schuppers, J.; Holloway, S.; May, F.; Gerling, J. P.; Boe, R.; Magnus, C.; Riis, F.; Osmundsen, P.; Larsen, M.; Andersen, P.; Hatzyannis, G. (2003): Storage capacity and quality of hydrocarbon structures in the North Sea and the Aegean region.
Scinexx (2004): Fremde Welt im Untergrund – Wimmelndes Leben und jede Menge Fragen. Scinexx vom 15.01.2004. http://www.scinexx.de/dossier-detail-7-5.html. Last access 13.01.2010.
Scinexx (2008): Auf glühenden Kohlen – Wenn unterirdische Flöze Feuer fangen. Scinexx vom 13.06.2008. www.scinexx.de/dossier-402-1.html. Last access 13.01.2010.
Sedlacek, R. (2009): Untertage-Gasspeicherung in Deutschland, Erdöl Erdgas Kohle 2009, S. 412 ff.
Sensfuß, F. (2008a): Assessment of the impact of renewable electricity generation on the German electricity sector An agent-based simulation approach. Dissertation. Universität Karlsruhe (TH). Fortschritt-Berichte Reihe 16 Nr. 188. VDI Verlag. Düsseldorf.
Sensfuß, F. (2008b): Regenerative Energien können Preise senken. Erneuerbare Energien. Mai 2008, Seite 72-73.
Sensfuß, F.; Ragwitz M. (2007): Analyse des Preiseffektes der Stromerzeugung aus erneuerbaren Energien auf die Börsenpreise im deutschen Stromhandel - Analyse für das Jahr 2006 - Gut-achten im Rahmen von Beratungsleistungen für das Bundesministerium für Umwelt, Natur-schutz und Reaktorsicherheit (BMU).
Sensfuß, F; Ragwitz, M. (2008): An Agent-based simulation platform as support tool for the analysis of the interactions of renewable electricity generation with the electricity and the CO! market. In Möst, D.; Fichtner, W.; Ragwitz, M.; Veit, D. (Eds): New methods for energy market modelling: Proceedings of the First European Workshop on Energy Market Modelling using Agent-Based Computational Economics. Universitätsverlag Karlsruhe.
Sensfuß, F.; Ragwitz, M.; Genoese, M. (2008): The Merit-order effect: A detailed analysis of the price effect of renewable electricity generation on spot market prices in Germany. Energy Policy, 36(8)3096-3094. doi:10.1016/j.enpol.2008.03.035.
Shi, J.; Durucan, S. (2005): CO2 Storage in deep unminable coal seams. Oil & Gas Science and Technology – Rev. IFP, 60(3)547–558. doi:10.2516/ogst:2005037.
Shisen, X. (2007): GreenGen – Near Zero Emission Coal Based Power Generation Project in China. Präsentation vom 23. Mai 2007. http://belfercenter.ksg.harvard.edu/files/07-shisen%20xu.pdf. Last access 05.10.2009.
Shogenova, A.; Sliaupa, S.; Shogenov, K.; Sliaupiene, R.; Pomeranceva, R.; Vaher, R.; Uibu, M.; Ku-usik, R. (2009): Possibilities for geological storage and mineral trapping of industrial CO2 emis-sions in the Baltic region. Energy Procedia, 1(1)2753-2760. doi: 10.1016/j.egypro.2009.02.046.
References
Wuppertal Institute for Climate, Environment and Energy 283
Sim, S.; Brunelle, P.; Turta, A.; Singhal, A. (2008): Enhanced Gas Recovery and CO2 Sequestration by injection of exhaust gases from combustion of bitumen. In Proceedings of SPE/DOE Sympo-sium on Improved Oil Recovery. doi: 10.2118/113468-MS.
Slutz, J. A. (2008): Office of Fossil Energy. FY 2009 Budget Request. Präsentation vom 4. Februar 2008.
Smith, K.; Ghosh, U.; Khan, A.; Simioni, M.; Endo, K.; Zhao, X.; Kentish, S.; Qader, A.; Hooper, A.; Hooper, B.; Stevens, G. (2008): Recent developments in solvent absorption technologies at the CO2CRC in Australia. Energy Procedia 1(1)1549-1555. doi:10.1016/j.egypro.2009.01.203.
SPD (2007): Neue Energie. Sozialdemokratische Energie- und Klimapolitik für das 21. Jahrhundert, Berlin.
SPD (2009): Sozial und Demokratisch. Anpacken für Deutschland. Das Regierungsprogramm der SPD. Berlin.
SPD Brandenburg; Die Linke Brandenburg (2009): Gemeinsinn und Erneuerung: Ein Brandenburg für alle. Koalitionsvertrag zwischen SPD Brandenburg und Die Linke Brandenburg für die 5. Wahl-periode des Brandenburg Landtages, Potsdam.
SPD-Landtagsfraktion Brandenburg (2009): CCS-Lagerung: Konsequente Einbeziehung der Bürger notwendig. Pressemitteilung vom 23.4.2009, Potsdam.
Specht, M.; Bandi, A. (2007): Herstellung von flüssigen Kraftstoffen aus atmosphärischem Kohlendi-oxid – Ein Beitrag zur Lösung der Speicherproblematik. Solarenergie-Förderverein Deutschland e.V. 12.12.2007, http://www.sfv.de/artikel/herstellung_von_fluessigen_kraftstoffen_aus_atmosphaerischem_kohlendioxis.htm. Last access 13.01.2010.
Spiegel Online (2009): RWE startet Pilotanlage zur Rauchgaswäsche, http://www.spiegel.de/wissenschaft/mensch/0,1518,643499,00.html. Last access 30.9.2009.
SRU (Sachverständigenrat für Umweltfragen) (2008): Umweltgutachten 2008 – Umweltschutz im Zei-chen des Klimawandels.
SRU (2009a): Abscheidung, Transport und Speicherung von Kohlendioxid. Der Gesetzentwurf der Bundesregierung im Kontext der Energiedebatte. Stellungnahme Nr. 13 des Sachverständigen-rates für Umweltfragen der Bundesregierung, April 2009. http://www.umweltrat.de/03stellung/downlo03/stellung/Stellung_CCS_2009_Mai.pdf. Last ac-cess 29.09.2009.
SRU (Sachverständigenrat für Umweltfragen) (2009b): Anregungen des SRU zu den Koalitionsver-handlungen. Schreiben an die Verhandlungsgruppen von CDU/CSU und FDP Wirt-schaft/Energie/Aufbau Ost und Umwelt/Verbraucherschutz/Landwirtschaft, 13.10.2009, Berlin. http://www.umweltrat.de/. Last access 08.12.2009.
Staatskanzlei Brandenburg (2009): Platzeck: Technologieführerschaft bei CCS nicht verspielen. Pres-semitteilung vom 14.3.2009, Potsdam.
Stevens, B. (2007): Das CO2-emissionsarme Kohlekraftwerk, UPR 2007, S. 281 ff.
Stoll, P.-T.; Lehmann, F. (2008): Die Speicherung von CO2 im Meeresgrund – die völkerrechtliche Sicht, ZUR 2008, S. 281 ff.
van der Straaten, R.; Elewaut, E.; Koelewijn, D.; Baily, H.; Holloway, S.; Barbier, J.; Lindeberg, E.; Möller, H.; Gaida, K. (1996): Inventory of the CO2 Storage capacity of the European Union and Norway. In Final report of the Joule II project No. CT92-0031: The Underground Disposal of Carbon Dioxide. Nottingham: British Geological Survey.
Suri, R. (2007): Industrielle Nutzung von CO2 aus Zementöfen für Biomasse. ZKG International 60(7)72-79.

RECCS plus – Update and Expansion of the RECCS Study
284 Final Report
TAB (Büro für Technikfolgen-Abschätzung beim Deutschen Bundestag) (2007): CO2-Abscheidung und -Lagerung bei Kraftwerken. Sachstandsbericht zum Monitoring „Nachhaltige Energieversor-gung“. Bearbeitet von Rainer Grünwald, Arbeitsbericht Nr. 120, Berlin.
Tagesspiegel (2009): Die Kohle hat der Teufel erschaffen – vertrocknete Naturparadiese, Risse in Straßen und Häusern, verlorene Dörfer: Der Preis für den deutschen Kohleabbau ist hoch. Der Tagesspiegel vom 14.11.2009. http://www.tagesspiegel.de/wirtschaft/Kohle-Klimaserie;art271,2949159. Last access 13.01.2010.
TAZ (Die Tageszeitung) (2009a): Koalitionsverhandlungen in Brandenburg. Braunkohle wird zum Zündstoff. 19.10.2009.
TAZ (2009b): Klimaexperte für weltweiten Kohlendioxidhandel. „Wir regulieren zu viele Details“. 5.5.2009.
Thibeau, S. (2009): Have we overestimated saline aquifer CO2 storage capacity? Presentation at the IFP conference on Deep Saline Aquifers for Geological Storage of CO2 and Energy in Paris.
Treber, M. (2009): CCS trotz der gewachsenen Notwendigkeit starker Emissionsminderungen weiter-hin umstritten. Mitteilung vom 02.06.2009, http://www.germanwatch.org/klima/ccs-kber.htm. Last access 21.09.2009.
Tucker, M. E. (2006): Sedimentary petrology: an introduction to the origin of sedimentary rocks. 262 p., Blackwell Science, Oxford [u.a.], 3rd edition.
TÜV NORD CERT (2008): Carbon Capture Ready – die Lösung zur Prüfung neuer Kraftwerke hin-sichtlich CCS. http://www.carbon-capture-ready.com/. Last access 30.09.2009.
Turkovic, R. (2002): Technische und ökonomische Bewertung von Abscheidetechnologien, Trans-portalternativen und Speichermöglichkeiten in geologischen Formationen für CO2 aus fossil be-feuerten Kraftwerken in Baden-Württemberg. Diplomarbeit, Universität Karlsruhe, Karlsruhe.
UBA (2006): Technische Abscheidung und Speicherung von CO2 – nur eine Übergangslösung: Positi-onspapier des Umweltbundesamtes zu möglichen Auswirkungen, Potenzialen und Anforderun-gen. Umweltbundesamt (Hrsg.), Dessau 2006. http://www.umweltdaten.de/publikationen/fpdf-l/3074.pdf. Last access 24.11.2009.
UBA (2007): Politikszenarien für den Klimaschutz IV – Szenarien bis 2030. Studie von DIW Berlin, Öko-Institut, Fraunhofer ISI Karlsruhe und Forschungszentrum Jülich, STE im Auftrag des Um-weltbundesamts. Dessau.
UBA (2008): CO2-Abscheidung und Speicherung im Meeresgrund – Meeresökologische und geologi-sche Anforderungen für deren langfristige Sicherheit sowie Ausgestaltung des rechtlichen Rahmens (2008). Ginzky, H.; Hahlbeck, E.: Umweltbundesamt. UBA-Texte 24/08, S. 99 ff. Des-sau.
UBA (2009a): CCS – Rahmenbedingungen des Umweltschutzes für eine sich entwickelnde Technik, Aktualisierung des Positionspapiers des Umweltbundesamtes zur technischen Abscheidung und Speicherung von CO2, Umweltbundesamt, Mai 2009. http://www.umweltdaten.de/publikationen/fpdf-l/3804.pdf. Last access 22.01.2010.
UBA (2009b): Emissionsbilanz erneuerbarer Energieträger. Durch Einsatz erneuerbarer Energien vermiedene Emissionen im Jahr 2007. http://www.erneuerbare-energien.de/inhalt/45411/. Last access 25.01.2010.
Vallentin, D. (2009): Coal-to-Liquids: Driving Forces and Barriers – Synergies and Conflicts from an Energy and Climate Policy Perspective, Stuttgart.
van den Broek, M.; Ramírez, A.; Groenenberg, H.; Neele, F.; Viebahn, P.; Turkenburg, W.; Faaij, A. (2009): Feasibility of storing CO2 in the Utsira formation as part of a long term Dutch CCS strat-egy: An evaluation based on a GIS/MARKAL toolbox. Int. J. of Greenhouse Gas Control, In Press, Corrected Proof. doi: 10.1016/j.ijggc.2009.09.002.

References
Wuppertal Institute for Climate, Environment and Energy 285
van der Meer, L. G. H.; Egberts, P. (2008): A General Method for Calculating Subsurface CO2 Storage Capacity. Paper for presentation at the 2008 Offshore Technology Conference in Houston, Texas, U.S.A., OTC 19309.
van der Meer, L. G. H.; Yavuz, F. (2009): CO2 storage capacity calculations for the Dutch subsurface. Energy Procedia, 1(1)2615-2622. doi: 10.1016/j.egypro.2009.02.028.
van der Straaten, R.; Elewaut, E.; Koelewijn, D.; Baily, H.; Holloway, S.; Barbier, J.; Lindeberg, E.; Möller, H.; Gaida, K. (1996): Inventory of the CO2 storage capacity of the European Union and
Norway. In S. Holloway (editor), Final report of the Joule II project No. CT92-0031: The Under-
ground Disposal of Carbon Dioxide, 16–115. British Geological Survey, Nottingham.
Vangkilde-Pedersen, T.; Anthonsen, K. L.; Smith, N.; Kirk, K.; Neele, F.; van der Meer, B.; Gallo, Y. L.; Bossie-Codreanu, D.; Wojcicki, A.; Nindre, Y.-M. L.; Hendriks, C.; Dalho, F.; Christensen, N. P. (2008): Assessing European capacity for geological storage of carbon dioxide – the EU GeoCa-pacity project. Energy Procedia of the GHGT-9, 1(1): 2663-2670. doi:10.1016/j.egypro.2009.02.034.
Vangkilde-Pedersen, T.; Neele, F.; Wojcicki, A.; Nindre, Y.-M. L.; Kirk, K.; Anthonsen, K.; Hendriks, C.; Maurand, N.; Smith, N. (2009a): GeoCapacity. Final report D 42, EU GeoCapacity, Denmark.
Vangkilde-Pedersen, T.; Neele, F.; Wojcicki, A.; Nindre, Y.-M. L.; Kirk, K.; Anthonsen, K.; Hendriks, C.; Maurand, N.; Smith, N.; Knopf, S.; Car, M.; May, F. (2009b): Storage capacity. WP 2 Report D16, EU GeoCapacity, Denmark.
Vangkilde-Pedersen, T.; Vosgerau, H.; Willscher, B.; Neele, F.; van der Meer, B.; Bossie-Codreanu, D.; Wojcicki, A.; Nindre, Y.-M. L.; Kirk, K.; von Dalwigk, I.; Anthonsen, K. (2009c): Capacity standards and site selection criteria. WP 4 Report D 26, EU Geocapacity, Denmark.
van Noorden, Richard (2007): BP pulls out of carbon capture plans, 24.05.2007 at RSC advancing the chemical sciences. http://www.rsc.org/chemistryworld/News/2007/May/24050703.asp. Last ac-cess 29.09.2009.
Vattenfall Europe (2009a): Die Demonstrationskraftwerke, http://www.vattenfall.de/www/vf/vf_de/225583xberx/228407klima/228587co2-f/1434925unter/index.jsp. Last access 9.9.2009
Vattenfall Europe (2009b): Die CCS-Pilotanlage, http://www.vattenfall.de/www/vf/vf_de/225583xberx/228407klima/228587co2-f/1441026diexp/index.jsp. Last access 8.9.2009.
Vattenfall Europe (2009c): Mit konkreten Maßnahmen Energieregion profilieren, http://www.vattenfall.de/www/vf/vf_de/225583xberx/232127press/232157press/232187archi/258228press/index.jsp?pmid=145252. Last access 9.9.2009.
Viebahn, P.; Kronshage, S.; Trieb, F.; Lechon, Y. (2008): Final report on technical data, costs and life cycle inventories of solar thermal power plants. Deliverable no. 12.2-RS Ia, EU-NEEDS. www.needs-project.org. Last access 08.02.2010.
Viebahn, P.; Luhmann, H-J. (2009): Der europäische Rechtsrahmen für CCS: Was ist entschieden, was bleibt zu tun? Energiewirtschaftliche Tagesfragen, 59(1-2)40-43.
Vuuren, P. van; Elzen, M.G.J.; Lucas, P.L., Eickhourt B.; Strengers, B.J.; Ruijven, B. van; Wonink, S.; Houdt, R. van (2007): Stabilizing greenhouse gas concentration at low levels: an assessment of reduction strategies and costs. Climate Change 81(2)119-159. Doi:10.1007/s10584-006-9172-9.
Watanabe, R.; Duckat, R.; Sterk, W. (2007): Carbon Capture and Storage under the Clean Develop-ment Mechanism. Impact on the Long-term Climate Goal, Energy Supply Planning and Devel-opment Paths. JIKO Policy Paper 4, Juni 2007. Wuppertal.
WBGU (Wissenschaftlicher Beirat der Bundesregierung für Globale Umweltveränderungen) (2006): The Future Oceans – Warming Up, Rising High, Turning Sour. Special Report, Berlin.
RECCS plus – Update and Expansion of the RECCS Study
286 Final Report
WDR (2009): CO2-Lagerung ungeklärt – RWE bremst bei Kraftwerk Hürth. http://www.wdr.de/themen/wirtschaft/wirtschaftsbranche/energiekonzerne/091111.jhtml?rubrikenstyle=wirtschaft. Last access 14.11.2009.
Welt online (2004): Letzte Hornoer sagen: „Wir gehen nicht". Welt online vom 30.08.2004. www.welt.de/print-welt/article337333/Letzte_Hornoer_sagen_Wir_gehen_nicht.html. Last ac-cess 13.01.2010.
WI (Wuppertal Institut für Klima, Umwelt, Energie) (2009): Energiewirtschaftliche, strukturelle und in-dustriepolitische Analyse der Nachrüstung von Kohlekraftwerken mit einer CO2-Rückhaltung in NRW. Studie im Auftrag des Ministeriums für Wirtschaft, Mittelstand und Energie in Nordrhein-Westfalen. Abschlussbericht. Wuppertal. http://www.wupperinst.org/de/projekte/proj/index.html?projekt_id=203&bid=136. Last access 12.09.2009.
WI (Wuppertal Institut für Klima, Umwelt, Energie), DLR (Deutsches Zentrum für Luft- und Raumfahrt), PIK (Potsdam-Institut für Klimafolgenforschung), ZSW (Zentrum für Sonnenenergie- und Was-serstoff-Forschung) (2007): RECCS – Strukturell-ökonomisch-ökologischer Vergleich regenera-tiver Energietechnologien (RE) mit Carbon Capture and Storage (CCS). Untersuchung im Auf-trag des BMU. Endbericht. Wuppertal, Stuttgart, Potsdam. http://www.bmu.de/erneuerbare_energien/downloads/doc/38826.php. Last access 30.09.2009.
WI (Wuppertal Institut für Klima, Umwelt, Energie), FZJ (Forschungszentrum Jülich), ISI (Fraunhofer Institut ISI Karlsruhe), BSR (BSR Sustainability) (2008): Sozioökonomische Begleitforschung zur gesellschaftlichen Akzeptanz von Carbon Capture and Storage (CCS) auf nationaler und in-ternationaler Ebene, Studie im Auftrag des BMWi. http://www.wupperinst.org/info/entwd/index.html?beitrag_id=841&bid=155. Last access 29.09.2009.
Wildbolz C. (2007): Life Cycle Assessment of Selected Technologies for CO2 Transport and Seques-tration. Diploma Thesis No. 2007 MS05, Department Bau, Umwelt und Geomatik, Institute of Environmental Engineering (IfU), ETHZ, Zurich, Switzerland.
Willecke, R. (1970): Behördliche Zuständigkeit zur Aufsicht über die Anlage und den Betrieb von Un-tertagespeichern, DVBl. 1970, S. 370 ff.
Winter, J. (2008): Nanomaterials doubles CO2 sequestration. http://ecolectic.org/?p=28. Last access 20.01.2010.
Wirtschaftsvereinigung Stahl (2009): Stellungnahme zum Entwurf der Bundesregierung vom 1. April 2009 zu einem Gesetz zur Regelung von Abscheidung, Transport und dauerhafter Speicherung von Kohlendioxid (CCS). 19.05.2009.
Wörlen, C.; Pickerson, W.; Marrs, Br.; Holzhausen, G. (2009): USA Energie- und Klimapolitik, Akteure und Trends im August 2009, Heinrich-Böll-Stiftung.
Wolff, R. (2009): Aus für CCS. die tageszeitung vom 05.09.2009. http://www.taz.de/1/zukunft/wirtschaft/artikel/1/aus-fuer-ccs/. Last access 30.09.2009.
WWF (2009): Positionspapier. Stellungnahme zum Gesetz zur Regelung von Abscheidung, Transport und dauerhafter Speicherung von Kohlendioxid (CCS). Bearbeitungsstand 18.02.2009. Berlin.
Zenke, I.; Vollmer, M. (2009): Der künftige Rechtsrahmen für die Abscheidung und Speicherung von CO2, IR 2009, S. 129 ff.
ZEP (2006): A Vision for Zero Emission Fossil Fuel Power Plants (Report by the Zero Emission Fossil Fuel Power Plants Technology Platform Nr. EUR 22043). Luxembourg : Office for Official Publi-cations of the European Communities: European Commission - Directorate-General for Re-search. Abgerufen von http://www.zero-emissionplatform.eu/website/library/index.html.
ZEP (2008): EU Demonstration Programme for CO2 Capture and Storage (CCS). ZEP's Proposal. European Technology Platform for Zero Emission Fossil Fuel Power Plants, 11/2008.

References
Wuppertal Institute for Climate, Environment and Energy 287
Zhou, Q.; Birkholzer, J. T.; Tsang, C.-F.; Rutqvist, J. (2008): A method for quick assessment of CO2
storage capacity in closed and semi-closed saline formations. Int. J. of Greenhouse Gas Control 2(4)626-639. doi:10.1016/j.ijggc.2008.02.004.
Zydek, H. (1980): Bundesberggesetz (BBergG) mit amtlicher Begründung und anderen amtlichen Materialien, 1980.
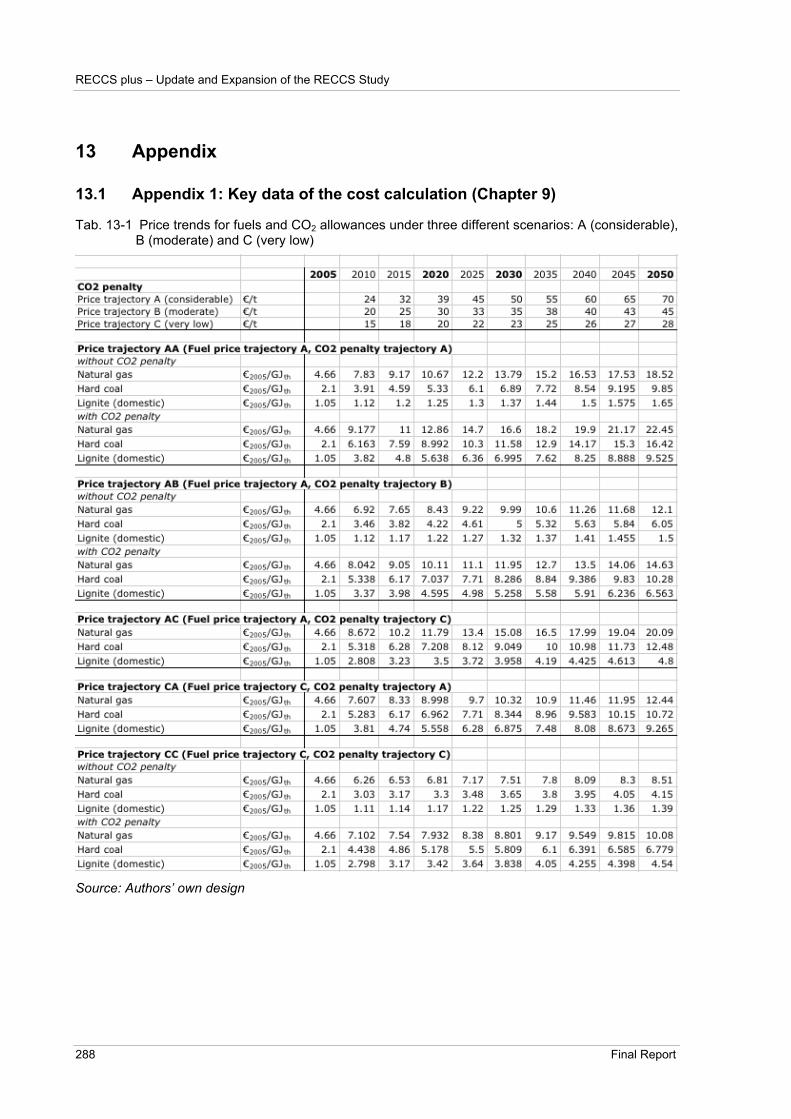
RECCS plus – Update and Expansion of the RECCS Study
288 Final Report
13 Appendix
13.1 Appendix 1: Key data of the cost calculation (Chapter 9)
Tab. 13-1 Price trends for fuels and CO2 allowances under three different scenarios: A (considerable), B (moderate) and C (very low)
Source: Authors’ own design

Appendix
Wuppertal Institute for Climate, Environment and Energy 289
Tab. 13-2 Electricity generating costs for fossil fuel-fired power plants with/without CCS for different energy source and CO2 price trajectories A/C (considerable/very low) and C/A (very low/considerable)
Source: Authors’ own design

RECCS plus – Update and Expansion of the RECCS Study
290 Final Report
Tab. 13-3 Future cost trend of electricity-generating renewable energy technologies (new plants) and the mean of the whole mix of renewable energies (with/without photovoltaics)
Source: Authors’ own design

Appendix
Wuppertal Institute for Climate, Environment and Energy 291
13.2 Appendix 2: Key data of variants 1 to 6 of scenario CCS-EE/KWK (Chap-
ter 10)
Tab. 13-4 Key data of the scenario variant “Maximal-theoretisch”

RECCS plus – Update and Expansion of the RECCS Study
292 Final Report
Source: Authors’ own design

Appendix
Wuppertal Institute for Climate, Environment and Energy 293
Tab. 13-5 Key data of the scenario variant “Maximal-realistisch”

RECCS plus – Update and Expansion of the RECCS Study
294 Final Report
Source: Authors’ own design
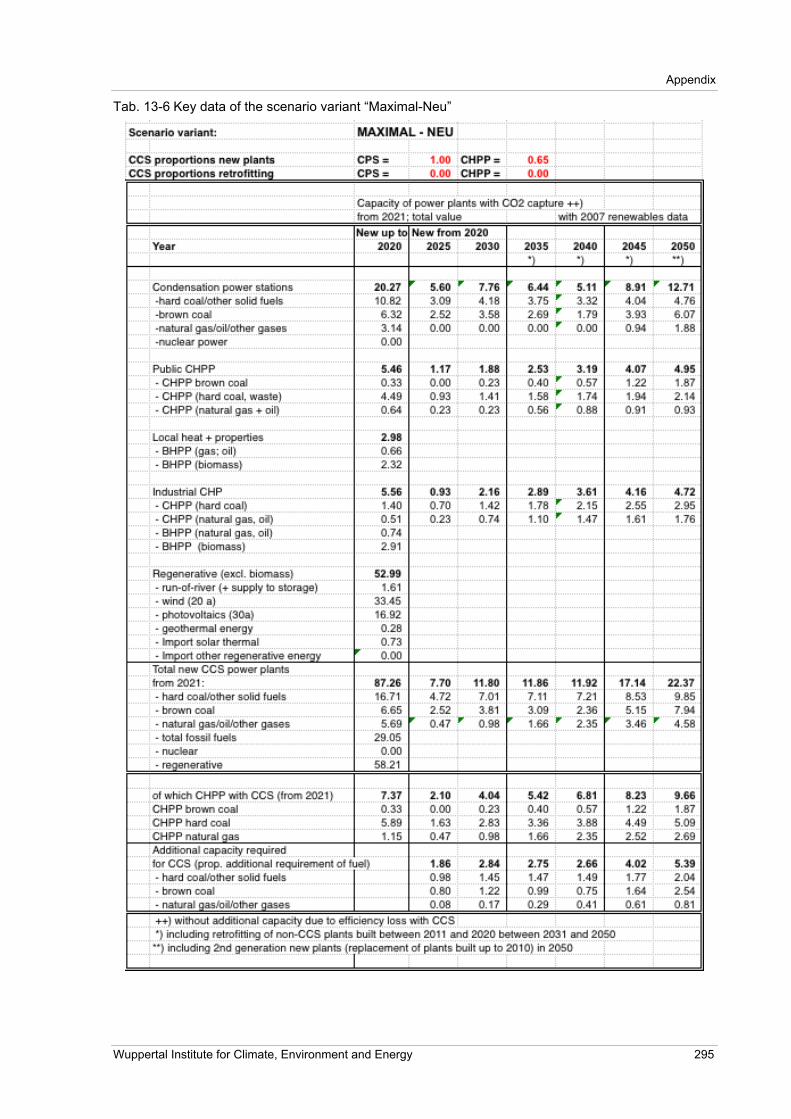
Appendix
Wuppertal Institute for Climate, Environment and Energy 295
Tab. 13-6 Key data of the scenario variant “Maximal-Neu”

RECCS plus – Update and Expansion of the RECCS Study
296 Final Report
Source: Authors’ own design

Appendix
Wuppertal Institute for Climate, Environment and Energy 297
Tab. 13-7 Key data of the scenario variant “Realistisch I”

RECCS plus – Update and Expansion of the RECCS Study
298 Final Report
Source: Authors’ own design

Appendix
Wuppertal Institute for Climate, Environment and Energy 299
Tab. 13-8 Key data of the scenario variant “Realistisch I – only Kohle”

RECCS plus – Update and Expansion of the RECCS Study
300 Final Report
Source: Authors’ own design

Appendix
Wuppertal Institute for Climate, Environment and Energy 301
Tab. 13-9 Key data of the scenario variant “Realistisch II”

RECCS plus – Update and Expansion of the RECCS Study
302 Final Report
Source: Authors’ own design

Appendix
Wuppertal Institute for Climate, Environment and Energy 303
13.3 Appendix 3: Pipeline infrastructure scenarios
Fig. 13-1 Exemplary illustration of pipeline infrastructure scenarios resulting from a CCS-MAX strategy in North Rhine-Westphalia (total distances of 4,330 km in scenario 1-A, 8,380 km in scenario 1-B and 1,140 km in scenario 1-C)
Source: WI 2009