The missing link: Connecting organizational and financial ...
14
February 2007 Confidential Working Paper Copyright 2007 McKinsey & Company Aaron De Smet Rodgers Palmer William Schaninger The Missing Link Connecting Organizational and Financial Performance
Transcript of The missing link: Connecting organizational and financial ...

February 2007Confidential Working Paper
Copyright 2007 McKinsey & Company
Aaron De SmetRodgers PalmerWilliam Schaninger
The Missing LinkConnecting Organizational and
Financial Performance
Contents
3 Introduction
3 Strong organizations have better financial results
7 Achieving top-quartile organizational performance
8 Focus on a few practices
8 Target distinctiveness in four to five practices
9 Create your blend for success
11 Structuring an improvement program
12 A word about our data set, methodology, and analysis
2

“When you can measure what you are speakingabout, and express it in numbers, you know some-thing about it; but when you cannot measure it,when you cannot express it in numbers, yourknowledge is of a meager and unsatisfactory kind.”
–William Thompson (Lord Kelvin), 1824-1907
IntroductionLeaders know from experience that having a“good” or “effective” organization is important.Yet many spend only a small fraction of their timeand energy attempting to improve their organiza-tion’s effectiveness. Executives may talk aboutmanaging talent and building a strong culture, butin fact, they are likelier to turn their attention tomore tangible matters such as operations andfinances.
Many leaders find it difficult to measure the impactof organizational effectiveness relative to “hard”characteristics such as costs, revenues, and margins.Some lack a firm grip on the specific activitiesrequired to make an organization more effective, orsimply on what a good organization looks like. Oth-ers question which aspects of organizational effec-tiveness actually yield improvements to the bottomline. How do happy, fulfilled employees and cohe-sive teams translate into value for shareholders?
We now have some answers to these questions. Theresults of McKinsey’s Organizational PerformanceProfile (OPP) survey demonstrate not only the
degree to which organizational performance mat-ters but also the particular management practicesthat companies can pursue to improve financialresults.1 The proprietary survey, involving morethan 115,000 individuals in 231 organizations,examined nine attributes, or “outcomes,” of orga-nizational effectiveness, and the behaviors or prac-tices that contribute to these outcomes. Ourfindings are compelling: A company that measuresin the top rather than the bottom quartile of orga-nizational performance is more than twice as likelyto attain above-average margins for its industry.
How can a company get to the top quartile? Ourresearch has helped us uncover three importantprinciples. First, at a minimum, companies shouldget to work on three universally beneficial prac-tices. Second, companies should aim to be distinc-tive (i.e., in the top quartile) in four or fiveadditional practices: Such out-performance is asso-ciated with better financial returns. Third, as theyconstruct a program, the companies should lookfor complementary practices that, when combined,can often yield stronger results than simply improv-ing one or two in isolation.
Companies can take these principles and use themto shape meaningful programs to improve theirorganizational performance. Our evidence suggeststhat those who succeed will not have long to waitbefore the effects of hard work and creative think-ing show up on the bottom line.
Strong organizations havebetter financial resultsWhat does good organizational performance looklike, and what is it worth? That’s what we set outto determine in our extensive (and ongoing) survey,which includes public and private companies, gov-ernment entities, and nonprofits in a variety ofindustries, including banking, insurance, petrole-um, and telecommunications.
3
1 See box on page 12 for a complete explanation of our survey and methodology.
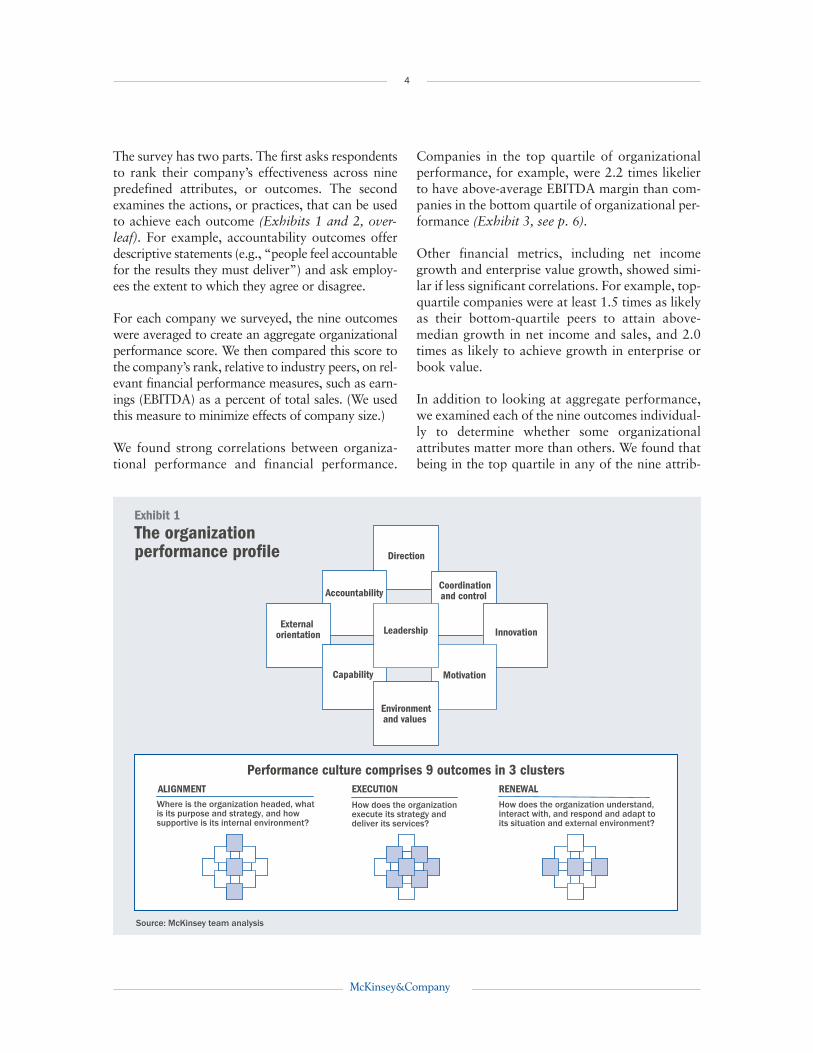
The survey has two parts. The first asks respondentsto rank their company’s effectiveness across ninepredefined attributes, or outcomes. The secondexamines the actions, or practices, that can be usedto achieve each outcome (Exhibits 1 and 2, over-leaf). For example, accountability outcomes offerdescriptive statements (e.g., “people feel accountablefor the results they must deliver”) and ask employ-ees the extent to which they agree or disagree.
For each company we surveyed, the nine outcomeswere averaged to create an aggregate organizationalperformance score. We then compared this score tothe company’s rank, relative to industry peers, on rel-evant financial performance measures, such as earn-ings (EBITDA) as a percent of total sales. (We usedthis measure to minimize effects of company size.)
We found strong correlations between organiza-tional performance and financial performance.
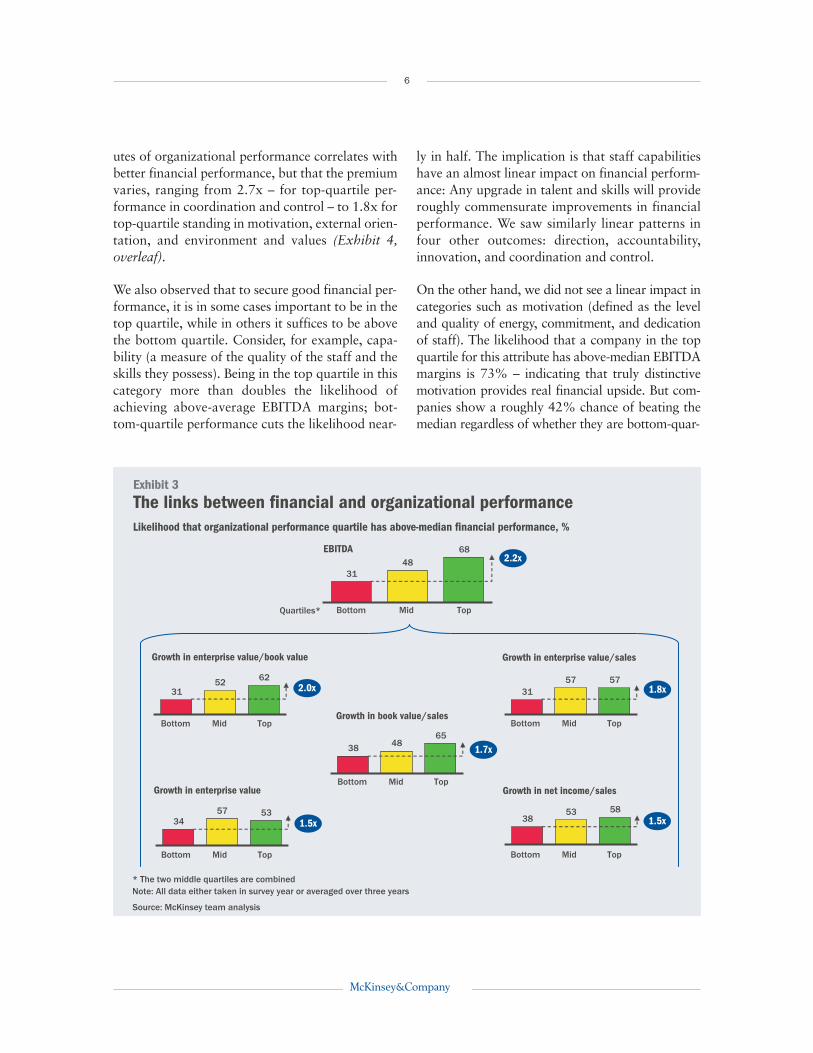
Companies in the top quartile of organizationalperformance, for example, were 2.2 times likelierto have above-average EBITDA margin than com-panies in the bottom quartile of organizational per-formance (Exhibit 3, see p. 6).
Other financial metrics, including net incomegrowth and enterprise value growth, showed simi-lar if less significant correlations. For example, top-quartile companies were at least 1.5 times as likelyas their bottom-quartile peers to attain above-median growth in net income and sales, and 2.0times as likely to achieve growth in enterprise orbook value.
In addition to looking at aggregate performance,we examined each of the nine outcomes individual-ly to determine whether some organizationalattributes matter more than others. We found thatbeing in the top quartile in any of the nine attrib-
4
The organization performance profile
Exhibit 1
Source: McKinsey team analysis
Performance culture comprises 9 outcomes in 3 clustersEXECUTION
How does the organizationexecute its strategy and deliver its services?
ALIGNMENTWhere is the organization headed, whatis its purpose and strategy, and how supportive is its internal environment?
RENEWALHow does the organization understand,interact with, and respond and adapt to its situation and external environment?
DirectionDirection
Coordination and control
Coordinationand control AccountabilityAccountability
External orientationExternal
orientation InnovationInnovation
CapabilityCapability MotivationMotivation
Environment Environmentand values
LeadershipLeadership
5
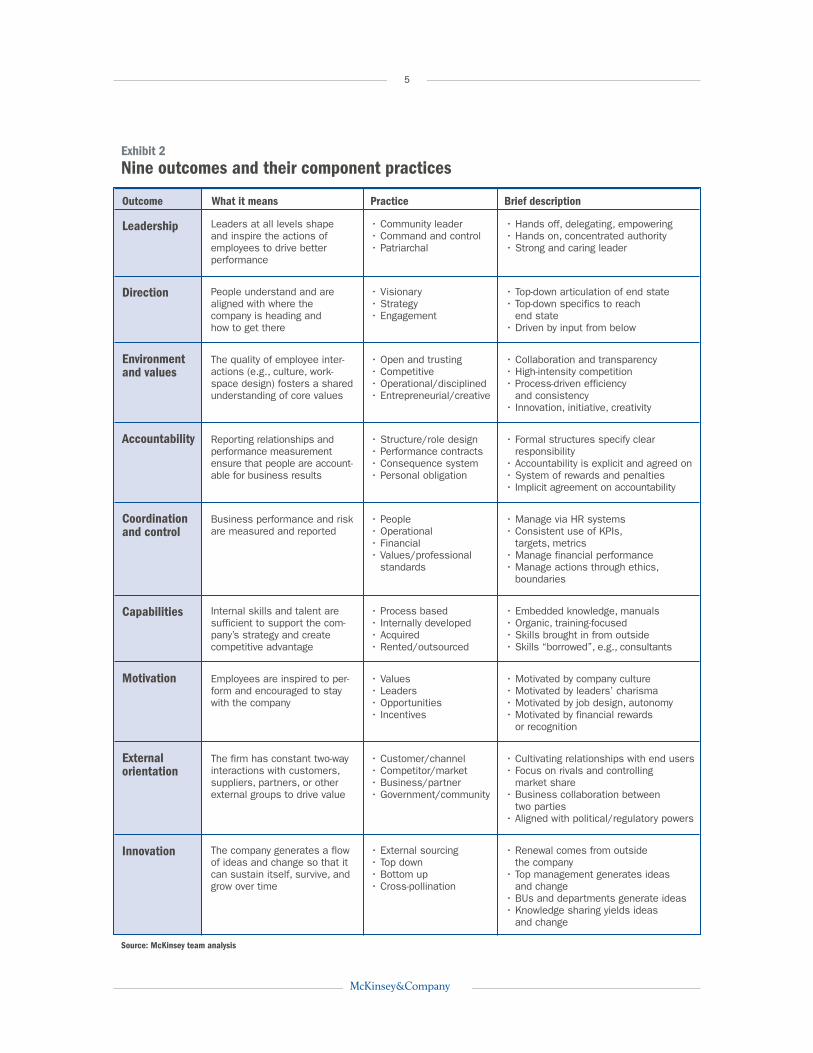
Outcome What it means Practice Brief description
Leadership
Direction
Environmentand values
Accountability
Coordinationand control
Capabilities
Motivation
Externalorientation
Innovation
Leaders at all levels shapeand inspire the actions ofemployees to drive betterperformance
People understand and arealigned with where thecompany is heading andhow to get there
The quality of employee inter-actions (e.g., culture, work-space design) fosters a sharedunderstanding of core values
Reporting relationships andperformance measurementensure that people are account-able for business results
Business performance and riskare measured and reported
Internal skills and talent aresufficient to support the com-pany’s strategy and createcompetitive advantage
Employees are inspired to per-form and encouraged to staywith the company
The firm has constant two-wayinteractions with customers,suppliers, partners, or otherexternal groups to drive value
The company generates a flowof ideas and change so that itcan sustain itself, survive, andgrow over time
• Community leader• Command and control• Patriarchal
• Visionary• Strategy• Engagement
• Open and trusting• Competitive• Operational/disciplined• Entrepreneurial/creative
• Structure/role design• Performance contracts• Consequence system• Personal obligation
• People• Operational• Financial• Values/professional
standards
• Process based• Internally developed• Acquired• Rented/outsourced
• Values• Leaders• Opportunities• Incentives
• Customer/channel• Competitor/market• Business/partner• Government/community
• External sourcing• Top down• Bottom up• Cross-pollination
• Hands off, delegating, empowering• Hands on, concentrated authority• Strong and caring leader
• Top-down articulation of end state• Top-down specifics to reach
end state• Driven by input from below
• Collaboration and transparency• High-intensity competition• Process-driven efficiency
and consistency• Innovation, initiative, creativity
• Formal structures specify clearresponsibility
• Accountability is explicit and agreed on• System of rewards and penalties• Implicit agreement on accountability
• Manage via HR systems• Consistent use of KPIs,
targets, metrics• Manage financial performance• Manage actions through ethics,
boundaries
• Embedded knowledge, manuals• Organic, training-focused• Skills brought in from outside• Skills “borrowed”, e.g., consultants
• Motivated by company culture• Motivated by leaders’ charisma• Motivated by job design, autonomy• Motivated by financial rewards
or recognition
• Cultivating relationships with end users• Focus on rivals and controlling
market share• Business collaboration between
two parties• Aligned with political/regulatory powers
• Renewal comes from outsidethe company
• Top management generates ideasand change
• BUs and departments generate ideas• Knowledge sharing yields ideas
and change
Source: McKinsey team analysis
Exhibit 2Nine outcomes and their component practices
utes of organizational performance correlates withbetter financial performance, but that the premiumvaries, ranging from 2.7x – for top-quartile per-formance in coordination and control – to 1.8x fortop-quartile standing in motivation, external orien-tation, and environment and values (Exhibit 4,overleaf).
We also observed that to secure good financial per-formance, it is in some cases important to be in thetop quartile, while in others it suffices to be abovethe bottom quartile. Consider, for example, capa-bility (a measure of the quality of the staff and theskills they possess). Being in the top quartile in thiscategory more than doubles the likelihood ofachieving above-average EBITDA margins; bot-tom-quartile performance cuts the likelihood near-
ly in half. The implication is that staff capabilitieshave an almost linear impact on financial perform-ance: Any upgrade in talent and skills will provideroughly commensurate improvements in financialperformance. We saw similarly linear patterns infour other outcomes: direction, accountability,innovation, and coordination and control.
On the other hand, we did not see a linear impact incategories such as motivation (defined as the leveland quality of energy, commitment, and dedicationof staff). The likelihood that a company in the topquartile for this attribute has above-median EBITDAmargins is 73% – indicating that truly distinctivemotivation provides real financial upside. But com-panies show a roughly 42% chance of beating themedian regardless of whether they are bottom-quar-
6
The links between financial and organizational performanceExhibit 3
Source: McKinsey team analysis
Likelihood that organizational performance quartile has above-median financial performance, %
3148
68
Bottom Mid Top
EBITDA2.2x
* The two middle quartiles are combinedNote: All data either taken in survey year or averaged over three years
3152 62
Growth in enterprise value/book value
2.0x
38 4865
Growth in book value/sales
1.7x
3457 53
Growth in enterprise value
1.5x 3853 58
Growth in net income/sales
1.5x
3157 57
Growth in enterprise value/sales
1.8x
Quartiles*
Bottom Mid Top
Bottom Mid Top
Bottom Mid Top Bottom Mid Top
Bottom Mid Top

tile or average performers, which suggests that thereis limited benefit to average motivation – most com-panies need highly motivated employees to see realbottom-line financial benefits.
While this may seem surprising, it echoes much ofthe academic research on staff motivation andfinancial performance. We found that only theworst sort of unmotivated workforce affects finan-cial performance. In part, our results are due to atechnical issue. Very few people reported to us thatthey are unmotivated; most give middle or highscores. This “range restriction” problem is a formof selection bias; in today’s highly mobile work-place, dissatisfied, unmotivated managers tend tofind other work. As a result, both medium- andlow-motivation companies have similar scores. Wewould expect the problems of low-motivationcompanies to be revealed in other metrics such asvoluntary turnover rates and loss of top talent.
Other outcomes (leadership, external orientation,and environment and values) do not require topperformance to have a positive impact on the bot-tom line; they merely require that a company notbe lagging – i.e., not be in the lowest quartile. Take,for instance, leadership outcomes (e.g., “leaders arehighly respected” or “leaders are good decisionmakers”). Poor leadership outcomes have a broadimpact on all parts of the organization, hence theneed to achieve a level of performance above thebottom quartile.
Achieving top-quartileorganizational performanceWhat is the best combination of organizationalattributes? We found one compelling profile of a“healthy” company – one that provides an 83%chance of beating median EBITDA margin. Com-panies in this profile were in the top quartile in five
7
Exhibit 4Link between financial and organizational performance, by outcome
Likelihood that quartile also has Character of the link betweenabove-median financial performance, % organizational and financial performance
Ratio top- Must be in Must be aboveOutcome Top Middle Bottom to-bottom Linear top quartile bottom quartile
Direction 67 48 36 1.9x �
Accountability 65 49 33 1.9x �
Coordination and control 73 49 28 2.7x �
External orientation 59 54 33 1.8x �
Leadership 53 60 22 2.4x �
Innovation 66 52 31 2.1x �
Capability 67 49 32 2.1x �
Motivation 73 42 41 1.8x �
Environment and values 61 52 33 1.8x �
Note: All data taken in survey yearSource: McKinsey team analysis
outcomes: environment and values, accountability,coordination and control, motivation, and externalorientation. No other profile was as likely to pro-vide as large an impact on financial performance –including profiles with more top-quartile outcomes.
Is that the right answer for your organization? Notnecessarily. Most companies, because of the peculi-arities of their circumstances, will need to investtheir energies in improving some highly specificdeficits. Broadly speaking, though, we can say thatinvesting time and energy in improving any of thenine outcomes will make a difference. To maximizereturn on that investment, however, companiesmust be selective. To achieve top-quartile organiza-tional performance, management should followthree cardinal rules.
1. FOCUS ON A FEW PRACTICES
Getting better at a practice – any practice – willenhance organizational performance. But threepractices in particular have a greater impact onoverall organizational performance, which wemeasure as the mean of all nine outcomes. Thesethree universally beneficial practices are a goodstarting point, and can be an “anchor” for a morecomprehensive effort. Achieving top quartile per-formance on any of these practices more than dou-bles the chance that an organization’s financialperformance will also be top quartile. We have list-ed them here, along with the outcomes they drive:
• Vision (direction). Providing a clear, com-pelling picture of where the organizationshould go and having the mechanisms andprocesses to ensure that all employees, fromtop to bottom, share that vision and under-stand how they fit into it
• Structure/role design (accountability). Pro-viding clear and concise objectives and per-formance expectations for all employeesand ensuring that these are consistent andappropriate over time. For most companies,what’s needed is not a big book of detailedjob descriptions, but for managers to ensurethat people understand exactly what isexpected of them and how each individual
can best contribute to the success of theorganization
• Open and trusting (environment). Fosteringtrust among managers and employees sothat they are open to sharing information,providing and receiving honest feedback,and having difficult conversations
It’s worth noting the importance of avoiding bot-tom-quartile performance in any practice. Thechances of achieving distinctive (i.e., top-quartile)organizational performance drop dramaticallywhen any of the 34 practices are very low. Bottom-quartile performance on a single practice dragsdown organizational effectiveness in all areas, lim-iting all outcomes, even those in seemingly unrelat-ed areas. When direction practices are distinctive,and environment and values practices are averageor above, for example, there is a 67% chance ofbeing in the top quartile of direction. However, ifthose environment and values practices are in thebottom quartile, the chances drop to just 41%.
A company does not need to excel at everything,but it cannot afford to perform very poorly on evenone of these important management practices.
2. TARGET DISTINCTIVENESS IN FOUR TOFIVE PRACTICES
With minimum competencies in place, companiescan focus on driving a few practices to distinctive-ness (i.e., the top quartile). Achieving distinctive-ness in even a single practice can have a measurableeffect on overall organizational effectiveness, push-ing the likelihood of top-quartile organizationalperformance from 25% to nearly 50%. Driving asecond practice to distinctiveness increases thislikelihood to more than 50%. Once a company hasachieved top-quartile performance in four or fivepractices, the likelihood that all outcomes are dis-tinctive plateaus at approximately 80%. For mostcompanies, the effort of achieving distinctiveness ina sixth or seventh practice may not be worth it, asa point of diminishing returns is reached. Compa-nies should focus on being truly distinctive in fouror five practices, and being good enough (aboutaverage) in the remaining practices.
8
When targeting four or five practices for distinc-tiveness, the obvious candidates are those listedabove. But there are at least two cases in which uni-versally beneficial practices might be the wrongfocus: first, where these practices do not fit wellwith the corporate strategy, and second, where thecombination of these practices does not fit well withthe practice at which the company already excels.
Indeed, the paramount consideration in choosingpractices is how well they complement one another.The best combinations often consist of practicesassociated with different attributes – for example,driving accountability by improving structure androle design, performance contracts, and consequencemanagement will yield very strong accountability,but it works less well for overall organizational per-formance. A more potent combination is createdfrom a healthy, balanced diet of practices from dif-ferent areas that jointly affect all the outcomes.
An exemplar of building a distinctive practice isSouthwest Airlines. Over the past 15 years, the air-line has excelled at a collaborative, hands-on lead-ership style that we call “patriarchal,” which is atonce hierarchical and top-down and engaging andparticipative. Southwest leaders seek input andinvolvement, but don’t use consensus-based deci-sion making. Benevolent, patriarchal leadership is astrong, nurturing practice of people managementthat is often seen on a far smaller scale in well-runfamily businesses. This style of leadership, champi-oned in the 1990s by then-CEO Herb Kelleher(now executive chairman) and Colleen Barrett(then COO, now president), focuses on strong butcaring leadership from the top and an extremelyopen culture.
“[Colleen and Herb] communicate with customersand employees on every little issue,” says one pilotin the book The Southwest Airlines Way by JodyHoffer Gittell. “Their philosophy is to take care ofthe small problems.”2
The leadership style extends well down into themanager ranks. Although Southwest is known as alean, low-cost airline, it has the highest supervisor-to-employee ratio in the industry. A supervisor’s jobgoes beyond giving direction, measuring perform-ance, and doling out consequences. Southwestsupervisors are “player-coaches,” working side byside with employees, even taking part in highlyphysical work like baggage handling, where theycan work in an intense, hands-on manner to pro-vide real-time feedback, coaching, advice, and prob-lem-solving support to frontline employees. Thecompany emphasizes promoting from within andgrooming up-and-coming supervisors to ensurethey can maintain strong frontline leadership.
Such leadership spawns intense loyalty and com-mitment. As one station manager put it in TheSouthwest Airlines Way: “Colleen rememberseveryone and everything – if you have a birthdayyou’ll get a card from her. She’s up there with JesusChrist, in our eyes.”3
3. CREATE YOUR BLEND FOR SUCCESS
As noted above, the best improvement effortsrequire more than selecting a random combinationof practices. Certain practices complement oneanother and, when combined, lead to better overallperformance. Conversely, certain combinations donot work well and, as a result, fail to lead to theexpected performance improvement. Managementshould be selective when mixing and matchingthese practices to deliver maximum results.
We were interested to find that practices rankedhigh on their own for certain outcomes do notalways achieve the desired result when deployedtogether.
For example, a management team that wants toimprove its level of innovation might reasonablywant to improve the three practices that showedthe highest correlation to top-quartile innovation:
9
2 Jody Hoffer Gittell, The Southwest Airlines Way: Using the Power of Relationships to Achieve High Performance, New York: McGraw-Hill, 2002, 59.
3 Ibid., 58.
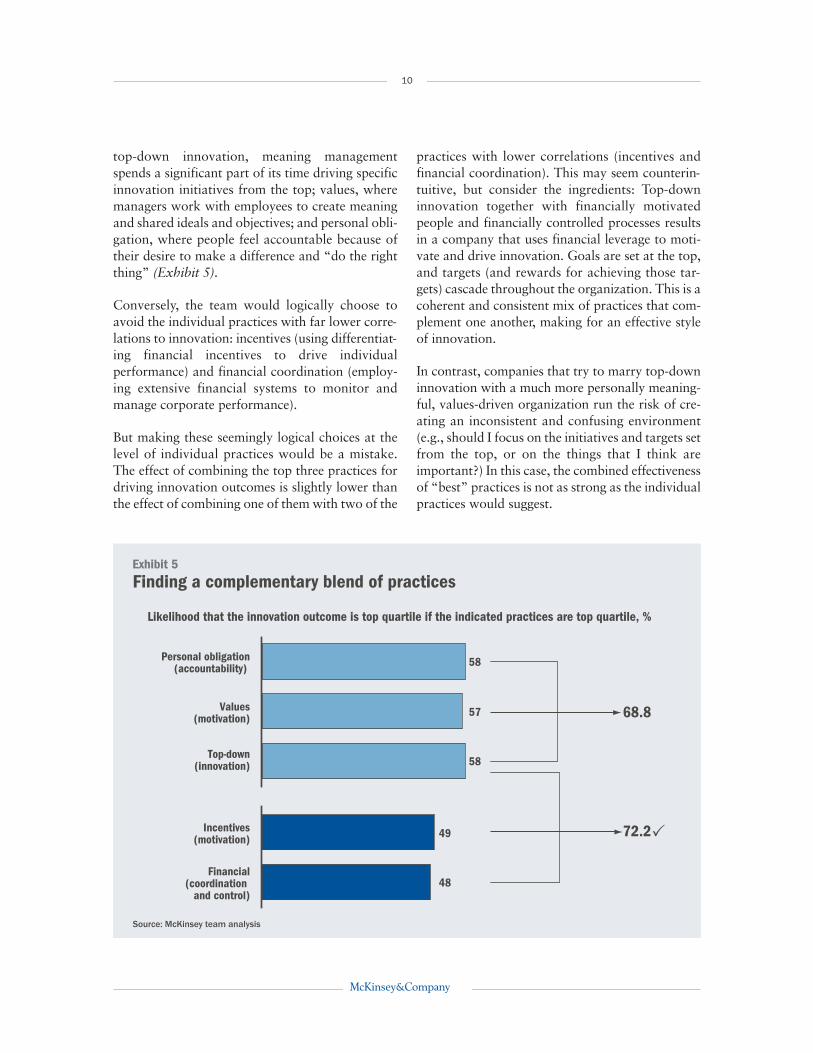
top-down innovation, meaning managementspends a significant part of its time driving specificinnovation initiatives from the top; values, wheremanagers work with employees to create meaningand shared ideals and objectives; and personal obli-gation, where people feel accountable because oftheir desire to make a difference and “do the rightthing” (Exhibit 5).
Conversely, the team would logically choose toavoid the individual practices with far lower corre-lations to innovation: incentives (using differentiat-ing financial incentives to drive individualperformance) and financial coordination (employ-ing extensive financial systems to monitor andmanage corporate performance).
But making these seemingly logical choices at thelevel of individual practices would be a mistake.The effect of combining the top three practices fordriving innovation outcomes is slightly lower thanthe effect of combining one of them with two of the
practices with lower correlations (incentives andfinancial coordination). This may seem counterin-tuitive, but consider the ingredients: Top-downinnovation together with financially motivatedpeople and financially controlled processes resultsin a company that uses financial leverage to moti-vate and drive innovation. Goals are set at the top,and targets (and rewards for achieving those tar-gets) cascade throughout the organization. This is acoherent and consistent mix of practices that com-plement one another, making for an effective styleof innovation.
In contrast, companies that try to marry top-downinnovation with a much more personally meaning-ful, values-driven organization run the risk of cre-ating an inconsistent and confusing environment(e.g., should I focus on the initiatives and targets setfrom the top, or on the things that I think areimportant?) In this case, the combined effectivenessof “best” practices is not as strong as the individualpractices would suggest.
10
Finding a complementary blend of practicesExhibit 5
Source: McKinsey team analysis
Likelihood that the innovation outcome is top quartile if the indicated practices are top quartile, %
Personal obligation(accountability)
Values(motivation)
Top-down(innovation) 58
57
58
Incentives(motivation)
Financial(coordination
and control)
68.8
72.2P
48
49

Consider another example. Creating a powerfulsense of direction involves three elements: vision(e.g., “I know where we want to go and the visionis meaningful to me”); motivation-leadership (“Iam inspired by my leaders”); and accountability-role/structure (“I see the part I play and knowwhatI have to do”). These are all strong levers that,when combined, create a 76% chance of a distinc-tive direction outcome.
On the other hand, using incentives is not a goodlever to achieve distinctive direction. However, acombination of direction – visionary, incentives,and competitive environment – is just as potent asthe combination of strong levers: It, too, has a 76%chance of being distinctive in direction outcomes.This counterintuitive effect can be seen in invest-ment banking or sales, where goals are clear, peo-ple are highly competitive, and financial results(including bonus/incentives) are seen as a way ofkeeping score. Incentives by themselves are not tooeffective, but as part of a combination are just asgood as (and for these organizations probably bet-ter than) a set of practices more highly correlated todistinctive direction outcomes.
Structuring an improvementprogramLeaders may have questions about how to translatethese ideas into actions. Here we answer three ofthe most frequently asked questions.
Should I make small improvements to several prac-tices or large improvements to a few? Theapproach varies with an organization’s startingpoint. In general, for organizations that are under-performing, the priority is to improve the weakestpractices and bring them up to an acceptable level,particularly those in which bottom-quartile per-formance exacts the highest financial toll. Exam-ples include visionary (direction), open and trustingenvironment (environment and values), opera-tional focus (environment and values), structureand role design (accountability), and values-basedcommitment (motivation). Eliminating majorproblems with ineffective practices is equally if not
more important than achieving distinctiveness in afew practices.
Companies in the middle of the pack should focusimprovement efforts on universally good practicessuch as building a meaningful vision, clarifyingstructure and roles, developing shared values thatguide and motivate behavior (see above). Remem-ber that there is much more to gain from driving afew practices to distinctiveness than from incremen-tally improving several already adequate practices.
For companies that are already approaching top-quartile performance, deciding which practices tohome in on depends on the current profile. Certaincombinations of practices are much more effectivethan others; current strengths will determine thebest future targets for improvement.
Our organization has an established leadershipstyle. Which practices will complement that style?Without question, the practice mix should alignwith the management team’s approach. For exam-ple, a leadership team that has worked to create anopen and trusting environment should try to be dis-tinctive in a complementary practice such as valuesand opportunities (part of the motivation out-come). However, if the leadership team has nur-tured a highly competitive environment, it shouldconsider a complementary practice such as leadersand incentives (also under motivation). This align-ment makes sense intuitively: An open and trustingenvironment works well with a motivation systemthat creates opportunities for people to stretch,while a competitive environment requires strongmanagerial guidance and leadership to be effective.
To some extent, companies also must match theleadership style to the culture. Getting the cultureright requires leaders to remove toxicity from thework environment and promote a shared culture,so that the company can avoid bad practices andcreate an organization where every individual car-ries the same image about what they’re supposed todo and reacts in similar ways. The value of bendingleadership style to the formation of a strong cultureis being able to do without cumbersome controlmechanisms that slow things down.
11
Why can’t we just copy best practice? Adopting thesuccessful approaches of GE and other leaders inorganizational performance is not a straightfor-ward process. Although it may be tempting to tryto replicate the people-management strategies, hir-ing approaches, and incentive plans of extraordi-nary companies, our research suggests thatdistinctive practices yield desired business results
only in combination with certain other distinctivepractices. Companies must mix their practice com-bination with care, tailoring its recipe to the uniquecharacteristics of their organization. Selecting andemulating one or two practices from GE’s modelcan result in a mismatched patchwork of practicesthat actually inhibits performance, rather thanimprove it.
12
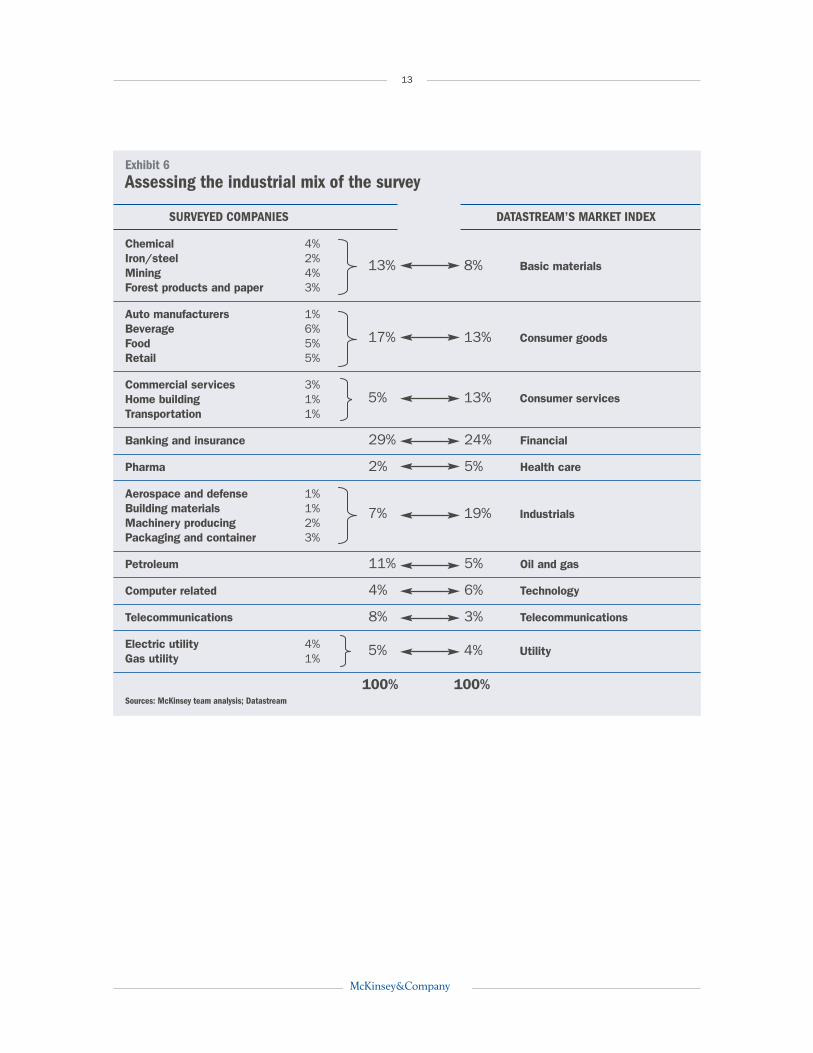
In our complete data set, we surveyed more than115,000 individuals in 231 organizations overthe past four years using a standardized per-formance survey tool (the Organizational Per-formance Profile, or OPP). The individuals rangedfrom CEOs to frontline workers. The companiescovered all major industries in a ratio similar tothat described by a Datastream global index(Exhibit 6, overleaf). The respondents answeredin multiple languages and represented Northand South America, Europe, Asia, and Africa. Ourdata set included private and public companies,nonprofits, and government organizations.
We cleaned our data set to ensure that we werecomparing apples to apples for each question,and we discarded data for which we did not havesufficient question integrity, or for which notevery respondent answered every question. Forour financial analysis, we also discarded datafrom private companies, nonprofits, and govern-ments. After these steps, we were left with morethan 60,000 respondents and 125 companies.
We ran all standard tests on the integrity androbustness of our data set (e.g., Cronbach’salpha), all of which confirmed the reliability andvalidity of the survey tool. We did not observeany biases based on language, country, region,or industry.
To establish the practice-outcome linkage, we tookthe entire 60,000-person data set and selectedthe individuals for whom combinations of prac-
tices met specific criteria (e.g., top quartile). Wethen used that selected data set to evaluate thelikelihood that another desired criterion was true(e.g., top quartile in all outcomes). For example,our analysis could answer the following question:If you select the people who described their com-pany’s direction-visionary practice and accounta-bility-personal obligation practice as top quartile,then what is the likelihood that their company’saccountability outcome is also top quartile?
To perform the financial-linkage analysis, we firstnormalized financial performance by construct-ing industry benchmarks for each of our surveycompanies. For every industry (e.g., aerospaceand defense, beverage, telecom, etc.) we select-ed at least 100 publicly traded global companiesand created percentile benchmarks for bothratios of numbers (e.g., EBITDA margin, EV/sales) and growth in absolute numbers (e.g.,sales growth, EV growth) over a five-year period(2000 to 2004). We then ranked the percentileof each of our surveyed companies for eachfinancial metric based on industry benchmarksfor the year closest to the date of the survey. Wecategorized each company as top or bottom halffor each financial measure. For each quartile ofperformance for every outcome and practice, wethen evaluated the frequency of top-half financialperformance. This ratio provided us with an esti-mate of the likelihood of above-average financialperformance based on strength of organizationalperformance.
A WORD ABOUT OUR DATA SET, METHODOLOGY, AND ANALYSIS
13
Exhibit 6Assessing the industrial mix of the survey
SURVEYED COMPANIES DATASTREAM’S MARKET INDEX
Chemical 4%Iron/steel 2%Mining 4%Forest products and paper 3%
Auto manufacturers 1%Beverage 6%Food 5%Retail 5%
Commercial services 3%Home building 1%Transportation 1%
Banking and insurance 29% 24% Financial
Pharma 2% 5% Health care
Aerospace and defense 1%Building materials 1%Machinery producing 2%Packaging and container 3%
Petroleum 11% 5% Oil and gas
Computer related 4% 6% Technology
Telecommunications 8% 3% Telecommunications
Electric utility 4%Gas utility 1%
100% 100%Sources: McKinsey team analysis; Datastream
13% 8% Basic materials
17% 13% Consumer goods
7% 19% Industrials
5% 13% Consumer services
5% 4% Utility

Aaron De Smet is an expert associate principal in the New York office, Rodgers Palmer is an alumnus, andWilliam Schaninger is an associate principal in the Philadelphia office.
Contact for distribution: William Schaninger
Phone: +1 (215) 594-4431 Email: [email protected]