The Maturation of a Specialty: Workforce Projections for Endocrine Surgery Julie Ann Sosa, MA, MD,...
27
The Maturation of a Specialty: Workforce Projections for Endocrine Surgery Julie Ann Sosa, MA, MD, FACS Associate Professor of Surgery Sections of Oncologic and Endocrine Surgery Yale University School of Medicine New Haven, CT
-
Upload
gwenda-austin -
Category
Documents
-
view
216 -
download
2
Transcript of The Maturation of a Specialty: Workforce Projections for Endocrine Surgery Julie Ann Sosa, MA, MD,...

The Maturation of a Specialty: Workforce Projections for
Endocrine Surgery
Julie Ann Sosa, MA, MD, FACS
Associate Professor of Surgery
Sections of Oncologic and Endocrine Surgery
Yale University School of Medicine
New Haven, CT

Endocrine glands• Thyroid• Parathyroid• Adrenal glands• Pancreas
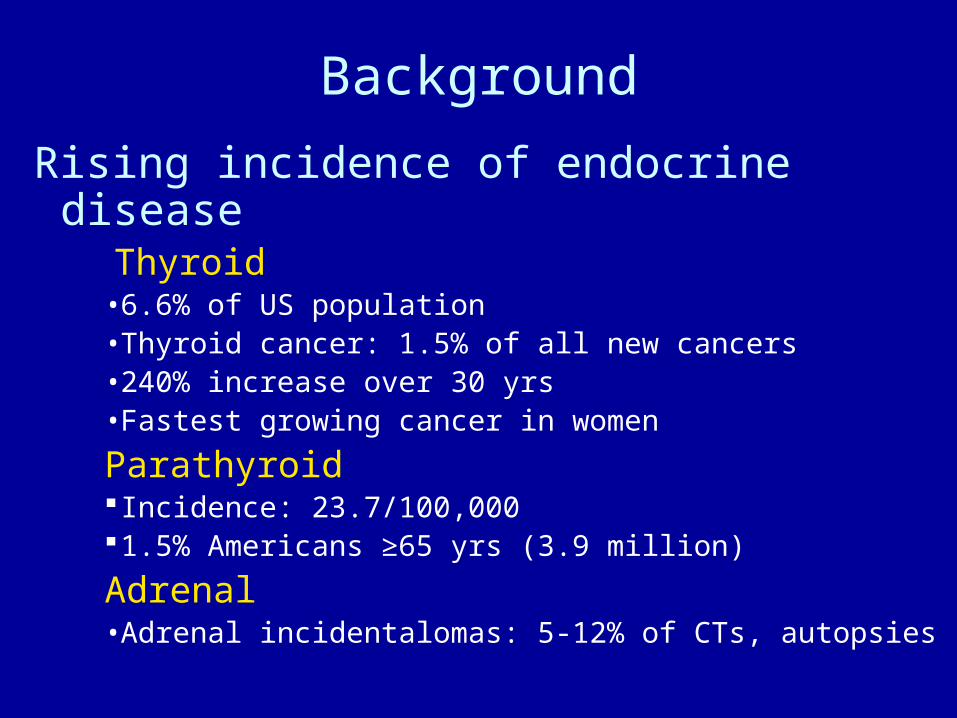
Background
Background
Rising incidence of endocrine disease Thyroid• 6.6% of US population • Thyroid cancer: 1.5% of all new cancers• 240% increase over 30 yrs• Fastest growing cancer in women
Parathyroid Incidence: 23.7/100,0001.5% Americans ≥65 yrs (3.9 million)
Adrenal• Adrenal incidentalomas: 5-12% of CTs, autopsies

Many endocrine diseases are treated surgically.
Thyroidectomy
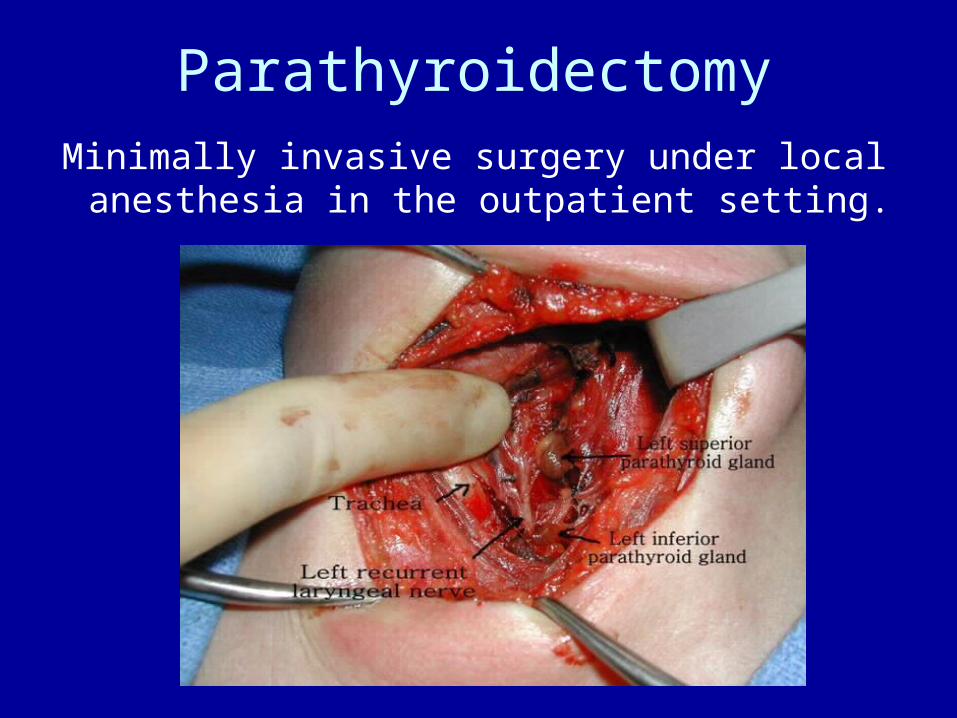
Minimally invasive surgery under local anesthesia in the outpatient setting.
Parathyroidectomy
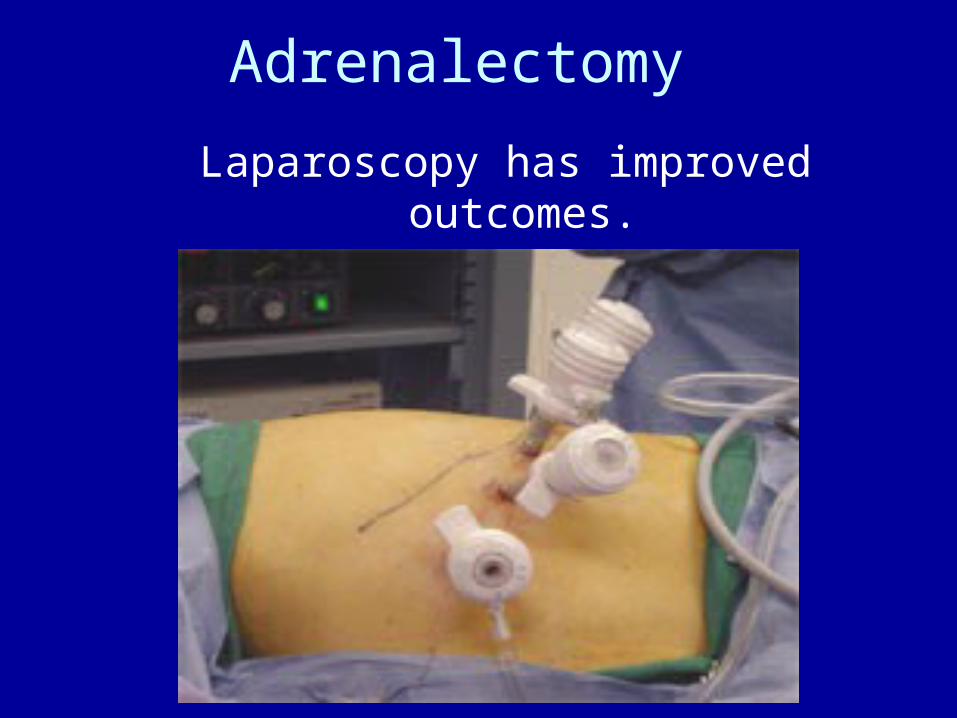
Laparoscopy has improved outcomes.
Adrenalectomy

Volume : Outcome Association
• High-volume surgeons have better outcomes.• Fewer complications• Shorter length of hospital stay• Lower hospital costs
• Better outcomes for:• Thyroidectomy• Parathyroidectomy• Adrenalectomy
(Sosa et al, 2007, 2008 using HCUP)
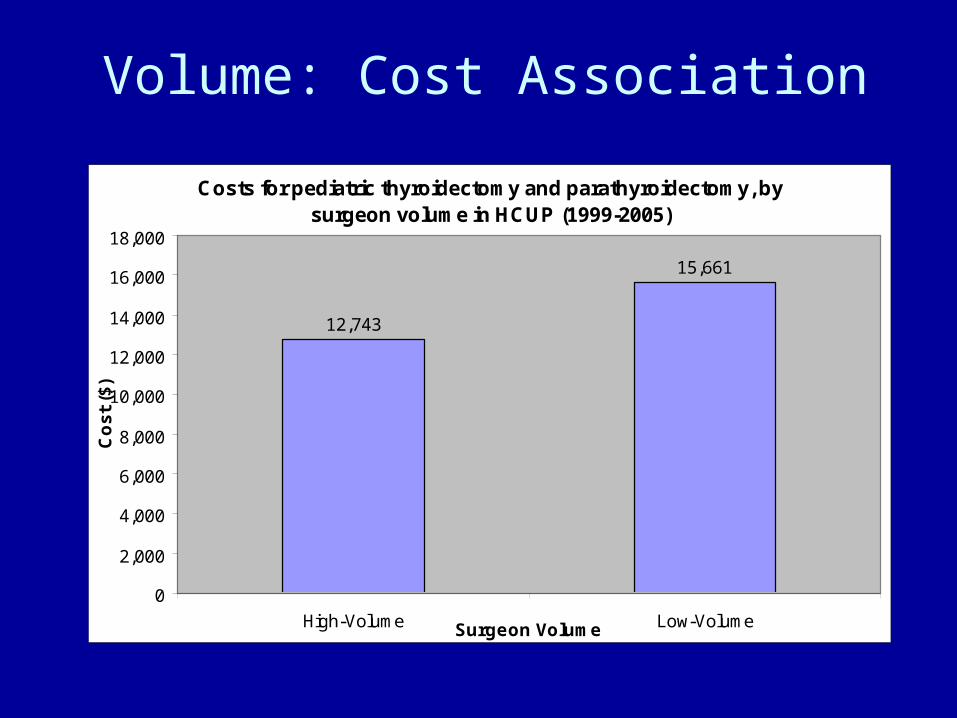
Volume: Cost Association
Costs for pediatric thyroidectomy and parathyroidectomy, by surgeon volume in HCUP (1999-2005)
12,743
15,661
0
2,000
4,000
6,000
8,000
10,000
12,000
14,000
16,000
18,000
High-Volume Low-VolumeSurgeon Volume
Co
st
($)
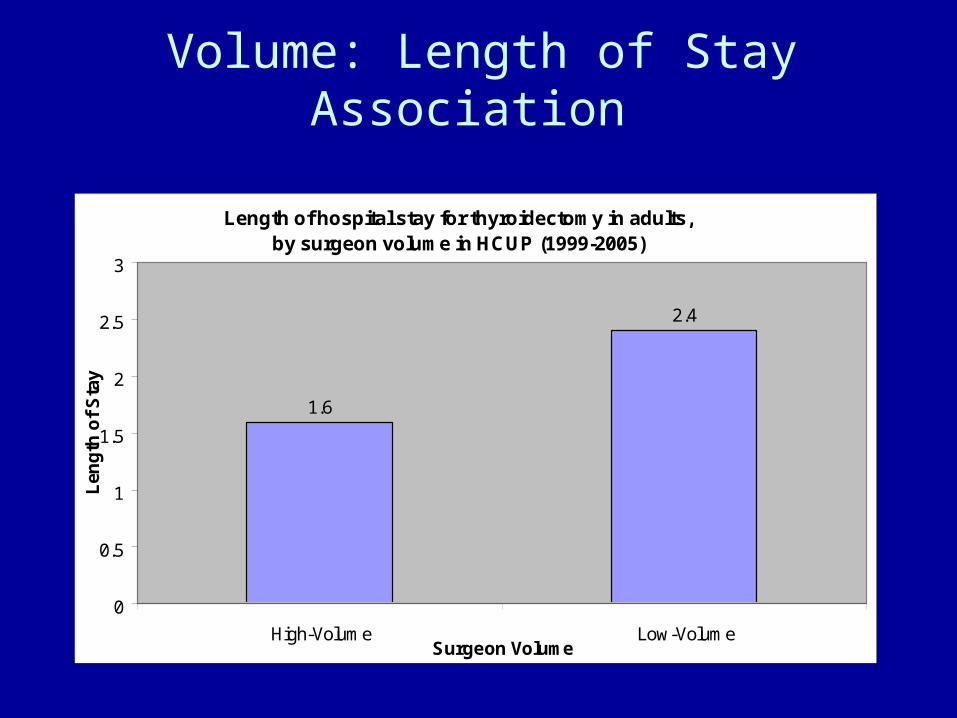
Volume: Length of Stay Association
Length of hospital stay for thyroidectomy in adults, by surgeon volume in HCUP (1999-2005)
1.6
2.4
0
0.5
1
1.5
2
2.5
3
High-Volume Low-VolumeSurgeon Volume
Len
gth
of
Sta
y

Volume: Complication Rate Association
Complication rates following thyroidectomy in the elderly, by surgeon volume in HCUP (1999-2005)
8.6
12.6
0
2
4
6
8
10
12
14
High-Volume Low-Volume
Surgeon Volume
Co
mp
lica
tio
n R
ate
(%)
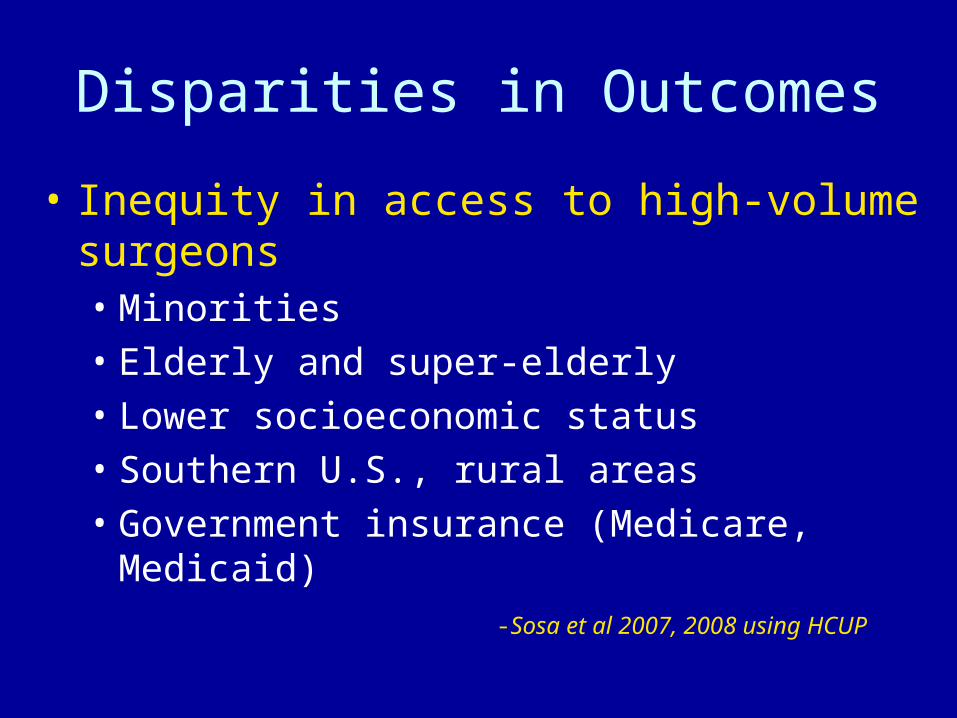
Disparities in Outcomes
• Inequity in access to high-volume surgeons• Minorities • Elderly and super-elderly• Lower socioeconomic status • Southern U.S., rural areas• Government insurance (Medicare, Medicaid)
-Sosa et al 2007, 2008 using HCUP

Access to High-Volume Surgeons, By Race

Access to High-Volume Surgeons,By Geographic Region
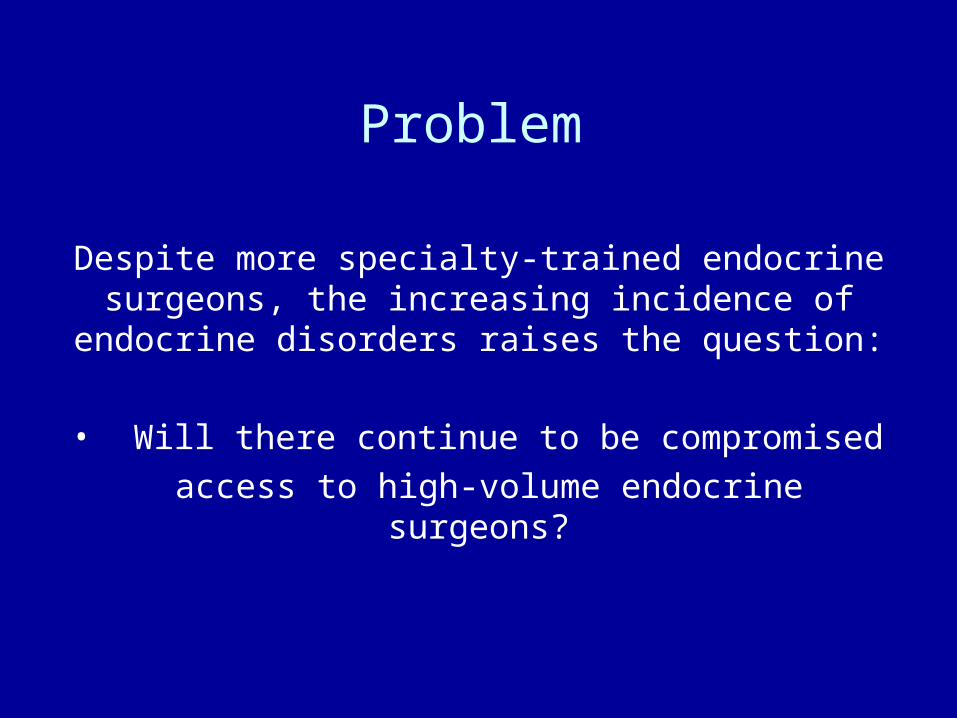
Problem
Despite more specialty-trained endocrine surgeons, the increasing incidence of endocrine
disorders raises the question:
• Will there continue to be compromised
access to high-volume endocrine surgeons?
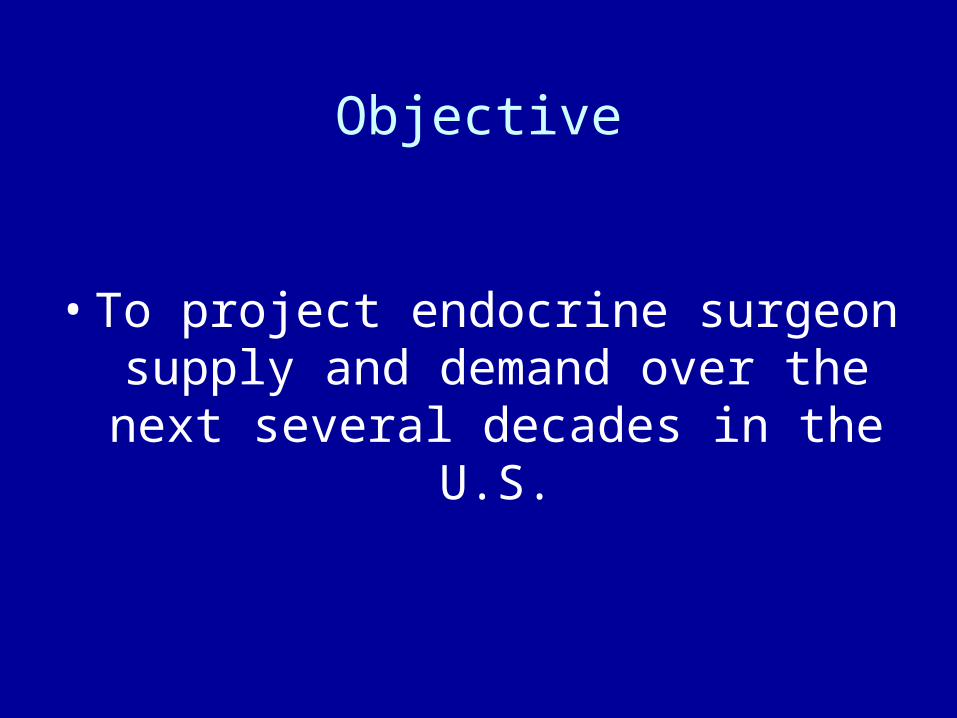
Objective
• To project endocrine surgeon supply and demand over the next several
decades in the U.S.
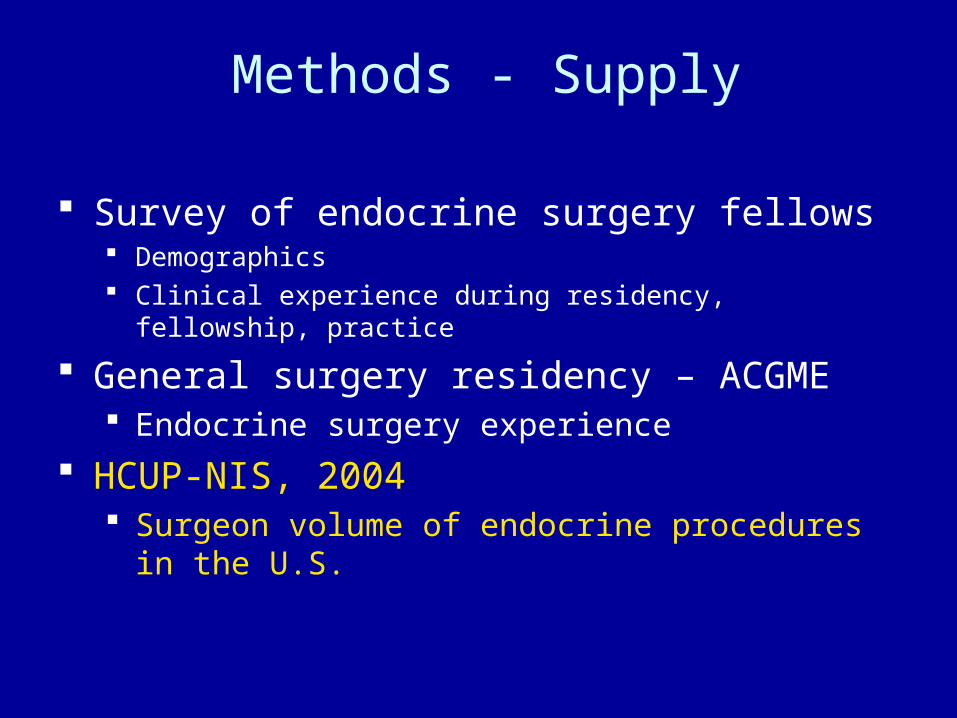
Methods - Supply
Survey of endocrine surgery fellows Demographics Clinical experience during residency, fellowship, practice
General surgery residency – ACGME Endocrine surgery experience
HCUP-NIS, 2004 Surgeon volume of endocrine procedures in the U.S.

Comparison of Endocrine Surgery Experience
0
50
100
150
200
250
300
General Surgery Residency Endocrine Surgery Fellowship
Training Program
Mea
n N
um
ber
Cas
es/P
rog
ram
Thyroidectomy Parathyroidectomy Adrenalectomy Endocrine Pancreas Neck Dissection
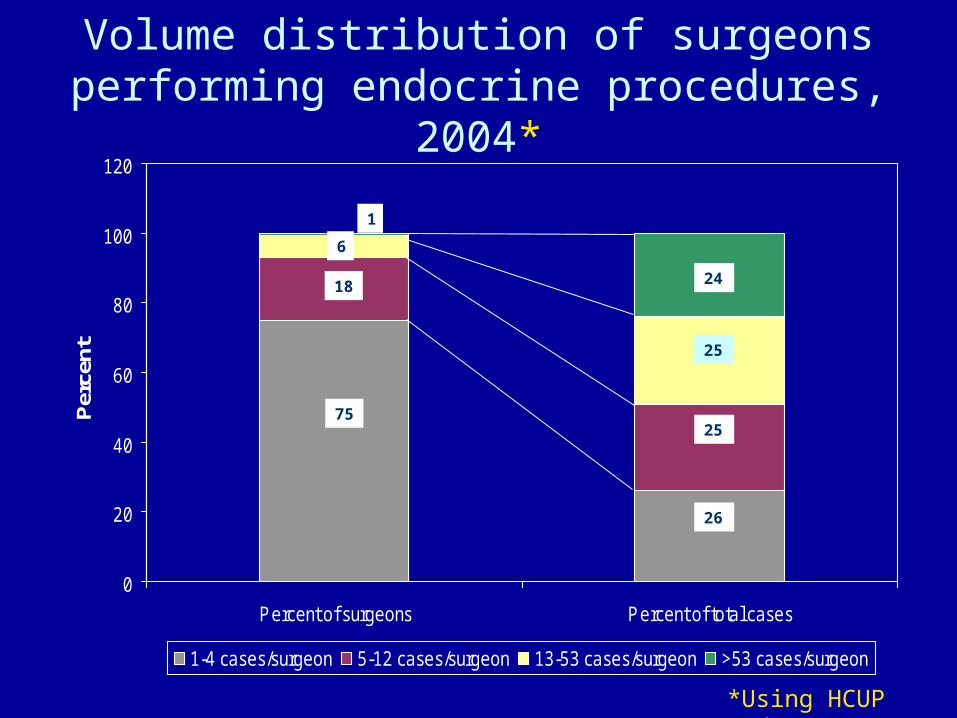
Volume distribution of surgeons performing endocrine procedures, 2004*
0
20
40
60
80
100
120
Percent of surgeons Percent of total cases
Per
cent
1-4 cases/surgeon 5-12 cases/surgeon 13-53 cases/surgeon >53 cases/surgeon
75
18
6
1
24
25
25
26
*Using HCUP dataset
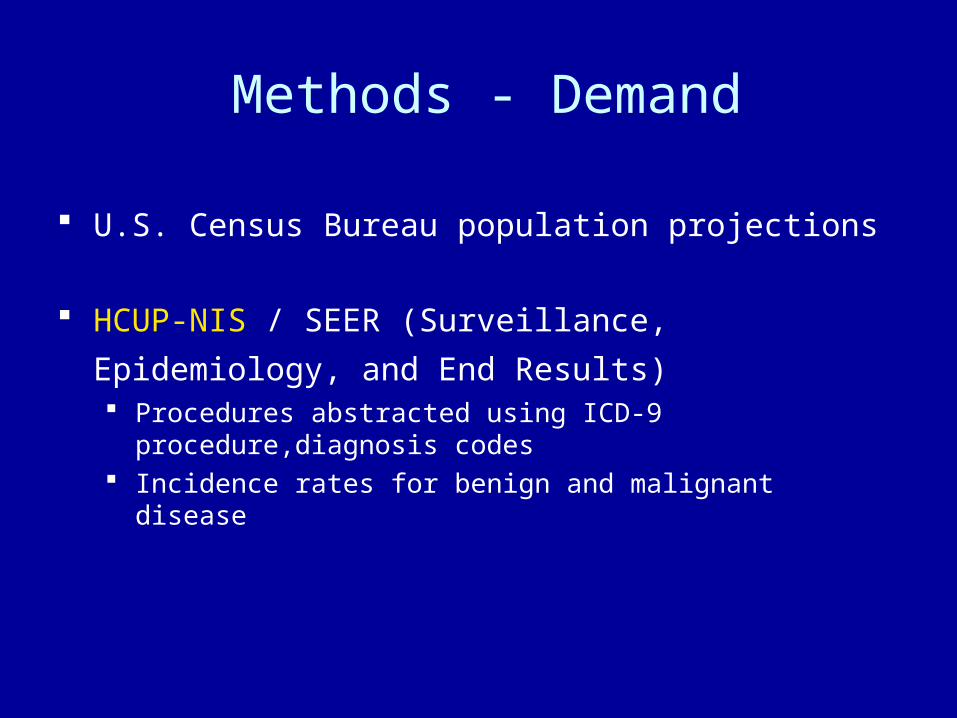
Methods - Demand
U.S. Census Bureau population projections
HCUP-NIS / SEER (Surveillance, Epidemiology, and End
Results) Procedures abstracted using ICD-9 procedure,diagnosis codes Incidence rates for benign and malignant disease

Sensitivity Analyses
Supply Annual retirement rate of 2.3% Projected number of specialty-trained endocrine
surgeons
Demand U.S. Census bureau population projections Changes in disease incidence
HCUP SEER
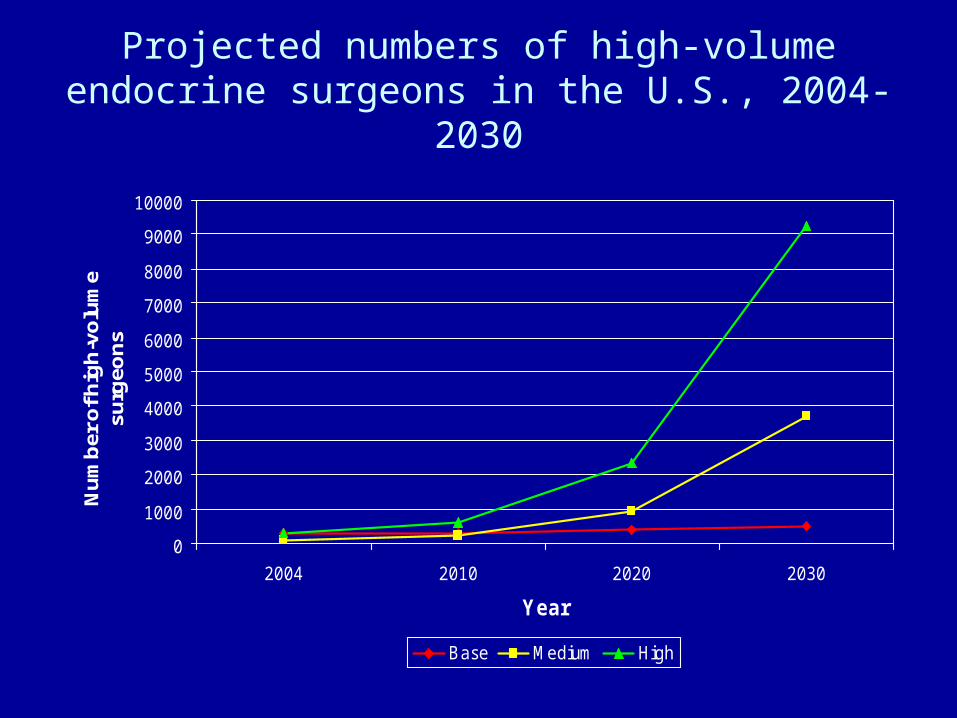
Projected numbers of high-volume endocrine surgeons in the U.S., 2004-2030
0
1000
2000
3000
4000
5000
6000
7000
8000
9000
10000
2004 2010 2020 2030
Year
Nu
mb
er o
f hig
h-v
olu
me
surg
eon
s
Base Medium High
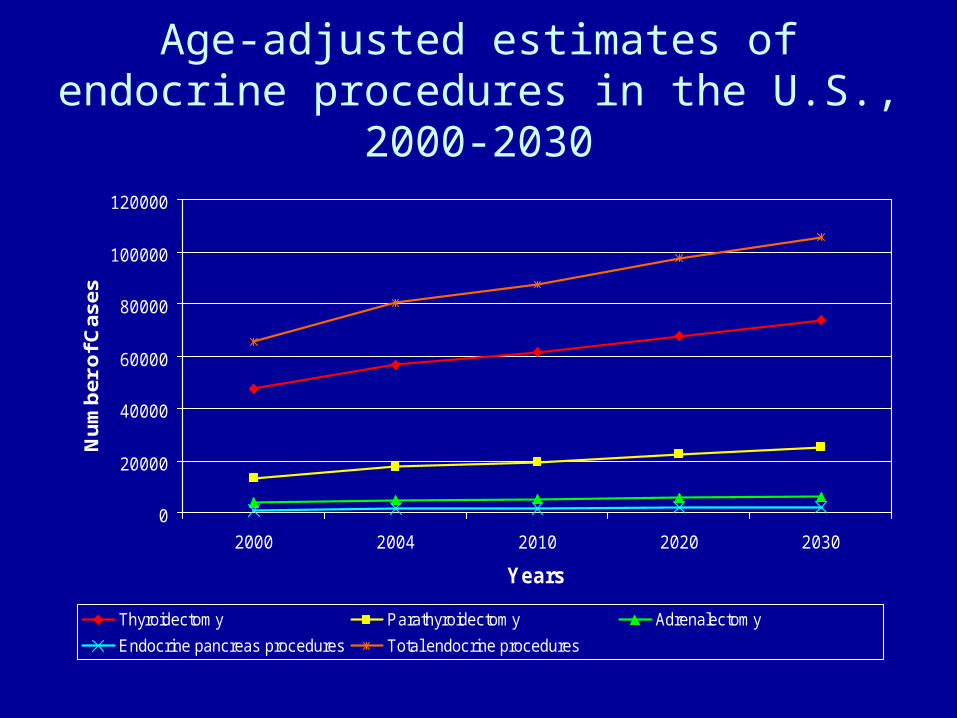
Age-adjusted estimates of endocrine procedures in the U.S., 2000-2030
0
20000
40000
60000
80000
100000
120000
2000 2004 2010 2020 2030
Years
Nu
mb
er o
f Cas
es
Thyroidectomy Parathyroidectomy Adrenalectomy
Endocrine pancreas procedures Total endocrine procedures
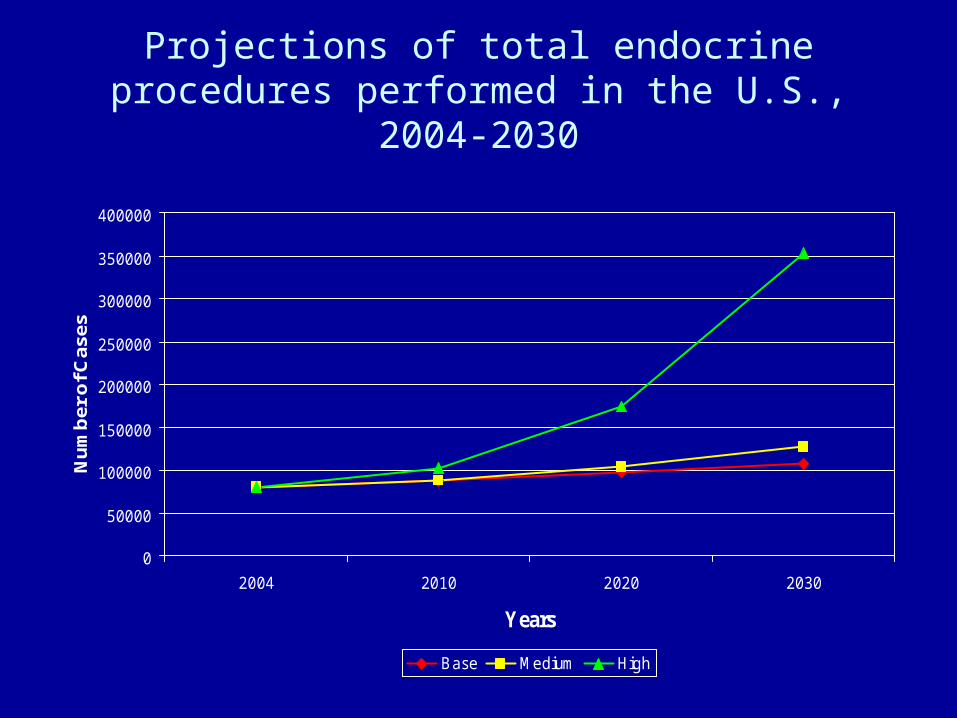
Projections of total endocrine procedures performed in the U.S., 2004-2030
0
50000
100000
150000
200000
250000
300000
350000
400000
2004 2010 2020 2030
Years
Nu
mb
er o
f Cas
es
Base Medium High
Conclusions
• Incidence of endocrine disease will continue to increase.
• Specialty-trained endocrine surgeons will increase in number, but
• The majority of endocrine procedures will continue to be performed by lower-volume surgeons.

Implications: Graduate Medical Education
Standardization of training across endocrine surgery fellowships Case distribution Overall volume Certification
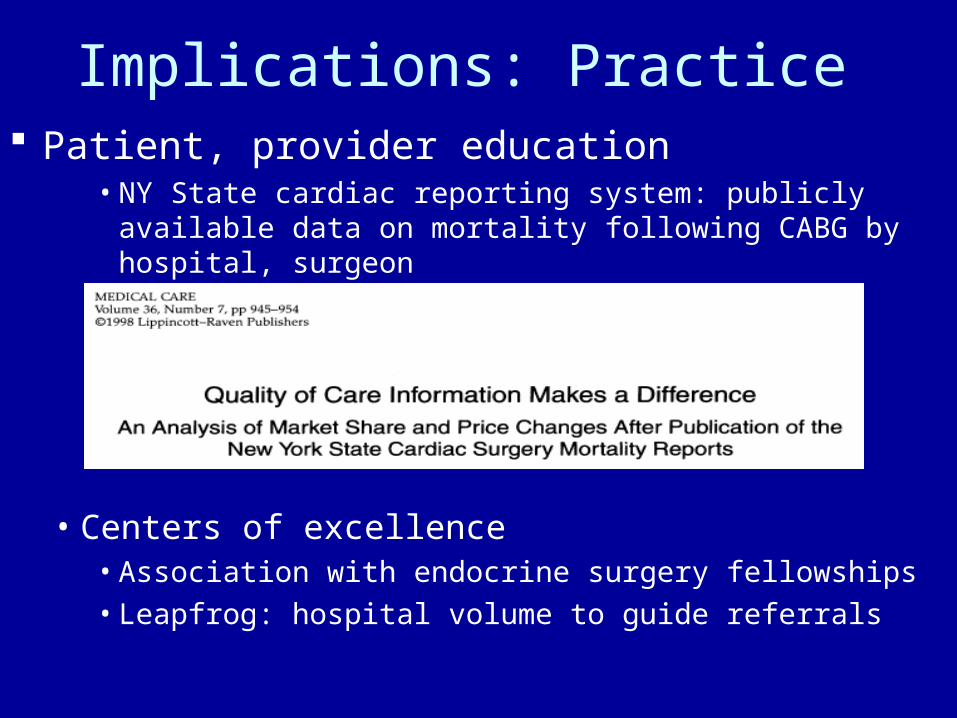
Implications: Practice Patient, provider education
• NY State cardiac reporting system: publicly available data on mortality following CABG by hospital, surgeon
• Centers of excellence• Association with endocrine surgery fellowships• Leapfrog: hospital volume to guide referrals
Implications: Policy
• Improve access to high-volume surgeons• Geographic distribution
• Incentives for MDs• Patient indirect costs
• Lower SES status • Government insurance (Medicare/Medicaid)