The Mantas of Yap The Rhythm of the Tides Lesson · PDF fileThe Mantas of Yap The Rhythm of...
26
The Mantas of Yap The Rhythm of the Tides Lesson Plan In this episode, Jonathan travels to Yap, an island in the Pacific nation of Micronesia, to dive with giant Manta Rays. Manta Rays come to this area to visit a “cleaning station” where parasites are removed by cleaner fish. The strong tidal currents create conditions for Mantas. Without the currents created by the changing tide, the cleaning station would not exist as Mantas require the strong currents to hold their position at a “cleaning station.” The currents keep the Mantas from sinking to the bottom as they have no swim bladder to control their buoyancy. The cleaning station is important to the rays as they get rid of parasites which can irritate and lead to infection. The “cleaner” fish benefit from this symbiotic relationship by having this food source. The visits to these cleaning stations coincide with the timing of the tides. Science Lesson: The Rhythm of the Tides - Based on Webisode 20 Grade Level: 6-8 Time: At least five (45-50 min) class periods. Rhythm of the Tides - Page 1 learn more at www.blueworldTV.com! by Bill Andrake Introduction One of the most powerful forces affecting the seashores are the tides. Tides are responsible for currents and changes in water depth. Many of the most productive ecosystems such as salt- marshes or rocky intertidal areas are the direct result of the intertidal zones created by tides. Many scientists have speculated that tides may have led to the evolution of land life from the sea as creatures adapted to spending longer hours out of water. Science Standards National Science Education Standards Earth and Space Science: • Structure of the Earth System Physical Science: • Motion and Forces Ocean Literacy Principles Principle #1: The Earth has one big ocean with many features. Ocean Circulation Objectives • To use a study of the tides to gain better understanding of the lunar cycle and the interrelationship between the moon and the Earth. • To learn what causes ocean tides, tidal cycles, and how they change the water level along coastal areas. • To understand the gravitational forces of the sun and moon on our planet. • To gain a better understanding of how gravity works. Partial support for this work was provided by the National Science Foundation Grant DUE/NSDL #1043823. Any opinions, findings, or conclusions expressed are those of the author(s) and do not necessarily reflect the views of the National Science Foundation.
Transcript of The Mantas of Yap The Rhythm of the Tides Lesson · PDF fileThe Mantas of Yap The Rhythm of...

The Mantas of YapThe Rhythm of the Tides Lesson Plan
In this episode, Jonathan travels to Yap, an island in the Pacific nation of Micronesia, to dive with giant Manta Rays. Manta Rays come to this area to visit a “cleaning station” where parasites are removed by cleaner fish. The strong tidal currents create conditions for Mantas. Without the currents created by the changing tide, the cleaning station would not exist as Mantas require the strong currents to hold their position at a “cleaning station.” The currents keep the Mantas from sinking to the bottom as they have no swim bladder to control their buoyancy.The cleaning station is important to the rays as they get rid of parasites which can irritate and lead to infection. The “cleaner” fish benefit from this symbiotic relationship by having this food source. The visits to these cleaning stations coincide with the timing of the tides.
Science Lesson: The Rhythm of the Tides - Based on Webisode 20Grade Level: 6-8Time: At least five (45-50 min) class periods.
Rhythm of the Tides - Page 1learn more at www.blueworldTV.com!
by Bill Andrake
Introduction
One of the most powerful forces affecting the seashores are the tides. Tides are responsible for currents and changes in water depth. Many of the most productive ecosystems such as salt-marshes or rocky intertidal areas are the direct result of the intertidal zones created by tides. Many scientists have speculated that tides may have led to the evolution of land life from the sea as creatures adapted to spending longer hours out of water.
Science StandardsNational Science Education Standards Earth and Space Science:• Structure of the Earth SystemPhysical Science:• Motion and ForcesOcean Literacy PrinciplesPrinciple #1: The Earth has one big ocean with many features. Ocean Circulation
Objectives• To use a study of the tides to gain better understanding of the lunar cycle and the interrelationship between the moon and the Earth. • To learn what causes ocean tides, tidal cycles, and how they change the water level along coastal areas.• To understand the gravitational forces of the sun and moon on our planet.• To gain a better understanding of how gravity works.
Partial support for this work was provided by the National Science Foundation Grant DUE/NSDL #1043823. Any opinions, findings, or conclusions expressed are those of the author(s) and do not necessarily reflect the views of the National Science Foundation.
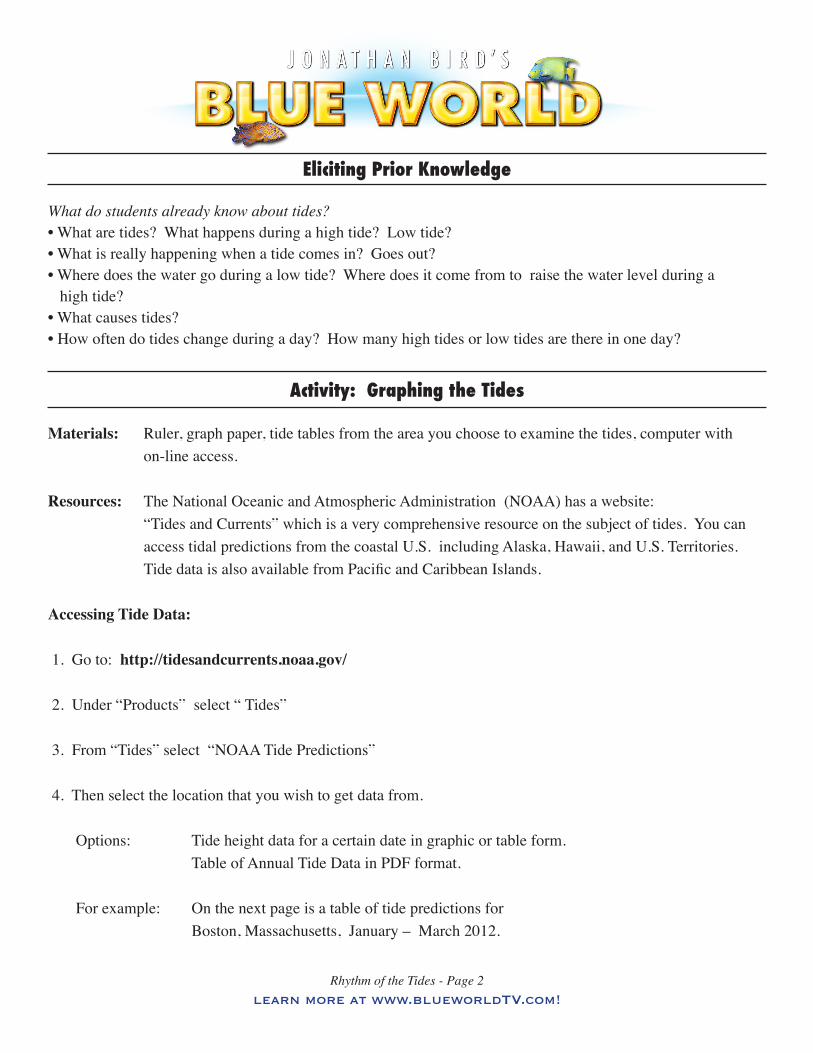
Eliciting Prior Knowledge
What do students already know about tides?• What are tides? What happens during a high tide? Low tide? • What is really happening when a tide comes in? Goes out? • Where does the water go during a low tide? Where does it come from to raise the water level during a high tide?• What causes tides?• How often do tides change during a day? How many high tides or low tides are there in one day?
Rhythm of the Tides - Page 2learn more at www.blueworldTV.com!
Activity: Graphing the Tides
Materials: Ruler, graph paper, tide tables from the area you choose to examine the tides, computer with on-line access.
Resources: The National Oceanic and Atmospheric Administration (NOAA) has a website: “Tides and Currents” which is a very comprehensive resource on the subject of tides. You can access tidal predictions from the coastal U.S. including Alaska, Hawaii, and U.S. Territories. Tide data is also available from Pacific and Caribbean Islands.
Accessing Tide Data:
1. Go to: http://tidesandcurrents.noaa.gov/
2. Under “Products” select “ Tides”
3. From “Tides” select “NOAA Tide Predictions”
4. Then select the location that you wish to get data from.
Options: Tide height data for a certain date in graphic or table form. Table of Annual Tide Data in PDF format.
For example: On the next page is a table of tide predictions for Boston, Massachusetts, January – March 2012.

Rhythm of the Tides - Page 3learn more at www.blueworldTV.com!

Rhythm of the Tides - Page 4learn more at www.blueworldTV.com!
Understanding the Tide Table
Example #1: Tide Data: January 1st, 2012, for Boston, Massachusetts
Height Time ft. cm 0437 AM 9.1 277 (High Tide) 1048 AM 1.3 40 (Low Tide) 0500 PM 8.5 259 (High Tide) 1107 PM 1.3 40 (Low Tide)
High tides happen at 4:37 AM and 5:00 PM and low tides happen at 10:48 AM and 11:07 PM.
Height of the tide is the number of feet or cm that the water level is above (or below) the zero point. “ 0.0 ft. ” is the average height of the water for all low tides in that area. This is an important reference point known as “mean low water” (MLW).
Its important to know that these are predicted heights based on years of recorded data. The actual heights can vary due to storms, high winds, and heavy rainfall.
Example #2: Tide Data: January 23, 2012, for Boston, Massachusetts
Time Height ft. cm 0437 AM - 0.3 - 9 (Low Tide) 1054 AM 11.2 341 (High Tide) 0514 PM - 1.1 - 34 (Low Tide) 1130 PM 10.0 305 (High Tide)
In this data set the low tides are known as “minus tides” where the height of the water is actually below the average low tide, mean low water (MLW). This occurs during periods of strong tides which will be discussed later in the lesson.

Rhythm of the Tides - Page 5learn more at www.blueworldTV.com!
Procedure for graphing tides…. PENCIL ONLY…
1. From tide tables, pick a date(s) for tides to be graphed.
2. Set up the vertical (y axis) and horizontal (x axis) on graph paper. The y-axis will be tide height (ft.) and the x-axis will be the time. Set up scales on the graph according to tide height range and time period that you wish to graph.
3. Mark data points on the graph for each tide and connect them with a straight line. (see example below) • Tide Data for January 23, 2012, for Boston, Massachusetts Time: Height: ft. 0437 AM - 0.3 (Low Tide) 1054 AM 11.2 (High Tide) 0514 PM - 1.1 (Low Tide) 1130 PM 10.0 (High Tide)

Rhythm of the Tides - Page 6learn more at www.blueworldTV.com!
Graph Analysis Questions
1. About how much time is there between high and low tides?
2. If an animal lived attached to rocks at a height of 8 feet above mean low water, how many hours would it spend under water from 4:30 am to about 11:30 pm?
• About how many hours would this animal spend out of the water, exposed to the air during that same period?
3. If an animal lived attached to rocks at about 1 foot above mean low water, how many hours would it spend underwater from 4:30 am to 11:30 pm ?
• How many hours would this animal spend out of the water, exposed to the air during that same period?
4. What is the relationship between height in the intertidal zone and time spent out of the water?
5. What are dangers that animals face when out of the water during a low tide period?
6. What are some adaptations that creatures in the intertidal zone have to prevent dehydration during periods of low tide?
• It’s important to note that the line graph completed in this activity is not an accurate depiction of how tides change. Rather than sharp changes from high to low tide, the graph is more like a “sine wave” curve. (see below)

Rhythm of the Tides - Page 7learn more at www.blueworldTV.com!
Activity: What Causes Tides ? (Part 1)
Materials: Ruler, graph paper, tide tables from the area you choose to examine the tides, tape, computer with on-line access.
Introduction:
In this activity students create a graph of the tides for a one month period. Students then make observations from the graph, looking for patterns and changes.
From these observations, connections will be made between the observed tide data and astronomical data for that month, in order to learn the relationship between ocean tides and the Lunar Cycle; and ultimately the cause of the tides.
The water level along the coast changes constantly creating intertidal zones.The ocean moves in and out as its level rises and falls, high tides and low tides;changing every six hours or so.
Question(s): Where does the water go at low tide ? Where does the water come from to create a high tide ? What causes the tides?
Prior Knowledge: ___________________________________________________________________________
__________________________________________________________________________________________
__________________________________________________________________________________________
__________________________________________________________________________________________

Rhythm of the Tides - Page 8learn more at www.blueworldTV.com!
Vocabulary and Background
Gravity: The natural force of attraction (pull) between any two massive bodies, such as planets, stars, the Moon, etc. Important: • The more massive the object the more gravitational pull it exerts • Gravitational pull increases as the distance between the objects decreases
Lunar : Having to do with our Moon
Lunar Cycle : The orbit or revolution of the Moon around the Earth... about 27 days. It’s important to note that it takes about 29 days between the same lunar phase each month due to the change in the Earth’s position in its revolution around the Sun.
Mean Low Water: On a tide chart or graph ( “0.0” feet or meters ); The average of height of the water calculated from all low tides over a long period of time.
Minus Tide: A strong low tide when the water level during low tide is lower than that of the mean low water; usually occurring during spring tides.
Moon’s Phases: Positions of the Moon in its lunar cycle relative to the Earth and sun; identified by the way the Moon is illuminated by sunlight.
Apogee: Point at which the Moon is at its furthest distance from the Earth during the lunar cycle.
Perigee: Point at which the Moon is closest to the Earth during the lunar cycle.
Spring Tides: A period of strong tides occurring twice during a lunar cycle, during the full and new moon phases.
Neap Tides: A period of weak tides occurring twice during a lunar cycle, during the first and last quarter phases of the Moon.

Rhythm of the Tides - Page 9learn more at www.blueworldTV.com!
Option 1: Class Graph
Using tide tables, graph the water level of the tides over a one month period just as in the first activ-ity. Divide the class into teams and have each team graph a period of days for that month.
For example, with six teams of four students, each team graphs the tides for five consecutive days in the month.
When graphs are completed, tape the graphs together with transparent tape, connecting lines between graphs in order, form one very long line graph of the tides for the month.
Then hang graph on a wall and step back with the class. Have students study the graph and record ob-servations regarding any patterns they see.
Option 2: On-line GraphResources: “Tides and Currents” website from NOAA.
Accessing tide data for a one month period
1. Go to: http://tidesandcurrents.noaa.gov/ 2. Under “Products” select “ Tides”.3. From “Tides” select “Historic Tide Data” or “Observed Data”.4. Then select the location from which you wish to get data.5. Finally, customize your graph for time period, data units, time zone, etc. When ready select “view plot” and click “ view larger plot” on right hand side of the page. Below is an example of such a plot from Boston, Massachusetts for the month of October, 2010.
Have students study the graph and record observa-tions regarding any patterns they see.
Procedure: Preparing A Graph

Rhythm of the Tides - Page 10learn more at www.blueworldTV.com!
Record observations from the monthly tide graph:
_________________________________________________________________________________________
_________________________________________________________________________________________
_________________________________________________________________________________________
_________________________________________________________________________________________
_________________________________________________________________________________________
_________________________________________________________________________________________
_________________________________________________________________________________________
_________________________________________________________________________________________
The next step is to collect lunar data for this month and start making connections between the position of the Moon with Earth and the tides.
To get this information:
Accessing tide data for a one month period
1. Go to: http://tidesandcurrents.noaa.gov/
2. Under “Products” select “ Astronomical Data”
3. Then select month and year that matches your tide graph.
The downloaded lunar data for October 2010 is shown on the next page.

Rhythm of the Tides - Page 11learn more at www.blueworldTV.com!
Using the “Astronomical Data” on the Lunar Cycle for this month, label the following on the tide graph accord-ing to their date:
• New Moon • Apogee • First Quarter • Perigee • Full Moon • Spring Tides • Third Quarter • Neap Tides

Rhythm of the Tides - Page 12learn more at www.blueworldTV.com!
Connections of the Tides to the Lunar Data
1. During which two phases of the Moon were the tides the strongest ?
__________________________ _______________________________ During which two phases of the Moon were the tides the weakest ?
__________________________ ______________________________
2. During which of the Moon’s phases are the Earth, Moon, and Sun aligned?
___________________________ _________________________________
3. During which of the Moon’s phases are the Earth, Moon, and Sun most out of alignment ?
___________________________ _________________________________
4. During which of the Moon’s phases would the gravitational forces of the Sun and Moon work together causing the greatest pull on the Earth’s oceans?
___________________________ _________________________________
..... and least able to work together ?
___________________________ _________________________________
5. When were the tides the STRONGEST of this month ____________________________
Give an explanation as to why the tides were so STRONG during that time.
_______________________________________________________________________________________
________________________________________________________________________________________

Rhythm of the Tides - Page 13learn more at www.blueworldTV.com!
6. On what date(s) were the tides the WEAKEST of this month ? ____________________
Give an explanation as to why the tides were so WEAK during that time.
________________________________________________________________________________________
________________________________________________________________________________________
7. How could we experience STRONG tides during a first or third quarter phase of the Moon?
________________________________________________________________________________________
________________________________________________________________________________________
8. How could we experience WEAKER tides during a new or full phase of the Moon?
________________________________________________________________________________________
________________________________________________________________________________________
9. The Sun is millions of times more massive than our Moon but the gravitational pull of the Sun on the Earth’s oceans is less than half that of the Moon!
Give a reason for this: _____________________________________________________________________
________________________________________________________________________________________
________________________________________________________________________________________
Extending the activity: Examine graphs of tides from different months. Search for astronomical data thathas perigee during quarter phases and apogee during New and Full Moon phases. Examine tide graphs from different parts of the world. • Compare Pacific and Atlantic. • Islands vs. Continental Shores. • Compare tides at different Latitudes… tropical vs. polar.
Next, move to part 2 of this lesson which will get into an explanation of how tides work and reasons for their variations.

Rhythm of the Tides - Page 14learn more at www.blueworldTV.com!
EarthRotateson its Axis
Moon
Bulge of Water
Moonʼs gravity pulls on the ocean
North
PoleLow Tide
HighTide
What Causes Tides ? (Part 2)
We know from the pattern of tides on a graph and the Moon’s phases that the gravitational pull of the Sun and the Moon on the Earth’s oceans cause tides... but how does it work?
The Moon’s gravity pulls on the ocean creating a bulge of water toward the Moon.
• When a point on the Earth rotates into this bulge of water it has a high tide.
• When a point on the Earth rotates away from this bulge it has a low tide.
BUT WAIT !!!! There are two HIGH tides and two LOW tides each day. We need two tidal “bulges” of water. But how? How do we get a second “bulge” of water on the opposite side of the Earth?

Rhythm of the Tides - Page 15learn more at www.blueworldTV.com!
There’s another force at work creating this second bulge......
EarthRotateson its Axis
Moon
Bulge of Water
Moonʼs gravity pulls on the ocean
North
Pole
Low Tide
HighTide
HighTide
Low Tide
?
Moon
The pull between the Moon and the Earth
HighTide
HighTide
The center of gravity or “barycenter ” Moon and
the Earth
The first thing that you need to know is that the Earth does not stay put as the moon goes around it. HERE’S THE KEY.....
The pull of gravity between two objects of different size like the Earth and the Moon place the center of gravity or “balance point” between the two about an eighth of the way into the Earth.
The Earth and the Moon BOTH revolve around this common center of gravity. As the Earth goes around the common center of gravity, the ocean is thrown outward, This is much like the ef-fect you feel when a car turns a corner and you are thrown outward against the door.

Rhythm of the Tides - Page 16learn more at www.blueworldTV.com!
The Earth and Moon revolve around the “barycenter” once every 27 days.
To see an animation of this go to “What Causes the Tides? ” at:http://www.pbs.org/wgbh/nova/venice/tides.html
So to summarize:
• The ocean gets “stretched ” forming two tidal bulges of water or high tides.
• One bulge is caused directly by the pull of gravity from the Moon. This is called the “direct high tide”.
• The second bulge is on the opposite side of the Earth and is caused when the water gets pushed outward as the Earth and Moon go around the common center of gravity. This is called the “opposite high tide”.

Rhythm of the Tides - Page 17learn more at www.blueworldTV.com!
The Earth rotates on its axis once every 24 hours. A place on a coastline will rotate into a tidal bulge resulting in a high tide. As the Earth spins, this coastal location will move away from the tidal bulge and six hours later reach a point between tidal bulges; a low tide. Six hours later another high tide and so on. So we experience two high tides and two low tides each day... roughly six hours between each tide event.
Moon
Ocean
Moonʼs gravity pulls on the ocean
Low Tide
HighTide
HighTide
Low Tide
water “thrown” outward
North
Poledirect
high tideopposite high tide
Moon
Low Tide
HighTide
Low Tide
North
Pole
Moonʼs Positionthe next dayLow Tide
Low Tide
North
PoleMoonʼs Position
previous dayHighTide
HighTide
High Tide
Why does the time of a tide occur about an hour later the next day ?
As the Moon revolves around the Earth, the tidal bulges move with it, thus a location on the Earth must “catch up” to the tidal bulge, thus the Earth must rotate “50 minutes” further to reach the tidal bulge.
Rhythm of the Tides - Page 18learn more at www.blueworldTV.com!
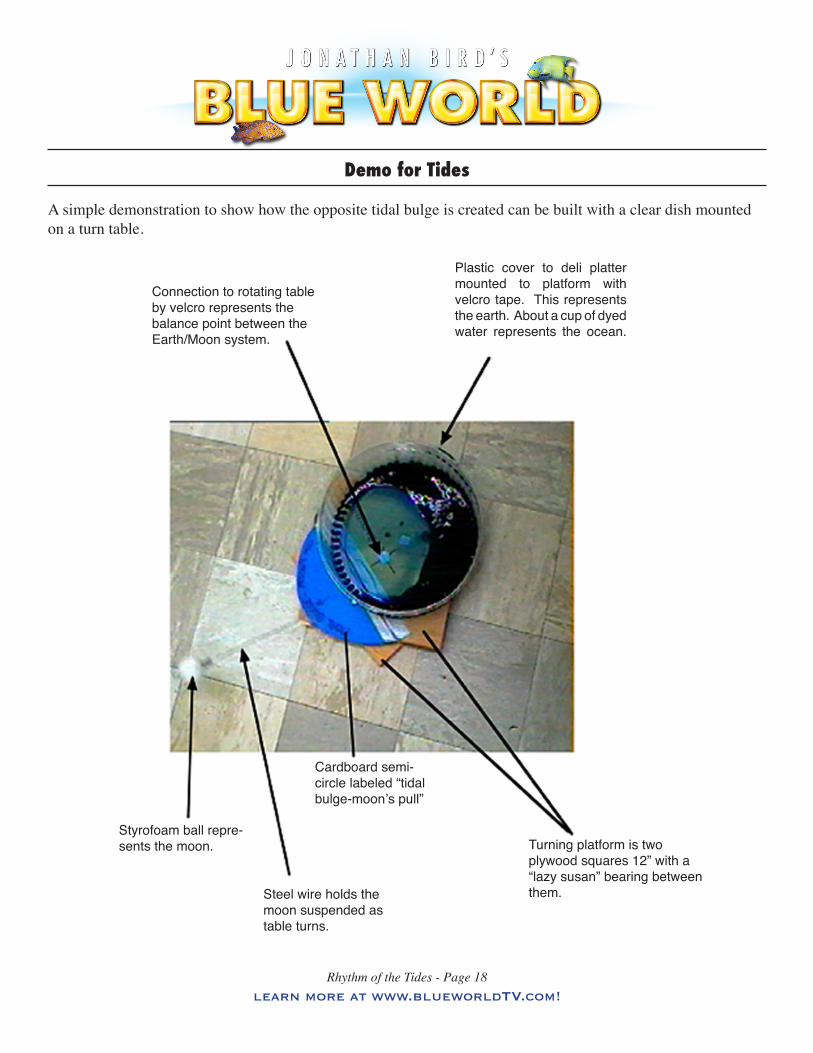
Demo for Tides
A simple demonstration to show how the opposite tidal bulge is created can be built with a clear dish mounted on a turn table.
Connection to rotating tableby velcro represents thebalance point between theEarth/Moon system.
Plastic cover to deli plattermounted to platform with velcro tape. This represents the earth. About a cup of dyed water represents the ocean.
Styrofoam ball repre-sents the moon.
Steel wire holds the moon suspended as table turns.
Turning platform is two plywood squares 12” with a “lazy susan” bearing between them.
Cardboard semi-circle labeled “tidal bulge-moon’s pull”

Rhythm of the Tides - Page 19learn more at www.blueworldTV.com!
Rotating the table produces a high tide (bulge of water) on the opposite side of the Earth away from the moon.

Rhythm of the Tides - Page 20learn more at www.blueworldTV.com!
springtides
springtides
neaptides
neaptides
PA
New Full1st Q Last Q
Variations in the Tides
Why are tides stronger at some times during the month than at others?
• Generally there are two periods during a lunar cycle when tides are stronger with higher high tides and lower lows; these are called spring tides.
• There are also two periods in a lunar cycle where tides are weak; these are called neap tides.
Spring tides occur during the New and Full Moon whereas neap tides happen during the First and Last Quarter phases of the Moon.
We have to realize that the gravitational pull from the Moon is not the only factor causing tides. The Sun’s gravitational pull is also affecting tidal bulges, however the Moon plays a much greater role as it is much closer to the Earth than the Sun.
During the Full and New Moon phases, the forces causing tides are aligned so that the Sun and Moon are work-ing together, leading to stronger tidal bulges and “spring tides.”
SunNew Moon
Full Moon
Spring Tides
Earth

Rhythm of the Tides - Page 21learn more at www.blueworldTV.com!
Sun
Last Quarter
FirstQuarter
Neap Tides Earth
During the Quarter phases, the forces causing tides are NOT aligned so that the Sun and Moon are NOT work-ing together, leading to weak tidal bulges and neap tides.
Apogee and Perigee
Phases of the Moon are not the only factors causing changes in the strength of the tides.
The Moon’s orbit around the Earth is elliptical (not circular). There are times when the Moon closer to the Earth than others. When the Moon is at its closest point to the Earth during the Lunar Cycle this is called perigee. At this point the Moon’s gravitational pull is greater causing stronger tides.
When the Moon is at its furthest point from Earth in the Lunar Cycle it is at apogee. During apogee the Moon’s pull on the Earth is weaker and tidal bulges are smaller.
Earth Moon atApogee
Moon atPerigee
With the Moon at Perigee during a Full or New Moon tides can be extremely strong; not the time to have a coastal storm. If the Moon were at Apogee near a Quarter phase, tides can be very weak, as seen in the tide graph on the previous page (page 21) around Sept. 9th.

Rhythm of the Tides - Page 22learn more at www.blueworldTV.com!
Why is one high tide stronger than the other on most days, but on some days they seem to be the same height ?
The Moon’s orbit is tilted at about an 18º angle to the Earth’s Equator. This means that the Moon’s position north or south of the Equator or angle of declination constantly changes during its orbit around the Earth. As the Moon’s declination changes, the direct and opposite tidal bulges shift north or south of the Equator causing changes in the strength of tides.
Moon North of the Equator:
With a northern declination, the direct tidal bulge shifts toward the north whereas the oppositetidal bulge shifts south of the Equator. The direct high tide is stronger than the opposite high tide in the Northern Hemisphere
direct high tideopposite high tide
Moon
N
S
opposite high tide direct high tide
Equator
Moonʼs orbit

Rhythm of the Tides - Page 23learn more at www.blueworldTV.com!
Moon
N
S
opposite high tidedirect high tide
Equator
direct high tideopposite high tide
direct high tide opposite high tide
N
S
opposite high tide direct high tide
Equator
Moon South of the Equator:
With a southern declination, the direct tidal bulge shifts toward the south with the opposite tidal bulge shifting north of the Equator. The opposite high tide is now stronger than the direct high tide in the Northern Hemisphere.
Moon Crosses Over the Equator:
Over the Equator the Moon’s angle of declination is 0º. The di-rect high tide is equal in strength to the opposite tide in both the Northern and Southern Hemisphere. The Moon crosses the Equator twice during each Lunar Cycle.

For more on this topic of declination go to the following animations:The NOAA “Tides and Currents” website. Education section: http://oceanservice.noaa.gov/education/kits/tides/tides04_angle.html
From the PBS NOVA Series. Episode: “The Sinking of Venice” What Causes Tides? Tidal Curiosities section: “Why do some places on Earth experience only one high tide (and one low tide) in a 24-hour period instead of two? “ http://www.pbs.org/wgbh/nova/venice/tide_curiosities.html
One Month Tide Graph Assessment: (answers to the example on page 29)Download a tide graph for one month and make predictions on the graph for when the phases occur, apogee, perigee, or when the Moon is over the Equator in its declination. Then download astronomical data and check your predictions.
Example:
Rhythm of the Tides - Page 24learn more at www.blueworldTV.com!
On-Line Resources for TidesTutorialsFrom the NOVA series on PBS: “The Sinking of Venice”... an excellent, basic summary about the cause of tides with very good ani-mations: http://www.pbs.org/wgbh/nova/venice/tides.html
Education Tides NOAA ... A very comprehensive tutorial on how tides work.http://oceanservice.noaa.gov/education/kits/tides/welcome.html
Tide Data: Tides online from NOAA; from predicted to archived data anywhere in the world. Tables and graphs. http://tidesandcurrents.noaa.gov/ http://tidesonline.nos.noaa.gov/Astronomical Data Pertaining to TidesNOAA Tides and Currents: http://tidesandcurrents.noaa.gov/astronomical.html

Rhythm of the Tides - Page 25learn more at www.blueworldTV.com!
Graph Analysis Questions (page 6): Answer Key
1. About how much time is there between high and low tides? 6 hours
2. If an animal lived attached to rocks at a height of 8 feet above mean low water, about how many hours would it spend under water from 4:30 am to about 11:30pm? • about 4 hours
About how many hours would this animal spend out of the water, exposed to the air during that same period? • about 15 hours 3. If an animal lived attached to rocks at about 1 foot above mean low water, how many hours would it spend underwater from 4:30 am to 11:30 pm ? • about 16 hours
How many hours would this animal spend out of the water, exposed to the air during that same period? • about 3 hours
4. What is the relationship between height in the intertidal zone and time spent out of the water? • The higher the location in the intertidal zone the more time is spent out of water.
5. What are dangers that animals face when out of the water during a low tide period?
Drying out. Overheating in strong sun. Freezing in winter. Exposure to freshwater from rainfall. Predators such as shore birds. Waves when tide comes in or goes out.
6. What are some adaptations that creatures in the intertidal zone have to prevent dehydration during periods of low tide? • Hard exoskeletons (shells) that can close tightly to keep out the elements and protection from predators. Suction or other ways (such as threads on mussels) to hold on to surfaces to keep from being washed away by waves.

Rhythm of the Tides - Page 26learn more at www.blueworldTV.com!
Connections of the Tides to the Lunar Data (from page 12) Answer key:
1. During which two phases of the Moon were the tides the strongest? New Moon and the Full Moon During which two phases of the Moon were the tides the weakest? First and Third Quarter
2. During which of the Moon’s phases are the Earth, Moon, and Sun aligned? New and Full Moon phases 3. During which of the Moon’s phases are the Earth, Moon, and Sun most out of alignment? First and Third Quarter 4. During which of the Moon’s phases would the gravitational forces of the Sun and Moon work together causing the greatest pull on the Earth’s oceans? New and Full Moon phases ..... and least able to work together? First and Third Quarter
5. When were the tides the STRONGEST of this month? October 6-7. Give an explanation as to why the tides were so STRONG during that time.The gravitational forces acting on the Earth were very strong on this date. This is because the Moon was closest to the Earth in its orbit (Perigee) and it was also a New Moon at this time. In this phase, the Sun, Moon, and Earth were aligned so the gravitational forces from the Sun and Moon were working together to pull on the water of planet Earth.
6. On what date(s) were the tides the WEAKEST of this month ? October 16th Give an explanation as to why the tides were so WEAK during that time.
The gravitational forces acting on the Earth were weak. This is because the Moon was farthest point from the Earth in its orbit (Apogee) and it was also a the First Quarter Phase at this time. In this phase, the Sun, Moon are at right angles to the Earth so the gravitational forces from the Sun and Moon work against each other and weaken the pull on the water of planet Earth.
7. How could we experience STRONG tides during a first or third quarter phase of the Moon? This could happen if the Moon were in perigee during these phases.
8. How could we experience WEAKER tides during a new or full phase of the Moon? This could happen if the Moon were in apogee during these phases.
9. The Sun is millions of times more massive than our Moon but the gravitational pull of the Sun on the Earth’s oceans is less than half that of the Moon! Give a reason for this: The force of gravity experienced from a body depends upon the mass of the body as well as its distance from the object that it is acting on. The Sun has much more gravity than our Moon however the Sun is 93 million miles away, whereas the Moon is only a quarter of a million miles from Earth. Thus, the Moon’s influence is stronger.
One Month Tide Graph Assessment: (answers to the example from page 24)
Spring Tides E Neap Tides F New Moon A Moon in 1st Quarter B
Moon over Equator D Opposite high tides G Direct high tides C
• Give an explanation for why the tides around March 1 are so much stronger than those around March 14? (Be complete) The Moon must be in perigee having a greater gravitational pull around March 1st and apogee with a weaker pull around the Full Moon on the 14th.