The Magnetism of Suburban Shopping Centers:Do Size ... · the magnetism of suburban shopping...
26
IRES 2007-002 IRES Working Paper Series The Magnetism of Suburban Shopping Centers:Do Size & Cineplex Matter? OOI Thian Leong, Joseph [email protected] SIM Loo Lee Department of Real Estate National University of Singapore
Transcript of The Magnetism of Suburban Shopping Centers:Do Size ... · the magnetism of suburban shopping...

IRES 2007-002
IRES Working Paper Series
The Magnetism of Suburban Shopping Centers:Do Size & Cineplex Matter?
OOI Thian Leong, Joseph [email protected]
SIM Loo Lee
Department of Real Estate National University of Singapore

The magnetism of suburbanshopping centers: do size and
Cineplex matter?Joseph T.L. Ooi and Loo-Lee Sim
Department of Real Estate, National University of Singapore, Singapore
Abstract
Purpose – This paper aims to address two questions related to the magnetism or drawing power ofsuburban malls: first, does physical size matter, and second, what is the externalities effect of housinga Cineplex within a shopping center?
Design/methodology/approach – The study was carried out through an extensive surveycovering 1,283 shoppers in nine selected suburban shopping centers in Singapore. The effects ofphysical size and the presence of Cineplex on the magnetism on the selected suburban shoppingcenters are evaluated using analysis of variance (ANOVA) tests. Their effect on shoppingduration and expenditure pattern is also empirically tested using a recursive simultaneousequations model.
Findings – The survey results affirm that both physical size and the presence of a Cineplex enhancethe magnetism of suburban shopping centers. A larger shopping center can facilitate a greater varietyof shops and create a more pleasant environment for the shoppers, thus enticing shoppers to visit andstay longer. Cinema patrons prefer to watch movies at Cineplex located in shopping centers.Controlling for the endogenous relationship between duration of visit and amount spent in theshopping center, the regression results show that, while physical size and Cineplex have a positiveeffect on the duration of visit, they do not necessarily have a direct effect on the amount spent by thepatrons in the shopping center.
Originality/value – One of the main challenges for mall owners and managers located outside thetraditional shopping belt is how to attract shoppers to patronize their malls. While the impact ofshopping center size on retail rents and center attractiveness has been addressed in the literature, thispaper adds some new insights into the field. The focus on whether the presence of a cinema complexwithin a shopping center affects its magnetism or not is novel.
Keywords Shopping centres, User studies, Consumer behaviour, Cinema, Singapore
Paper type Research paper
I. IntroductionThe proliferation of shopping centers outside the traditional shopping belt ishappening across the world. The first suburban enclosed shopping center in theUSA, called Southdale Mall, was opened near Minneapolis in 1956 (Eppli andBenjamin, 1994). Over the years, shopping centers have grown larger and theirone-stop convenience having expanded to include service outlets and entertainmentproviders. These neighborhood and community shopping centers offer an
The current issue and full text archive of this journal is available at
www.emeraldinsight.com/1463-578X.htm
The authors acknowledge Mark Eppli, the two reviewers and participants at the 2005 AmericanReal Estate Society Meeting in Santa Fe, USA for their comments and feedback on an earlierdraft of this paper. They would also like to thank Ivy Loh, Pearl Lok, Larrisa Lim, Eileen Chenand Samantha Seow for their assistance with the data coding and processing.
Do size andCineplex matter?
111
Received January 2006Accepted September 2006
Journal of Property Investment &Finance
Vol. 25 No. 2, 2007pp. 111-135
q Emerald Group Publishing Limited1463-578X
DOI 10.1108/14635780710733816

environmentally controlled protected setting with an array of services, from postoffices, medical services, and transient and permanent housing, to entertainment,including theaters, and even amusement parks and suburbia. They offer shoppersan attractive sanitized urban experience, but without the associated negatives suchas traffic congestion or crime and security issues in traditional shopping districts(Bloch et al., 1994; Roulac, 1994; Erkip, 2003). Suburban shopping centers haveindeed become more than a retail place for the local community. In Singapore, theyhave significantly altered the residents’ lifestyle with their tenant mix of customaryretail shops, entertainment outlets, cinemas, public library, and food courts (Ibrahimand Ng, 2002).
An important issue face by owners and managers of suburban shopping centersis how to attract shoppers to patronize their malls, especially when they are locatedoutside the primary shopping belt. Convenience, although usually having the largestimpact, is by no means the sole determinant of shopping center choices (Severinet al., 2001). While the retail sales are normally related positively to the income leveland demographic characteristics of the population in their immediate market, thisrelationship may be confounded by outshoppers, which are defined as consumerswho move across markets (Russel, 1957; Lillis and Hawkins, 1974; Anderson andKamisky, 1985). Hence, shopping malls that create an appropriate appeal canthemselves become destination attractions. The mega-sized Mall of America inMinnnesota, for example, is reported to have drawn one-third of its visitors to travelmore than 150 miles to reach the mall (Roulac, 1994). Similarly, the West EdmontonMall in Alberta was reported to have become Canada’s top tourist attractions withits 800 stores, 110 restaurants, and 400,000 square feet theme park (Bloch et al.,1994). Given that the entertainment motive has become more important in enhancingshoppers’ experience in the recent years, Cineplex are now commonly located withinsuburban shopping centers.
This paper focuses on the magnetism of suburban shopping centers which,because of their location, need to provide a sufficiently attractive shoppingexperience to offset the distance inertia. In this paper, we gauge the magnetism ordrawing power of suburban shopping centers by their ability to first, promotefrequent visits from local residents, second, entice “outshoppers” to travel to themall and finally, encourage both groups to stay longer and spend more during theirvisit. The paper addresses two questions related to the magnetism of suburbanshopping centers: first, does their physical size matter, and second, what is theexternalities effect of accommodating a Cineplex within a suburban shoppingcenter? Reilly’s (1931) Law of Retail Gravitation Model and the extension by Huff(1964), which modeled the attractiveness of a shopping center as decreasing withdistance and increasing with the size of the shopping center, hypothesize that themagnetism of a suburban shopping center is a function of its physical size[1]. As oneof the major tenants in term of space occupied, the Cineplex is expected to contributeto the shopping center by acting as an attractor to increase traffic flow andconsequently, generate positive externality for other stores. However, the success ofCineplex in generating positive externality for other stores within the shoppingcenter is still not very clear. This will be related to whether the proprietors ofCineplex deserved to be charged a lower rental rate than other tenants? This paper is
JPIF25,2
112
the first attempt to examine the payoffs associated with housing a Cineplex within asuburban shopping center.
Our study involves a survey of 1,283 shoppers in nine suburban shopping centersin Singapore. The results indicate that physical size does matters to theattractiveness of a suburban shopping center. Whilst mall size, in itself, is ranked6th in terms of importance, a large-sized shopping center can however facilitate agreater variety of shops and more anchor tenants, which are ranked as important tothe shoppers. The benefits of having a cinema as an anchor tenant in suburbanshopping centers are also established. In particular, more than 72 percent of thoseinterviewed feel that the presence of a Cineplex would entice them to visit ashopping center more often. Playing the role of any attractor, the Cineplex increasesmall traffic and induces more sales for other stores. In the multivariate analysis, weemploy a recursive simultaneous equations model to control for the endogenousrelationship between duration of visit and amount spent in the shopping center. Theestimation results indicate that whilst physical size and Cineplex have a positiveeffect on the duration of visit, they only have an indirect effect on the amount spentby the visitors in the shopping center.
The rest of this paper is structured as follows. In section II, we review previousstudies on the patronage of shopping centers. Section III presents the research plan andintroduces our measurement of the magnetism of shopping centers. Section IVdescribes the survey sample. This is followed by a discussion on the size effect insection V and the Cineplex effect in section VI. Section VII presents the results of oursimultaneous regression on the impact of both factors on the patrons’ expenditure.Section VIII concludes.
II. Literature reviewWhat do we know about the success factors of shopping centers? The literature has alot to say about what makes a shopping center attractive to shoppers. Essentially, bothspatial and non-spatial factors are important. A number of studies have examined theirinfluence as determinants of shopping center rent (Sirmans and Guidry, 1993; Gatzlaffet al., 1994; Hardin and Wolverton, 2000). Biba et al. (2006) brings additional insightsinto the factors affecting customers’ choice for a shopping centre.
With respect to location, the two most commonly noted determinants of retailpatronage are accessibility and visibility (Simmons, 1992; Ownbey et al., 1994;Forgey et al., 1995). Size and quality of facilities are also relevant to retail patronageto the extent that unfavorable design characteristics may negate the attractions ofan accessible and visible site (Brown, 1999). The gravity and potential models havetraditionally been used for defining trading areas surrounding major cities. Theyprescribe that shoppers choose which centers to patronize by balancing between theutility (proxied by the size of the center) and the cost (proxied by distance) of thecenter to the shopper. With the growth of the regional shopping center, these “laws”have been utilized to predict market boundaries between competing retail facilitieswithin metropolitan areas (Bucklin, 1971). More recently, Eppli and Shilling (1996)employ a retail gravity model to test the importance of retail agglomeration andproximity to competition. They estimate aggregate retail sales (Rij) in retail market ifor center j as:
Do size andCineplex matter?
113

Ri;j ¼ Yi *
Maj
Dg
i;j
� �Xmk¼j
Mak
Db
i;k
!
where Mj is the size (in square feet of the jth shopping center, Dij is the distance fromthe ith consumer to the jth shopping center, Mk is the size of the kth shopping center,Dik is the distance from the ith consumer to the kth shopping center, Yi is total retailexpenditures in the trade area, and a, b and g are friction parameters (a low valuefor a indicates that shopping center size is of little importance and low values for band g means that distance is not inhibiting when selecting a shopping center. Usingactual retail sales at 38 regional shopping centers, the authors find that the retailsales are largely determined by center size, and to a lesser extent, by proximity tocompetition. They find that a decrease in competitive shopping center size of 20percent increase center J sales by 30 percent to 40 percent. Conversely, a 20 percentincrease in the size of competitive shopping center reduces center J sales by 16percent to 21 percent. In a recent study on Quebec City, Canada, Des Rosiers et al.(2005) developed two space-related indices to measure regional and super-regionalshopping centers’ economic potential and centre attraction.
Recent studies have shown that enhancement of shopping experiences throughthe employment of exciting trade types and activities can serve as a better magneticattraction to shoppers. Non-spatial factors such as retail image and tenant mix areequally critical in enhancing shopping center patronage[2]. Generally, shoppingcenter owners expend resources to achieve a right image to draw shoppers (Mejiaand Benjamin, 2002). Similarly, retail mix, which is defined as the combination ofstores occupying a shopping center, affects its overall image, patronage and rentals(Kirkup and Rafiq, 1994; Gerbich, 1998). The empirical evidence has shown that thedrawing power of a shopping center can be increased by clustering together a largenumber of similar stores because of agglomeration benefits (Hotelling, 1929; Miceliet al., 1998). Tenant placement within a shopping center is also important to extractmaximum rental (Brueckner, 1993). Nelson (1958) and more recently, Eppli andShilling (1993) attempted to measure the degree of spillover shopping, or “retailcompatibility” across different types of non-anchor stores. Based on a sample ofstores in 54 shopping centers in the USA, Eppli and Shilling (1993) estimate thedegree of retail compatibility (as measured by percentage of customer interchange)as follows: highly compatible (.30 percent), moderately compatible (10-30 percent),slightly compatible (5-10 percent), incompatible (0 percent) and deleterious (, 0percent).
Anchor tenants also serve as a major drawing power to a retail mall. According toMiceli et al. (1998), developers should be interested not just in an individual store’sprofits, but also in the “traffic” it generates, since more traffic will produce largerspillover benefits (and hence profits) for other types of stores. Hence, shoppingcenters usually have one or more department stores, which are typically chargedlower rents, to generate demand for smaller retailers and to insure the success of theshopping centers (Nevin and Houston, 1980; Eppli and Shilling, 1993; Pashigian andGould, 1998; Konishi and Sandfort, 2003). In his seminal paper, Brueckner (1993)
JPIF25,2
114

models the rent differential between stores on the basis that tenants differ in theirexternal generating abilities. Ingene and Ghosh (1990) further suggest that demandexternalities flow only in one direction from anchor tenants to non-anchor tenants.Roulac (1994), however, note the demise of the competitive strength of traditionaldepartment stores as well as the disinclination of new anchor merchandisers tolocate in shopping centers. Gatzlaff et al. (1994) tried to quantify the impact of a lossof anchor tenant on the rental rates of 36 neighborhood and community shoppingcenters located across Florida and Georgia. They find that a shopping center’saggregate rental would reduce by approximately 25 percent due to the loss of ananchor tenant. An implication of this development is that shopping center ownersneed to be more selective as to which tenants should anchor their shopping center tomaximize revenue and minimize attrition rate.
III. Research methodologyBefore we examine the influence of mall size and Cineplex, the performance of theshopping malls need to be defined first. There are numerous ways in which a shoppingcenter’s performance can be benchmarked – the most direct way would, of course, beto gauge its profitability through its rental revenue or total receipts from retail sales.The Urban Land Institute (ULI) and the International Council of Shopping Centers(ICSC), for example, measure shopping center performance in terms of non-anchorretail sales per square foot[3]. However, due to confidentiality, we are unable to obtainthe relevant financial data for the selected shopping centers. Other possiblenon-monetary performance measures for shopping centers are traffic count, shoppersand tenants’ satisfaction survey, occupancy and turnover rate. For the purpose of thisstudy, we gauge the shopping centers’ performance by their magnetism, which isdefined as the ability to attract and retain shoppers. Like the gravitational pull of amagnet, the attractiveness of a shopping center is measured by its ability to first, pullshoppers toward the mall and second, to entice them to stay longer and hopefully,spend more in the shopping center.
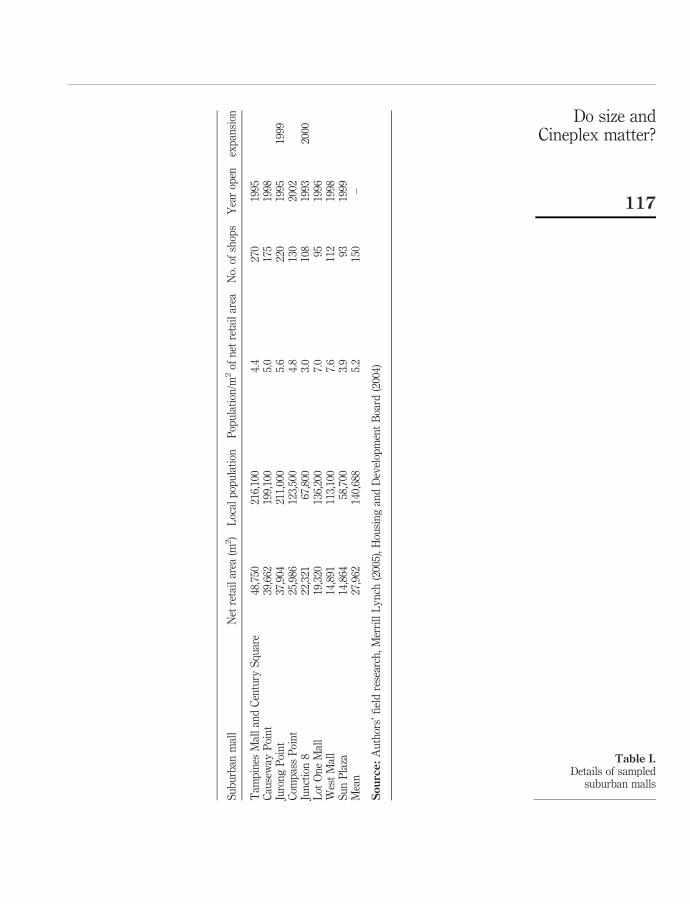
An extensive survey was conducted at selected suburban shopping centers inSingapore over two weeks, between mid to end September 2003. Nine suburbanretail malls were selected for the study, out of which three are located each in theNorth, East and West regions of Singapore. The location of the selected shoppingcenters is marked in the map presented in Figure 1 together with the location ofOrchard Road, which is the prime shopping belt in Singapore. Easch shoppingcenter is supported by a specific public housing estate with no competition in theform of other malls within the nearby area. The exception being Tampines Mall(29,233 m2) and Century Square (19,517 m2), which are located adjacent to eachother in the same housing estate. For the purpose of this study, we have aggregatedtheir details and presented them as though they are one shopping center. Acting asa focal point for the local community, the suburban shopping centers are more likethe community shopping centers in the USA. However, these shopping centers havegreater potential to attract residents from outside their immediate catchmentsbecause they are within easy reach by public transport as they are situated next to asubway (MRT) station and within walking distance from a major bus interchange.Basic details of the sampled shopping centers are provided in Table I.
Do size andCineplex matter?
115

Figure 1.Locations of sampledsuburban retail malls
JPIF25,2
116
Su
bu
rban
mal
lN
etre
tail
area
(m2)
Loc
alp
opu
lati
onP
opu
lati
on/m
2of
net
reta
ilar
eaN
o.of
shop
sY
ear
open
exp
ansi
on
Tam
pin
esM
all
and
Cen
tury
Sq
uar
e48
,750
216,
100
4.4
270
1995
Cau
sew
ayP
oin
t39
,662
199,
100
5.0
175
1998
Juro
ng
Poi
nt
37,9
0421
1,00
05.
622
019
9519
99C
omp
ass
Poi
nt
25,9
8612
3,50
04.
813
020
02Ju
nct
ion
822
,321
67,8
003.
010
819
9320
00L
otO
ne
Mal
l19
,320
136,
200
7.0
9519
96W
est
Mal
l14
,891
113,
100
7.6
112
1998
Su
nP
laza
14,8
6458
,700
3.9
9319
99M
ean
27,9
6214
0,68
85.
215
0–
Source:
Au
thor
s’fi
eld
rese
arch
,M
erri
llL
yn
ch(2
005)
,H
ousi
ng
and
Dev
elop
men
tB
oard
(200
4)
Table I.Details of sampled
suburban malls
Do size andCineplex matter?
117

The average age of the nine suburban shopping centers in our sample is eight years.The newest shopping center is four years old, whilst the oldest shopping center wascompleted some 13 years ago. Most of the shopping centers are at or close to fulloccupancy. All have food court and supermarkets. Eight of the shopping centers havedepartment store as anchor tenants. Five of the shopping centers have a branch of thenational library and only one mall (Compass Point) does not have a Cineplex. Theaverage size of the shopping malls is 24,855 m2, ranging from 14,864 m2 to 48,750 m2[4].The number of shops in the shopping malls varies from 93 to 270, averaging 150retailers in each shopping center. The average space allocated to each retailer rangefrom 133 sq m to 227 m2[5], which is comparable to the average size of retail outlets inNew Zealand’s community shopping centers (Gerbich, 1998). On a per m2 basis, themean net retail space provided is 0.192 m2 for each resident in the immediate housingestate. Not surprisingly, the size of the suburban shopping centers is positively relatedto the population of the immediate housing estate. For example, the three largestsuburban shopping centers, namely Tampines Mall/Century Square (48,750 m2),Causeway Point (39,662 m2) and Jurong Point (37,904 m2) are located in the three mostpopulated public housing estates in Singapore, namely Tampines (216,100 residents),Woodlands (199,100 residents) and Jurong West (211,000 residents). Conversely, SunPlaza, which has only 14,864 m2 of retail space, supports 58,700 residents in theSembawang housing estate.
Following the retail gravity models, we hypothesize that the magnetism of asuburban shopping center increases with the size of the mall. Similarly, the presenceof a Cineplex would enhance the magnetism of a suburban shopping center. Therelationships are tested in two stages. First, we examine the effects of physical sizeand the presence of Cineplex on the magnetism of the selected suburban shoppingcenters from the survey results. Second, we empirically test their effect on shoppingduration and expenditure pattern using multivariate regression models. In order tocontrol for the endogenous relationship between duration of visit and amount spentin the shopping center, a recursive simultaneous equations model is employed asfollows:
EXPENDITURE ¼ f ðSIZE; MOVIE; DURATIONÞ; ð1Þ
DURATION ¼ f ðSIZE; MOVIE; TRAVELÞ ð2Þ
where EXPENDITURE is the dollar amount spent on each visit to the shoppingcenter, DURATION is the time spent in the shopping center, SIZE is the size of theshopping mall, MOVIE is a binary variable indicating whether the main purpose ofvisiting the shopping center is watching a movie, and TRAVEL is the time taken toreach the shopping center. We also control for the characteristics of the respondents(age and gender), the day of interview (weekend or weekdays), whether the mainreason for visiting the mall is shopping, whether they are visiting alone oraccompanied by family, relatives or friends and how often they shop and watchmovies. These factors have been found in previous studies to have a significantinfluence on shoppers’ spending patterns.
The estimator employed is the full information maximum likelihood. Typical ofmodels involving expenditure, which are usually censored, equation (1) is estimatedusing the “tobit” model. Two fit measures, namely R2
ANOVA and R2DECOMPOSITION, are
JPIF25,2
118

generated using the full sample of observations. The first fit measure takes thevariance of the estimated conditional mean divided by the variance of the observedvariable. The second measure takes the variance of the conditional mean functionaround the overall mean of the data in the numerator, whilst the denominator containsthe sum of the numerator and a residual variance, the true value minus the conditionalmean function (Greene, 2002)[6].
IV. Description of survey sampleMall visitors and cinema patrons were randomly intercepted while they were inside theshopping centers and invited to participate in the survey. To insure that the surveyresults are not concentrated on specific group of shoppers based on the timing of theirvisits, the interviews were spread out over different days of the week. In total, 1,283shoppers obliged to our request to be interviewed. The survey sample is composed of42 percent of interviews conducted over the weekends and 58 percent duringweekdays. The gender of the respondents is also equally distributed with 46 percent ofthe respondents being males and 54 percent females. The mall and age distributions ofthe interviewees are presented in Figures 2 and 3. Approximately 25 percent of therespondents were below 20 years of age. The majority (61 percent) fall between the20-40 years old age group. Respondents above 40 years old constitute another 14percent of the survey sample.
On the whole, Singaporeans tend to visit shopping center more often – all theinterviewees said they visit a shopping center at least once a month. In comparison,
Figure 2.Distribution of surveyrespondents by malls
Figure 3.Profile of survey
respondents by age
Do size andCineplex matter?
119

75 percent of Americans go to a mall at least once a month (Bloch et al., 1994). Figure 4shows that 63 percent of the respondents visit a shopping center at least once a week,whilst another 21 percent visit a shopping center once a fortnight. With respect to themode of transport, the majority of those interviewed (63 percent) took public transport tovisit the shopping centre. A total of 17 percent walk to the shopping center, while theremaining 20 percent relied on private transport. Further analysis on the travel time forvarious modes of transport reveals that the average travel time is 11.6, 20.1 and 28.4minutes for those who walk, take their own vehicle and take public transportation,respectively.
Consistent with the literature which suggests that most shopping trips aremultipurpose (Hanson, 1980; O’Kelly, 1981), most of the respondents indicated morethan one activity for making a trip to a shopping center. The three most popularactivities are spending time with family and friends (57.7 percent), patronizing theshops (52.7 percent) and having meals (46.0 percent). Table II tabulates the mainreasons given for visiting suburban shopping centers. Overall, the results indicate thatthe suburban malls are more than a place to shop and leisure activities are equallyprominent in the visitors’ agenda of activities to do in a shopping center. One in four ofthose surveyed indicate that they were at the shopping center to catch a movie, whilstanother 20.4 percent were at the shopping center to use ancillary services such as usingtoilet, banking, postal and library facilities provided within the shopping center. As afurther indication of the social role of the suburban shopping center in providingleisure and complementary facilities for the community, 88 percent of those surveyedindicate that they are normally accompanied by their friends and family or relatives
Reasons % of responses
1. Walk around 57.72. Shopping 52.73. Eating 46.04. Watching movie 25.25. Ancillary services 20.4
Source: Authors’ survey
Table II.Main reasons for visitinga suburban shoppingcenter
Figure 4.Frequency of visits toshopping centers
JPIF25,2
120

when visiting suburban shopping centers. Shopping centers serve as an importantsocializing and meeting place with family and friends.
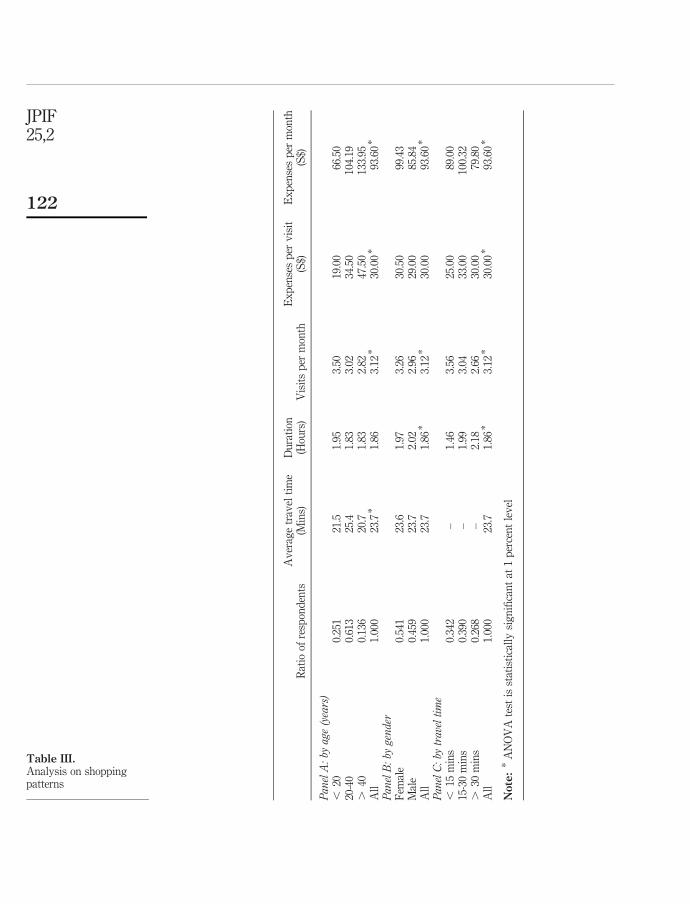
Table III shows the visiting and shopping patterns of those interviewed,sub-categorized by their age, gender and time taken to reach the shopping center.Those in the 20-40 age groups took the longest time to travel to the shopping center.74.8 percent of the respondents take less than 30 minutes. They are likely to be thosewho stay in close proximity to the shopping center and therefore, fall within the localretail market boundary of the individual shopping centers. The 25.2 percent whotraveled more than 30 minutes to reach the suburban shopping centers be can bedefined as “outshoppers”[7].
On average, the respondents spend S$30 on each visit with the actual amountvarying significantly across different age group. More specifically, the average amountspent ranges from S$66.50 for those below 20 years old to S$134 a month for thoseabove 40 years old. The result is not surprising since those in the younger age grouptend to have less to spend than those in the older age group. However, the data showthat teens visit the shopping centers more regularly and they stay longer during eachvisit. In the past, heavy teen traffic and the many hours spent by teens at shoppingcenters were viewed unfavorably by the shopping center managers as“inconveniences” that can negatively impact security and operations. However, withthe teen population on the rise, retailers have recently seen the benefit to targeting teenshoppers and their large discretionary spending power. In a recent study, Mangleburget al. (2004) observe that teens who shop with friends (as opposed to shopping alone)are likely to shop more often. They also spend relatively more when shopping withfriends than when alone.
The average shopper stays in the suburban shopping centers for around 1.86hours[8]. Table III shows that male patrons tend to stay longer than female patrons inthe suburban shopping centers[9]. The differences in the means between the groups arestatistically significant. This is a surprising result, which we will come back to laterwhen we discuss the regression results. However, women shoppers tend to visit theshopping center more frequently and spent more on each visit. On average, they spentjust below S$100 a month while the male shoppers spent around S$86 a month insuburban shopping malls.
It would not be unreasonable to expect suburban malls to attract the patronage ofmore local shoppers and at higher frequency. Panel C of Table III reveals the durationand frequency of visit as well as the average expenditure of patrons categorized bytheir travel time. Those who stayed closest to the suburban shopping centers notsurprisingly visited the mall more frequently but they also do not stay too long norspend a lot during their visit. Those who stayed furthest from the mall, on the otherhand, do not visit the shopping center as frequently but they do stay longer in the mallin each visit. However, their expenditure of S$80 a month is below average.
V. The size effectTable IV presents the magnetism of the nine shopping centers based on the feedback of1,283 shoppers on how long they take to travel to shopping center and the duration oftheir visit. Overall, the survey results are consistent with the hypothesis that largersuburban shopping centers are able to attract a higher percentage of “outshoppers”who take a longer time to travel to the shopping centers. For example, approximately
Do size andCineplex matter?
121
Av
erag
etr
avel
tim
eD
ura
tion
Ex
pen
ses
per
vis
itE
xp
ense
sp
erm
onth
Rat
ioof
resp
ond
ents
(Min
s)(H
ours
)V
isit
sp
erm
onth
(S$)
(S$)
PanelA:by
age
(years)
,20
0.25
121
.51.
953.
5019
.00
66.5
020
-40
0.61
325
.41.
833.
0234
.50
104.
19.
400.
136
20.7
1.83
2.82
47.5
013
3.95
All
1.00
023
.7*
1.86
3.12
*30
.00
*93
.60
*
PanelB:by
gender
Fem
ale
0.54
123
.61.
973.
2630
.50
99.4
3M
ale
0.45
923
.72.
022.
9629
.00
85.8
4A
ll1.
000
23.7
1.86
*3.
12*
30.0
093
.60
*
PanelC:by
traveltime
,15
min
s0.
342
–1.
463.
5625
.00
89.0
015
-30
min
s0.
390
–1.
993.
0433
.00
100.
32.
30m
ins
0.26
8–
2.18
2.66
30.0
079
.80
All
1.00
023
.71.
86*
3.12
*30
.00
*93
.60
*
Note:
*A
NO
VA
test
isst
atis
tica
lly
sig
nifi
can
tat
1p
erce
nt
lev
el
Table III.Analysis on shoppingpatterns
JPIF25,2
122

Tra
vel
tim
eto
mal
l(%
ofsh
opp
ers)
Av
erag
etr
avel
tim
eD
ura
tion
ofv
isit
Su
bu
rban
mal
l,
15m
ins
15-3
0m
ins
.30
min
s(M
ins)
(Hou
rs)
Tam
pin
esM
all
and
Cen
tury
Sq
uar
e0.
335
0.38
00.
284
24.4
2.0
Cau
sew
ayP
oin
t0.
319
0.38
90.
293
24.5
2.1
Juro
ng
Poi
nt
0.34
00.
404
0.25
625
.02.
0C
omp
ass
Poi
nt
0.29
40.
441
0.26
524
.41.
7Ju
nct
ion
80.
323
0.37
10.
305
24.5
1.9
Lot
On
eM
all
0.35
80.
394
0.24
822
.71.
7W
est
Mal
l0.
405
0.45
60.
139
19.1
1.4
Su
nP
laza
0.49
30.
282
0.22
520
.41.
6A
ll0.
358
0.39
00.
252
23.7
*1.
9*
Note:
*A
NO
VA
test
isst
atis
tica
lly
sig
nifi
can
tat
1p
erce
nt
lev
el
Table IV.Magnetism of suburban
malls
Do size andCineplex matter?
123

30 percent of the shoppers in Causeway Point, Junction 8 and Tampines Malls travelmore than 30 minutes to visit the shopping centers. Conversely, only less than 14percent of the shoppers in West Mall traveled more than 30 minutes to reach theshopping center. The same conclusion applies when we examine the travel time ofshoppers visiting the shopping center. Results of the analysis of variance (ANOVA)test show that the differences in the travel time between the different shopping centersare statistically significant at 1 percent level. While the whole sample took 23.7minutes, on average, to reach their destination, the average travel time for the smallershopping centers is significantly lower. While one may argue that travel time could belinked to accessibility, it should be noted that all the shopping centers are located nextto a mass transit station and within walking distance to a major bus interchange. Alsoconsistent with the notion of smaller shopping centers attracting mainly localshoppers, around 38 percent of the respondents state that they walked to Sun Plaza,which is the smallest suburban shopping center in our sample. In contrast, only 14-15percent of the respondents indicated that they walked to the four largest sampledshopping centers.
The last column in Table IV presents the duration of visit for the average shopper ineach of the respective shopping centers. The survey results show clearly that largershopping centers can retain shoppers for a longer duration. For example, the averagevisiting time for large shopping centers is around 2 hours. On the other hand, shoppersonly spent 1.4 to 1.6 hours in West Mall and Sun Plaza, the two smallest shoppingcenters in our sample. Physical size, however, does not appear to have any significantinfluence on the frequency of visit, which averaged 3.12 times a month for our wholesample. The results are consistent even after controlling for the gender and age of therespondents.
In the survey, we also asked the respondents which shopping mall they patronizedfrequently and the main reason/s for their choice. The results in Table V show thatshoppers are less concern with the cost and ease of finding a parking lot in theshopping center. The branding of suburban shopping center in terms of its prestigeand exclusivity is also not important. Convenient location, which is not surprising, hadthe largest influence on suburban shopping center choices (64.2 percent). Consistent
Determining factors % of responses
Spatial factors1. Proximity 64.22. Mall size 26.53. Car park 8.6Tenant mix1. Variety of tenants 62.72. Complementary services 30.93. Cineplex 29.3Branding strategy1. Management and promotions 32.82. Reasonable prices 23.93. Quality and prestige 14.1
Source: Authors’ survey
Table V.Determinants of mallchoice
JPIF25,2
124

with the literature, the survey shows that whilst convenience is critical to the success ofa suburban shopping center, the non-spatial factors also play an equally importantrole. Having a good tenant mix and a wide selection of shops strongly affects thepopularity of a shopping center. Good management and promotions (32.8 percent),having a wide range of complementary services such as banking, library and foodcourt (30.9 percent) and a Cineplex (29.3 percent) are also cited by around one-third ofthose interviewed.
Only one in four respondents indicated that the size of a shopping center is animportant factor in determining their choice of shopping center to patronize. Althoughit is ranked 6th in importance, physical size is a key contributing factor to manydesired characteristics of a shopping mall. In particular, a small-sized shopping centermay not have enough space to facilitate a wide variety of tenants as well ascomplementary services expected by shoppers. Even if smaller shopping centers try tosqueeze in more tenants, this will be at the expense of making the centers feelingcramped and congested. A large-sized shopping center, on the other hand, is lessconstrained by space availability to accommodate more tenants to achieve the optimalretail mix and right concept to attract and retain high traffic. An added advantage ofbeing large is the ability to provide wider atriums and circulation networks within theshopping center. These spaces provide a pleasant environment for shoppers, facilitatetheir social interaction and mingling, as well as provide a venue where promotionalevents can be held to draw in more visitors.
In summary, the survey results support our hypothesis that physical size has apositive impact on the magnetism of a suburban shopping center. Larger shoppingcenters have a greater ability to firstly, attract those staying outside its captive marketto visit it and secondly, hold the visitors longer within the shopping center.
VI. The Cineplex effectThe average respondent in our survey watches one movie a month (see Figure 5). Only8 percent indicate that they rarely or do not watch movie in the cinema. The majoritywatches at least one movie in three months (57 percent). Interestingly, 35 percent of therespondents acknowledged that they are avid movie goers who watch at least onemovie every fortnight.
Cineplex, like other anchor tenants, serves as an attraction for a suburban shoppingcenter. This notion is supported in our survey with 72.4 percent of the respondents
Figure 5.Frequency of watching
movie
Do size andCineplex matter?
125
indicating that the presence of a Cineplex would entice them to visit the shoppingcenter more often. With respect to the choice of cinema, 65.5 percent of the respondentsalso indicate that it is important for the cinema to be located close to complementaryamenities. More specifically, 71 percent of the respondents also said they prefer towatch movie in a Cineplex housed within a shopping center. In contrast, only 4 percentindicate that they prefer to watch movie in standalone cinema, whilst the balance 25percent do not have any preference. Table V also shows earlier that the presence of aCineplex, which was ranked 5th in order of importance, is a primary consideration inthe choice of shopping center to visit. Figure 4 also shows that one in four respondentscite watching movie as one of the main reasons for visiting shopping centers.
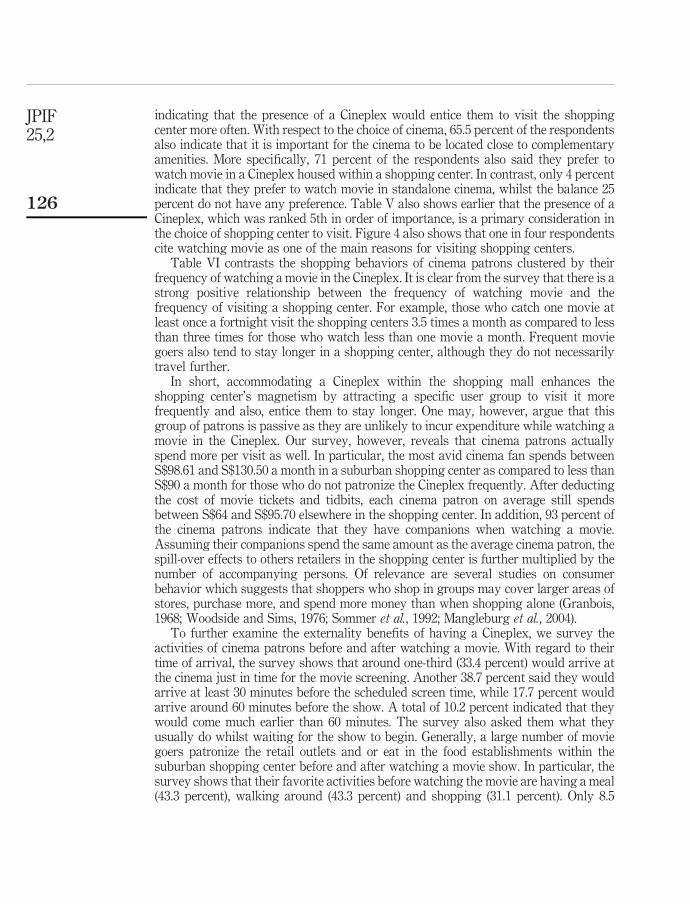
Table VI contrasts the shopping behaviors of cinema patrons clustered by theirfrequency of watching a movie in the Cineplex. It is clear from the survey that there is astrong positive relationship between the frequency of watching movie and thefrequency of visiting a shopping center. For example, those who catch one movie atleast once a fortnight visit the shopping centers 3.5 times a month as compared to lessthan three times for those who watch less than one movie a month. Frequent moviegoers also tend to stay longer in a shopping center, although they do not necessarilytravel further.
In short, accommodating a Cineplex within the shopping mall enhances theshopping center’s magnetism by attracting a specific user group to visit it morefrequently and also, entice them to stay longer. One may, however, argue that thisgroup of patrons is passive as they are unlikely to incur expenditure while watching amovie in the Cineplex. Our survey, however, reveals that cinema patrons actuallyspend more per visit as well. In particular, the most avid cinema fan spends betweenS$98.61 and S$130.50 a month in a suburban shopping center as compared to less thanS$90 a month for those who do not patronize the Cineplex frequently. After deductingthe cost of movie tickets and tidbits, each cinema patron on average still spendsbetween S$64 and S$95.70 elsewhere in the shopping center. In addition, 93 percent ofthe cinema patrons indicate that they have companions when watching a movie.Assuming their companions spend the same amount as the average cinema patron, thespill-over effects to others retailers in the shopping center is further multiplied by thenumber of accompanying persons. Of relevance are several studies on consumerbehavior which suggests that shoppers who shop in groups may cover larger areas ofstores, purchase more, and spend more money than when shopping alone (Granbois,1968; Woodside and Sims, 1976; Sommer et al., 1992; Mangleburg et al., 2004).
To further examine the externality benefits of having a Cineplex, we survey theactivities of cinema patrons before and after watching a movie. With regard to theirtime of arrival, the survey shows that around one-third (33.4 percent) would arrive atthe cinema just in time for the movie screening. Another 38.7 percent said they wouldarrive at least 30 minutes before the scheduled screen time, while 17.7 percent wouldarrive around 60 minutes before the show. A total of 10.2 percent indicated that theywould come much earlier than 60 minutes. The survey also asked them what theyusually do whilst waiting for the show to begin. Generally, a large number of moviegoers patronize the retail outlets and or eat in the food establishments within thesuburban shopping center before and after watching a movie show. In particular, thesurvey shows that their favorite activities before watching the movie are having a meal(43.3 percent), walking around (43.3 percent) and shopping (31.1 percent). Only 8.5
JPIF25,2
126
Av
erag
etr
avel
Du
rati
onE
xp
ense
sE
xp
ense
s
Fre
qu
ency
ofw
atch
ing
mov
ieR
atio
ofre
spon
den
tsti
me
(Min
s)of
vis
it(H
ours
)N
oof
vis
its/
mon
thp
erv
isit
(S$)
per
mon
th(S
$)
On
ea
wee
k0.
085
20.8
52.
023.
4837
.50
130.
50O
ne
afo
rtn
igh
t0.
260
24.3
62.
053.
4628
.50
98.6
1O
ne
am
onth
0.26
723
.43
1.87
3.24
27.0
087
.48
On
ein
2-3
mon
ths
0.30
624
.36
1.73
2.74
30.5
083
.57
Rar
ely
0.08
323
.28
1.57
2.50
36.0
090
.00
All
1.00
023
.71.
86*
3.12
*30
.00
**
93.6
0*
Notes:
* ,*
*A
NO
VA
test
isst
atis
tica
lly
sig
nifi
can
tat
1p
erce
nt
and
5p
erce
nt
lev
el,
resp
ecti
vel
y
Table VI.Analysis on shopping
patterns of cinemapatrons
Do size andCineplex matter?
127
percent indicate that they would wait at the cinema. The percentages, based on thecategorization by Nelson (1958) and Eppli and Shilling (1993), indicate highcompatibility of a Cineplex with food court and other stores in the suburban shoppingcenter. After the movie, 23 percent indicate that they would go back immediately. Theothers will walk around (39.7 percent), have meals (35.6 percent) and shop (22.8percent) within the shopping center.
VII. Analysis of simultaneous regressionsSo far, we have examined the magnetism of the suburban shopping centers based onthe survey results. We focused primarily on how physical size and the presence of aCineplex enhance the drawing power and retaining power of the shopping centers. Inthis part of the study, we extend our study to examine their effect on the dollar amountspent within the suburban shopping centers. We employed a Tobit model embedded ina recursive simultaneous equations model to test the isolating effects of physical sizeand the presence of a Cineplex. The specification of the regression models arepresented earlier in Section III.
The definitions and pair-wise correlations of the variables used to test therelationships are provided in Table VII, which reveals several interesting relationships.Specific to our study focus, the expenditure amount spent per visit is influenced largelyby the characteristics of the visitors rather than the motive of their visit to theshopping center. While the physical size of a shopping center has a positive influenceon how long a patron would stay in the shopping center, the strongest determinant ofstay duration is movie watching. The matrix shows that avid movie goers, notsurprisingly, tend to be young and single but they usually watch movies with friends.
The estimation results of equations (1) and (2) are presented in Table VIII. Model 1,which is presented mainly for comparison purpose, is based on a Tobit regression of asingle equation on amount spent per visit (equation (1)). Model 2, which is our focus, isa two-equation model that controls for the simultaneity of duration of visit and theamount spent in the shopping center. The magnitude of the R2
ANOVA andR2
DECOMPOSITION indicates that around 14.7 per cent of the variations in the patron’sexpenditure are explained by the variables in our model. In addition, the diagnostic LMstatistic for Cragg’s model shows that the censoring is the appropriate specification forthe expenditure model. A simple t-test analysis confirms the exogeneity of y2, namelythe time spent by patrons in a shopping center, in Regression 1 of Model 2.
Results of Model 1 show that expenditure amount of shopping center patrons isdetermined primarily by their age, which is highly correlated to their income level.Not surprisingly, those who indicated that their main purpose of visit is shoppingtend to spend more. In addition, patrons who stay longer in a shopping center alsospend more. While the size of the shopping mall and watching movie per se do notsignificantly increase the expenditure pattern of the patrons, the results suggestthat those who watch movie frequently tend to spend more in shopping centers aswell.
The estimation results of Model 2 provide more insight into the dynamics of howphysical size and the presence of a Cineplex affect the performance of the shoppingcenters. The first regression shows that once the simultaneity of visit duration istaken into account, mall size and watching movie actually have negative marginaleffects on expenditure. However, interpretation of the results is not as
JPIF25,2
128

ST
IME
TT
IME
SIZ
EM
OV
IES
HO
PM
AL
EA
GE
FR
EQ
M-F
AN
CO
MW
-EN
D
EX
P0.
136
0.06
02
0.02
30.
017
0.08
62
0.04
00.
313
0.14
82
0.00
70.
025
0.08
9S
TIM
E1.
000
0.18
70.
116
0.27
90.
030
20.
088
20.
064
0.10
60.
122
0.09
90.
054
TT
IME
1.00
00.
062
20.
011
20.
005
0.00
22
0.03
90.
304
20.
026
0.05
92
0.04
7S
IZE
1.00
00.
107
0.01
62
0.09
22
0.08
80.
048
0.05
00.
040
20.
094
MO
VIE
1.00
00.
082
0.03
72
0.17
10.
019
0.20
60.
119
0.07
8S
HO
P1.
000
20.
094
0.03
62
0.01
10.
020
0.02
90.
049
MA
LE
1.00
00.
037
0.06
00.
037
20.
014
0.03
2A
GE
1.00
00.
080
20.
360
20.
125
0.05
1F
RE
Q1.
000
20.
097
0.06
30.
085
M-F
AN
1.00
00.
138
20.
035
CO
M1.
000
0.01
9
Note:
Cor
rela
tion
coef
fici
ents
for
the
pai
r-w
ise
rela
tion
ship
sar
eco
mp
ute
db
ased
ona
fin
alsa
mp
leof
1,21
4ob
serv
atio
ns.
Defi
nit
ion
sof
the
var
iab
les
are
asfo
llow
s:E
xp
end
itu
rep
erv
isit
(EX
P),
du
rati
onof
vis
it(S
TIM
E),
trav
elti
me
tosh
opp
ing
cen
ter
(TT
IME
),si
zeof
shop
pin
gce
nte
r(S
IZE
),m
ain
pu
rpos
eof
vis
itis
toca
tch
am
ovie
(MO
VIE
),m
ain
pu
rpos
eof
vis
itis
shop
pin
g(S
HO
P),
sex
ofre
spon
den
t(M
AL
E),
age
ofre
spon
den
t(A
GE
),fr
equ
ency
ofm
all
vis
it(F
RE
Q),
freq
uen
cyof
wat
chin
gm
ovie
(M-F
AN
)an
dw
het
her
resp
ond
ent
isal
one
orw
ith
com
pan
ion
/s(C
OM
)
Table VII.Correlation matrix
Do size andCineplex matter?
129

straightforward because both factors have a positive and significant influence inthe second regression. Duration of visit in turn has a positive and significant effecton expenditure in the first regression. Overall, the results show that having a largershopping center and Cineplex induce shoppers to stay longer but their marginaleffect on expenditure pattern is at best indirect. Regression 2 further reveals thatpatrons tend to stay longer during the weekends and when they are withcompanions (either family members or friends). In contrast to our earlierobservation in Table III, the estimation results indicate that male patrons tend to
Coefficient T-ratio p-value
Model 1: single equation Tobit modelLM test [df] for Tobit ¼ 2:683 [9]R2
ANOVA ¼ 0:1468; R2DECOMPOSITION ¼ 0:1469
Dependent Variable ¼ ExpenditureConstant 1.0785 9.58 0.0000Size (net lettable ’000 m2) 20.0011 20.67 0.5058Watching movie 0.0367 0.78 0.4381Shopping 0.0921 2.39 0.0170Male respondent 20.0352 20.90 0.3659Age of respondent 0.2508 13.10 0.0000Movie fan 0.0691 3.67 0.0002Companion 0.0435 0.68 0.4947Stay time 0.0842 5.22 0.0000
Model 2: simultaneous equations Tobit modelLM test [df] for Tobit ¼ 24; 151:326 [9]T-test of the hypothesis that r½11; 12� is0 ¼ 23:454 * * *
Regression 1: dependent variable ¼ expenditureConstant 0.1024 0.32 0.7518Size (net lettable ’000 m2) 20.0035 21.72 0.0861Watching movie 20.2483 22.52 0.0118Shopping 0.0932 2.27 0.0231Male respondent 0.0474 0.88 0.3781Age of respondent 0.2489 13.13 0.0000Movie fan 0.0705 3.71 0.0002Companion 20.0404 20.55 0.5801Stay time 0.4325 4.14 0.0000
Regression 2: dependent variable ¼ stay timeConstant 2.3423 15.70 0.0000Size (net lettable ’000 m2) 0.0077 2.71 0.0067Watching movie 0.7679 9.27 0.0000Male respondent 20.2718 24.00 0.0001Regular mall patrons 0.1757 2.86 0.0042Travel time 0.1608 5.41 0.0000Weekend 0.1694 2.85 0.0043Companion 0.2023 2.05 0.0403
Notes: Number of observations is 1,214. The first model is based on a Tobit regression of a singleequation (equation (1)), while the second model is based on two equations to control for thesimultaneity of duration of visit and the amount spent in the shopping center. The results of Model 1are presented for comparison purposes only
Table VIII.Regression results
JPIF25,2
130

spend less time in a suburban shopping center than female patrons after taking intoaccount the confounding effects of other variables. Furthermore, those who took alonger time to reach a shopping center tend to spend more time in the mall.
Although the correlation matrix suggests that Watching movie is only slightlycorrelated with Movie fan (0.20), we repeated the recursive estimation bywithdrawing Movie fan from equation (1) to check if there may be somemulticollinearity between the two variables, thereby causing the sign of theWatching movie in equation (1) to be negative. The estimation results, not reported,show that our earlier findings are robust to the exclusion of the Movie fan variableand hence, not affected by multicollinearity between the two variables. The resultsare also robust when we substitute the age of respondents with either their maritalstatus or their income level.
VIII. Summary and conclusionsTwo common problems faced by developers, owners and managers of shoppingcenters located outside the traditional primary shopping area are addressed in thispaper: First, does size matters in the success of a suburban shopping center, andsecond, what is the impact of accommodating a Cineplex within a suburbanshopping center. A survey on 1,283 shoppers was carried out in nine selectedsuburban shopping centers in Singapore. The results indicate that physical size andthe presence of a Cineplex do enhance the magnetism of suburban shopping centers.Both factors enhance their ability to attract “outshoppers” and to make the visitorsstay longer in the shopping center. Although mall size, in itself, may not be rankedvery highly by shoppers when determining shopping center choices, a largeshopping center can facilitate a greater variety of shops and a more pleasantenvironment to lure shoppers and make them stay longer. The survey further showsthat cinema patrons prefer to watch movies in Cineplex located in shopping centersand that they generally stay longer in the shopping center as compared to non moviegoers. The presence of a Cineplex also has spill-over benefits for other stores withinthe shopping center. Moreover, having a Cineplex in the suburban shopping centerfulfills its secondary role of providing a lifestyle and recreational facilities for thelocal community. Although the regression results show that Cineplex and physicalsize does not increase the S$ amount spent in the shopping center, the two factorsindirectly affect how long patrons will stay in the shopping center, which in turn ispositively related to expenditure level.
This paper contributes to the literature by drawing attention to the magnetism ofsuburban shopping centers. As the trend move towards locating shopping mallsoutside the prime shopping areas, enticing prospective shoppers to visit theseshopping centers becomes a critical survival issue for the owners. Hence, anunderstanding of the magnetism or drawing power of shopping centers is importantto enhance the malls’ performance. The study also provides a richer understandingof the shopping behavior and patronage of cinema patrons. Further insights herewould allow the developers and retailers to reach out and market to this segmentmore effectively. It remains for us to acknowledge that while the conclusions areinteresting, the high-density urban fabric of Singapore, and eventually, theshopping and leisure culture that prevails on the island may partly explain thestudy findings. In particular, it has been noted that Singaporeans as a whole tend to
Do size andCineplex matter?
131
frequent shopping center more often that the Americans. Furthermore, there may bea scale effect since Singapore is a small island linked with a comprehensive publictransportation system, as compared to say America and UK where the suburbs arefurther from one another. The question remains whether, and to what extent, theconclusions derived from this study can be extended to other contexts. Forcomparison purpose, it would be interesting if similar surveys and studies could becarried out in other markets.
Notes
1. Although the term “magnetism” may appear to be similar to “attractiveness”, the formerterminology is adopted in this study to convey the managers’ active pursuit to first, attractshoppers to the malls and then retaining them in the mall for a longer duration.
2. In their review of the literature, Mejia and Benjamin (2002) suggests that understanding theeffect of non-spatial factors is important because: non-spatial factors increase retailerdifferentiation in competitive retail markets; they promote brand identity as retailers developalternative non-store retail formats; and they represent a source of shopping centerintangible value.
3. In most retail leases, the rental include a fixed rent component as well as an overage rentwhich is calculated as a percentage of sales after a certain threshold level. Mejia andBenjamin (2002) underline that understanding the creation of shopping center rents startswith understanding the determinants of retail sales. The use of overage rent in retailleases is seen as a landlord-tenant risk sharing tool (Brueckner, 1993; Lee, 1995; Miceli andSirmans, 1995; Colwell and Munneke, 1998). Pashigian and Gould (1998) and Wheaton(2000) further characterize overage rents as an incentive for landlords to optimize tenantmix.
4. The suburban malls in Singapore are comparatively much smaller than regional malls inthe USA, which have a competitive center size of 888,000 square feet (Eppli and Shilling,1996).
5. Since the space occupied by anchor tenants is generally much larger than other tenants,actual space occupied by non-anchor tenants will be much lower than 133-277 m2.
6. R2ANOVA ¼ ð1=n
Pni¼1ðyi 2 yÞ2Þ=ð1=n
Pni¼1ð yi 2 �yÞ2Þ
¼ ðVar½ predicted conditional mean�Þ=ðVar½dependent variable�Þ and
R2DECOMPOSITION ¼ ð1=n
Pni¼1ðyi 2 �yÞ2Þ=ð1=n
Pni¼1ðyi 2 �yÞ2 þ 1=N
Pni¼1ð yi 2 yiÞ
2Þ
¼ ðVariation of predicted meanÞ=ðVariation of predicted
mean þ Residual variationÞ.
7. This categorization follows from Mejia and Benjamin (2002) who indicate that the retailmarket of a mall is traditionally referred to as the area from which a shopping center draws70 percent-80 percent of its sales.
8. While it is possible that the results may be bias to the extent that those who spend moretime at the mall are more likely to be sample (Roy, 1994), the duration of visit arenevertheless consistent with existing evidence. For example, a survey conducted by theInternational Council of Shopping Centers (ICSC) in 2001 revealed that shoppers wouldusually stay for an average of 73.4 minutes in malls less than 74,322 m2. Source: www/icsc.org/about/about.shtml Erkip (2003) also observes that mall visitors in Turkey tend tostay at most one to two hours.
JPIF25,2
132

9. Otnes and McGrath (2001) is the first study to focus on men’s shopping experiences in anin-depth manner. They demonstrate how actual male shopping behavior belies threecommon stereotypes of male shopping behavior: “Grab and Go,” “Whine and Wait,” and“Fear of Feminine”.
References
Anderson, C.H. and Kamisky, M. (1985), “The outshopper problem: a group approach for smallretailers”, Entrepreneurship Theory and Practice, Vol. 9 No. 3, pp. 34-45.
Biba, G., Des Rosiers, F., Theriault, M. and Villeneuve, P.-Y. (2006), “Big boxes versus traditionalshopping centers: looking at households’ shopping patterns – a Canadian cast study”,Journal of Real Estate Literature, Vol. 14 No. 2, pp. 175-202.
Bloch, P.H., Ridgway, N.M. and Dawson, S.A. (1994), “The shopping mall as consumer habitat”,Journal of Retailing, Vol. 70 No. 1, pp. 23-42.
Brown, M.G. (1999), “Design and value: spatial form and the economic failure of a mall”, Journalof Real Estate Research, Vol. 17 Nos 1/2, pp. 189-226.
Brueckner, J. (1993), “Inter-store externalities and space allocation in shopping centers”, Journalof Real Estate Finance & Economics, Vol. 7 No. 1, pp. 5-16.
Bucklin, L.P. (1971), “Retail gravity models and consumer choice: a theoretical and empiricalcritique”, Economic Georgraphy, Vol. 47 No. 4, pp. 489-97.
Colwell, P.F. and Munneke, H.J. (1998), “Percentage leases and the advantages of regional malls”,Journal of Real Estate Research, Vol. 15 No. 3, pp. 239-52.
Des Rosiers, F., Theriault, M. and Menetrier, L. (2005), “Spatial versus non-spatial determinantsof shopping center rents: modelling location and neighboorhood-related factors”, Journalof Real Estate Research, Vol. 27 No. 3, pp. 293-319.
Eppli, M. and Benjamin, J.D. (1994), “The evolution of shopping center research: a review andanalysis”, Journal of Real Estate Research, Vol. 9 No. 1, pp. 5-32.
Eppli, M. and Shilling, J. (1993), “Retail compatibility in regional shopping centers”, workingpaper, University of Wisconsin-Madison, Madison, WI.
Eppli, M. and Shilling, J. (1996), “How critical is a good location to a regional shopping center?”,Journal of Real Estate Research, Vol. 12 No. 3, pp. 459-68.
Erkip, F. (2003), “The shopping mall as an emergent public space in Turkey”, Environment andPlanning A, Vol. 35, pp. 1073-93.
Forgey, F.A., Goebel, P.R. and Nixon, B. (1995), “Addressing tenant selection to maintainshopping center success”, Economic Development Review, Vol. 13 No. 2, pp. 56-9.
Gatzlaff, D.H., Sirmans, G.S. and Diskin, B.A. (1994), “The effect of anchor tenant loss onshopping center rents”, Journal of Real Estate Research, Vol. 9 No. 1, pp. 99-110.
Gerbich, M. (1998), “Shopping center rentals: an empirical analysis of the retail tenant mix”,Journal of Real Estate Research, Vol. 15 No. 3, pp. 283-96.
Granbois, D.H. (1968), “Improving the study of customer in-store behavior”, Journal ofMarketing, Vol. 32 No. 4, pp. 28-32.
Greene, W.H. (2002), LIMDEP Version 8.0 Econometric Modeling Guide, Vol. 2, EconometricSoftware, New York, NY.
Hanson, S. (1980), “Spatial diversification and multipurpose travel: implications for choicetheory”, Geographical Analysis, Vol. 12 No. 3, pp. 245-57.
Hardin, W.G. III and Wolverton, M.L. (2000), “Micro-market determinants of neighborhood centerrental rates”, Journal of Real Estate Research, Vol. 20 No. 3, pp. 299-322.
Do size andCineplex matter?
133

Hotelling, H. (1929), “Stability in competition”, Economic Journal, Vol. 39, pp. 41-57.
Housing and Development Board (2004), HDB Annual Report 2003/04, Housing andDevelopment Board, Singapore, p. 85.
Huff, D.L. (1964), “Defining and estimating a trade area”, Journal of Marketing, Vol. 28 No. 3,pp. 29-37.
Ibrahim, M.F. and Ng, C.W. (2002), “Determinants of entertaining shopping experiences and theirlink to consumer behavior: case studies of shopping centers in Singapore”, Journal ofLeisure Property, Vol. 2 No. 4, pp. 338-57.
Ingene, C.A. and Ghosh, A. (1990), “Consumer and producer behavior in a multipurpose shoppingenvironment”, Geographical Analysis, Vol. 22, January, pp. 70-91.
Kirkup, M. and Rafiq, M. (1994), “Managing tenant mix in shopping centres”, InternationalJournal of Retail & Distribution Management, Vol. 22 No. 6, pp. 29-37.
Konishi, H. and Sandfort, M.T. (2003), “Anchor stores”, Journal of Urban Economics, Vol. 53,pp. 413-35.
Lee, K. (1995), “Optimal retail lease contracts”, Regional Science and Urban Economics, Vol. 25No. 6, pp. 727-38.
Lillis, C.M. and Hawkins, D.I. (1974), “Retail expenditure flows in continuous trade areas”,Journal of Retailing, Vol. 50 No. 2, pp. 31-42.
Mangleburg, T.F., Doney, P.M. and Bristol, T. (2004), “Shopping with friends and teens’susceptibility to peer influence”, Journal of Retailing, Vol. 80 No. 2, pp. 101-16.
Mejia, L.C. and Benjamin, J.D. (2002), “What do we know about the determinants of shoppingcenter sales? Spatial vs non-spatial factors”, Journal of Real Estate Literature, Vol. 10 No. 1,pp. 3-26.
Merrill Lynch (2005), “Inititation on S-REITs”, Commetn, January 24, p. 9.
Miceli, T.J. and Sirmans, C.F. (1995), “Contracting with spatial externalities and agencyproblems: the case of retail leases”, Regional Science and Urban Economics, Vol. 25 No. 3,pp. 355-72.
Miceli, T.J., Sirmans, C.F. and Stake, D. (1998), “Optimal competition and allocation of space inshopping centers”, Journal of Real Estate Research, Vol. 16 No. 1, pp. 113-26.
Nelson, R.L. (1958), The Selection of Retail Locations, Dodge, New York, NY.
Nevin, J.R. and Houston, M.J. (1980), “Image as a component of attraction to intraurban shoppingareas”, Journal of Retailing, Vol. 56 No. 1, pp. 77-93.
O’Kelly, M.E. (1981), “A model of the demand for retail facilities, incorporating multistop,multipurpose trips”, Geographical Analysis, Vol. 13 No. 2, pp. 134-48.
Otnes, C. and McGrath, M.A. (2001), “Perception and realities of male shopping behavior”,Journal of Retailing, Vol. 77, pp. 111-37.
Ownbey, K.L., Davis, K. and Sundel, H.H. (1994), “The effect of location variables on the grossrents of neighborhood shopping centers”, Journal of Real Estate Research, Vol. 9 No. 1,pp. 111-23.
Pashigian, B.P. and Gould, E.G. (1998), “Internalizing externalities: the pricing of space inshopping malls”, Journal of Law and Economics, Vol. 108, pp. 843-67.
Reilly, W.J. (1931), The Laws of Retail Gravitation, Knickerbocker Press, New York, NY.
Roulac, S.E. (1994), “Retail real estate in the 21st century: information technology þ timeconsciousness þ unintelligent stores ¼ intelligent shopping? Not!”, Journal of Real EstateResearch, Vol. 9 No. 1, pp. 125-50.
JPIF25,2
134

Roy, A. (1994), “Correlates of mall visit frequency”, Journal of Retailing, Vol. 70 No. 2, pp. 139-61.
Russel, V. (1957), “The relationship between income and retail sales in local areas”, Journal ofMarketing, Vol. 21 No. 3, pp. 329-32.
Severin, V., Louviere, J.J. and Finn, A. (2001), “The stability of retail shopping choices over timeand across countries”, Journal of Retailing, Vol. 77 No. 2, pp. 185-202.
Simmons, R.A. (1992), “Site attributes in retail leasing: an analysis of a fast-food restaurantmarket”, The Appraisal Journal, Vol. 60 No. 4, pp. 521-31.
Sirmans, C.F. and Guidry, K.A. (1993), “The determinants of shopping center rents”, Journal ofReal Estate Research, Vol. 8, pp. 105-15.
Sommer, R., Waynes, M. and Brinkley, G. (1992), “Social facilitation effects in shoppingbehavior”, Environment and Behavior, Vol. 24 No. 3, pp. 285-97.
Wheaton, W.C. (2000), “Percentage rent in retail leasing: the alignment of landlord-tenantinterests”, Real Estate Economics, Vol. 28 No. 2, pp. 185-204.
Woodside, A.G. and Sims, J.T. (1976), “Retail sales transactions and customer ‘purchase pal’effects on buying behavior”, Journal of Retailing, Vol. 52 No. 3, pp. 57-64, 95.
Corresponding authorJoseph T.L. Ooi can be contacted at: [email protected]
To purchase reprints of this article please e-mail: [email protected] visit our web site for further details: www.emeraldinsight.com/reprints
Do size andCineplex matter?
135