
Nle1 mutants more severe than single Notch mutants or disruption of Notch signaling

The logic of receptor-ligand interactionsin the Notch signaling pathway
Thesis by
Lauren LeBon
In Partial Fulfillment of the Requirements
for the Degree of
Doctor of Philosophy
California Institute of Technology
Pasadena, California
2014
(Defended May 9, 2014)

ii
c© 2014
Lauren LeBon
All Rights Reserved

iii
To Mom, Dad, Lawrence, Katie, and Nick.

iv
Acknowledgments
I must start with thanking my advisor, Michael Elowitz. His sheer enthusiasm and uncanny knack
for finding cool scientific questions have made life in the Labowitz a constant adventure. Michael
gives his team the freedom to follow whatever ideas we find exciting. He then teaches us the skills
and gives us the opportunities to convey our excitement to the scientific community. I have learned
so much from him, and from the excellent group he has put together, about every aspect of the
scientific process.
David Sprinzak has been an outstanding mentor from my very first days on the Notch project.
Every method I’ve used in this thesis, from experiments to modeling, I’ve learned through his patient
guidance. He has taught me to think like scientist, and as a PI, I know he will continue to inspire
many more students in the future.
The entire Elowitz lab has been a source of advice, technical know-how, and inspiration. I owe
a special thanks to the Delta Force, including Amit Lakhanpal, Sandy Nandagopal, Leah Santat,
and Jordi Garcia-Ojalvo, for being great collaborators. Leah, along with Michelle Fontes, Tara Orr,
and James Linton kept the lab up and running. Chiraj Dalal and Long Cai took me on as an
unexperienced rotation student and patiently taught me the basics of molecular biology. Jonathan
Young, Joe Levine, Fred Tan, James Locke, Shaunak Sen, Georg Seelig, Sidney Cox, and Avigdor
Eldar welcomed me into the lab. The lab has grown since, and I found new friends and colleagues in
Yaron Antebi, John Yong, Zakary Singer, Pulin Li, Hao-Yuan Kueh, Emily Capra, Adam Rosenthal,
Lacramoira Bintu, Julia Tischler, Stephanie Culler, Mary Dunlop, Ophelia Venturelli, Pierre Neveu,
Fangyuan Ding, Mark Budde, Joe Markson, Jin Park, Yihan Lin, and Yutao Qi. I am grateful to
have been a part of such a talented, hardworking, and cooperative team.
I’d like to thank Hamed Jafar-Nejad and his postdoc Tom Lee for designing and conducting the
beautiful experiments (in Chapter 4) to test out our crazy cell culture ideas in real live flies, and for
providing careful and insightful comments on this work.
My thesis committee has provided constructive advice for my project, as well as encouragement
for my future endeavors. I thank David Anderson, Lea Goentoro, Bruce Hay, and Gerry Weinmaster
for sharing with me their valuable time and expertise.
I thank the Caltech Computation and Neural Systems Department. Shin Shimojo and Pietro

v
Perona helped me to find my bearings at Caltech. Tanya Owen provided much assistance over the
years. My CNS classmates Ronnie Bryan, Chess Stetson, Sina Tootoonian, Dan Wilhelm, and Peter
Weir helped me through the first year and quals, and have been great friends since.
I send out my love and gratitude to my friends in the Caltech community and beyond who have
been there for me over the years. There are far too many of them to list (I tried), but I am so
grateful for the coffee breaks, camping trips, bike rides, dance parties, and countless other good
times we’ve spent together. I feel lucky to have so many wildly brilliant people in my life.
My parents, Susan and Lawrence, have always fostered my curiosity, even if they weren’t quite
sure where it would lead. Along the way they have given me every opportunity to follow my
inspiration without worrying about the “how.” I realize now what a rare gift this is, and I will
always be grateful. My brother, Lawrence, and my sister, Katie, have always kept my spirits high,
taking the time from their busy lives to send me a funny message or words of encouragement. Thank
you!
One of my heroes, Jacques Monod, once said “It is restlessness, anxiety, dissatisfaction, agony of
mind that nourish science.” Over the years, Nicolas Lacasse has put up with all of this, and much
more, from this young investigator. I am so grateful to have such a patient, gracious and loving
partner by my side. Thank you so much, Nick.

vi
Abstract
The Notch signaling pathway enables neighboring cells to coordinate developmental fates in diverse
processes such as angiogenesis, neuronal differentiation, and immune system development. Although
key components and interactions in the Notch pathway are known, it remains unclear how they work
together to determine a cell’s signaling state, defined as its quantitative ability to send and receive
signals using particular Notch receptors and ligands. Recent work suggests that several aspects of the
system can lead to complex signaling behaviors: First, receptors and ligands interact in two distinct
ways, inhibiting each other in the same cell (in cis) while productively interacting between cells (in
trans) to signal. The ability of a cell to send or receive signals depends strongly on both types of
interactions. Second, mammals have multiple types of receptors and ligands, which interact with
different strengths, and are frequently co-expressed in natural systems. Third, the three mammalian
Fringe proteins can modify receptor-ligand interaction strengths in distinct and ligand-specific ways.
Consequently, cells can exhibit non-intuitive signaling states even with relatively few components.
In order to understand what signaling states occur in natural processes, and what types of
signaling behaviors they enable, this thesis puts forward a quantitative and predictive model of how
the Notch signaling state is determined by the expression levels of receptors, ligands, and Fringe
proteins. To specify the parameters of the model, we constructed a set of cell lines that allow control
of ligand and Fringe expression level, and readout of the resulting Notch activity. We subjected these
cell lines to an assay to quantitatively assess the levels of Notch ligands and receptors on the surface
of individual cells. We further analyzed the dependence of these interactions on the level and type
of Fringe expression. We developed a mathematical modeling framework that uses these data to
predict the signaling states of individual cells from component expression levels. These methods
allow us to reconstitute and analyze a diverse set of Notch signaling configurations from the bottom
up, and provide a comprehensive view of the signaling repertoire of this major signaling pathway.

vii
Contents
Acknowledgments iv
Abstract vi
Preface xi
1 Introduction 1
1.1 The Notch signaling pathway mediates short-range communication . . . . . . . . . . 2
1.2 Notch signal is transmitted through trans-activation . . . . . . . . . . . . . . . . . . 2
1.3 The strength of Notch trans-activation is the key determinant of cellular decision
making . . . . . . . . . . . . . . . . . . . . . . . . . . . . . . . . . . . . . . . . . . . . 5
1.4 A second role for DSL ligands: cis-inhibition . . . . . . . . . . . . . . . . . . . . . . 6
1.5 Integrating cis and trans interactions into a single model of Notch signaling . . . . . 9
1.6 Mutually inhibitory cis interactions enforce exclusive sending or receiving signaling
states . . . . . . . . . . . . . . . . . . . . . . . . . . . . . . . . . . . . . . . . . . . . 11
1.7 Fringe proteins modulate Notch receptor-ligand interactions . . . . . . . . . . . . . . 12
1.8 We can uncover the full repertoire of Notch signaling states through an analysis of
receptor-ligand interactions . . . . . . . . . . . . . . . . . . . . . . . . . . . . . . . . 13
1.9 A guiding example: the dorsoventral boundary in the Drosophila wing imaginal disc 14
1.10 Overview . . . . . . . . . . . . . . . . . . . . . . . . . . . . . . . . . . . . . . . . . . 16
2 Theory and methods for measuring Notch-ligand trans and cis interactions 18
2.1 A simple mathematical model gives a physical interpretation of interaction strengths 18
2.2 Building the Notch pathway from the bottom up . . . . . . . . . . . . . . . . . . . . 20
2.2.1 Engineered cell lines allow control and readout of ligand expression and Notch
activity in individual cells . . . . . . . . . . . . . . . . . . . . . . . . . . . . . 23
2.2.2 Detailed methods for cell line construction . . . . . . . . . . . . . . . . . . . . 24
2.3 Methods to measure and compare ligand-receptor trans interaction strengths . . . . 25
2.3.1 Detailed methods for trans-activation assays . . . . . . . . . . . . . . . . . . 27

viii
2.4 Availability assay to measure and compare ligand-receptor cis-interaction strengths . 27
2.4.1 Validation of availability assay . . . . . . . . . . . . . . . . . . . . . . . . . . 30
2.4.2 Detailed methods for availability assay . . . . . . . . . . . . . . . . . . . . . . 32
2.5 Movie-based dilution assay to measure and compare ligand-receptor cis-interaction
strengths . . . . . . . . . . . . . . . . . . . . . . . . . . . . . . . . . . . . . . . . . . 37
2.5.1 Detailed methods for dilution assay . . . . . . . . . . . . . . . . . . . . . . . 37
2.6 The bottom up approach provides a way to form and test hypotheses about complex
Notch signaling schemes . . . . . . . . . . . . . . . . . . . . . . . . . . . . . . . . . . 38
3 Quantitative measurements of Notch-ligand trans and cis interactions 41
3.1 Dll1 trans-activates Notch1 more strongly than Jag1 . . . . . . . . . . . . . . . . . . 41
3.2 Dll1 cis-inhibits Notch1 more strongly than Jag1 . . . . . . . . . . . . . . . . . . . . 43
3.3 Ligand availability assay reveals mutual cis-inhibition between ligands and receptors 46
3.4 Mammalian Fringes modulate Notch1+Dll1 and Notch+Jag1 cis interactions differently 47
3.5 Lfng enables cells to receive from Dll1 ligands at high cis-Jag1 levels . . . . . . . . . 48
3.6 Summary of key findings . . . . . . . . . . . . . . . . . . . . . . . . . . . . . . . . . . 48
4 Implications for developmental processes 52
4.1 Fringe differentially affects Delta-Notch and Delta-Serrate cis-inhibition phenotypes
in Drosophila wing development . . . . . . . . . . . . . . . . . . . . . . . . . . . . . 52
4.2 The repertoire of Notch signaling states with Notch and Dll1 or Jag1 ligands . . . . 55
4.3 A proposed model for dorsoventral boundary formation in the wing disc . . . . . . . 59
4.4 Exploration of signaling states with multiple pathway components . . . . . . . . . . 60
4.5 Our results could resolve contradictory findings . . . . . . . . . . . . . . . . . . . . . 62
4.6 Future directions . . . . . . . . . . . . . . . . . . . . . . . . . . . . . . . . . . . . . . 63
Bibliography 65
Appendix: Cis interactions between Notch and Delta generate mutually exclusive
signaling states 70

ix
List of Figures
1.1 Notch mutant female . . . . . . . . . . . . . . . . . . . . . . . . . . . . . . . . . . . . 1
1.2 Notch signaling coordinates finely detailed patterning . . . . . . . . . . . . . . . . . . 3
1.3 trans-activation of Notch . . . . . . . . . . . . . . . . . . . . . . . . . . . . . . . . . . 4
1.4 Receptors and ligands in the Notch pathway . . . . . . . . . . . . . . . . . . . . . . . 7
1.5 Investigating how cis and trans activities of DSL ligands combine to affect Notch activity 10
1.6 cis interactions force cells into mutually exclusive signaling states . . . . . . . . . . . 11
1.7 Mammalian developmental systems using multiple Notch components. . . . . . . . . . 15
1.8 Sending and receiving at the dorsoventral boundary of the fly wing . . . . . . . . . . . 16
2.1 Model of single-cell Notch activity with increasing trans-ligand . . . . . . . . . . . . . 21
2.2 Model of single-cell receptor and ligand availability with increasing cis-inhibition strength 22
2.3 Components list for engineering the Notch pathway from the bottom up . . . . . . . . 26
2.4 Methods for measuring trans-activation . . . . . . . . . . . . . . . . . . . . . . . . . . 26
2.5 Calibration of plate-bound ligands . . . . . . . . . . . . . . . . . . . . . . . . . . . . . 28
2.6 Availability assay for measuring cis interactions . . . . . . . . . . . . . . . . . . . . . 29
2.7 Validation of the availability assay . . . . . . . . . . . . . . . . . . . . . . . . . . . . . 32
2.8 Calibration of availability assay reagents . . . . . . . . . . . . . . . . . . . . . . . . . . 33
2.9 Protocol and data analysis pipeline for availability assay . . . . . . . . . . . . . . . . . 36
2.10 Movie protocol to evaluate cis interactions . . . . . . . . . . . . . . . . . . . . . . . . 39
3.1 Known and unknown interactions between Notch1, Dll1, and Jag1 . . . . . . . . . . . 42
3.2 Dll1 is a stronger trans-activator of Notch1 than Jag1 . . . . . . . . . . . . . . . . . . 44
3.3 Dll1 is a stronger cis-inhibitor of Notch1 than Jag1 . . . . . . . . . . . . . . . . . . . 46
3.4 Mammalian Fringe proteins modulate cis interactions . . . . . . . . . . . . . . . . . . 49
3.5 Lfng allows trans-signaling from Dll1 despite high cis-Jag1 levels . . . . . . . . . . . . 50
4.1 Delta and Serrate have distinct cis-inhibition phenotypes in the fly wing . . . . . . . . 54
4.2 Decreasing Fringe activity improves Delta cis-inhibition phenotypes and worsens Ser-
rate cis-inhibition phenotypes . . . . . . . . . . . . . . . . . . . . . . . . . . . . . . . . 56
4.3 Signaling states of the Notch pathway . . . . . . . . . . . . . . . . . . . . . . . . . . . 58

x
4.4 A model for Notch signaling states during dorsal-ventral boundary formation in the
Drosophila wing disc. . . . . . . . . . . . . . . . . . . . . . . . . . . . . . . . . . . . . 61
4.5 Model of a cell with Dll1, Jag1, and Notch1 . . . . . . . . . . . . . . . . . . . . . . . . 62
1 Figure 1: System for analyzing signal integration in the Notch-Delta pathway. . . . . 76
2 Figure 2: Transactivation of Notch occurs in a graded fashion. . . . . . . . . . . . . . 77
3 Figure 3: Cis-trans signal integration by Notch. . . . . . . . . . . . . . . . . . . . . . 78
4 Figure 4: The mutual-inactivation model in multicellular patterning. . . . . . . . . . . 79
Supplementary Table S1: Table of plasmids/constructs . . . . . . . . . . . . . . . . . 83
Supplementary Table S2: Table of cell lines . . . . . . . . . . . . . . . . . . . . . . . . 84
Figure S1: hN1G4esn and hN1 cell lines exhibit similar response. . . . . . . . . . . . . 85
Figure S2: The Gal4esn-UAS transcription factor-promoter interaction shows no coop-
erativity. . . . . . . . . . . . . . . . . . . . . . . . . . . . . . . . . . . . . . . . . . . . 87
Figure S3: TO-Delta-mCherry cells trans-activate as efficiently as OP9-Delta cells. . . 88
Figure S4: Calibration of plate-bound Delta. . . . . . . . . . . . . . . . . . . . . . . . 89
Figure S5: Notch activity responds to trans-activation by cell-bound Delta in a graded
fashion. . . . . . . . . . . . . . . . . . . . . . . . . . . . . . . . . . . . . . . . . . . . . 91
Figure S6: Induction at Dplate=0 is small compared to higher Dplate levels. . . . . . . 92
Figure S7: The hN1 cell line also shows an ultrasensitive response. . . . . . . . . . . . 93
Figure S8: Delta inactivation by Notch is required for sharp responses to cis-Delta at
fixed threshold . . . . . . . . . . . . . . . . . . . . . . . . . . . . . . . . . . . . . . . . 93
Figure S9: Notch cis-inactivates Delta. . . . . . . . . . . . . . . . . . . . . . . . . . . . 95
Figure S10 (previous page): Comparison of the mutual inactivation model to alternative
models of boundary formation. . . . . . . . . . . . . . . . . . . . . . . . . . . . . . . . 97
Figure S11: Steady-state sensitivity of the mutual inactivation switch. . . . . . . . . 98
Figure S12: Negative controls show that Notch signaling is not affected by doxycycline,
and growth rate is not affected by doxycycline and Dplate. . . . . . . . . . . . . . . . 99
Figure S13: Relation of population average data (median over all segmented cells) and
single cell data. . . . . . . . . . . . . . . . . . . . . . . . . . . . . . . . . . . . . . . . . 100
Figure S14: Initial Delta-mCherry levels correlate with turn-on time . . . . . . . . . . 101
Figure S15: Distribution of activated cells at different Dplate shows graded response. . 102
Figure S16: Effect of finite lifetimes and expression delays in the model. . . . . . . . . 103
Figure S17: Lateral inhibition model with mutual inactivation . . . . . . . . . . . . . 104
Supplementary Table S3: Simulation parameters . . . . . . . . . . . . . . . . . . . . . 113

xi
Preface
All animals begin as a single-celled embryo that divides into hundreds or, in the case of humans,
trillions of cells. As this teeming mass expands, the cells must negotiate among themselves to make
a series of decisions, each one crucial for the proper construction of the body. These decisions
begin with the initial establishment of the major axes of the organism and continue, over many
developmental steps and cell divisions later, with the assembly of tissues and organs. All of these
processes are carried out by an astonishingly small set of signaling pathways—families of interacting
molecules that send and receive information from one cell to another, and convert these signals into
lasting changes in gene expression.
Each signaling pathway is highly conserved, meaning that we see analogues of the signaling
molecules in simple organisms like the C. elegans nematode still being used to pattern the vastly more
complex human body. Not only are the signaling molecules themselves conserved, but the specific
ways in which they interact—the circuits that they form—can be traced throughout evolution. But
evolution has also expanded the functional range of each pathway as new challenges arise. For
example, the Notch pathway, the subject of this thesis, has been co-opted to help connect neurons
in the mammalian brain. What are the key features of each signaling pathway that make them so
useful and so versatile? What makes each signaling pathway suitable for a given task?
With these questions in mind, our research group set out to understand and build patterning
circuits using components from the Notch pathway. During the course of this project, we deepened
our understanding of a key feature that enables the Notch pathway to carry out its many roles
during development. In this thesis, I explore how this feature expands the functional repertoire of
the Notch signaling pathway, making it more evident why it is so prevalent and so useful in animal
development.

1
Chapter 1
Introduction
In the April 1917 edition of The American Naturalist, pioneering geneticist Thomas Hunt Morgan
described a bizarre new strain of the fruit fly Drosophila melanogaster called Notch. John Dexter
had first observed the strain in 1913 at his laboratory in Olivet, Michigan, and gave the mutant flies
their name because they displayed deformed, notched wings.
Figure 1.1: Notch mutant female. Image from T.H. Morgan, The Theory of the Gene, 1926 [43].
The Notch mutation showed an unusual pattern of inheritance. Half of the male offspring born
to female Notch mutants died, while the other half survived. Morgan determined that the flies
that died had inherited a mutated copy of the Notch gene, demonstrating its necessity for proper
development [41]. Because the male offspring of a Notch mother died, but females did not, this
implied the gene was linked to the X chromosome. Morgan’s colleague Calvin Bridges confirmed
this prediction in 1916 in their laboratory at Columbia University [43,44].
However, the female offspring were not all normal: half of the female offspring displayed the
notched wing phenotype. Morgan’s group showed that these flies possessed one mutated copy and
one normal copy of the Notch gene [41]. Notch therefore belonged to the class of rare haploinsufficient
genes—so named because half of a functional pair of alleles is insufficient to generate the normal
2
phenotype [23].
Since Morgan’s initial characterization of Notch mutations, the Notch gene has been identified
not only in fruit flies, but also in the genomes of worms, sea urchins, and mammals, including
humans [2, 24]. Notch not only plays a role in building fly wings, but in constructing nearly every
tissue found in every metazoan species.
1.1 The Notch signaling pathway mediates short-range com-
munication
One hundred years after its discovery, we now know that the Notch gene encodes for a receptor that
enables communication between neighboring cells. The Notch receptor resides on a cell’s surface and
listens for signaling molecules, or ligands, produced by other cells. The ligands the Notch receptors
are listening for belong to the class of DSL ligands, abbreviated for Delta, Serrate (in flies, known as
Jagged in vertebrates), and Lag-2 (in C. elegans). When a Notch receptor and a DSL ligand bind, a
signal is generated that ultimately results in changes in the gene expression of the cell. Together, the
Notch receptors, DSL ligands, and related components that enable signaling are called the Notch
signaling pathway, one member of a small set of major signaling pathways that coordinate animal
development [2, 46].
The Notch signaling pathway is unique among the major developmental signaling pathways, in
part because the DSL ligands are not secreted into the extracellular space, where they can diffuse
away and affect cells located many cell diameters away, but are instead anchored to the membrane
of the cell that produced them [34]. Consequently, only cells that come into direct physical contact
can bring the ligand and receptor close enough to bind and transmit a Notch signal. Signaling that
occurs only between adjacent cells is referred to as juxtacrine.
As the primary juxtacrine developmental signaling pathway, Notch is deployed to perform the
fine-detail work of development, such as drawing sharp boundaries between different tissue com-
partments, casting an evenly-spaced checkerboard pattern of gene expression over a field of cells, or
flipping a switch that drives the daughters of a dividing stem cell towards different fates [2,5,23,34].
1.2 Notch signal is transmitted through trans-activation
Communication through Notch begins when a receptor binds to a DSL ligand on a neighboring
cell, as shown in Figure 1.3. The bound Notch receptor undergoes two proteolytic reactions. The
final γ-secretase-dependent reaction cuts the Notch receptor in two, separating the extracellular
domain and intracellular domain [23,31]. The extracellular domain of Notch, still bound to the DSL
ligand, is endocytosed into the signal sending cell and presumably degraded. Meanwhile, the Notch

3
Lateral inhibition Boundary formation Branching morphogenesis
Figure 1.2: Notch signaling coordinates finely detailed patterning. Notch is used in many patterningprocesses that make sharp delineations between neighboring cells. (A) In lateral inhibition pattern-ing, cells send Notch signals to one another, and reception of Notch signal leads to a decrease inthe ability to send signal. Small fluctuations in signaling can destabilize an initially homogenouspopulation of cells to adopt distinct heterogeneous fates, with one cell sending (white cell, below)and the surrounding neighbors receiving (black cells). One example is found in a fly eye, where cellsin an ommatidium inhibit one another from expressing the same type of photoreceptor. (B) Notchis also used to form sharp boundaries between populations of cells. For example, a sharp stripeof Notch signaling separates the developing fly wing into two halves, and also defines the bordersof the veins on the wing. (C) Notch is also used to coordinate the sprouting of new branches infractal-like structures such as blood and lymphatic vessels [4]. Disruption of Notch signaling leadsto over-branching.
intracellular domain (NICD) travels from the membrane to the nucleus, where it interacts with the
CSL-Mastermind complex (RBPj-κ in vertebrates) to initiate transcription of target genes [2, 31].
This signal generation process is called trans-activation.
Notch trans-activation is remarkable because the receptor itself acts as a transcription factor;
that is, the NICD is an essential component of the transcription machinery to activate target genes.
This direct process contrasts with many other signaling pathways, where often an activated receptor
hands off its message to a complex cascade of second messengers before affecting gene expression [46].
For example, in the Wingless (Wnt) signaling pathway, an activated Frizzled receptor affects tran-
scription through the second messenger β-catenin. When the Frizzled receptor binds a Wnt ligand,
the bound complex prevents the constitutive degradation of β-catenin. As β-catenin accumulates,
it can enter the nucleus and affect gene expression [35]. This molecular relay race amplifies or
transforms the signal, before it has a chance to act on the genome.
It seems, then, that Notch has traded the capability to compute on its signal in exchange for fast
and faithful reporting on what is being heard at the cell surface.

4
Notch1
Dll1
Signal sending cell
NICD
Signal receiving cell Target gene
CSL
Mam
λ-secretaseADAM10/
TACE
Figure 1.3: trans-activation of Notch. When a DSL ligand (here, Dll1) and Notch receptor (here,Notch1) bind, endocytosis of the ligands into the neighboring cell exposes the cleavage site of thereceptor. Two proteolytic reactions at this site (S2 proteolysis, carried out by ADAM12 or TACEand S3 cleavage, carried out by γ-secretase) cut the Notch receptor in two. The intracellular domainof Notch (NICD) travels to the nucleus where it interacts with the CSL-Mastermind (CSL and Mam)complex to initiate transcription of target genes. Design of the diagram is based on Figure 1 from [5].

5
1.3 The strength of Notch trans-activation is the key deter-
minant of cellular decision making
The direct nature of Notch trans-activation may be an important feature of the pathway, because
the quantity of trans-activation felt by a cell seems to be the critical factor in its choice between
different cell fates.
We illustrate this idea with an example from immunology. The decision for a common lymphoid
progenitor (CLP) cell to commit to the B-cell or T-cell fate is governed by the dosage of Notch
signaling. This dependence was shown in experiments where CLP cells were seeded on plates coated
with increasing concentrations of the DSL ligand Dll1. When low levels of Dll1 were presented to
the cells, leading to low levels of Notch activity, all cells chose the B-cell fate. As Dll1 levels, and
in turn Notch activity, were increased, the percentage of cells adopting the B-cell fate diminished,
while the percentage of cells choosing the T-cell fate increased [9, 14]. In this example and others,
the dose of Notch signaling determines the developmental fate of the cell.
One way to modulate the strength of Notch signaling is by using different receptors and ligands
for trans-activation. The collection of DSL receptors and ligands are depicted in Figure 1.4. In
flies, there is a single Notch receptor and two DSL ligands, Delta and Serrate. In vertebrates,
the collection of Notch pathway components has expanded to include four receptors (Notch 1-4),
five DSL ligands (Delta-like-1, 3, and 4 and Jagged 1 and 2). Different ligand-receptor pairs have
different interaction strengths in trans, leading to different developmental outcomes.
To illustrate, we turn to an example related to the one above. In this study, CLP cells were
co-cultured with cells expressing Dll1 or Jag1 ligands. While cell-bound Dll1 ligands could drive
the CLP cells towards the T-cell fate, cell-bound Jag1 ligands could not. Together with the results
from the plate-bound ligand experiment, this suggests that Dll1 ligands elicit a higher dose of
Notch signaling (through Notch1, the receptor used in this context) than Jag1 ligands [30]. These
experiments demonstrate the different quantitative abilities of Dll1 and Jag1 to induce Notch1
activity.
To date, there is no evidence that different DSL ligands produce qualitatively different signals
through a Notch receptor; that is, no matter which DSL ligand binds a Notch receptor, the same
NICD is generated. Instead, the different functional consequences of signaling with different DSL
ligands reside only in how much NICD they can generate. This means that receptors and ligands
that interact strongly in trans (through a high affinity or high efficiency interaction) could generate
more NICD than receptors and ligands that interact more weakly, leading to different developmental
consequences.
Given the close dependence of signaling outcomes on the Notch signal strength, it is not surprising
to find that organisms show an unusual sensitivity to changing the expression levels of Notch pathway

6
components. This phenomenon was evident in Morgan’s discovery of Notch haploinsufficiency [2,24].
Further, Notch is one of the few genes in Drosophila that show both haploid and triploid phenotypes
[24]. Even in mammalian systems, changing the dosage of Notch pathway components can lead to
severe abnormalities. For example, mice lacking one copy of Dll4 show embryonic lethality due
to spinal and vascular abnormalities. In humans, changing the dosage of pathway components is
associated with many illnesses. Haploinsufficiency of Notch2 or Jag1 results in the disease Alagille
syndrome, while mutations of one copy of Notch1 can lead to aortic disease [24]. Aberrant Notch
signaling seems to play a causal role in many leukemias and solid tumors [24].
Here, we have tried to convey the importance of Notch signaling strength in cellular decision-
making, and how this leads to sensitivity in the levels of pathway components. In the following
sections, we consider two more important determinants of signaling strength: cis-inhibition and
Fringe modification.
1.4 A second role for DSL ligands: cis-inhibition
DSL ligands also play a second role in the Notch pathway—in addition to trans-activating Notch
receptors in neighboring cells, they can inhibit Notch receptors in the same cell. This interaction is
termed cis-inhibition [15].
The first clues to the existence of cis-inhibition came about when investigating the synergy
between Notch and Delta mutations in flies. Flies missing one copy of Notch (Notch+/- mutants)
showed Morgan’s wing notching and other phenotypes. One would think that a fly already missing
a copy of Notch would show even more severe abnormalities if a copy of Delta was removed, as
Notch signaling would be decreased even further. But surprisingly, a joint Notch+/- Delta+/- fly
showed a suppression of the Notch (and Delta) haploinsufficient phenotypes, resulting in a normal
looking fly [11, 13, 48]. These findings suggest that high levels of Delta relative to Notch can have
an inhibitory effect on Notch signaling, and highlighted the importance of the ratio of receptor to
ligand expression to Notch signaling processes in Drosophila [15].
cis-inhibition was first demonstrated in overexpression studies, where high levels of ectopic ligand
expression prevented normal activation of Notch target genes. For example, in the Drosophila wing
imaginal disc, a sharp stripe of Notch signaling divides the disc into dorsal and ventral halves,
but overexpression of ligands in a patch of cells within this stripe interrupts the signaling in this
region [10,15,38].
Subsequent studies have shown that cis-inhibition is not just an overexpression artifact, but is
operative at physiological levels of receptor and ligand and plays a functional role in some signaling
processes. For example, in the Drosophila eye, each of the eight cells within in an ommotidium
expresses a different type of photoreceptor. The choice to express an R7 photoreceptor relies on Notch
7
Drosophila Notch
Mouse Notch1
Mouse Notch2
Mouse Notch3
Mouse Notch4
Drosophila Delta Drosophila Serrate
Mouse Jagged1
Mouse Jagged2
Mouse Delta-like 1
Mouse Delta-like 3
Mouse Delta-like 4
PESTAnkyrin
Repeats
EGF Repeats
Canonical DSL ligandsNotch receptors
NRR TADNLS
TMD
DSL
DOS
EGF Repeats TMD
C-rich
domain
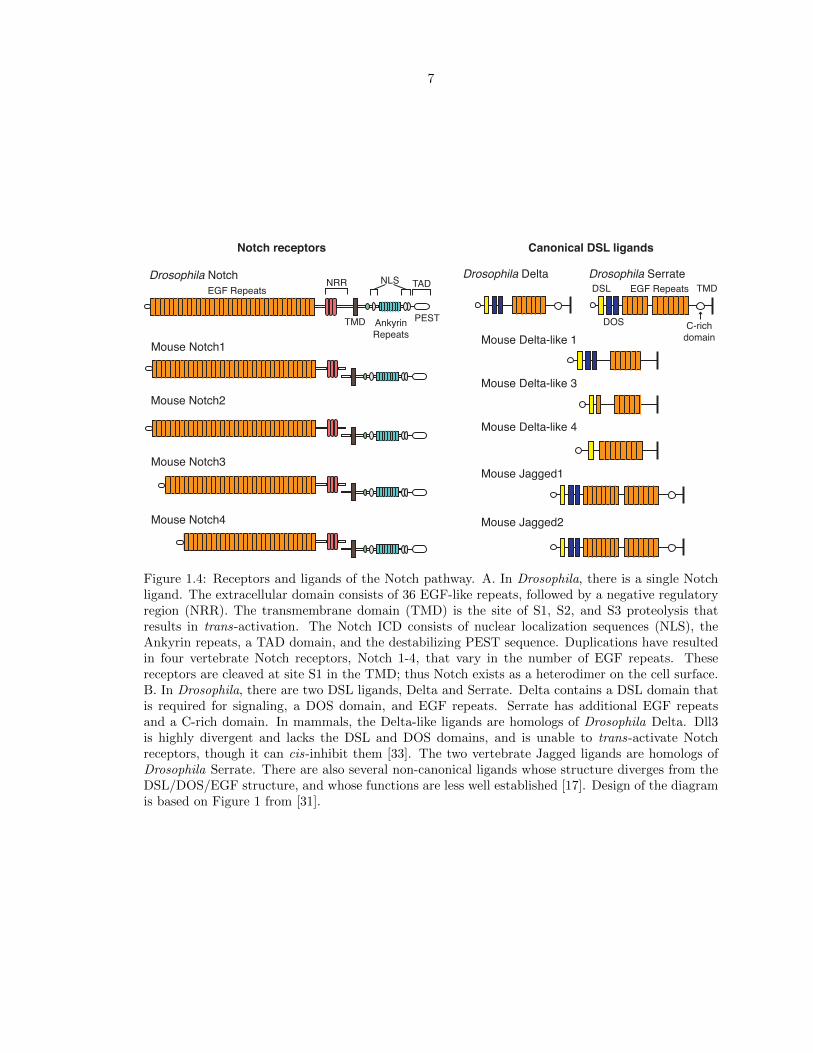
Figure 1.4: Receptors and ligands of the Notch pathway. A. In Drosophila, there is a single Notchligand. The extracellular domain consists of 36 EGF-like repeats, followed by a negative regulatoryregion (NRR). The transmembrane domain (TMD) is the site of S1, S2, and S3 proteolysis thatresults in trans-activation. The Notch ICD consists of nuclear localization sequences (NLS), theAnkyrin repeats, a TAD domain, and the destabilizing PEST sequence. Duplications have resultedin four vertebrate Notch receptors, Notch 1-4, that vary in the number of EGF repeats. Thesereceptors are cleaved at site S1 in the TMD; thus Notch exists as a heterodimer on the cell surface.B. In Drosophila, there are two DSL ligands, Delta and Serrate. Delta contains a DSL domain thatis required for signaling, a DOS domain, and EGF repeats. Serrate has additional EGF repeatsand a C-rich domain. In mammals, the Delta-like ligands are homologs of Drosophila Delta. Dll3is highly divergent and lacks the DSL and DOS domains, and is unable to trans-activate Notchreceptors, though it can cis-inhibit them [33]. The two vertebrate Jagged ligands are homologs ofDrosophila Serrate. There are also several non-canonical ligands whose structure diverges from theDSL/DOS/EGF structure, and whose functions are less well established [17]. Design of the diagramis based on Figure 1 from [31].

8
signaling from cells expressing R1 and R6 photoreceptors. Loss-of-function experiments revealed
that when R1 cells lose Delta expression, they suddenly become competent to receive a Notch
signal, leading to adoption of the R7 fate. This suggests that R1 cells are normally cis-inhibited
by Delta, leading to low Notch activity. In the corresponding gain-of-function experiment, R7 cells
overexpressing Delta can no longer receive a Notch signal and adopt the R1/R6 cell fate, showing that
the R7 cells can experience cis-inhibition; but, physiological Delta levels are low enough to permit
R7 to receive a signal. Together, these experiments show that Delta expressed at physiological levels
can regulate and block Notch signaling [15,40].
While the examples thus far describe the inhibition of the receptor by the ligands, there has also
been evidence of inhibition of the ligands by the receptor. For example, again in the Drosophila
wing, cells mutant for Notch showed higher levels of the DSL ligand Serrate on their surfaces, and
ectopic signaling in the adjacent normal cells [15, 19]. It is unclear whether the receptor-ligand and
ligand-receptor mechanisms are distinct processes, and whether they occur in all Notch signaling
contexts beyond the ones described and referenced here.
There have also been recent insights into the mechanism of cis-inhibition. Though the full-length
crystal structures for the Notch receptors and DSL ligands are not solved, structural studies exam-
ining the portion of the proteins required for binding as well as for both the ability to trans-activate
and cis-inhibit [7]. These authors solved the crystal structures of a fragment of human Notch1,
consisting of EGF repeats 11-13 that had previously been shown to be essential for interactions
with DSL ligands, and Jagged1, consisting of EGF repeat 3 in the highly conserved DSL region
that is required for trans-activation. Analysis of these structures revealed that these fragments
could form two distinct, anti-parallel complexes that correspond to the cis and trans ligand binding
conformation.
This study raises the question of whether cis-ligands prevent activation simply by blocking the
site for ligand binding in trans. However, one study showed that cis ligands also block the ligand-
independent activation of Notch by the calcium chelator EDTA, which destabilizes the receptor and
exposes the proteolytic cleavage site, suggesting that cis ligands are not just disrupting the binding
of ligands in trans but also processes downstream of this step [15]. Further, different mutations
in the ligands can selectively block trans, but not cis, interactions [7], and cis, but not trans,
interactions [20], suggesting that the binding of ligands in both conformations must involve some
distinct surfaces.

9
1.5 Integrating cis and trans interactions into a single model
of Notch signaling
Given the two seemingly contradictory roles of the DSL ligands in Notch signaling, it was unclear
how ligands in cis and in trans together could affect Notch activity. To this end, our lab used an
in vitro experimental approach to determine how the two opposing actions of DSL ligands jointly
determine Notch activity [51] (See also Appendix).
We constructed cell lines that allowed both readout of Notch activity and control of cis and
trans ligand presented to the cells (Figure 1.5, A). To visualize Notch activity, we built “receiver”
cell lines expressing Notch1 receptor and a fluorescent reporter for Notch signaling. To control the
levels of trans ligand felt by the receiver cells, we adsorbed varying concentrations of Dll1 ligand to
the cell culture plates. To control cis ligand expression, we incorporated Dll1, driven by an inducible
promoter, into our receiver cell line. This genetic construct allows Dll1 expression to be controlled
with a small molecule, doxycycline. (For a thorough description of the cell line construction and
experimental methods, see Chapter 2).
We varied the levels of cis and trans ligand felt by our receiver cells and tracked the Notch
activity by watching the response, measured by the fluorescence from the Notch activity reporter,
in time-lapse movies. From these experiments, we made three key observations:
1. The response of our receiver cells to varying levels of plate-bound trans Dll1 was graded. We
measured a very modest cooperativity in the relationship between trans-Dll1 concentration
and Notch activity (Figure 1.5, B).
2. The response of our receiver cells to varying levels of cis-Dll1 was very sharp—in other words,
receiver cells switched from a state where they were inhibited from receiving a Notch signal
to a state where they were no longer inhibited from receiving a Notch signal over a very short
range of cis-Dll1 concentrations (Figure 1.5, C).
3. Third, we observed that this sharp threshold in cis-Dll1 concentration did not depend on how
much trans-Dll1 was adsorbed to the plate. Adding more trans-Dll1 on the plate could not
out-compete cis-Dll1 from binding to receptors in the receiver cells (Figure 1.5, D).
We explored several simple mathematical models that described the receptor-ligand interactions and
determined that the only model that can capture all three of these observations requires that the
cis interaction between Notch receptor and Delta ligand in the same cell is mutually inhibitory.
That is, when Notch receptor and Dll1 in the same cell bind one another, both are irreversibly
prevented from participating in trans signaling. This could occur through degradation, irreversible
sequestration, or some other mechanism. Specifying the cis interaction as mutually inhibitory can

10
0 0.5 1 1.50
200
400
600
800
1000
Calibrated Dplate
(µg/ml)
YF
P p
rod
uctio
n ra
te (
RF
U h
r-1)
hN1(ECD)-Gal4esn
UAS citrine
Fc
Fc
Fc
Fc
Fc
Fc
Fc
Fc
Fc
Fc
Fc
Fc
trans ligand
bound to plate
TO Dll1 mCherry
cis ligand
from inducible promoter4-epiTc/Dox
A B
C
00.5
11.5
020
40600
1
2
3
4x 10⁴
YF
P [R
FU
]
Dplate [μg/ml]
Time [hours]Time (hours)
YF
P, C
FP
(R
FU
)
mC
he
rry (
RF
U)
0 20 40 600
1
2
3x 10⁴
0
5
10x 104
Figure 1.5: Investigating how cis and trans activities of DSL ligands combine to affect Notch activity(A) The experimental approach that allows us to integrate the effects of cis and trans ligand expres-sion on Notch activity. Notch 1 was expressed from a constitutive promoter (hN1∆ICD-Gal4esn)and Notch activity was visualized by a fluorescent reporter driven by the UAS promoter, whichactivates upon binding Gal4esn. trans-Dll1 was controlled by adsorbing varying concentrations ofDll1 (Dplate). cis-Dll1 was controlled with an inducible promoter. (B) The response of the Notchreceiver cells to increasing concentrations of trans Dplate showed a graded profile. (C) The responseof Notch receiver cells to cis-Dll1 was sharp. The plot shows the fluorescence of cells in A in atime-lapse movie. The red open circles show the ligand-mCherry level in the cells, here decreasingover time. The green filled circles show the reporter fluorescence in the cells over time. The greenshaded region shows that reporter cells activated very sharply despite a small change in cis-Dll1levels. The response was even sharper in single cells. (D) The threshold (red dotted line) wherereceiver cells move from a inhibited (black) to uninhibited (green) state does not depend on the levelof trans-Dll1.

11
account for the sharp threshold in cis-Dll1 concentration that transitions the receiver cell from an
inhibited to uninhibited state, and for the fixed threshold as trans-Dll1 concentration is varied.
1.6 Mutually inhibitory cis interactions enforce exclusive send-
ing or receiving signaling states
The finding that the cis interaction is mutually inhibitory has important consequences for Notch
signaling [50,51]. To illustrate, consider a cell expressing a single type of ligand, such as Delta, and
a single type of Notch receptor (Figure 1.6). Consequently, if the cell produces more Delta than
Notch, cis interactions consume all available Notches, but leave an excess of free Delta. The cell is
thus able to send, but not receive, signals. On the other hand, if a cell produces more Notch than
Delta, cis interactions consume all of the Delta, leaving an excess of free Notch, and enables the cell
to receive, but not send. In this simple example, cells can only assume one of two possible signaling
states: sending or receiving.
Receiving Sending
Notch1 Dll1
101 102 103 104
10-2
10-1
100
101
102
103
104
Total ligand production
Fre
e p
rote
in le
ve
l o
n c
ell
su
rfa
ce
Receiving Sending
Notch1Dll1
Notch1
production
Figure 1.6: cis interactions between Notch receptors (here, Notch1) and ligands (here, Dll1) forcecells into mutually exclusive signaling states. On the left, Notch1 levels exceed Dll1 levels. cisinteractions deplete all of the Dll1, but leave an excess of Notch1, allowing the cell to receive signal.Moving to the right, as Dll1 levels increase, they begin to exceed Notch1 levels. Now, cis interactionsdeplete all of the Notch1, leaving only Dll1 remaining. Now, the cell can send, but not receive signal.The blue dotted line denotes where Notch1 and Dll1 production rates are equal.
If we take two cells expressing Notch and Delta, it is clear that signaling between the cells can

12
only occur in one direction, between a cell in a sending state and a cell in a receiving state. This
example demonstrates that the relative levels of receptor and ligand expression in individual cells
determines the strength and the directionality of Notch signaling. This sensitivity to the ratio of
ligands to receptors is reflected in the many examples where developmental processes are interrupted
by changes in the dosage of Notch pathway components, as well as the example of the restoration
of the normal phenotype when both Notch and Delta dosages are halved [11,13,48].
1.7 Fringe proteins modulate Notch receptor-ligand interac-
tions
The Notch pathway also includes various components that regulate the interactions between recep-
tors and ligands. One of the most important and widely used modifiers of Notch activity is Fringe.
Fringe encodes for a glycosyltransferase enzyme residing in the Golgi body that attaches an UDP-
N-acetylglucosamine (GlcNAc) to fucose residues on the EGF repeats of Notch receptors [42, 52].
These sugar modifications alter the responsiveness of the Notch receptor to different DSL ligands in
trans.
In Drosophila, Fringe increases trans-activation of Notch from Delta and inhibits trans-activation
from Serrate. This effect is achieved by modulating the binding affinity between the receptor and
the ligands [6, 56].
In vertebrates, the picture is, unsurprisingly, more complicated. To start, there are three Fringe
variants, Lunatic Fringe (Lfng), Manic Fringe (Mfng) and Radical Fringe (Rfng). Each Fringe
variant affects trans-activation, although whether this effect is mediated through binding affinities is
unclear [52,57]. Lfng and Mfng increase Dll1-Notch1 trans activation, while decreasing Jag1-Notch1
trans activation, similar to the pattern observed with Drosophila Fringe [26,57]. On the other hand,
Rfng increases Notch1 trans-activation from both Dll1 and Jag1 ligands [57].
Fringe is often expressed in complex patterns and directs the spatial layout of Notch activity.
In the fly, Fringe is used to draw a sharp stripe of Notch signaling at a boundary between two
compartments of cells, such as specifying the dorsal and ventral surfaces of the wing and establishing
the segments of the legs [29]. In mammals, Lfng is required for proper development of the spinal
cord. Loss of Lfng activity leads to disrupted somitogenesis and acute skeletal defects. Lfng is
used to pattern the spinal cord into distinct segments to direct the differentiation and growth of
neurons [36]. Mfng and Rfng are not required for survival, but there are subtle defects in some
tissues when their activity is lost and can exacerbate illnesses related to defective Notch signaling,
such as Alagille syndrome [52].
There are many outstanding puzzles regarding how Fringe enzymes affect Notch signaling. The
first is if and whether Fringe affect cis interactions. If so, understanding how Fringe proteins influence

13
cis interactions could have important consequences for the sending and receiving abilities of cells.
The second is how Fringes cooperate to impact Notch activity—are their effects additive, or does
one Fringe dominate over the other? The methods described in this thesis aims to address these
questions.
1.8 We can uncover the full repertoire of Notch signaling
states through an analysis of receptor-ligand interactions
Our work on Notch1-Dll1 cis interactions describes the signaling states for a simple one-ligand
one-receptor case. Now, a natural question arises: How general is this mechanism? Are only
two sending and receiving signaling states possible that involve many Notch pathway components,
including multiple Notch receptors, DSL ligands, and Fringe enzymes, or could more complicated
behaviors become possible? To answer these questions, we need to determine a cell’s signaling state
given its expression of Notch pathway components.
The signaling state of a cell is defined here as its quantitative ability to send, and to receive
signal through each ligand and receptor. For example, a cell capable of receiving signal through
Delta-like-1 but not Jagged-1 (Lfng-modified) is in a different signaling state from one that can
receive signal from either ligand. Knowing the signaling states of interacting cells is necessary to
understand the strength and directionality of signaling between them. Even in relatively simple
cases with a few components, it can be difficult to determine signaling states. However, many
mammalian developmental systems (Figure 1.7) use combinations of several ligands, receptors, and
Fringes, enabling a large number of possible cis and trans interactions:
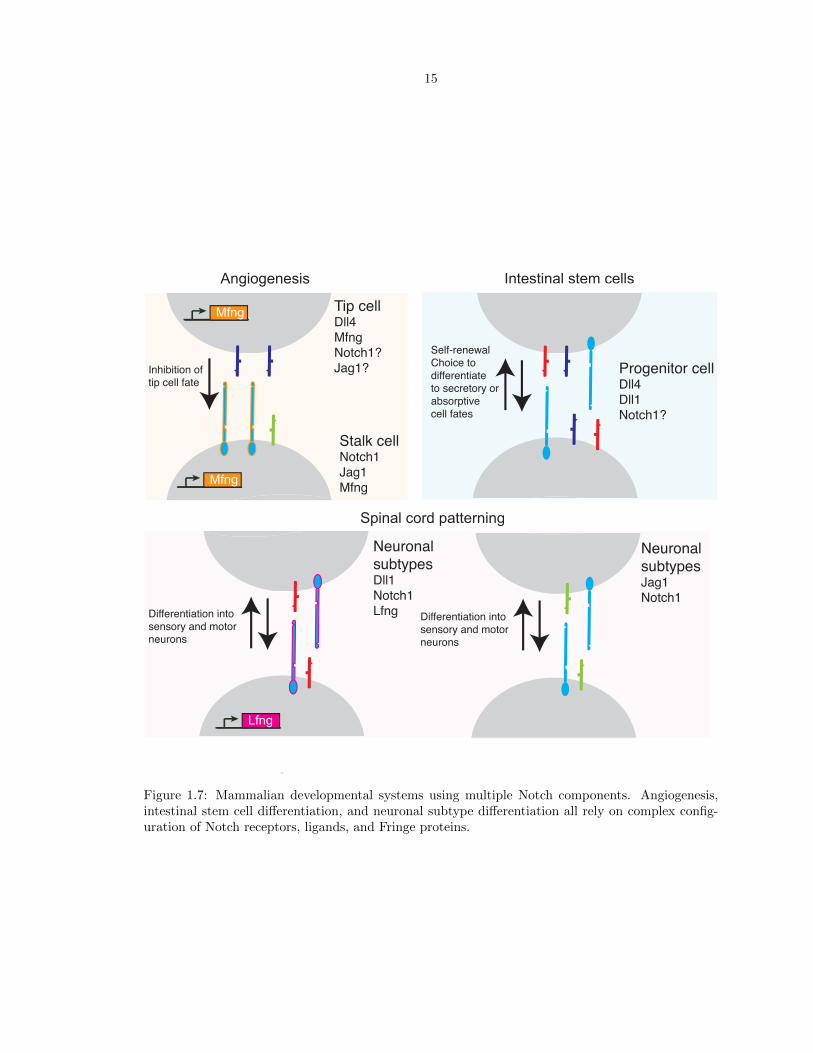
• Angiogenesis Notch signaling is used to control the branching of new blood vessels [47]. When
oxygen-deprived tissues secrete the diffusible molecule VEGF-A, blood vessel endothelial cells
bind the VEGF-A signal and induce Dll4 expression. High Dll4 levels specify a single tip cell,
a cell that will form a new vessel branch. The Dll4-high tip cell sends strong Notch signals to
its neighbors, inhibiting them from also adopting the tip cell fate. Notch1, Jag1, and Fringe
proteins are also involved in this complicated lateral inhibition process. A highly analogous
Notch-dependent mechanism is used in other branching morphogenesis mechanisms during
development, such as the patterning of the lymphatic vessels.
• Regulation of adult stem cell populations In adult mice and humans, stem cells residing
in intestinal crypts continuously replenish the intestinal tissue as it is sloughed away. During
this process, proliferation and differentiation of stem cells must be tightly balanced in order to
both maintain the stem cell population as well as provide newly differentiated cells as needed.
Notch signaling plays an important role in both of these processes: Loss of Notch signaling

14
leads to an overproduction of differentiated secretory cells, while ectopic Notch signaling leads
to increased stem cell proliferation and inhibition of differentiation. These cells express Notch1
and Notch2, and the ligands Dll1 and Dll4 are important in these decisions. Jag1 and Dll3
may also play a role in the differentiation process [45].
• Neuronal subtype specification In the developing spinal cord, differentiation of the sensory
and motor neuron subtypes occurs in spatially distinct domains. These domains are patterned
by stripes of Notch pathway components, including Lfng, Dll1, Jag1 and Notch1 [36].
To determine the signaling state for a cell expressing an arbitrary combination of Notch pathway
components, we need to know: (1) the relative expression levels of ligands, receptors, and Fringe
proteins in each cell; (2) the interaction strengths, in cis and in trans, for each ligand-receptor pair;
(3) how the Fringe proteins acting individually and in concert modulate these interaction strengths.
Measurements of (1) are increasingly possible in biomedically important in vivo systems using single-
cell techniques, but this data will remain difficult to interpret without (2) and (3), which we will
measure here.
What new signaling states become available when new components are introduced? The an-
swers to these questions are crucial, as Notch signaling processes that involve complicated spatial
expression of multiple components are the rule and not the exception in mammals.
1.9 A guiding example: the dorsoventral boundary in the
Drosophila wing imaginal disc
We can find clues to what signaling states are possible in more complicated Notch signaling con-
texts by looking to the simplest example of Notch signaling involving multiple ligands and Fringe
expression; in fact, it is the very instance of Notch signaling first uncovered by Morgan.
The wing notching seen in Morgan’s mutant fruit flies arises from defects in a Notch-dependent
boundary formation process in the developing wing. The wing begins as a large sheet of cells, called
the imaginal disc, that expands and eventually folds to form the dorsal and ventral surfaces of the
wing. The structure that binds the edges of the dorsal and ventral surfaces together is called the wing
margin. This stripe of specialized cells is defined early in larval development by Notch signaling.
While all cells in the wing disc express Notch and Delta, the dorsal cells also express Serrate and
Fringe [12]. The paradox that arises is that at the interface between dorsal cells and ventral cells,
both sets of cells receive a signal across the boundary. Mis-expression experiments where patches
of cells are induced to ectopically express ligands, reveals that all of the cells on either side of the
dorsoventral boundary in the disc can in principle receive a signal [10]. Thus, it appears that in
the wing imaginal disc, cells violate the exclusive send/receive rule, and can both send a signal and
15
Mfng
Mfng
Tip cellDll4
Mfng
Notch1?
Jag1?
Stalk cellNotch1
Jag1
Mfng
Angiogenesis Intestinal stem cells
Progenitor cellDll4
Dll1
Notch1?
Self-renewal
Choice to
differentiate
to secretory or
absorptive
cell fates
Intestinal stem cells
Inhibition of
tip cell fate
Spinal cord patterning
Neuronal
subtypesDll1
Notch1
LfngDifferentiation into
sensory and motor
neurons
Spinal cord patterning
Lfng
Differentiation into
sensory and motor
neurons
Spinal cord patterningSpinal cord patterning
Neuronal
subtypesJag1
Notch1
Figure 1.7: Mammalian developmental systems using multiple Notch components. Angiogenesis,intestinal stem cell differentiation, and neuronal subtype differentiation all rely on complex config-uration of Notch receptors, ligands, and Fringe proteins.

16
Apterous
Dorsal cell identity
D
V
E(spl)
Notch target geneOverlay
Figure 1.8: Simultaneous sending and receiving between dorsal and ventral cells at the dorsoventralboundary of the fly wing. Schematic of experimental results from Figure 4 of [12]. Antibody stainingfor Enhancer of split, a Notch target gene, marks cells that received a Notch signal in green. Antibodystaining with anti-β-galactosidase marks cells expressing the dorsal identity marker Apterous in anapterous-lacZ fly strain, in red. In the overlay, the yellow cells show dorsal cells that received signal,while green cells mark the ventral cells that received signal.
receive a Notch signal simultaneously. How is this dual send/receive state achieved?
Measurements of the cis and trans interactions and particularly how they change after Fringe
modification could provide insight into how the Notch pathway can achieve a signaling state that
permits simultaneous receiving and sending.
1.10 Overview
In this thesis, we will establish a framework for making the measurements needed to characterize
the full repertoire of Notch signaling states.
In Chapter 2, we will present a simple mathematical model that captures the cis and trans
interactions for a single Notch receptor and ligand. This model can give us insight into the physical
quantities that we must measure to find receptor-ligand interaction strengths. Next, we describe
an experimental approach for finding these physical quantities. We build the Notch pathway from
the bottom up in mammalian cells, allowing us to isolate individual ligand-receptor pairs. Then, we
describe microscopy-based techniques for quantification of the cis and trans interaction strengths
for each isolated pair.
In Chapter 3, we apply the methods described in Chapter 2 and present the results for two ligand-
receptor pairs, Notch1-Dll1 and Notch1-Jag1, and the effects of each of the three Fringes on their
cis and trans interactions. We demonstrate for the first time that Fringe modulates Notch-ligand
cis interactions.
In Chapter 4, we will discuss the implications of these results for developmental processes. We

17
present data from our colleagues that corroborate our finding that Fringe modulates cis interactions,
this time in an in vivo context. Using Drosophila developmental mutants, they show that Fringe
modulates Serrate and Delta cis-inhibition differently consistent with our cell culture findings from
Chapter 3. We discuss how these findings and our results from Chapter 3 expand the set of possible
signaling states. We return to the wing dorsoventral boundary example from 1.9 and explain how
the new signaling state enabled by Fringe modulation of cis interactions could explain this signaling
process. Finally, we discuss outstanding questions and future directions for this work.
Together, the experimental approach and data presented in this thesis show that the logic of
receptor-ligand interactions of the Notch signaling pathway lead to a constrained set of signaling
states that enforce the specificity and directionality of Notch signaling.
18
Chapter 2
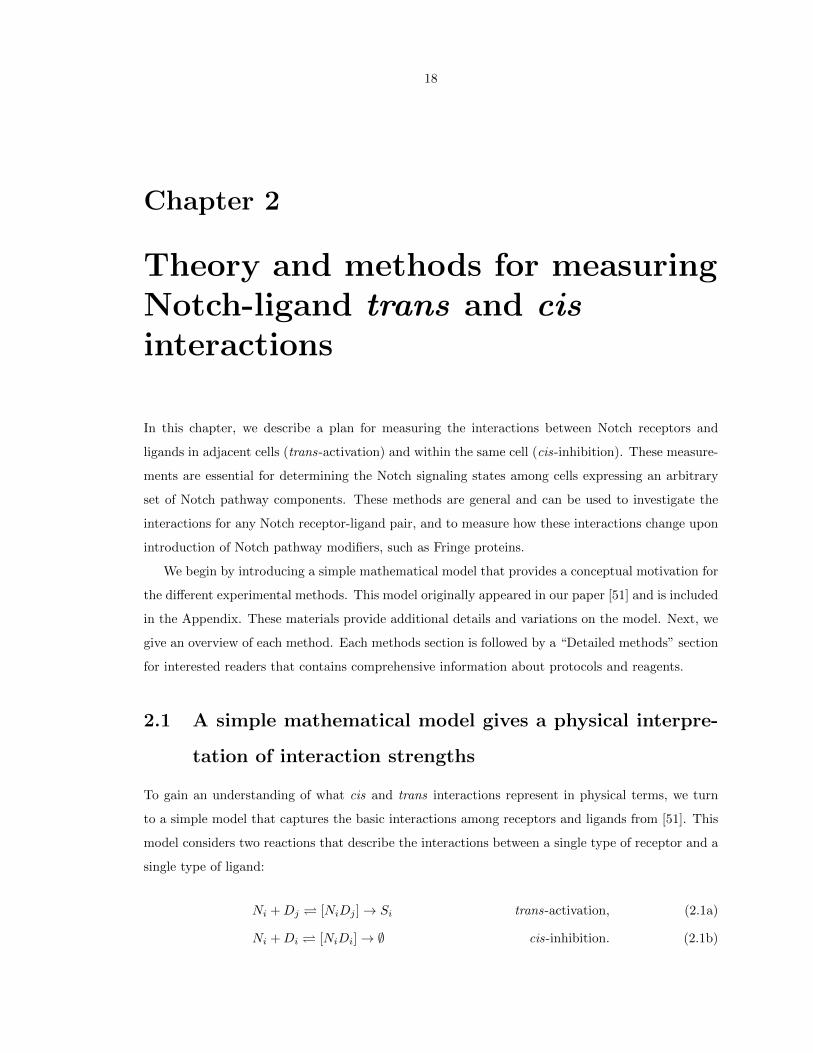
Theory and methods for measuringNotch-ligand trans and cisinteractions
In this chapter, we describe a plan for measuring the interactions between Notch receptors and
ligands in adjacent cells (trans-activation) and within the same cell (cis-inhibition). These measure-
ments are essential for determining the Notch signaling states among cells expressing an arbitrary
set of Notch pathway components. These methods are general and can be used to investigate the
interactions for any Notch receptor-ligand pair, and to measure how these interactions change upon
introduction of Notch pathway modifiers, such as Fringe proteins.
We begin by introducing a simple mathematical model that provides a conceptual motivation for
the different experimental methods. This model originally appeared in our paper [51] and is included
in the Appendix. These materials provide additional details and variations on the model. Next, we
give an overview of each method. Each methods section is followed by a “Detailed methods” section
for interested readers that contains comprehensive information about protocols and reagents.
2.1 A simple mathematical model gives a physical interpre-
tation of interaction strengths
To gain an understanding of what cis and trans interactions represent in physical terms, we turn
to a simple model that captures the basic interactions among receptors and ligands from [51]. This
model considers two reactions that describe the interactions between a single type of receptor and a
single type of ligand:
Ni +Dj [NiDj ]→ Si trans-activation, (2.1a)
Ni +Di [NiDi]→ ∅ cis-inhibition. (2.1b)

19
Equation 2.1a describes trans-activation, where Notch receptors in cell i (Ni) and DSL ligands
in a neighboring cell j (Dj) associate and dissociate, and where a bound complex [NiDj ] generates
an NICD (Si, for ‘signal’).
Equation 2.1b describes mutual cis-inhibition, where receptors in cell i (Ni) and ligands in the
same cell i (Di) associate and dissociate , and where a bound complex [NiDi] is inactivated.
These two reactions can be rewritten as a set of ordinary differential equations:
dNidt
= βN − γNNi − (k+DNi < Dj > −k−D[NiDj ])− (k+CNiDi − k−C [NiDi]), (2.2a)
dDi
dt= βD − γDDi − (k+D < Nj > Di − k−D[NjDi])− (k+CNiDi − k−C [NiDi]), (2.2b)
d[NiDj ]
dt= k+DNi < Dj > −k−D[NiDj ]− kS [NiDj ], (2.2c)
d[NiDi]
dt= k+CNiDi − k−C [NiDi]− kI [NiDi], (2.2d)
dS
dt= kS [NiDj ]− γSSi. (2.2e)
βN describes the production rate of active Notch receptor, and γN describes the rate of degrada-
tion of active Notch receptor in Equation 2.2a. Likewise, βD describes the production rate of active
DSL ligand, and γD describes the rate of degradation of active DSL ligand in Equation 2.2b.
Notch receptors and Delta ligands in neighboring cells can associate and dissociate in trans with
a rate k±D, and a bound complex [NiDj ] generates an NICD (Si) with activation rate kS . These
processes affect the time evolution of Notch receptors, DSL ligands, trans complexes, and NICD (Si),
corresponding to Equations 2.2a, b, c, and e. < Dj > and < Nj > are the average concentrations
of Dj and Nj felt by cell i in trans. This signal undergoes a spontaneous decay with rate γS .
Notch receptors and DSL ligands in the same cell can associate and dissociate in cis with a rate
with a rate k±C . A bound complex [NiDi] is inactivated with a rate kI . These processes affect the
time evolution of Notch receptors, DSL ligands, and cis complexes, corresponding to Equations 2.2a,
b, and d respectively.
First, we want to know what the trans interaction strength represents in physical terms. We
are able to isolate and measure trans-activation in the absence of cis-ligands, as well as to precisely
control the level of ligand presentation in trans. We will describe these methods in detail in the
coming sections (Section 2.3). Thus, we can simplify the above equations by removing the cis
interaction terms, as well as by replacing the term < Dj > with Dtrans, the precise quantity of
trans-ligand.
Next, we assume that the generation of the NICD is very fast compared to the other reactions,
allowing us to assume that the bound complex [NiDtrans] achieves a quasi-steady state ([NiDtrans] ≈
0). Using this assumption, we derive the following relationship:

20
Ssteady state =1
γS
βNDtrans
k−D+kS
kSk+D
γn +Dtrans
. (2.3)
This equation shows a Michaelis-Menten relationship between the level of ligand presented to
the receiver cells, Dtrans, and Notch activity. The half-maximal activity occurs when the Dtrans
concentration is proportional tok−D+kS
kSk+D
. This value is kt, the trans interaction strength.
Next, we use the model to understand what the cis interaction strength represents in physical
terms. Again, our experimental approach allows us to simplify the equations in 2.2. We are able to
isolate the effects of cis interactions independent of trans interactions (Section 2.4). Thus, we can
ignore the terms describing the trans interaction strength. Here, we assume that the inactivation of
the [NiDi] cis-complex occurs much faster than the other reactions, allowing us to again apply the
quasi steady-state assumption, ([NiDi] ≈ 0). We arrive at the following expression:
Nsteady state =
βN
γN
1 +Dsteady state
kCγN
. (2.4)
where k−1C is defined ask+c kI
k−C+kI. The physical meaning of this expression is that available Notch
receptor is a decreasing function of cis-Delta concentration. When there is no cis-Delta expression
steady state receptor levels equal the production divided by the degradation rate. However, as cis-
Delta increases, the level of available Notch drops. The value where Delta depletes Notch receptor
to one half its maximal value in the absence of cis-Delta is kcγN , which is proportional to the cis
interaction strength.
In summary, we must measure two quantities that represent the trans-activation and cis-inhibition
strengths for each ligand-receptor pair. For the trans-activation, we must measure the ligand level
that elicits a half-maximal level of Notch activity in pure Notch receiver cells. For cis-inhibition, we
must measure the available Notch levels on cells as a function of cis-ligand expression, and the ligand
expression level that depletes half of the total surface Notch will be our cis-inhibition strength. The
following sections will describe how to find these values experimentally.
2.2 Building the Notch pathway from the bottom up
Measuring cis and trans interaction strengths for individual ligand-receptor pairs enables us to
generate predictions about how combinatorial sets of Notch pathway components should behave.
However, these individual measurements would be difficult or impossible to achieve in animal sys-
tems, where these components are expressed simultaneously and dynamically in single cells. Thus,
our experimental approach is to isolate ligand-receptor pairs and to study their interactions in vitro,
by building a synthetic Notch pathway from the bottom up.

21
0 5000 100000
250
500
Concentration of trans-Ligand
No
tch
activity (
NIC
D)
Strong trans-activation
Weak trans-activation
Figure 2.1: Plot of Equation 2.3 of single-cell Notch activity with increasing trans-ligand. As theconcentration of trans-ligand is increased the signal (NICD) generated increases sharply when thereceptor-ligand trans-interaction is strong (dark green curves) or graded when the trans-interactionis weak (light green curve). Parameters used to generate the curves are βN = 500, γN = 1, γS = 1,Dtrans = 1 to 10000, and ktrans = 102 (strong) to 105 (weak).

22
102 103 104
10-2
10-1
100
101
102
103
104
Total ligand
Ava
ilab
ility
Receptor Ligand
Strong cis-inhibition
Weak cis-inhibition-inhibition
Strong cis-inhibition
Weak cis-inhibition
βN, Notch
production rate
Figure 2.2: Plot of Equation 2.4 of single-cell receptor and ligand availability of a cell with constitu-tive Notch receptor expression and increasing ligand expression at varying cis-inhibition strengths.The blue curves show Notch receptors available on the surface for signaling. As ligand expressionincreases, the receptor availability falls off sharply, for strong cis-inhibition (dark blue curves), orgradually, for weak cis-inhibition (light blue curves). The red curves show the ligand available forsignaling. At high cis-inhibition, Notch keeps available ligands low until total ligand levels exceedNotch levels, then shoots up sharply (dark red curves). At low cis-inhibition, ligand availabilitytracks ligand expression, unaffected by Notch levels (light red curves). Parameters used to generatethe curves are βN = 1000, γN = 1, γS = 1, βD = 102 to 104, kcis = 10−1 (strong) to 103 (weak).

23
As a foundation for our bottom up construction of the Notch pathway, we chose CHO-K1 (Chinese
Hamster Ovary), a standard laboratory cell line. CHO-K1 exhibits no detectable endogenous Notch
activity under our growth conditions, and transcriptome analysis revealed no detectable expression
of Notch receptors or ligands. Nevertheless, CHO-K1 cells express all essential components, such
as the CSL (RBPJ-κ), proteins necessary to support Notch signaling. CHO-K1 also supports high
transfection efficiencies, facilitating rapid cell line construction. The recently available public genome
sequence of CHO and our own transcriptome analysis provide data for design of qPCR primers,
shRNA, and other tools [25]. Finally, CHO-K1 have been used in several in vitro studies investigating
Notch signaling and Fringe modification, and the findings from these studies have been consistent
with in vivo findings [27].
2.2.1 Engineered cell lines allow control and readout of ligand expression
and Notch activity in individual cells
To build the Notch pathway from the bottom up, we need a set of components that allow us to
control and visualize Notch signaling. The components list is shown in Figure.2.3.
The first component is the Notch receptor. We constructed a ‘diverted’ variant of the Notch1
receptor, hN1(∆ICD)-Gal4esn, based on an original design by Struhl [53]. This chimeric receptor has
the ICD replaced with a minimal variant of the yeast transcriptional activator Gal4, here denoted
Gal4esn, to avoid activation of possible endogeneous Notch targets in CHO-K1 cells.
To monitor Notch activity, we built a second component where the UAS promoter drives ex-
pression of a Histone 2B (H2B)-3x-YFP (three citrine fluorescent proteins fused in tandem). When
the diverted Notch receptor is trans-activated, the Gal4esn binds to the UAS target promoter, and
generates green, nuclear-localized fluorescence.
The third component for a synthetic Notch signaling pathway is a DSL ligand. We constructed
chimeric ligand-Cerulean fluorescent protein or ligand-mCherry fluorescent protein fusion genes un-
der control of a tetracycline-inducible (TO) promoter. Expression of the fluorescent ligand can be
tuned by adding an inducer, such as doxycycline (dox, high affinity inducer), or 4-epitetracycline
(4-epiTc, low affinity inducer). The TO promoter is a minimal CMV promoter that contains binding
sites for the Tet repressor [22]. In the absence of 4-epiTc, the Tet repressor, expressed constitutively
in our CHO-K1 cells, binds to the TO operator sites, blocking the transcriptional machinery for
reading the DNA. When the Dox/4-epiTc is added, the drug binds to the TetR, freeing the TO
operator and allowing the transcriptional machinery to proceed.
Together, these genetic engineering methods allow us to express single ligand-receptor pairs in
the Notch pathway, as well as control over the level of the ligand expression. They also enable us to
visualize the magnitude of Notch activity with a fluorescent reporter. We can also add additional

24
ligands and receptors, and Fringe proteins, building up more complex configurations of components.
2.2.2 Detailed methods for cell line construction
CHO-K1 cells were maintained as described in [51]. Briefly, cells were maintained in Alpha-MEM
Earle’s Salts media (Irvine Scientific) supplemented with 10% Tet-system approved FBS (Clontech)
and an L-glutamine, penicillin and streptomycin additive (Gibco), and stored in an incubator at
37◦C at 5% CO2.
Genetic constructs, including siRNA constructs, were introduced into CHO-K1 cells using Lipo-
fectamine 2000 reagent according to the manufacturers’ protocol (Life Technologies), or FugeneHD
reagent (Promega). Selection was performed using 400µg/mL Zeocin (Life Technologies), 10µg/mL
Blasticidin (InvivoGen), 600µg/mL Geneticin (Life Technologies), 500µg/mL Hygromycin (Invivo-
Gen) and/or 3µg/mL Puromycin (Life Technologies). Single clones were obtained using FACS
sorting or limiting dilution. Single clones were chosen based on fluorescence or quantitative PCR
for non-fluorescent constructs.
Quantitative PCR was used to measure gene expression of non-fluorescent components. RNA
was isolated with the Qiagen RNAeasy kit according to the manufacturers protocol. cDNA was
synthesized from 1µg of RNA using the iScript cDNA synthesis kit (Bio-Rad). For real-time PCR
reactions, SsoFast Probes Supermix (Bio-Rad) was combined with 2µL of cDNA. Each reaction
was performed in triplicate. In parallel, three real-time PCR reactions were performed to measure
β-actin levels in the sample, allowing us to compute a ∆-∆ CT value for the gene of interest in our
cell lines. Reactions were performed on a Bio-Rad CFX Real-Time PCR Detection System. Probe
sets included the following:
β-actin
Primer 1: 5’ – ACTGGGACGATATGGAGAAG –3’
Primer 2: 5’ – GGTCATCTTTTCACGGTTGG –3’
Probe: 5’– HEX ACCACACCTTCTACAACGAGCTGC – BlkFQ-3’,
Lfng
Primer 1: 5’-GAAGTTCTGTCCCCTCGC–3’
Primer 2: 5’-GATCCAGGTCTCGAACAGC–3’
Probe: 5’–FAM ACTTTCTGGTGGTCTTGACGGCG–BlkFQ-3’,
Mfng
Primer 1: 5’–ACCACTCAAGTTTGTCCCAG–3’
Primer 2: 5’–GATGAAGATGTCGCCTAGCTG–3’

25
Probe: 5’–FAM TGAACCAACGGAACCCAGGACC–BlkFQ–3’,
Rfng
Primer 1: 5’–TCATTGCAGTCAAGACCACTC–3’
Primer 2: 5’–CGGTGAAAATGAACGTCTGC–3’
Probe: 5’–FAM CTCGTGAGATCCAGGTACGCAGC–BlkFQ–3’.
2.3 Methods to measure and compare ligand-receptor trans
interaction strengths
From our model in Section 2.1, we must measure the level of Notch activity in response to increasing
levels of trans-ligand, and find the ligand level that elicits half-maximal Notch activity. To do this,
we build Notch “receiver” cells, that express the diverted versions of our Notch receptor and activity
reporter (See Figure 2.3) to measure activity stimulated by two different methods of trans-ligand
presentation.
The first method is to present trans-ligands immobilized on cell culture plates. We seeded our
receiver cell line on plates coated with varying concentrations of ligand-Fc fusion protein, which
consists of a fragment of the DSL ligand fused to the Fc epitope (Figure 2.4A). The advantage
of this method is that allows us to precisely control the quantity of ligand presented to the cells,
and also provides a uniform level of ligand to all reporter cells in a large population of receiver
cells, allowing us to quantify variability in their response. The disadvantage to this method is that
the ligand presentation is artificial, and may not accurately reflect trans-activation with ligands
expressed on the cell surface. This is especially a concern given the important role of a“pulling
force” generated by the endocytosis of the DSL ligand-Notch ECD complex into the signal-sending
cell during trans-activation [37].
Thus, we used a second, more natural method of ligand presentation in parallel. We used ligand-
expressing “sender” cells, expressing our inducible ligand constructs, to present cell-based ligands to
our receiver cells (Figure 2.4B). We co-cultured sender and receiver cells and measured the response
of the activity reporter in the the receivers. The advantage to this method is that it is potentially
more similar to endogenous ligand presentation. The disadvantage is that CHO-K1 cells are highly
mobile, even at confluence, and the fluctuations of cell contacts leads to a highly variable response
in the receiver cells. However, using a high ratio of sender cells to receiver cells and plating the cells
at a high density can mitigate this variability.
With the results of these two assays, we can converge at a characterization of the trans-activation
strength between each receptor-ligand pair that is both precise and physiologically relevant.

26
hN1(ΔICD)-Gal4esn
UAS citrine
TO Dll1 mCherry
TO Dll1 cerulean
TO mCherry
TO Jag1 cerulean
Jag1
Fluorescently-tagged, inducible ligandsReceptors
hN1 Natural
Diverted
Activity reporters
12x CSL citrine Natural
Diverted
Activity modifiers
Lfng
Mfng
Rfng
and other 3 DSL ligandsand other 3 receptors
CHO-K1 cells
Figure 2.3: Components list for engineering the Notch pathway from the bottom up. Our CHO-K1cell line expresses very low (if any) levels of Notch receptors and ligands. To this base cell line,we can add combintions of the following components. We can add one (or combinations) of thefour Notch receptors in a natural or diverted (ICD replaced with a transcriptional activator) form.We can add reporters to generate fluorescence upon binding of NICD (12xCSL, ’Natural’ reporter)or transcriptional activator (for example, a Notch-Gal4 paired with a UAS sequence, ’Diverted’reporter) to the promoter. We can also add DSL ligands fused to fluorescent proteins and undercontrol of small-molecule inducible promoters. Finally, we can add activity modifiers, such as theFringe proteins, under constitutive or inducible promoters.
Fc
Fc
Fc
Fc
Fc
Fc
Fc
Fc
Fc
Fc
Fc
Fc
A. Ligand-Fc fusion proteins
bound to plate
B. Co-culture with inducible
ligand-expressing cells
4-epiTc
TO Dll1 cerulean TO Dll1 cerulean TO Dll1 cerulean
hN1(ΔICD)-Gal4esn
UAS citrine
“Receiver” cell line
Figure 2.4: Two methods for measuring trans-activation. We plate “receiver” cells on plates coatedwith immobilized ligand-Fc fusion proteins. B. We also use “sender” cell lines expressing ligandsunder inducible control in a co-culture with receiver cells to evaluate the trans-activation capabilitiesof different ligands.

27
2.3.1 Detailed methods for trans-activation assays
For the plate-bound ligand method, we incubated cell culture plates with a fixed concentration
(usually 1µg/mL unless noted otherwise) ligand-Fc fusion protein in PBS for 1 hour at 4◦C. We
washed the plates with PBS, and then added cell culture media and plated receiver cells. We assayed
the cells, after 24-48 hours, by flow cytometry (See 2.4.2 for flow cytometry details).
In order to fairly compare the trans-activation capabilities of different ligands, we needed to
calibrate the level of ligand bound to the plates. To do this, we incubated the plates as described
above, and then applied an anti-Fc HRP-conjugated antibody to the plate (Figure 2.5). We detected
the activity of the bound HRP-conjugated antibodies by adding a TMB substrate (Thermo Scientific
1-Step Turbo TMB-ELISA Substrate Solution). We measured the HRP chemiluminescence from the
plates to determine the level of bound ligand using a plate reader (Wallac 1420, Perkin-Elmer). From
this procedure, we determined that both the Dll1 and Jag1 ligands bound with similar efficiencies
to the plate.
For the co-culture method, we mixed sender and receiver cells at a ratio of 90:10 and plated cells
at very high density (90% confluence) to maximize cell contacts. We measured the cells after 48-72
hours to evaluate activation by flow cytometry.
We calibrated the level of ligands on the cell surface of each of our sender cell lines using the ligand
availability assay described in the following sections. Briefly, this method allows us to tag ligands
localized on the cell surface using soluble Notch receptor fragments conjugated to Fc epitopes, then
label the bound Notch-Fc epitope with fluorescent reagents. Using this method, we were able to
normalize our results to account for the differing levels of ligands on the cell surface (Figure 2.9E).
2.4 Availability assay to measure and compare ligand-receptor
cis-interaction strengths
We recall from Section 2.1 that the quantity relevant for determining the strength of the cis-
interaction is the amount of cis-ligand needed to deplete available surface Notch receptor levels
to one-half their maximum value. Thus, our experimental method must be able to quantify the
Notch receptors available on the cell surface as a function of cis-ligand expression.
To this end, we developed an immunostaining-based “availability” assay to label available Notch
receptors on the surface of our cells as we vary the level of cis-ligand with 4-epiTc (based on [49]).
To detect available Notch receptors on the cell surface, we incubated our test cell lines with soluble
Dll1 fragments chimeric with the Fc epitope tag (Dll1ext-Fc). We found that this reagent only binds
to Notch receptors free to participate in trans-signaling, and does not label cis complexes that might
be localized at the cell surface (Figure 2.6).

28
0 5 10 15 20 25 30
0.3
0.4
0.5
0.6
0.7
No ligand
Dll1ext-FcJag1ext-Fc
0.2
0.1
Ligand-Fc concentration (μg/mL)
HR
P C
he
milu
min
esce
nce
(A
LU
)
Figure 2.5: Calibration of plate-bound ligands. We coated plates with varying concentrations ofDll1ext-Fc or Jag1-ext-Fc protein, and then used anti-Fc HRP-conjugated antibodies to detect theamount of plate-bound ligand. We found that the Dll1 and Jag1 proteins bind to the plates withequal efficiencies, allowing for a direct comparison between the two ligands at the same incubationconcentration.

29
4-epiTc
TO Jag1-CFP
EF Notch1∆ICD-Gal4esn
Notch1+Jag1
4-epiTc
TO Dll1-CFP
EF Notch1∆ICD-Gal4esn
Notch1+Dll1
Fc
0 ng/mL 80 ng/mL 200 ng/mL
4-epiTc
Fc
0 ng/mL 80 ng/mL 200 ng/mL
4-epiTc
Fc
Phase
0 ng/mL 80 ng/mL 200 ng/mL
4-epiTc
0 ng/mL 80 ng/mL 200 ng/mL
4-epiTc
Fc
A B
C D
E F
Total Dll1
AvailNotch1
Phase
Total Jag1
AvailNotch1
Phase
Total Dll1
AvailDll1
Phase
Total Jag1
AvailJag1
Receptor availability
Ligand availability
Cell lines
Figure 2.6: Availability assay for measuring cis interactions. (A-B) Stable CHO-K1 cell lines con-stitutively express a Notch1-Gal4 chimeric receptor and a tetracycline-inducible Dll1 (A) or Jag1(B) ligand fused to cerulean fluorescent protein. (C-D) In the receptor availability assay, solubleDll1ext-Fc binds to free Notch receptor on the surface of live cells. After fixation, bound Dll1ext-Fcis labeled with anti-Fc fluorescent reagents. Increasing ligand-Cerulean expression reduces receptoravailability, as shown in these snapshots, consistent with cis-inhibition (C, D, bottom panels). (E-F)The ligand availability assay works similarly, except soluble N1ext-Fc fragments bind free ligands onthe cell surface. Increasing ligand-Cerulean expression (E, F, middle panels), leads to increased lig-and availability (E, F bottom panels). The surface ligand availability shows good spatial correlationwith the total cellular ligand staining. Note that cells were plated at high cell density for illustrationpurposes. For quantitative analysis, cells were dissociated and plated at low density before staining(Figure 2.9).

30
We performed the converse ligand availability experiment by incubating the same cells with
soluble Notch1 fragments chimeric with Fc, N1ext-Fc (Figure 2.6). We found that this procedure
labels only ligands that are available to participate in trans-activation.
After the initial incubation with soluble receptor-Fc or ligand-Fc fragments, we washed away the
unbound protein and fixed and permeabilized the cells. We then blocked the cells and then labeled
the bound Fc fusion proteins with fluorescent anti-Fc secondary reagents. In parallel, we incubated
the cells with a cytoplasmic blue stain for automatic segmentation of cell bodies. We then imaged
the cells on the microscope and analyzed the single-cell fluorescence using a MATLAB routine.
2.4.1 Validation of availability assay
To validate the Notch availability assay, we performed the assay on cells expressing hN1(∆ICD)-
Gal4esn and observed high levels of availability fluorescence. Meanwhile, the Notch availability assay
performed on CHO-K1 cells lacking ectopic Notch expression showed minimal fluorescence (Figure
2.8A). To see if receptor availability corresponds to receiving ability, we seeded receiver cells on
plates coated with Dll1ext-Fc. We observed a strong response from the reporter (compare ± Dplate).
When we knocked down receptor expression using siRNA against the extracellular domain of Notch1,
receiving ability decreased (Figure 2.8A). In parallel we also observed a coincident decrease in Notch1
availability in receiver cells with and without siRNA against Notch1 (Figure 2.8B).
Cells expressing inducible ligand only showed increased ligand availability as ligand expression
was induced with 4-epiTc (Figure 2.8C). We induced TO-Dll1-cerulean and TO-Jag1-cerulean cell
lines with increasing concentrations of 4-epiTc and then stained each sample with ligand availability
reagents. We found that ligand availability increased with ligand induction (Figure 2.8C). We also
induced the cells with varying concentrations of 4-epiTc and co-cultured them with receiver cell
lines. From this experiment, we found that inducible ligand cells could trans-activate receiver cells
in a dose-dependent fashion (Figure 2.8D). Because ligand availability also increased with induction,
ligand availability and sending ability are correlated.

31
hN1(ECD)-Gal4esn
UAS citrine
Fc
Fc
Fc
Fc
Fc
Fc
Fc
Fc
Fc
Fc
Fc
Fc
Dplate
Notch availability in reporter cell line
siRNA
No targetsiRNA
Notch1CHO−K1
0246810121416
18 x 105
Me
an
No
tch
Ava
ilab
ility
(A
lexa
48
8 R
FU
)
siRNA
No target
siRNA
Notch1
0
1
2
3
44.5 x 10⁴
Me
an
re
sp
on
se
of re
ce
ive
r ce
lls
(C
itrin
e R
FU
)
+ D
plate
− Dplate
siRNA
Notch1
Receiving ability from plate-bound Delta (Dplate
) in reporter cell line
Ligand availability in inducible ligand cell lines
Sending ability in inducible ligand cell lines
4-epiTc
TO Dll1 cerulean TO Jag1 cerulean
Co-culture Co-culture
0 20 40 60 80 100 150 2000
1
2
3
4
5
6 x 10⁶
4−epiTc (ng/mL)
Me
an
lig
an
d a
va
ilab
ility
(Ale
xa
48
8 R
FU
)
TO−Jag1
TO−Dll1
TO−Jag1
TO−Dll1
4-epiTc
4-epiTc
TO Dll1 cerulean TO Jag1 cerulean
4-epiTc
0 20 40 60 80 100 150 2000
1
2
3
4
5
6
7
8
9
4−epiTc (ng/mL)Me
an
activa
tio
n in
re
po
rte
r ce
lls
(Citrin
e R
FU
)
10 x 104
hN1(ECD)-Gal4esn
UAS citrine
hN1(ECD)-Gal4esn
UAS citrine
siRNA
Notch1
hN1(ECD)-Gal4esn
UAS citrine
hN1(ECD)-Gal4esn
UAS citrine
A
B
C
D
0 2000
1
Normalized
Figure 2.7

32
Figure 2.7 (previous page): (A) To validate the Notch availability assay, we tested cells expressinghN1(ICD)-Gal4esn and observed high levels of availability fluorescence, while CHO-K1 cells lackingectopic Notch expression showed minimal availability fluorescence (Anti-IgG Alexa 488). Bars showmean Notch1 availability, and error bars show standard error of the mean (SEM). (B) To showthat receptor availability corresponds to receiving ability, we seeded the receiver cell line express-ing a diverted Notch receptor (hN1(ICD)-Gal4esn) and a fluorescent reporter for Notch signaling(UAS-H2B-citrine) on plates coated with Dll1 ligands. We observed a strong response from thereporter (compare ±Dplate). When we knocked down receptor expression using siRNA against theextracellular domain of Notch1, receiving ability decreased, coinciding with the decrease in Notch1availability from A. Bars show mean reporter fluorescence, error bars are SEM. (C) Inducible ligandcells show increased ligand availability as ligand expression is induced with 4-epiTc. The TO-Dll1-cerulean and TO-Jag1-cerulean cell lines were incubated with increasing concentrations of 4epi-Tcand stained with ligand availability reagents. Points show the mean availability at each inductionlevel, error bars show the SEM. (D) Inducible ligand cells from C are able to trans-activate Notchreceiver cells in a dose-dependent fashion as ligand induction is induced with 4epi-Tc. Because ligandavailability also increases with induction, ligand availability and sending ability are correlated. Inthe inset, the same data normalized to the maximal activation elicited by each ligand. In all panels,cells were analyzed by flow cytometry.
2.4.2 Detailed methods for availability assay
For both availability assays, test cells were plated in 24-well plates (BD Falcon) at 25% confluence
and treated with one of eight concentrations of 4-epiTc ranging from 0 to 200 ng/mL. In siRNA
transfection experiments, silencing constructs were delivered after 24 hours of induction. After 48
hours of induction, cells from all 4-epiTc induction conditions were trypsinized, pooled into a single
tube, and replated in triplicate at low (5-10% confluent) density. CHO-K1 and hN1(∆ ICD)-Gal4esn
cell lines were also plated as staining controls.
After 4-6 hours, test cells were blocked for 30 minutes at 37◦C in blocking buffer (PBS with
2% FBS and 100 µg/mL CaCl2). Next, cells were incubated with 10 µg/mL soluble Mouse Re-
combinant Dll1ext-Fc chimera (receptor availability) or Mouse Recombinant Notch1ext-Fc chimera
(ligand availability), both from R & D Systems (5267-TK and 5026-DL, respectively) diluted in
binding buffer (PBS with 2% Sigma Bovine serum albumin and 100 µg/mL CaCl2), for 1 hour
at 4◦C. After incubation, cells were washed three times with binding buffer and fixed with 4%
methanol-free formaldehyde (Polysciences Inc.). Cells were washed three times with binding buffer
and permeabilized with .5% Triton X-100 (Thermo Scientific) and washed three more times.
Next, cells were blocked with blocking buffer for 30 minutes at room temperature and then in-
cubated for 1 hour at room temperature with the following fluorescent secondary reagents: 1:500
dilution of anti-mouse IgG conjugated to Alexa 488 (Life Technologies) to stain cell-bound recombi-
nant protein-Fc, 1:500 dilution of anti-GFP conjugated to Alexa 594 (Life Technologies) to visualize
the ligand-CFP expressed by the cells, and a 1:10 dilution of HCS Cell Mask Blue (Life Technolo-
gies) to label the cells cytoplasm for automatic segmentation. All reagents were diluted in binding
buffer. Finally, cells were washed three times with binding buffer and mounted in 70% glycerol for

33
0 5 10 15 20 25 300
1
2
3 x 10⁴
Dll1ext−IgG concentration (μg/mL)
No
tch
ava
ilab
ility
(R
FU
)
Calibration of Dll1ext−IgG
hN(ΔICD)-Gal4esn
A B
0 5 10 15 20 25 300
1
2
3
4x 10⁴
Notch1ext−IgG concentration (μg/mL)
Lig
an
d a
va
ilab
ility
(A
nti−
IgG
Ale
xa
48
8 R
FU
) Calibration of Notch1ext−IgG
TO−Dll1−cerulean + 4-epiTc 200 ng/mLTO−Jag1−cerulean+ 4-epiTc 200 ng/mLTO−Dll1−cerulean + 4-epiTc 0 ng/mLTO−Jag1−cerulean + 4-epiTc 0 ng/mL
Figure 2.8: Calibration of availability assay reagents. (A) Pure receiver cell line expressinghN(∆ICD)-Gal4esn was incubated with increasing concentrations of Dll1ext-Fc followed by fluo-rescent anti-Fc reagents. Blue points are the results of two replicates. Data were fit (red line) toNavail = aD
(D+K) , where D is the concentration of Dll1ext-Fc, with a = 2.1 × 10⁴ ± .17 × 104, and
K = 2.27 ± 0.6µg/mL (red line). (B) Similarly, the working concentration of N1ext-Fc was deter-mined by incubating cells expressing fully induced TO-Jag1-cerulean (orange) and TO-Dll1-cerulean(red) with varying concentrations of N1ext-Fc, and staining with secondary reagents. Data were fit(red and orange lines) to Lavail = aL
(L+K) . For the TO-Jag1-cerulean data, a = 2.1× 10⁴± .14× 104,
and K = .14± 0.16µg/mL (orange line). For the TO-Jag1-cerulean data, a = 1.2× 10⁴ ± .11× 104,and K = .33 ± 0.26µg/mL (red line). Availability saturated at relatively low concentrations of theN1ext-Fc (<1µg/mL), while un-induced cell lines showed no availability signal. Concentrations ofsecondary reagents were not limiting. The working concentration of both N1ext-Fc and Dll1ext-Fcreagents was set at a saturating level (10µg/mL) based on these measurements.

34
microscopy analysis.
Images were acquired with a CoolSnap HQ2 camera on a Nikon inverted TI-E microscope using a
20x long working distance objective. Metamorph 7.5 (Molecular Devices) controlled the microscope,
camera, stage (ASI Instruments) and brightfield and epifluorescence shutters (Sutter Instruments)
and collected the images. Fluorescent illumination was generated by the Sola LED light source
(Lumencor) and filtered through the Chroma filter sets SpGold, SpRed, and SpGreen. Brightfield
illumination was generated by a halogen bulb.
In experiments with gene silencing, siRNA against Notch1-ECD was delivered to cells using
Lipofectamine 2000 reagent. Three dicer-substrate (dsiRNA from Integrated DNA Technologies)
oligonucleotide duplexes against Notch1-ECD were pooled and 20 pmol of the mix were added to
each well. IDT Universal Negative Control duplex was also transfected alongside each sample as a
control. We used the following Notch1-ECD dsiRNA sequences:
NECD Antisense 1
5’–rCrArG rCrGrA rGrCrA rCrUrC rArUrC rCrArC rGrUrC rCrUrG rGrCrU–3’
5’–rCrCrA rGrGrA rCrGrU rGrGrA rUrGrA rGrUrG rCrUrC rGrCT G–3’,
NECD Antisense 2
5’–rArCrA rCrCrA rGrUrG rCrArC rArArG rGrUrU rCrUrG rGrCrA rGrUrU-3’
5’–rCrUrG rCrCrA rGrArA rCrCrU rUrGrU rGrCrA rCrUrG rGrUG T-3’,
NECD Antisense 3
5’–rUrUrG rArUrC rUrCrG rCrArG rUrUrG rGrGrU rCrCrU rGrUrG rGrUrC–3’m
5’–rCrCrA rCrArG rGrArC rCrCrA rArCrU rGrCrG rArGrA rUrCA A–3’.

35
4epiTc
48 hours
Induce ligand-CFP
expressionApply availability reagents
at 4ºC
N1ext-Fc or Dll1ext-Fc
Fix, permeabilize cells
Apply secondary reagents
Image cells
4-6 hours
Anti-Fc Alexa 488
Anti-CFP Alexa 594
Segmentation stain (Blue)3x
1 hour
Identify cells using segmentation stain, measure mean cell fluorescence above background in each channel
Experimental protocol
Gate cells by area
Normalize total ligand fluorescence to account
for differences in surface levels of expression
for each ligand
Plot median availability in bins evenly spaced
along the log of the x-axis
Dissociate and pool cells
from each condition.
Plate in triplicate at low density
Screen cells by eye
Accept
Segmentation stain (Blue) Output
0 1 10 100 1e3 1e4 1e50
0.2
0.4
0.6
0.8
1
1.2
1.4
1.6
Area
Pe
rce
nt
Before gating
After gating
Gate
Reject
0 2 4 6 8 10 x 1050
1
2
3
4
5
6
7
8
9
10 x 105
Total ligand (Alexa 594 Anti−CFP)
Lig
an
d A
va
ilab
ility
(A
lexa
48
8)
TO−Dll1−cerulean
TO−Jag1−cerulean
Fc
106
Total ligand (Alexa 594 Anti−CFP RFU)
No
tch
Ava
ilab
ility
(A
lexa
48
8 R
FU
)
105
104
104 105 106
Fc
Screen cells by eye
Output
Screen cells by eyeScreen cells by eyeScreen cells by eyeScreen cells by eye
Output
Mean fluorescence
of segmented cell
Mean of pixels in
segmented region
(Foreground)
Median of pixels in
unsegmented region
(Background)
=
-
A
B
C
D
E F
Figure 2.9

36
Figure 2.9 (previous page): Protocol and data analysis pipeline for availability assay. (A) Test cellswere induced for 48 hours with varying concentrations of 4-epiTc. On the day of the experiment,the cells are dissociated with trypsin, split at low density and allowed to reattach to the cell cultureplates. Cells are blocked with 2% FBS in PBS for 30 minutes at 37◦C and then incubated with 10µg/mL Dll1ext-Fc (for receptor availability) or N1ext-Fc (for ligand availability) for 1 hour at 4◦C.Next, cells are washed, fixed, and permeabilized. To visualize the bound reagents, we incubatedthe cells with anti-Fc antibody conjugated to Alexa 488 dye. We also added anti-CFP conjugatedto Alexa 594 to visualize the ligand expression. Finally, we added a blue cytoplasmic stain toidentify individual cells. (B) After staining we imaged the cells on the microscope. The imagesare analyzed using a custom MATLAB script to identify the cells and take the mean of the totalfluorescence within each cell for each fluorescence channel. At this stage we subtract a backgroundfluorescence value from each cell, defined as the median of the background (unsegmented) pixels inthe neighborhood of the cell. (C) Next, we impose a gate on the cell area to filter out doubletsand segmentation errors. (D) Then, all cells are screened by eye so that only single, isolated cellsare included in the final analysis. (E) Next, we normalize the total ligand (x-axis) to account fordifferences in the surface expression of each ligand. In the plot in F, the same CFP fluorescence levelresults in different surface availability measurements for a cell line expressing only Jag1 comparedto a cell line expressing only Dll1, with Jag1 showing higher surface expression. To adjust for thisdifference in efficiency of surface expression between the different ligands, we fit the total ligand vs.ligand availability data from cells expressing ligand only with a linear fit. We use this fit to normalizethe data for each ligand accordingly, allowing for comparison between different cell lines expressingdifferent ligands. After this correction is applied, we refer to the total ligand as the“Effective totalligand.” (F) The single cell data from each replicate is pooled and then divided into evenly spacedbins along the log of the x (total ligand)-axis and the median availability level for each bin is plotted.We use a Matlab bootstrapping method to find the 95% confidence intervals for the estimate of themedian.
Images were analyzed in MATLAB 2012 (Mathworks). Analysis pipeline is outlined in Figure
2.9, B-F. First, cells were segmented by their labeling with the HCS Cell Mask Blue cytoplasmic
stain using a routine based on the watershed algorithm (SegContour3.m, Figure 2.9B). Next, total
fluorescence in each fluorescence channel for each cell was calculated as follows. First, the value of
the background fluorescence was computed in the neighborhood of the cell by taking the median of
the unsegmented pixels in the neighborhood of the cell. Next, this background value was subtracted
from each pixel’s fluorescence value in the cell. Finally, all of the background-subtracted pixels were
averaged to give the mean fluorescence for that cell.
After this automatic processing, manual correction of the data was performed. This included
imposing a gate on the segmented cell area to filter out multiple cells and segmentation errors (Figure
2.9C). Next, cells were screened by eye such that cells in physical contact with another cell were
rejected, and only single, isolated cells were included in the analysis (Figure 2.9D).
We found that for the same measured ligand-CFP level, we obtained different levels of surface
availability, suggesting the ligands may reach the cell surface with different efficiencies. To account for
this difference, we normalized total ligand-CFP fluorescence in the Notch1+Dll1 and Notch1+Jag1
cell lines. Total ligand was plotted as “Effective total ligand” (Figure 2.9E).
We then plotted each cells effective total ligand and availability fluorescence, and grouped cells

37
into bins logarithmically spaced along the effective total ligand axis. We plotted the median of these
bins, and used a bootstrapped estimate of the median (MATLAB function bootci.m) to find the
95% confidence intervals of the bin median (Figure 2.9F).
For analysis with flow cytometry, cells were dissociated with .25% trypsin (Life Technologies),
diluted in FACS buffer (1X Hanks Balanced Salt Solution (Gibco) with 2.5 mg/mL BSA), and filtered
through 40µm strainers (BD Falcon). The cell suspension was screened for single-cell forward and
side scatter and fluorescence intensity on a MacsQuant VYB instrument (Miltenyi Biotech). Data
was imported into MATLAB 2012 for analysis. Analysis included imposing a gate on the forward
and side-scatter area to omit dead cells and doublets and then analyzing the single-cell fluorescence
intensity for each channel.
2.5 Movie-based dilution assay to measure and compare ligand-
receptor cis-interaction strengths
A complementary method to evaluate cis-interactions is a movie-based method first introduced in
Section 1.5 [51] (Figure 2.10 and Appendix). The advantage of this method is that is allows us to
directly assess the effect of cis-ligand on the receiving ability of our cells. This method complements
the availability assay, allowing us to see how both receptor availability and receiving ability change
with increasing cis-ligand expression.
We began with cells expressing Notch, a fluorescent reporter for Notch activity, and an inducible
ligand. The cells also contained a fluorescent nuclear CFP construct, to allow identification and
segmentation of cell nuclei. Before the movie, we induced the cells to express high levels of cis-
ligand. Then, we seeded the induced cells on plates coated with Dll1ext-Fc and the Notch signaling
inhibitor, DAPT. Right before the movie, we washed out the DAPT and the inducer. When the
movie started, the cells gradually dilute out their cis-ligand levels with each round of cell division.
When cis-ligand levels became low enough, cis-inhibition was relieved, and the Notch was free to
respond to the Dll1ext-Fc adsorbed to the plate.
2.5.1 Detailed methods for dilution assay
Cells were seeded onto glass-bottom plates (MatTek) coated with 5µg/mL fibronectin (Innovative
Research) and 1µg/mL Dll1ext-Fc in low-fluorescence imaging media, Alpha-MEM, that includes 5%
FBS and omits phenol red, riboflavin, folic acid, and vitamin B12 (Life Technologies, custom made).
Cells were maintained at 37C and 5% CO2 in a chamber enclosing the microscope, an inverted
Olympus IX81 equipped with Zero Drift Control (ZDC), a 20x NA 0.7 objective, and an iKon-M
CCD camera (Andor). All devices were controlled by Metamorph software.

38
Movies were analyzed in MATLAB. Cell nuclei in each frame were identified automatically based
on the CFP nuclear fluorescence, and the total fluorescence from each channel in each cell nucleus
was recorded. Background subtraction was applied to each fluorescence value. We then plotted the
median ligand fluorescence and reporter fluorescence. The time when more than 50% of the cells
activated, ton, was found by recording the frame where the median YFP reached 10% of its final
slope. We chose this metric instead of a hard threshold as it allows for a more careful comparison
between cell lines that achieve different final slopes in their response curves. For example, receiver
cells expressing Lfng respond strongly to Dll1, and achieve a higher final slope than their counterparts
without Lfng.
2.6 The bottom up approach provides a way to form and test
hypotheses about complex Notch signaling schemes
The methods described here can be used to investigate the interactions for any Notch ligand-receptor
pair. With the measurements of how individual ligand-receptor pairs interact, we can return to the
model in Section 2.1 and add additional terms to study and make predictions about the behavior
of cells with multiple components. The experimental methods can then allow us to test these
predictions by adding components from our parts list to our cell lines. Are the pairwise interactions
sufficient to specify Notch signaling behaviors, or do higher-level interactions occur among multiple
components? This bottom up approach allows us to address this key question, and in doing so to
build up a more predictive understanding of Notch signaling.

39
A
Lig
an
d m
Ch
err
y
YF
P r
ep
ort
er
Add DAPT,
dox
t=-24h
Remove DAPT,
dox
t=0h
ton Time
B
4-epiTc
hN1(ECD)-Gal4esn
TO Jag1 mCherry
UAS citrine
Lfng
Receiver cells
4-epiTc
hN1(ECD)-Gal4esn
TO Jag1 mCherry
UAS citrine
Figure 2.10: Movie protocol for evaluating cis interactions. (A) Schematic of the movie protocol.Before the movie, ligand expression is induced with doxycycline/4-epiTc and cells are seeded onplates coated with Dll1ext-Fc in the presence of DAPT. At the start of the movie, DAPT anddoxycycline are washed out. Ligand levels gradually dilute away with cell division. When cis-ligand levels are low enough, the cells can respond to the ligand on the plate, and the reporteractivates, at time noted ton. (B) Cell lines used in the dilution movies. Cells contain a divertedNotch1 receptor, a fluorescent reporter for Notch signaling, and an inducible cis-ligand construct.Constitutive Fringe was added to these parental cell lines to observe the effects of Fringe in themovie assay. Corresponding cell lines were made with Dll1 as the cis-ligand.
Construct name Promoter Gene Mammalianselection
Role
pcDNA3-hN1(∆ICD)-Gal4esn
pEF hN(∆ICD)-Gal4esn Neomycin Diverted Notch1 receptorin test cell lines
pcDNA3-hN1(∆ICD)-Gal4esn
CMV hN(∆ICD)-Gal4esn Neomycin Diverted Notch1 receptorin movie cell lines
pcDNA-TO-Dll1-cerulean
CMV-TO Dll1-cerulean Hygromycin Inducible Dll1 in test celllines
pcDNA-TO-Jag1-cerulean
CMV-TO Jag1-cerulean Hygromycin Inducible Jag1 in test celllines
piggyBAC-CMV-Lfng
CMV Lfng Puromycin Constitutive Lfng in testcell lines
piggyBAC-CMV-Mfng
CMV Mfng Puromycin Constitutive Mfng in testcell lines
piggyBAC-CMV-Rfng
CMV Rfng Puromycin Constitutive Rfng in testcell lines
pExchange-CMV-Lfng
CMV Lfng Puromycin Constitutive Lfng inmovie cell lines
pcDNA6-UAS-H2B03x-citrine
UAS H2B-3x-citrine Zeomycin Fluorescent reporterfor signaling fromhN1(∆ICD)-Gal4esn
Table 2.1: Table of plasmids used in this work.

40
Cell line name Selection NotesCHO-K1 + TetR Blasticidin 10µg/mL Background staining con-
trolCHO-K1 + TetR + pEF-hN(∆ICD)-Gal4esn
Blasticidin 10µg/mL, Geneticin600µg/mL
Background stainingcontrol, Notch expression∆∆CT ≈2.7 (to β-actin)
CHO-K1 + TetR + pEF-hN(∆ICD)-Gal4esn + TO-Dll1-cerulean
Blasticidin 10µg/mL, Ge-neticin 600µg/mL, Hygromycin500µg/mL
Notch + Dll1
CHO-K1 + TetR + pEF-hN(∆ICD)-Gal4esn + TO-Jag1-cerulean
Blasticidin 10µg/mL, Ge-neticin 600µg/mL, Hygromycin500µg/mL
Notch + Jag1
CHO-K1 + TetR + pEF-hN(∆ICD)-Gal4esn + TO-Dll1-cerulean + piggyBacCMV-Lfng
Blasticidin 10µg/mL, Ge-neticin 600µg/mL, Hygromycin500µg/mL, Puromycin 3µg/mL
Notch + Dll1 + Lfng, Lfngexpression ∆∆CT = 1.89(to β-actin)
CHO-K1 + TetR + pEF-hN(∆ICD)-Gal4esn + TO-Dll1-cerulean + piggyBacCMV-Mfng
Blasticidin 10µg/mL, Ge-neticin 600µg/mL, Hygromycin500µg/mL, Puromycin 3µg/mL
Notch + Dll1 + Mfng,Mfng expression ∆∆CT =1.96 (to β-actin)
CHO-K1 + TetR + pEF-hN(∆ICD)-Gal4esn + TO-Dll1-cerulean + piggyBacCMV-Rfng
Blasticidin 10µg/mL, Ge-neticin 600µg/mL, Hygromycin500µg/mL, Puromycin 3µg/mL
Notch + Dll1 + Rfng,Rfng expression ∆∆CT =3.865 (to β-actin)
CHO-K1 + TetR + pEF-hN(∆ICD)-Gal4esn + TO-Jag1-cerulean + piggyBacCMV-Lfng
Blasticidin 10µg/mL, Ge-neticin 600µg/mL, Hygromycin500µg/mL, Puromycin 3µg/mL
Notch + Jag1 + Lfng,Lfng expression ∆∆CT =2.13 (to β-actin)
CHO-K1 + TetR + pEF-hN(∆ICD)-Gal4esn + TO-Jag1-cerulean + piggyBacCMV-Mfng
Blasticidin 10µg/mL, Ge-neticin 600µg/mL, Hygromycin500µg/mL, Puromycin 3µg/mL
Notch + Jag1 + Mfng,Mfng expression ∆∆CT =1.72 (to β-actin)
CHO-K1 + TetR + pEF-hN(∆ICD)-Gal4esn + TO-Jag1-cerulean + piggyBacCMV-Rfng
Blasticidin 10µg/mL, Ge-neticin 600µg/mL, Hygromycin500µg/mL, Puromycin 3µg/mL
Notch + Jag1 + Rfng,Rfng expression ∆∆CT =.525 (to β-actin)
CHO-K1 + TetR + pEF-hN(∆ICD)-Gal4esn + TO-Jag1-mCherry + UAS-H2B-citrine
Blasticidin 10µg/mL, Ge-neticin 600µg/mL, Hygromycin500µg/mL, Zeocin 400µg/mL,
Notch1 + Jag1 reportercell line, Lfng expression∆∆CT ≈ 2 (to β-actin)
CHO-K1 + TetR + pEF-hN(∆ICD)-Gal4esn + TO-Jag1-mCherry + UAS-H2B-citrine + pExchange-Lfng
Blasticidin 10µg/mL, Ge-neticin 600µg/mL, Hygromycin500µg/mL, Zeocin 400µg/mL,Puromycin 3µg/mL
Notch1 + Jag1 + Lfng re-porter cell line, Lfng ex-pression ∆∆CT ≈ 2 (to β-actin)
CHO-K1 + TetR +pEF-hN(∆ICD)-Gal4esn
+ TO-Dll1-mCherry +UAS-H2B-citrine
Blasticidin 10µg/mL, Ge-neticin 600µg/mL, Hygromycin500µg/mL, Zeocin 400µg/mL,
Notch1 + Dll1 reportercell line, Lfng expression∆∆CT ≈ 2 (to β-actin)
CHO-K1 + TetR +pEF-hN(∆ICD)-Gal4esn
+ TO-Dll1-mCherry+ UAS-H2B-citrine +pExchange-Lfng
Blasticidin 10µg/mL, Ge-neticin 600µg/mL, Hygromycin500µg/mL, Zeocin 400µg/mL,Puromycin 3µg/mL
Notch1 + Dll1 + Lfng re-porter cell line, Lfng ex-pression ∆∆CT ≈ 2 (to β-actin)
Table 2.2: Table of cell lines constructed for this work.

41
Chapter 3
Quantitative measurements ofNotch-ligand trans and cisinteractions
In this chapter, we use the methods from Chapter 2 to study and compare the interactions between
different Notch ligand-receptor pairs. With four Notch receptors and five DSL ligands, there are
20 possible ligand-receptor pairs (Figure 1.4). We initially focused on Notch1-Dll1 and Notch1-
Jag1. These pairs have been relatively well-characterized in vitro, and previous studies have show
qualitatively different effects of Lfng and Mfng on the trans-activation for these pairs, allowing us
to explore a range of possible signaling states [26,57].
First, we compared the trans-activation capabilities of Dll1 and Jag1 and found that Dll1 is a
stronger activator. Second, we examined the cis interactions for both pairs. We show that Dll1
is a also a stronger cis-inhibitor of Notch1 than Jag1, suggesting that cis and trans interaction
strengths may be correlated. We offer direct evidence of mutual cis-inhibition by showing that
Notch1 expression reduces both Dll1 and Jag1 ligand availability.
Finally, we examined if Fringe proteins affected cis interactions. We found that in addition to
modulating the transinteractions between each ligand-receptor pair, expression of Fringe proteins
also modulates their cisinteractions. Interestingly, Fringe affects cis and trans interactions in the
same direction: Lfng and Mfng strengthen Notch1-Dll1 interactions, in trans and in cis, and weaken
Notch1-Jag1 interactions, in trans and in cis, while Rfng strengthens the interactions between both
pairs. We will discuss the implications of these results in Chapter 4.
3.1 Dll1 trans-activates Notch1 more strongly than Jag1
We compared the abilities of Dll1 and Jag1 to trans-activate Notch1 using the two methods from
Chapter 2. First, we plated receiver cells on plates coated with increasing concentrations of Dll1ext-
Fc or Jag1ext-Fc (0-20µg/mL, serial dilutions). For both ligands, we observed the characteristic

42
Fringes
Lunatic Manic Radical
Notch1
Jag1Dll1
++
--+
? ? ?? ? ?
+
Signal sending cell
trans
cis cis
Figure 3.1: Known and unknown interactions between Notch1, Dll1, and Jag1. There are multiplepotential ways in which Notch1 could interact in cis and trans with Jag1 and Dll1 ligands, and inwhich Fringe proteins could modulate these interactions. Known interactions are indicated by +and − for positive and negative regulation, respectively. Unknown ways in which Fringe proteinscould modulate these interactions are indicated by question marks.
graded activation profile in response to increasing ligand levels [51]. We found that while both
Dll1 and Jag1 ligands could activate our receiver cells, Dll1 activated much more strongly, with
approximately four times more Jag1ext-Fc than Dll1ext-Fc needed to reach the same level of Notch
activity (Figure 3.2A).
Next, we used the cell-based ligand presentation method from Section 2.3 to see if we obtained
similar results. We co-cultured Dll1 and Jag1 sender cells with Notch1 receiver cells and measured
the reporter fluorescence in the receivers. From this experiment, we observed that Dll1 and Jag1
sender cells also could activate our receiver cells in a graded fashion, and we confirmed our finding
that Dll1 elicits more Notch activity than Jag1 (Figure 3.2B). Further, we found that when we
compared the ligand availability at each 4-epiTc level for the two sender cell lines, four times more
cell-based Jag1 compared to cell-based Dll1 was needed to elicit the same level of Notch activity,
consistent with the results of the plate-bound ligand assay.
Together, these data suggest that Dll1 is a stronger trans-activator of Notch1 than Jag1. Ap-
proximately four times more Jag1 than Dll1 is needed to achieve the same level of Notch activity.

43
3.2 Dll1 cis-inhibits Notch1 more strongly than Jag1
Using the receptor and ligand availability assays, we compared the abilities of Dll1 and Jag1 to cis-
inhibit the Notch1 receptor. We measured the levels of available receptors and ligands on the cell lines
expressing Notch1 and Dll1 (denoted Notch1+Dll1) and Notch1 and Jag1 (denoted Notch1+Jag1).
We induced ligand expression in the Notch1+Dll1 and Notch1+Jag1 cell lines with varying concen-
trations of 4-epiTc. After 48 hours of induction, we measured the available Notch1 receptor and
available ligand on the cell surface as a function of ligand-Cerulean expression.
We observed that both Dll1 and Jag1 can fully cis-inhibit Notch1 receptors when the ligands
are expressed at high levels (Figure 3.3A,B). Available Notch1 levels decreased in a dose-dependent
fashion with increasing expression of either Dll1 or Jag1. At maximal induction levels, both cell
lines showed no available Notch1, with the levels of Notch1 availability fluorescence overlapping
with the distribution of background fluorescence from the CHO-K1 cell line (Figure 3.3A,B). To
confirm that this reduction in Notch availability was not an artifact of ligand overexpression, we
transiently transfected a mutated version of Dll1 into a cell line expressing Notch1. This mutated
Dll1 contains a point mutation converting a phenylalanine residue in the DSL domain to alanine
(F199A), and has been shown to be have a reduced capability to both itrans-activated and cis-inhibit
Notch receptors [7]. The Dll1-F199A ligand could not reduce Notch availability to background levels
(Figure 3.3C). Together, these results suggest that both Dll1 and Jag1 ligands can reduce Notch
availability.
We also observed that Dll1 appeared to be somewhat more potent than Jag1 as a cis-inhibitor of
Notch1. Approximately twice as much available Jag1 on the cell surface was needed to reduce Notch
availability by 50% compared to Dll1 (Figure 3.3D). Dll1 appears to also be more potent than Jag1
as an activator of Notch1 in trans (Figure 2.8), raising the possibility that cis and trans interaction
strengths between a receptor and ligand could be related. Structural evidence suggests that cis and
trans interaction do involve common surfaces on the receptor and ligand [7] and this work suggests
that this could translate into correlated affinities for both types of interaction.

44
0 5 10 15 20
1
2
3
3.5 x 10⁴
Plate-bound ligand concentration (μg/mL)
Me
an
re
sp
on
se
in
re
ce
ive
rs (
AF
U)
Dll1ext-Fc
Jag1ext-Fc
A B
0 20 40 60 80 100 150 2000
1
2
3
4
5
6
7
8
9
10 x 104
4−epiTc (ng/mL)
Me
an
re
sp
on
se
in
re
ce
ive
rs (
AF
U)
TO−Jag1−cerulean
TO−Dll1−cerulean
Figure 3.2: Dll1 is a stronger trans-activator of Notch1 than Jag1. (A) Receiver cells were plated onincreasing concentrations of Dll1ext-Fc (red points) or Jag1ext-Fc (green points) and the fluorescencefrom the Notch activity reporter was measured on the flow cytometer. Points show the meanfluorescence of two replicates. Lines are a fit of the model from 2.1. Four times more Jag1 isneeded to reach the same Notch activity as Dll1 (compare Jag1 at 20 µg/mL and Dll1 at 5µg/mL.(B) Results of a co-culture of receiver cells with either TO-Dll1-cerulean (red points) or TO-Jag1-cerulean (green points) senders. Points are the mean fluorescence from the Notch activity reporter inthe the top ten percent responders of the receiver cells. Error bars are the standard deviation. Cellswere analyzed on the flow cytometer. When ligand availability was measured at each 4-epiTc level,again the results of the co-culture suggest that four times more Jag1 ligand is needed to achieve thesame level of Notch activity as Dll1.

45
A
E F
Notch1Dll1
Dll1 only No target siRNANotch + Dll1 No target siRNANotch + Dll1 Notch siRNA
Jag1 only No target siRNANotch + Jag1 No target siRNANotch + Jag1 Notch siRNA
**
101 102 103
101
102
Effective total ligand (AFU)
No
tch
1 a
va
ilab
ility
(A
FU
)
Notch1 + Jag1Notch1 + Dll1
B
Notch1Jag1
C D
103 104 105
104
Total ligand (mCherry AFU)
No
tch
1 a
va
ilab
ility
(A
FU
)
Dll1 F199A−mCherryDll1−mCherry
5x10³
101 102 103
101
102
103
Effective total ligand (AFU)
Ava
ilab
ility
(A
FU
)
101 102 103
101
102
103
Effective total ligand (AFU)
Ava
ilab
ility
(A
FU
)
101 102 103101
102
103
Effective total ligand (AFU)
Dll1
ava
ilab
ility
(A
FU
)
*
102 103
102
103 Model
102 103101
102
103
104
Effective total ligand (AFU)
Ja
g1
ava
ilab
ility
(A
FU
)
*
102 103101
102
103
104 Model
Figure 3.3

46
Figure 3.3 (previous page): Dll1 is a stronger cis-inhibitor of Notch1 than Jag1. (A-B) Single celldata show decreasing receptor availability and increasing ligand availability as total ligand expressionincreases. Circles denote the medians of data points in logarithmically spaced bins along the x-axis.Effective total ligand refers to the ligand availability observed at a given ligand-CFP fluorescencevalue in a cell line expressing only ligand. For receptor availability data in A, n = 299 and in B, n= 352. For the ligand availability data in A, n = 323 and in B, n = 530. Gray bars in all panelsrepresent background levels, defined as the 25-75 percentile range of fluorescence from parentalCHO-K1 cells that do not express Notch1 or ligand-Cerulean constructs. (C) Transient expressionof wild-type Dll1-mCherry (n = 8817), but not the Dll1-mCherry F199A mutant (n = 14292),reduced Notch availability to background levels in a Notch1 cell line. Cells were analyzed by flowcytometry. Error bars in all panels denote 95% confidence interval for the bootstrapped estimate ofthe median. (D) Comparison of Notch availability in the Notch1+Dll1 and Notch1+Jag1 cell lines.Lines are fits to a model of receptor-ligand cis-interactions (Supplementary). (E) Comparison ofligand availability in cell lines expressing Dll1. Ligand availability a cell line expressing Dll1 only (n= 1146). Notch1 reduces ligand availability (purple, n = 1131), and this effect is rescued by siRNAagainst Notch1 (orange, n = 972). In the purple starred region, cells differ significantly in ligandavailability between Notch1 or no target siRNA samples, while the orange star denotes regions whereDll1 and Notch1+Dll1 cells transfected with no target siRNA differ significantly. Significance wasdetermined by applying the Wilcoxon rank sum test. Inset shows the model behavior for parametersderived from the fit in D. Knockdown of Notch was measured to be 50%. (F) Comparisons of ligandavailability in a cell line expressing Jag1 only (green, n = 733), Notch1+Jag1 (orange, n = 532), andNotch1+Jag1 with siRNA against Notch (purple, n = 1163). Starred regions indicate significanceas in E. Inset shows model behavior using parameters measured in D. Knockdown of Notch wasmeasured to be 70%.
3.3 Ligand availability assay reveals mutual cis-inhibition
between ligands and receptors
Next, we observed that the Notch1 receptor reduces both Dll1 and Jag1 availability, supporting
the mutual inhibition model of cis interactions [51]. We compared the ligand availability in cell
lines expressing only inducible ligand constructs to that of cell lines that also expressed Notch1. As
expected, increasing ligand expression led to a corresponding increase in ligand availability. However,
in the Notch+Jag1 and Notch+Dll1 cell lines, we observed significantly reduced ligand availability
compared to their ligand-only counterparts at the same levels of total ligand expression. In these
cell lines, we could restore ligand availability by knocking down expression of Notch1 with siRNA
(Figure 3.3D,E). Because ligand availability correlates with sending ability (Figure 2.8), these results
support a role for Notch1 decreasing Dll1 and Jag1 sending ability in cis, consistent with the mutual
inhibition model of cis interactions.

47
3.4 Mammalian Fringes modulate Notch1+Dll1 and Notch+Jag1
cis interactions differently
To determine whether and how Fringe enzymes modulate cis interactions, we introduced each of the
three Fringe genes into the Notch+ligand-Cerulean cell lines. We transfected plasmids encoding Lfng,
Mfng, or Rfng under control of a constitutive promoter and selected stable populations, confirming
Fringe expression with qPCR. As expected, these constructs increased the trans response to plate-
bound Dll1 and decreased the response to Jag1, consistent with previous results [57].
To analyze the effect of Fringe enzymes on cis interactions, we repeated the availability assay in
these cell lines and the corresponding parental cell lines that lacked ectopic Fringe expression.
For the Notch1+Dll1 cell lines expressing Lfng, Mfng, or Rfng, Notch1 availability decreased to
background levels in response to Dll1 expression. Moreover, Fringe expression significantly reduced
Dll1 availability compared to the parental cell lines without Fringe (Figure 3.4B). Together, these
results suggest that all Fringe enzymes preserve, and may even strengthen, the Notch1-Dll1 cis
interactions (Figure 3.4B). Note that absolute levels of availability fluorescence increased with Fringe
expression, as can be observed at low total ligand levels in Figure 3.4A inset, because Fringes
enhance binding of the Dll1ext-Fc detection reagent to available Notch1. To account for this change
in binding, we normalized the curves to the level of Notch availability measured when ligand levels
were uninduced. After normalizing for this change, cell lines with Fringe expression appear to have
stronger cis interactions (Figure 3.4A). Consistent with this, available Dll1 ligand assays revealed
reduced available Dll1 when any of the Fringes was expressed (Figure 3.4B). Together, these results
suggest that all three Fringe enzymes preserve, or strengthen, Notch1-Dll1 cis interactions.
The effects of Fringe enzymes on Notch1-Jag1 cis interactions were markedly different. In cell
lines expressing Lfng or Mfng, Jag1 was not sufficient to reduce Notch availability to background
levels even at very high expression levels (Figure 3.4C). In contrast, when Rfng was expressed,
reduction of Notch availability was depleted to background levels with increasing cis-Jag1 expression.
Thus, Lfng and Mfng, but not Rfng, appear to reduce cis interactions between Notch1 and Jag1. In
the ligand availability assay, we did not detect a significant increase in Jag1 availability due to Lfng
or Mfng expression (Figure 3.4D). Because the basal Jag1-Notch1 cis-inhibition strength is already
weak compared to the Dll1-Notch1 cis interaction strength (Figure 3.3F), the Jag1 availability
assay may not be sensitive enough to detect further reductions in cis-inhibition. Note that here,
as in Figure 3.4A, we observed an increased binding of the Dll1ext-Fc detection reagent in cell lines
expressing Fringe proteins. However, when Lfng or Mfng is expressed, only Dll1, and not Jag1, is
able to reduce Notch availability to background levels.
Together, these results suggest that Fringe expression modulates cis-inhibition between Notch1
receptor and ligands. Lfng and Mfng preserve and possibly strengthen interactions between Notch1

48
and Dll1, in cis and in trans, and weaken interactions between Notch1 and Jag1, in cis and in trans,
while Rfng preserves or enhances the cis interactions with both ligands. Thus, the effects of Fringe
proteins on cis interactions are in the same direction (strengthening or weakening) as their effects
on trans interactions.
3.5 Lfng enables cells to receive from Dll1 ligands at high
cis-Jag1 levels
Because Lfng or Mfng expression weakens Notch1-Jag1 cis interactions, a Lfng-expressing cell could
maintain high expression levels of cis-Jag1 without compromising its ability to receive signals from
trans-Dll1 ligands through Notch1. To test this prediction, we used the movie assay (2.5) to titrate
ligand levels over time in individual cells.
We constructed cell lines constitutively expressing the diverted Notch1 receptor and activity
reporter, along with the tetracycline-inducible Jag1-mCherry ligand (Components from Figure 1.4).
Finally, to analyze the effect of Lfng on Notch1-Jag1 cis-inhibition, we added to this parental cell
line a stably-integrated, constitutively-expressed Lfng gene. We also constructed similar cell lines
with Dll1-mCherry in place of Jag1-mCherry.
In the parental cell lines without Lfng, Notch reporter activation was delayed until Jag1-mCherry
levels diluted away, becoming active after 24h, indicative of cis-inhibition (Figure 3.5B). By contrast,
the cell line with Lfng responded earlier to the plate-bound Dll1ext-Fc despite high cis-Jag1 levels,
and not significantly later than in cells lacking ligand expression altogether, indicating that Lfng
reduces Notch1-Jag1 cis interactions. Thus, Lfng prevents high cis-Jag1 levels from blocking Notch
activation (Figure 3.5B,C).
In contrast, when we performed the same experiment with cell lines expressing Dll1-mCherry, we
observed no corresponding relief of cis-inhibition due to Lfng, suggesting that Lfng does not weaken
Dll1-Notch1 cis interactions. These results, consistent with those from the availability assay, support
the finding that Lfng inhibits Jag1-Notch1, but not Dll1-Notch1, cis-inhibition.
3.6 Summary of key findings
In summary, we compared the abilities of Dll1 and Jag1 to interact with Notch1 in trans and in
cis. We found that the Notch1-Dll1 interaction was stronger than the Notch1-Jag1 in both cases.
We also directly demonstrated that the cis interaction is mutually inhibitory by showing a decrease
in ligand availability contingent on receptor expression. Finally, we showed that Fringe protein
expression can modulate the cis interaction, and that they do so similarly to how they affect trans
interactions. Lfng and Mfng strength the interactions between Notch1 and Dll1 while blocking the

49
Notch + Jag1+Lfng+Mfng+Rfng
Notch + Dll1+Lfng+Mfng+Rfng
Dll1 onlyNotch1 + Dll1+Lfng
+Rfng+Mfng
102 103 104
102
103
104
Effective total ligand (AFU)
Ja
g1
ava
ilab
ility
(A
FU
)
Jag1 onlyNotch1 + Jag1+Lfng
+Rfng+Mfng
A
102 103101
102
103
Effective total ligand (AFU)
Dll1
ava
ilab
ility
(A
FU
)
B
102 103
10-1
100
Effective total ligand (AFU)
No
tch
1 a
va
ilab
ility
(A
FU
)
102 103
102
103
102 103 10410-1
100
Effective total ligand (AFU)
No
tch
1 a
va
ilab
ility
(A
FU
)
102 103 104
102
103
104
C D
Figure 3.4: Mammalian Fringe proteins modulate cis interactions. (A) Available Notch1 levels forthe Notch1+Dll1 cell line without Fringe (red) or with Lfng (magenta), Mfng (orange), or Rfng(blue). Lines are fits to model. Addition of any of the three Fringes accelerates the drop-off ofNotch1 availability. In the inset, the same data, but unnormalized, shows that addition of any of thethree Fringe proteins does not prevent available Notch1 from reaching background levels. (B) Dll1availability for the cell lines from A. (C) Similar to A, but for the Notch1+Jag1 cell lines. Additionof Lfng and Mfng prevents the depletion of Notch1 availability, while addition of Rfng acceleratesdepletion of Notch1 availability. In the inset, the unnormalized data shows that Lfng or Mfng, butnot Rfng, can block the ability of Jag1 to reduce Notch1 availability to background levels. (D) Jag1availability for the cell lines in C. In all panels, points represent medians of data points in evenlyspaced bins taken along the log of the x-axis. Error bars are the 95% confidence intervals of thebootstrapped estimated of the bin medians. Solid lines are model fits to the single-cell data. Graybars denote the 25-75th percentile fluorescence range of stained parental CHO-K1 cells that do notexpress Notch1 or ligands.

50
Figure 3.5: Lfng allows trans-signaling from Dll1 despite high cis-Jag1 levels. (A) Typical moviefilmstrip. (B) Quantification of movies of the Notch1+Jag1 and Notch1+Dll1 cell lines, with andwithout Lfng. Points show the mean fluorescence of all cells in a single frame. The cell line withLfng responds earlier than the cell line without Lfng, reflecting a weaker cis interaction betweenJag1 and Notch1. The time when the YFP slope exceeds a threshold, defined as 10% of the finalYFP slope, is marked as ton. (C) Quantification of the ligand levels at ton for each cell line. Valuesare the average of two movies. Notch activity occurs even at high cis-Jag1 levels in the +Lfng, butnot the Lfng, cell line. Notch responses occurred only at low ligand levels for the Dll1-mCherry celllines, with and without Lfng.

51
interactions between Notch1 and Jag1. Rfng strengthens the ligand-receptor interactions for both
pairs. Together, these data suggest that cis and trans interaction strengths are related and are
modulated by Fringe modification similarly. In the next chapter, we explore what signaling states
are enabled by our findings.

52
Chapter 4
Implications for developmentalprocesses
In the previous chapter, we measured the interactions between different Notch receptor-ligand pairs
and found distinct effects of Fringe expression on these interactions. In this chapter, we discuss the
consequences of these findings for Notch-dependent developmental processes.
First, we show that the ability of Fringe proteins to modulate cis interactions can also be observed
in the in vivo context of fly wing development. Next, we return to the concept of signaling states
from Chapter 1 and show how our results constrain the set of possible signaling states. We show
that a new signaling state enables a cell to send and receive signal simultaneously, and that this
state may be used during a highly conserved Notch patterning circuit, Fringe-dependent boundary
formation, first introduced in Chapter 1. Finally, we explore future directions for this work. We
speculate on the landscape of signaling states that are as of yet unexplored, and what behaviors
could be possible. Finally, we consider how this data and this approach could resolve outstanding
puzzles related to Notch signaling.
4.1 Fringe differentially affects Delta-Notch and Delta-Serrate
cis-inhibition phenotypes in Drosophila wing develop-
ment
Our collaborators in the lab of Dr. Hamed Jafar-Nejad at Baylor are experts on the effects of gly-
cosylation on Notch signaling and Drosophila genetics, and worked with us to develop experiments
to test our cell-culture findings in fruit flies. To determine whether Fringe modulation of cis in-
teractions occurs in a developmental context, we turned to the Drosophila wing imaginal disc as a
model system. The Notch pathway in Drosophila has fewer components than in vertebrates, with
just a single Notch receptor, two ligands, Delta and Serrate (related to vertebrate Jagged), and a

53
single Fringe (related to Lfng, Mfng, and Rfng). However, previous work has established both an
effect of Fringe on trans interactions that is qualitatively similar to the mammalian Lfng and Mfng.
Drosophila Fringe enhances Delta-Notch trans-activation and blocks Serrate (related to vertebrate
Jagged ligands) trans-activation. Moreover, flies show a clear role for cis-inhibition of Notch by its
ligands Delta and Serrate (related to mammalian Jag1) in wing disc development [10].
The adult Drosophila wing is patterned with five wing veins (Figure 4.1A). Along the edge of the
wing is a smooth margin lined with bristles. Removing one copy of Notch results in thickening of the
wing veins and the classic “notching” of the wing margin (Figure 1.1 and 4.1B and E). If Notch and
its ligands were solely involved in trans-activation, one would expect these Notch haploinsufficient
phenotypes would be enhanced by a simultaneous decrease in ligand expression. However, loss of
one copy of Delta was reported to suppress the Notch+/– wing vein phenotype, indicating that the
haploinsufficient phenotypes observed in Notch+/– animals are caused by cis-inhibition of Notch due
to an increase in the relative levels of ligands to Notch [11].
Our results from Chapter 3 indicated that Lfng and Mfng preserve the cis-inhibition of Notch by
Dll1 but weaken the cis-inhibition of Notch by Jag1. To examine whether Drosophila Fringe affects
the ability of Delta and Serrate to cis-inhibit Notch in a manner similar to Lfng and Mfng, we
performed genetic interaction studies in a Notch+/– background, which seems to be more sensitive
to cis-inhibition by ligands.
First, we established that Delta and Serrate have distinct cis-inhibition phenotypes. To this end,
we first generated transgenic flies harboring the Delta locus (Dlgt-wt) or the Serrate locus (Sergt-wt),
in which the expression of Delta or Serrate is driven by endogenous promoter/enhancers, and showed
that these transgenes behave similarly to their endogenous counterparts in flies. Animals with one
or two copies of the Dlgt-wt transgene in a wild-type background did not exhibit any wing defects.
However, in Notch+/– animals, one additional copy of the Dlgt-wttransgene (3x Delta dosage) resulted
in a slight increase in the penetrance of mild wing margin defects adjacent to the L3 vein and a
moderate enhancement of the wing vein thickening (Figure 4.1C). Two copies of Dlgt-wt (4x Delta
dosage) strongly enhanced the wing vein thickening phenotype in Notch+/– animals (Figure 4.1D).
These flies also showed a moderate enhancement of the wing margin loss phenotype (Figure 4.1D).
These observations indicate that although Delta-Notch cis-inhibition affects both wing vein and
wing margin formation, Notch is more sensitive to Delta cis-inhibition during wing vein formation.
The effects of increasing the gene dosage of Serrate on the Notch haploinsufficient phenotypes
were quite different from those of increasing Delta dosage. Two copies of the Sergt-wt transgene did
not cause any wing abnormalities in a wild-type background. However, one copy of Sergt-wt (3x
Serrate dosage) significantly enhanced the wing margin loss phenotype of Notch+/- animals without
affecting their wing vein phenotype (Figure 4.1F). A second copy of Sergt-wt (4x Serrate dosage)
further enhanced the wing margin loss (Figure 6F). Indeed, 43% of the Notch+/– Sergt-wt/ Sergt-wt

54
A
wild-type
12
3
4
5
B
N55e11/+ N55e11/+ Dlgt-wt/+
C D
N55e11/+ Dlgt-wt/Dlgt-wt
3X Delta 4X Delta
Increasing Delta levels in 1x Notch background
Loss of one copy of Notch (1X)
Wildtype Serrate levels (2X) 3X Serrate 4X Serrate
Increasing Serrate levels in 1x Notch background
N55e11/+ Sergt-wt/Sergt-wt
GE
N55e11/+ N55e11/+ Sergt-wt/+
F
Wildtype fly wing
Loss of one copy of Notch (1X)
Wildtype Delta levels (2X)
Figure 4.1: Delta and Serrate have distinct cis-inhibition phenotypes in the fly wing. (A) A wildtypefly wing, with each of the five wing veins numbered. (B) and (E) Fly wing with one copy of Notchremoved (1X Notch). There is a slight wing margin loss in the L3 vein region. (B-D) The effectsof increasing Delta dosage in a 1X Notch background. As the ratio of Delta to Notch expressionincreases, the vein thickening phenotype worsens, while the wing margin in the L3 vein regionincreases only slightly. (E-G) The effects of increasing Serrate dosage in a 1X Notch background aremarkedly different. As the ratio of Serrate to Notch expression increases, the wing margin defectsgrow more severe, extending to the L4 vein and to anterior regions of the wing (red arrows), whilethe vein width remains relatively normal.

55
wings showed severe wing margin loss extending to the L3 and L4 wing veins and also in anterior
regions of the wing, which was not observed in any of the other genotypes analyzed (Figure 4.1F).
Of note, despite their severe wing margin loss, Notch+/; Sergt-wt/Sergt-wt animals only showed a
mild enhancement of the wing vein thickening compared to Notch+/– flies (Figure 4.1G, compare
to 4.1E). These observations indicate that although both Delta and Serrate can cis-inhibit Notch
during wing development, Notch is more sensitive to cis-Delta during wing vein formation and more
sensitive to cis-Serrate during wing margin formation.
Next, we tested whether and how altering Fringe activity changed these distinct Delta and Serrate
cis-inhibition phenotypes. We used fringe13 and fringeL73 strains that harbor severe loss-of-function
alleles with nonsense mutations in Fringe. Animals heterozygous for fringe have normal wings (ref).
However, loss of one copy of Fringe alters the Notch haploinsufficient wing margin and wing vein
phenotypes in opposite directions: it enhances the Serrate-dependent wing margin loss but suppresses
the Delta-dependent wing vein thickening (Figure 4.2). Addition of one copy of Serrate, but not one
copy of Dl, enhances the wing margin loss in Notch+/-; fng+/- animals (Figure 4.2D, F). Indeed,
even in fng+/- animals with wild-type Notch gene dosage, addition of a copy of Serrate results in a
low penetrance mild wing margin loss (Figure 4.2F ). Altogether, our observations strongly support
the conclusion that during Drosophila wing development, Fringe increases the sensitivity of Notch
to cis-Delta but decreases its sensitivity to cis-Serrate, similar to the effect of Lfng and Mfng in the
mammalian context.
4.2 The repertoire of Notch signaling states with Notch and
Dll1 or Jag1 ligands
Interactions between Notch ligands and receptors, both in cis and in trans, control the quantitative
ability of cells to send or receive signals. Recent work with cells expressing one ligand and one
receptor, Dll1 and Notch1, showed that strong and mutually inactivating cis interactions between
Dll1 and Notch1 can force cells into mutually exclusive signaling states [51]. But does the exclusivity
of sending and receiving states in this simple setting persist in more complex contexts that involve
multiple ligands and modulation by Fringe proteins?
To answer this question, we must consider how cis and trans interactions, together with Fringe
proteins, specify a particular set of signaling states, and how those states determine the directionality
and specificity of signaling. With the data from Chapter 3, we can extrapolate to map the possible
signaling states for cells expressing Notch1, Dll1 or Jag1 ligands, and one of the three mammalian
Fringes. We consider signaling states for cells with extreme ratios of receptor to ligand and ligand to
receptor, at either very low or very high Fringe levels. Signaling behaviors at intermediate receptor-
to-ligand ratios and at lower Fringe levels may show different quantitative capacities to send or

56
N55e11/+ fng13/+ Sergt-wt/+
F
B
N55e11/+ fng13/+
N55e11/+ fng13/+ Dlgt-wt/+
D
N55e11/+ Sergt-wt/+
E
N55e11/+ Dlgt-wt/+
C
A
N55e11/+
Loss of one copy of Fringe
Figure 4.2: Decreasing Fringe activity improves Delta cis-inhibition phenotypes and worsens Serratecis-inhibition phenotypes. (A) A wing of a fly missing one copy of Notch. (B) Removing a copyof Fringe from the fly in A results in more wing margin loss. (C) Fly from Figure 4.1C with onecopy of Fringe removed and one copy of Delta added (1x Notch, 3x Delta). We see strong veinthickening while the margin loss from A is slightly increased. (D) Removing a copy of Fringe fromthe background in C results in an improvement of the wing vein phenotype. The wing margin lossis not significantly worse than that observed in the fly in B. (E) The fly from Figure 4.1F with onecopy of Notch removed and one copy of Serrate added (1x Notch, 3x Serrate). (F) Removing a copyof Fringe from the background in E results in severe wing margin loss, much more than seen in B,with defects extending into anterior regions of the wing (red arrow). This phenotype resembles the1x Notch 4x Serrate fly from Figure 4.1G.

57
receive signal, but should show qualitatively similar signaling states.
For the Notch1+Dll1 cells, all three Fringe proteins maintained or strengthened mutually in-
hibitory cis interactions between Dll1 and Notch1. Thus, with or without Fringe expression, the
ability of cells to send or recieve depends on the relative levels of Notch1 and Dll1 (Figure 4.3A,B).
Rfng preserves or strengthens Notch1 interactions with both Dll1 and Jag1, in cis and trans. As a
result, Rfng expression maintains the same qualitative send or receive signaling states as observed
without Rfng (Figure 4.3CA and 4.3CB, second and third panels). On the other hand, Lfng and
Mfng preserve or strengthen Notch1-Dll1 cis interactions. Consequently, their expression leads a
receiving state (only from Dll1, not Jag1) (Figure 4.3A, first panel), without affecting the sending
state (Figure 4.3B, first and third panels). Thus, for a cell expressing Notch1 and Dll1, none of the
Fringe proteins appear to disrupt the exclusivity of sending and receiving capabilities.
The picture is different, however, for Notch1+Jag1 cells (Figure 4.3C,D). Without Fringe, these
cells exhibit exclusive send and receive states (Figure 4.3C). Rfng enhances cis and trans Notch1-
Jag1 interactions (Figure 4.3D, first and second panels), maintaining exclusive sending and receiving
signaling states. However, expression of Lfng or Mfng leads to a qualitatively different behavior: By
weakening Jag1-Notch1 cis interactions, Lfng/Mfng expression enables cells to have Notch1 and Jag1
simultaneously available on the cell surface. A cell in this signaling state could use Notch1 to receive
from trans-Dll1 ligands (but not from Jag1, as Lfng/Mfng block Jag1-Notch1 trans signaling), while
also activating other cells with the Jag1 ligand (Figure 4.3CD, fourth panel). Thus, a cell expressing
Lfng/Mfng, Jag1, and Notch1 can send and receive simultaneously, but only using different ligands.
A cell in this signaling state would not respond efficiently to Jag1 expressed by other cells in the
same state because Lfng/Mfng reduces its response to trans Jag1. Evidently, the Notch pathway does
allow for simultaneous sending and receiving, but the logic of the receptor and ligand interactions
prevents this from occurring among cells in the same signaling state.
For the ligands we studied, Lfng and Mfng have identical effects on cis and trans interactions
provoking the question of whether Lfng and Mfng have distinct roles. One possibility is suggested
by recent experimental work on the subsequent sugar modifications to the Fringe-catalyzed GlcNAc
residues on Notch [27]. Mutant CHO cells deficient in the addition of galactose to GlcNAc on
Notch [27] were shown to be unable to support the Lfng or Mfng-dependent inhibition of Jag1-
Notch1 trans signaling, further suggesting that Lfng and Mfng function redundantly in this aspect
of Notch regulation. However, in mutant CHO cells, Lfng could not enhance trans signaling by Dll1,
suggesting that galactose addition is required for this effect of Lfng. In sharp contrast, the ability of
Mfng to promote Dll1-Notch1 trans signaling did not depend on galactose, and was indeed enhanced
in galactosylation-deficient cells. The differential effects of each Fringe depending on the activity of
downstream enzymes suggest that the Fringes are not functionally identical.

58
Figure 4.3: Signaling states of the Notch pathway. Each cartoon denotes a distinct configuration ofNotch pathway components, with the resulting signaling state indicated schematically below. Weconsider extreme endpoints, where Notch1 expression is much higher than ligand expression (Notch1> ligand, light shaded panels), and where ligand expression is much higher than Notch1 expression(Ligand > Notch1, dark shaded panels). We also consider either low (A and C) or very high levels ofFringe expression (B and D). (A) A cell expressing Notch1 and Dll1 can be in a receiving state, whereit can be activated by trans Dll1 or Jag1, when Notch1 levels surpass Dll1 levels, left. A Dll1-sendingstate occurs when Dll1 exceeds Notch1, right. (B) With the addition of Lfng or Mfng, the receivingstate in A becomes sensitive to trans-Dll1 but not trans-Jag1 (left). Rfng enhances receiving fromboth ligands (middle). Any of the three Fringe proteins support the Dll1 sending state when Dll1exceeds Notch1 (right). (C) Co-expression of Notch1 and Jag1 permits exclusive sending (right) orreceiving (left) signaling states, similar to those in A. (D) Cells expressing Notch1, Jag1, and Rfngshow exclusive send or receive signaling states as in A and C (first two panels). However, addition ofLfng or Mfng inhibits Notch1-Jag1 cis interactions. As a result, these cells can receive signals fromDll1 but not Jag1 when Notch1 expression exceeds Jag1 expression (third panel). Finally, when Jag1exceeds Notch1, the cell can send with Jag1 and receive from Dll1 simultaneously (right panel).
59
4.3 A proposed model for dorsoventral boundary formation
in the wing disc
With our new knowledge of signaling states summarized in Figure 4.3, we return to the boundary
formation process at the dorsoventral interface of the developing fly wing, first introduced in Section
1.9. We recall that cells within the dorsal and ventral compartments of the wing disc signal to one
another, forming a sharp stripe of Notch activation at the interface between the two cell populations
(Figure 1.8). This picture of boundary formation appeared to challenge our model of exclusive send
and receive signaling states (Figure 1.6), because cells on either side of the boundary are all capable
of receiving a signal [10]. But if all cells are in a receiving state, and signaling is occurring, then some
cells must also possess the capacity to send signal. We propose a model that incorporates the ability
of Fringe to modulate cis interactions, and show that we can resolve this apparent discrepancy.
In this patterning process, multiple ligands and Fringe are required for signaling. Cells in the
dorsal compartment express Notch, Delta, Serrate, and Fringe, while cells in the ventral express
Notch and Delta only (Figure 4.4). Because ventral cells only express Notch and Delta, they thus
resemble our original one-ligand one-receptor model from Figure 1.6. Because ventral cells are
initially capable of receiving, they should have an excess of Notch over Delta, as shown in Figure
4.4A (ventral).
Next, we turn to dorsal cells, which express multiple ligands—Delta and Serrate—and Fringe.
Because dorsal cells are initially in a receiving state [10], their Delta must be eliminated in cis
interactions with Notch. cis-inhibition of Delta could thus explain why dorsal cells do not signal
to one another, even though they express and are responsive to Delta. At the same time, Fringe
could allow Serrate and Notch to both remain available simultaneously (Figure 4.4 , dorsal), a state
resembling that in Figure 4.3D (far right panel). Because Fringe blocks Serrate-Notch signaling,
dorsal cells cannot signal to one another, but can signal to dorsal cells at the boundary. In this
configuration, signaling can occur only from dorsal to ventral cells.
Notch activation in ventral cells causes them to up-regulate Delta expression, switching them
to a Delta-sending state [10] [16] . Now, ventral cells are able to trans-activate dorsal cells, which
remain responsive to Delta (Figure 4.4B).
Recent experimental results in the fly wing are consistent with this model of a two-step, sequential
signaling process. Troost and Klein recently examined signaling at the boundary with higher time
resolution than in previous work. They found that signaling occurred in two sequential phases [54]:
first, dorsal cells signal via Serrate to ventral cells. Subsequently, ventral cells up-regulate Delta and
signal back to dorsal cells. A similar model was proposed based on early studies of Delta-expressing
clones at the boundary [16].
This model can also explain experimental results related to misexpression of ligands. Serrate

60
overexpression perpendicular to the DV boundary was found to block Notch signaling on both sides
of this boundary. This result was taken as evidence that Fringe does not prevent cis-interactions
[21]. However, in light of our model, we propose an alternative potential explanation: Serrate
overexpression cis-inhibits ventral cells, interrupting the first step of signaling in the sequential
signaling process. Our model predicts that dorsal cells would still be capable of receiving a signal
even at high Serrate levels, as Fringe prevents Serrate-Notch cis-inhibition. A possible way to test
this idea would be to misexpress Delta ligands in the region of Serrate overexpression to test if dorsal
cells retain the ability to receive signals.
Evidence for cis-inhibition of a ligand by the Notch receptor has been observed in the late stages
of dorsoventral boundary formation in the Drosophila wing [3]. Specifically, the Notch receptor
was shown to cis-inhibit the Serrate ligand by promoting Serrate endocytosis in dorsal and ventral
cells [3]. The observation that at this stage both dorsal and ventral cells express fringe [39] might
seem not to be in agreement with our proposed model. We do not feel this observation conflicts
with out hypothesis, as we propose that Notch-Serrate cisinteractions are weakened, but not com-
pletely eliminated, by Fringe. Further, we make no claims as to the localization of the cisinhibition
complexes; it is possible that receptor-ligand cis-inhibition between Notch and Delta does occur,
but does not result in clearance of Delta from the surface. These ligand-specific differences in the
ultimate location and fate of the receptor-ligand cis-inhibition complexes remain to be explored.
4.4 Exploration of signaling states with multiple pathway
components
With even a few components and simple interactions, a cell’s signaling behavior can be sufficiently
complex to require mathematical modeling to predict outcomes. Using our model from Chapter 2
and incorporating our findings from Chapter 3, as well as data from other recent studies, we can begin
to hypothesize the signaling behaviors of cells expressing complex configurations of components. We
explore a few examples to illustrate the approach.
In the boundary formation model from Section 4.3, we predicted that a cell expressing Notch,
Delta/Dll1, Serrate/Jagged and Fringe/Lfng or Mfng should be able to send with Serrate/Jag1 and
receive from Delta/Dll1. We can investigate this behavior in silico by incorporating additional terms
describing the cis interactions of a second ligand into Equations 2.4. We show that if the ratio of the
cis interaction strengths is sufficiently large, we can see that the ligand with the stronger interaction
in cis will be preferentially inactivated by Notch (Delta/Dll1), leaving the ligand with the weaker
interaction (Serrate/Jag1) available on the surface; in fact, its availability is higher than would be
observed if it were expressed alone (Figure 4.5).
We can go further to speculate on what could happen with additional ligands and receptors.

61
SerrateD V
Notch activation in ventral
cells upregulates Delta
First signaling step
Dl sender
D V
Second signaling step
Ser sender
Dl receiver
Fringe
Fringe
Dl/Ser
receiver
Ser sender
Dl receiver
DeltaNotch
D V
Sharp stripe of signaling
at the DV boundary
A
B
C
Figure 4.4: A model for Notch signaling states during dorsal-ventral boundary formation in theDrosophila wing disc. (A) Initially, ventral cells (light blue) express more Notch than Delta, andare able to receive signals. Dorsal cells (light green) express Serrate, Notch, Delta and Fringe.Fringe promotes Delta-Notch cis interactions but weakens Serrate-Notch cis interactions, enablingdorsal cells to simultaneously receive signals from Delta while sending signals with Serrate. BecauseFringe reduces the response of Notch to trans-Serrate, dorsal cells cannot receive signals from otherdorsal cells. Thus, the first signaling step occurs from dorsal to ventral cells (green arrow). (B)In response to Notch activation, ventral cells up-regulate Delta expression, switching to a sendingstate, and trans-activating dorsal cells. (C) The result is the observed pattern of Notch activationat the boundary of the dorsal and ventral compartments.

62
100 101 102 103
10-2
10-1
100
101
102
103
Total ligand production
Fre
e p
rote
in le
ve
l o
n c
ell
su
rfa
ce
Notch1Dll1Jag1
Dll1 Jag1
Sending
Receiving
Jag1 Sending
Figure 4.5: Model of a cell with Dll1, Jag1, and Notch1
There are to date few studies quantitatively comparing the interaction strengths in cis or in trans
for different ligand-receptor pairs. However, one recent study showed that Dll4 is a stronger trans-
activator of Notch1 than Dll1 [1]. Our findings so far suggest that the cis-interaction and trans-
interaction are correlated; under the hypothesis that this relationship holds for every ligand-receptor
pair, Dll4 should interact more strongly in cis with Notch1. This would lead to exclusive sending
and receiving states for a cell expressing Notch1 and Dll4. The susceptibility of the Notch1-Dll4
interactions to Fringe modification will determine whether or not it is possible to send and receive
simultaneously with this ligand.
It is not known what signaling states could be possible with the other Notch receptors. Prelimi-
nary work in immunology suggests that Notch3 shows an opposite preference for ligands compared
to Notch1 [55]. That is, where Notch1 shows the strongest trans-signaling when Dll4 is the stim-
ulating ligand, followed by Dll1/Jag2, with Jag1 as the weakest activating ligand, for Notch3 this
hierarchy is inverted. If we hypothesize that cis and trans interaction strengths are correlated for all
ligand-receptor pairs, and that Notch3 interactions are similarly susceptible to Fringe modification,
it could be possible that a simultaneous send/receive signaling state could occur with Notch3 and
Dll4. This hypothesis can be explored using our methods.
4.5 Our results could resolve contradictory findings
These results could help explain other puzzling observations. For example, one of the most striking
vertebrate Notch phenotypes is disorganized somitogenesis in Notch pathway mutants [29]. In mice
and chicks, Lfng is required for this process [34]. However, Lfng inhibits Notch1-Dll1 signaling [8],
rather than promoting signaling as expected from previous analysis of its effect on trans interactions

63
[26]. The ability of Lfng to strengthen Dll1-Notch1 cis interactions could explain this phenomenon,
since Lfng would tend to reduce the abundance of Dll1 and Notch1 available for trans signaling
interactions.
Indeed, the phenotype of Lfng mutant mice bears a striking resemblance to mice mutant for
Dll3, with mice showing skeletal malformations arising from disrupted somitogenesis [32, 58]. Dll3
is not able to trans-activate Notch, but can cis-inhibit Notch receptors [33]. Thus, the loss of Dll3
phenotype should reflect a loss of cis-inhibition and a gain of Notch signaling. Indeed, the Dll3 and
Lfng knockout phenotypes also bear a resemblance to mice where Notch activity is constitutively
driven with an NICD-GFP fusion [18]. Both the Dll3 and Lfng knockouts show distinctly different
effects on somitogenesis compared to a Dll1 knockout [28]. Dll1 knockout mice show a loss of Notch
signaling [18], as evidenced by a complete loss of Notch target gene expression. These animals are
unable to form somites of any kind. Because loss of Lfng results in defects that resemble loss of
Dll3, this implies that Lfng mutants reflect a loss of Notch activity due to cis-inhibition, and that
the normal role of Lfng could be to promote cis-inhibition in this process. This hypothesis remains
to be tested in vivo.
4.6 Future directions
Based on these results and others, different configurations of receptors and ligands, through cis
interactions, could work to specify distinct signaling states in cells (Figure 4.3). These states are
more complex than just ‘send’ and ‘receive’, but are still constrained by the logic of receptor-ligand
interactions. Understanding what signaling states are possible, and how cells in different signaling
states interact with one another, could provide a useful way to think about the Notch signaling
system.
However, many questions remain. We still lack systematic measurements of the interaction
strengths, in cis and in trans for the full repertoire of ligand-receptor pairs, and their quantitative
dependence on Fringe expression levels. Given that multiple Fringe proteins are co-expressed in many
systems, we will need to examine how Fringe proteins combine to influence Notch signaling. Are
their effects additive or could one Fringe dominate the effects of another? The approach described
here can distinguish between these hypotheses.
Another important avenue for research is the dynamics of Fringe modification. How quickly does
it take to detect the effects of Fringe on Notch activity? This question is especially important given
that Fringe expression is dynamically regulated in some contexts [8]. We can use the cell lines and
movie-based assays described in this thesis to explore this aspect of Notch regulation.
Finally, additional components beyond ligands, receptors, and Fringes may need to be incorpo-
rated into our model in order to develop a predictive view of Notch signaling. Nevertheless, we

64
anticipate that the experimental approaches developed here can be generalized to address these
questions and provide a deeper understanding of the basic design principles of the Notch signaling
pathway.

65
Bibliography
[1] M. B. Andrawes, X. Xu, H. Liu, S. B. Ficarro, J. A. Marto, J. C. Aster, and S. C. Blacklow.
Intrinsic selectivity of Notch 1 for Delta-like 4 over Delta-like 1. J Biol Chem, 288(35):25477–89,
2013.
[2] S. Artavanis-Tsakonas, M. D. Rand, and R. J. Lake. Notch signaling: Cell fate control and
signal integration in development. Science, 284(5415):770–6, 1999.
[3] I. Becam, U. M. Fiuza, A. M. Arias, and M. Milan. A role of receptor Notch in ligand cis-
inhibition in Drosophila. Curr Biol, 20(6):554–60, 2010.
[4] R. Benedito, C. Roca, I. Sorensen, S. Adams, A. Gossler, M. Fruttiger, and R. H. Adams. The
notch ligands Dll4 and Jagged1 have opposing effects on angiogenesis. Cell, 137(6):1124–35,
2009.
[5] S. J. Bray. Notch signalling: A simple pathway becomes complex. Nat Rev Mol Cell Biol,
7(9):678–89, 2006.
[6] K. Bruckner, L. Perez, H. Clausen, and S. Cohen. Glycosyltransferase activity of Fringe mod-
ulates Notch-Delta interactions. Nature, 406(6794):411–5, 2000.
[7] J. Cordle, S. Johnson, J. Z. Tay, P. Roversi, M. B. Wilkin, B. H. de Madrid, H. Shimizu,
S. Jensen, P. Whiteman, B. Jin, C. Redfield, M. Baron, S. M. Lea, and P. A. Handford. A
conserved face of the Jagged/Serrate DSL domain is involved in Notch trans-activation and
textitcis-inhibition. Nat Struct Mol Biol, 15(8):849–57, 2008.
[8] J. K. Dale, M. Maroto, M. L. Dequeant, P. Malapert, M. McGrew, and O. Pourquie. Pe-
riodic Notch inhibition by Lunatic Fringe underlies the chick segmentation clock. Nature,
421(6920):275–8, 2003.
[9] M. H. Dallas, B. Varnum-Finney, C. Delaney, K. Kato, and I. D. Bernstein. Density of the
Notch ligand Delta1 determines generation of B and T cell precursors from hematopoietic stem
cells. J Exp Med, 201(9):1361–6, 2005.

66
[10] J. F. de Celis and S. Bray. Feed-back mechanisms affecting Notch activation at the dorsoventral
boundary in the Drosophila wing. Development, 124(17):3241–51, 1997.
[11] J. F. de Celis and S. J. Bray. The Abruptex domain of Notch regulates negative interactions
between Notch, its ligands and Fringe. Development, 127(6):1291–302, 2000.
[12] J. F. de Celis, A. Garcia-Bellido, and S. J. Bray. Activation and function of Notch at the
dorsal-ventral boundary of the wing imaginal disc. Development, 122(1):359–69, 1996.
[13] A. de-la Concha, U. Dietrich, D. Weigel, and J. A. Campos-Ortega. Functional interactions of
neurogenic genes of Drosophila melanogaster. Genetics, 118(3):499–508, 1988.
[14] M. De Smedt, I. Hoebeke, K. Reynvoet, G. Leclercq, and J. Plum. Different thresholds of Notch
signaling bias human precursor cells toward b-, nk-, monocytic/dendritic-, or t-cell lineage in
thymus microenvironment. Blood, 106(10):3498–506, 2005.
[15] D. del Alamo, H. Rouault, and F. Schweisguth. Mechanism and significance of cis-inhibition in
Notch signalling. Curr Biol, 21(1):R40–7, 2011.
[16] D. Doherty, G. Feger, S. Younger-Shepherd, L. Y. Jan, and Y. N. Jan. Delta is a ventral to
dorsal signal complementary to serrate, another notch ligand, in drosophila wing formation.
Genes Dev, 10(4):421–34, 1996.
[17] B. D’Souza, L. Meloty-Kapella, and G. Weinmaster. Canonical and non-canonical notch ligands.
Curr Top Dev Biol, 92:73–129, 2010.
[18] J. Feller, A. Schneider, K. Schuster-Gossler, and A. Gossler. Noncyclic Notch activity in the
presomitic mesoderm demonstrates uncoupling of somite compartmentalization and boundary
formation. Genes Dev, 22(16):2166–71, 2008.
[19] U. M. Fiuza, T. Klein, A. Martinez Arias, and P. Hayward. Mechanisms of ligand-mediated
inhibition in Notch signaling activity in Drosophila. Dev Dyn, 239(3):798–805, 2010.
[20] R. J. Fleming, K. Hori, A. Sen, G. V. Filloramo, J. M. Langer, R. A. Obar, S. Artavanis-
Tsakonas, and A. C. Maharaj-Best. An extracellular region of Serrate is essential for ligand-
induced cis-inhibition of Notch signaling. Development, 140(9):2039–49, 2013.
[21] M. Glittenberg, C. Pitsouli, C. Garvey, C. Delidakis, and S. Bray. Role of conserved intracellular
motifs in Serrate signalling, cis-inhibition and endocytosis. Embo j, 25(20):4697–706, 2006.
[22] M. Gossen and H. Bujard. Tight control of gene expression in mammalian cells by tetracycline-
responsive promoters. Proc Natl Acad Sci U S A, 89(12):5547–51, 1992.
[23] I. Greenwald. Notch and the awesome power of genetics. Genetics, 191(3):655–69, 2012.

67
[24] K. G. Guruharsha, M. W. Kankel, and S. Artavanis-Tsakonas. The Notch signalling system:
recent insights into the complexity of a conserved pathway. Nat Rev Genet, 13(9):654–66, 2012.
[25] S. Hammond, M. Kaplarevic, N. Borth, M. J. Betenbaugh, and K. H. Lee. Chinese ham-
ster genome database: An online resource for the CHO community at www.CHOgenome.org.
Biotechnol Bioeng, 109(6):1353–6, 2012.
[26] C. Hicks, S. H. Johnston, G. diSibio, A. Collazo, T. F. Vogt, and G. Weinmaster. Fringe
differentially modulates Jagged1 and Delta1 signalling through Notch1 and Notch2. Nat Cell
Biol, 2(8):515–20, 2000.
[27] X. Hou, Y. Tashima, and P. Stanley. Galactose differentially modulates lunatic and manic
Fringe effects on Delta1-induced Notch signaling. J Biol Chem, 287(1):474–83, 2012.
[28] M. Hrabe de Angelis, n. McIntyre, J., and A. Gossler. Maintenance of somite borders in mice
requires the Delta homologue Dll1. Nature, 386(6626):717–21, 1997.
[29] K. D. Irvine. Fringe, Notch, and making developmental boundaries. Curr Opin Genet Dev,
9(4):434–41, 1999.
[30] A. C. Jaleco, H. Neves, E. Hooijberg, P. Gameiro, N. Clode, M. Haury, D. Henrique, and
L. Parreira. Differential effects of Notch ligands Delta-1 and Jagged-1 in human lymphoid
differentiation. J Exp Med, 194(7):991–1002, 2001.
[31] R. Kopan and M. X. Ilagan. The canonical Notch signaling pathway: Unfolding the activation
mechanism. Cell, 137(2):216–33, 2009.
[32] K. Kusumi, E. S. Sun, A. W. Kerrebrock, R. T. Bronson, D. C. Chi, M. S. Bulotsky, J. B.
Spencer, B. W. Birren, W. N. Frankel, and E. S. Lander. The mouse pudgy mutation disrupts
Delta homologue Dll3 and initiation of early somite boundaries. Nat Genet, 19(3):274–8, 1998.
[33] E. Ladi, J. T. Nichols, W. Ge, A. Miyamoto, C. Yao, L. T. Yang, J. Boulter, Y. E. Sun,
C. Kintner, and G. Weinmaster. The divergent DSL ligand Dll3 does not activate Notch
signaling but cell autonomously attenuates signaling induced by other DSL ligands. J Cell
Biol, 170(6):983–92, 2005.
[34] J. Lewis. Notch signalling and the control of cell fate choices in vertebrates. Semin Cell Dev
Biol, 9(6):583–9, 1998.
[35] C. Y. Logan and R. Nusse. The Wnt signaling pathway in development and disease. Annu Rev
Cell Dev Biol, 20:781–810, 2004.

68
[36] U. Marklund, E. M. Hansson, E. Sundstrom, M. H. de Angelis, G. K. Przemeck, U. Lendahl,
J. Muhr, and J. Ericson. Domain-specific control of neurogenesis achieved through patterned
regulation of Notch ligand expression. Development, 137(3):437–45, 2010.
[37] L. Meloty-Kapella, B. Shergill, J. Kuon, E. Botvinick, and G. Weinmaster. Notch ligand
endocytosis generates mechanical pulling force dependent on dynamin, epsins, and actin. Dev
Cell, 22(6):1299–312, 2012.
[38] C. A. Micchelli, E. J. Rulifson, and S. S. Blair. The function and regulation of cut expression
on the wing margin of Drosophila: Notch, Wingless and a dominant negative role for Delta and
Serrate. Development, 124(8):1485–95, 1997.
[39] M. Milan and S. M. Cohen. Temporal regulation of apterous activity during development of
the Drosophila wing. Development, 127(14):3069–78, 2000.
[40] A. C. Miller, E. L. Lyons, and T. G. Herman. cis-inhibition of Notch by endogenous Delta
biases the outcome of lateral inhibition. Curr Biol, 19(16):1378–83, 2009.
[41] O. L. Mohr. Character Changes Caused by Mutation of an Entire Region of a Chromosome in
Drosophila. Genetics, 4(3):275–82, 1919.
[42] D. J. Moloney, V. M. Panin, S. H. Johnston, J. Chen, L. Shao, R. Wilson, Y. Wang, P. Stanley,
K. D. Irvine, R. S. Haltiwanger, and T. F. Vogt. Fringe is a glycosyltransferase that modifies
Notch. Nature, 406(6794):369–75, 2000.
[43] T. H. Morgan. The Theory of the Gene. New Haven,Yale University Press;, 1928.
http://www.biodiversitylibrary.org/bibliography/5978.
[44] T. H. Morgan and C. B. Bridges. Sex-Linked Inheritance in Drosophila. Washington, Carnegie
Institution of Washington. http://www.biodiversitylibrary.org/bibliography/22854.
[45] T. K. Noah and N. F. Shroyer. Notch in the intestine: Regulation of homeostasis and patho-
genesis. Annu Rev Physiol, 75:263–88, 2013.
[46] N. Perrimon, C. Pitsouli, and B. Z. Shilo. Signaling mechanisms controlling cell fate and
embryonic patterning. Cold Spring Harb Perspect Biol, 4(8):a005975, 2012.
[47] L. K. Phng and H. Gerhardt. Angiogenesis: A team effort coordinated by Notch. Dev Cell,
16(2):196–208, 2009.
[48] R. G. Ramos, B. G. Grimwade, K. A. Wharton, T. N. Scottgale, and S. Artavanis-Tsakonas.
Physical and functional definition of the Drosophila Notch locus by p element transformation.
Genetics, 123(2):337–48, 1989.
69
[49] K. Shimizu, S. Chiba, K. Kumano, N. Hosoya, T. Takahashi, Y. Kanda, Y. Hamada, Y. Yazaki,
and H. Hirai. Mouse Jagged1 physically interacts with Notch2 and other Notch receptors.
Assessment by quantitative methods. J Biol Chem, 274(46):32961–9, 1999.
[50] D. Sprinzak, A. Lakhanpal, L. LeBon, J. Garcia-Ojalvo, and M. B. Elowitz. Mutual inactiva-
tion of Notch receptors and ligands facilitates developmental patterning. PLoS Comput Biol,
7(6):e1002069, 2011.
[51] D. Sprinzak, A. Lakhanpal, L. Lebon, L. A. Santat, M. E. Fontes, G. A. Anderson, J. Garcia-
Ojalvo, and M. B. Elowitz. Cis-interactions between Notch and Delta generate mutually exclu-
sive signalling states. Nature, 465(7294):86–90, 2010.
[52] P. Stanley and T. Okajima. Roles of glycosylation in Notch signaling. Curr Top Dev Biol,
92:131–64, 2010.
[53] G. Struhl and A. Adachi. Nuclear access and action of Notch in vivo. Cell, 93(4):649–60, 1998.
[54] T. Troost and T. Klein. Sequential Notch signalling at the boundary of Fringe expressing and
non-expressing cells. PLoS One, 7(11):e49007, 2012.
[55] I. Van de Walle, E. Waegemans, J. De Medts, G. De Smet, M. De Smedt, S. Snauwaert, B. Van-
dekerckhove, T. Kerre, G. Leclercq, J. Plum, T. Gridley, T. Wang, U. Koch, F. Radtke, and
T. Taghon. Specific Notch receptor-ligand interactions control human TCR-αβ/γδ development
by inducing differential Notch signal strength. J Exp Med, 210(4):683–97, 2013.
[56] A. Xu, N. Haines, M. Dlugosz, N. A. Rana, H. Takeuchi, R. S. Haltiwanger, and K. D. Irvine.
In vitro reconstitution of the modulation of Drosophila Notch-ligand binding by Fringe. J Biol
Chem, 282(48):35153–62, 2007.
[57] L. T. Yang, J. T. Nichols, C. Yao, J. O. Manilay, E. A. Robey, and G. Weinmaster. Fringe
glycosyltransferases differentially modulate Notch1 proteolysis induced by Delta1 and Jagged1.
Mol Biol Cell, 16(2):927–42, 2005.
[58] N. Zhang, G. V. Martin, M. W. Kelley, and T. Gridley. A mutation in the Lunatic fringe gene
suppresses the effects of a Jagged2 mutation on inner hair cell development in the cochlea. Curr
Biol, 10(11):659–62, 2000.

70
Appendix: Cis interactionsbetween Notch and Delta generatemutually exclusive signaling states
This paper appeared in the May 6, 2010 edition of Nature. I contributed to the experimentation
and data analysis for the main figures, and also to the Discussion section.
Abstract
The Notch-Delta signalling pathway allows communication between neighbouring cells during de-
velopment [1]. It has a critical role in the formation of ‘fine-grained’ patterns, generating distinct
cell fates among groups of initially equivalent neighbouring cells and sharply delineating neighbour-
ing regions in developing tissues [2-5]. The Delta ligand has been shown to have two activities:
it transactivates Notch in neighbouring cells and cis-inhibits Notch in its own cell. However, it
remains unclear how Notch integrates these two activities and how the resulting system facilitates
pattern formation. Here we report the development of a quantitative time-lapse microscopy plat-
form for analysing Notch-Delta signalling dynamics in individual mammalian cells, with the aim of
addressing these issues. By controlling both cis- and trans-Delta concentrations, and monitoring
the dynamics of a Notch reporter, we measured the combined cis-trans input-output relationship
in the Notch-Delta system. The data revealed a striking difference between the responses of Notch
to trans- and cis- Delta: whereas the response to trans-Delta is graded, the response to cis-Delta
is sharp and occurs at a fixed threshold, independent of trans-Delta. We developed a simple math-
ematical model that shows how these behaviours emerge from the mutual inactivation of Notch
and Delta proteins in the same cell. This interaction generates an ultrasensitive switch between
mutually exclusive sending (high Delta/low Notch) and receiving (high Notch/low Delta) signalling
states. At the multicellular level, this switch can amplify small differences between neighbouring
cells even without transcription-mediated feedback. This Notch-Delta signalling switch facilitates
the formation of sharp boundaries and lateral-inhibition patterns in models of development, and
provides insight into previously unexplained mutant behaviours.

71
Letter
Notch and Delta are single-pass transmembrane protein families found in metazoan species. Delta
in one cell can bind to, and transactivate, Notch in a neighbouring cell. This interaction results in
proteolytic release of the Notch intracellular domain, which translocates to the nucleus and activates
target genes6 (Fig. 1a). Delta also has a second role, inhibiting Notch activity in its own cell (cis-
inhibition) [7-10]. Cis-inhibition has been shown to involve direct interaction of the two proteins
[11], but current understanding is incomplete [12].
To understand how concentrations of cis- and trans-Delta are integrated by the Notch pathway
(Fig. 1b), we constructed cell lines that allowed us to modulate the concentrations of cis- and
trans-Delta independently, and to monitor quantitatively the transcriptional response of a Notch
reporter (Fig. 1c and Supplementary Fig. 1). These cell lines stably expressed Notch receptors and
corresponding yellow fluorescent protein (YFP) reporters of Notch activity (Supplementary Figs 1
and 2). They also contained a doxycycline-inducible chimaeric rat Dll1-mCherry fusion gene (Delta-
mCherry; Supplementary Fig. 3). In our main cell line, hN1G4esn, the intracellular domain of human
NOTCH1 was replaced with a minimal variant of the transcriptional activator Gal4, denoted Gal4esn
[13], to avoid activation of endogenous Notch targets [14-16]. A second cell line, hN1, containing the
full-length human NOTCH1 was analysed as a control (Supplementary Fig. 1). Notch messenger
RNA expression levels in these cells were comparable to those observed in early T-cell progenitors
where Notch is active [17] (Supplementary Information).
We first asked how Notch activity depends on the concentration of trans-Delta. We adsorbed
fusion proteins, consisting of immunoglobin-G (IgG) fused to the extracellular domain of human
DLL1 (Deltaext), to the surface of plates at different concentrations, denoted Dplate (Fig. 2a and
Supplementary Fig. 4) [18,19], and recorded time-lapse movies of Notch activation. Before the
start of each movie (t < 0), we inhibited Notch activation using the γ-secretase inhibitor N -[N -(3,5-
difluorophenacetyl)-L-alanyl]- S -phenylglycine t-butyl ester (DAPT). At t = 0, DAPT was washed
out, allowing the fluorescent reporter to accumulate at a rate determined by Notch activity (Fig.
2b, c and Supplementary Movie 1). The YFP production rate showed a graded response to Dplate,
well-fitted by a Hill function with a modest Hill coefficient (Fig. 2d).A similar response was observed
in the hN1 cell line (Supplementary Figure 1). This graded response was not due to the use of plate-
bound ligands: when cells expressing only Delta were co-cultured with cells expressing only Notch,
we observed a similarly graded dependence of Notch activity on the level of Delta expression, but
with greater variability (Supplementary Fig. 5).
We next set out to quantify the response of Notch to varying concentrations of cis-Delta in the
hN1G4esn cell line. We used a scheme in which Delta-mCherry was expressed in a pulse before
the start of the movie and subsequently allowed to dilute, effectively titrating its concentration

72
[20] (Fig. 3a). These experiments were performed at low cell density, where relatively weak inter-
cellular activation of Notch is observed (Supplementary Fig. 6), and transactivation was induced
predominantly by Dplate. At the beginning of the movie, Notch reporter expression was fully inhib-
ited by high Delta- mCherry concentrations (Fig. 3b and Supplementary Movie 2). Subsequently,
Delta-mCherry concentrations gradually declined on a timescale of τD = 32± 2.5 h, consistent with
dilution by cell growth and division (Fig. 3c). At ton ≈ 40 h, we observed a sharp onset of reporter
expression in the median response of the population (Fig. 3c). Even sharper responses were evident
in individual cell lineages (Fig. 3d-f and Supplementary Fig. 13). Similar behaviour was observed
in the hN1 cell line (Supplementary Fig. 7)
To quantify the sharpness of cis-inhibition, we computed the rise time, denoted τrise, required
for Notch activity to increase by a factor of e in individual cells (Fig. 3e and Fig. 3a, inset).
The distribution of τrise showed a median of 2.6 h, which is considerably less than τD (Fig. 3f).
For comparison, an equivalently sharp Hill function of cis-Delta would require a Hill coefficient of
τD/τrise < 12.
We repeated the experiment for a variety of Dplate values, allowing us to directly measure the
integrated response of Notch across the two-dimensional input space of cis- and trans-Delta concen-
trations (Fig. 3g and Supplementary Fig. 14). Activation occurred at a similar value of ton and,
therefore, a similar cis-Delta concentration, regardless of Dplate, as indicated by the fixed position
of the transition from black to green points in Fig. 3g. In addition, the activation remained sharp
at all Dplate values for which it could be clearly measured.
Thus, an explanation for the observed cis- and trans-signal integration must simultaneously
account for the three key features of the experimental data: a graded response to trans-Delta (Fig.
2d), a sharp response to cis-Delta (Fig. 3c-f) and a fixed threshold for cis-inhibition across varying
concentrations of trans-Delta (Fig. 3g). We show here that a simple model can explain these
observations in a unified way (Box 1 and Fig. 3h). The model’s key assumption is that Notch
and Delta in the same cell mutually inactivate each other. As shown in Box 1, strong enough
mutual inactivation can produce an ultrasensitive switch between two mutually exclusive signalling
states: cells can be in a predominantly ‘sending’ state, with high Delta concentration and low Notch
concentration, or a ‘receiving’ state, with high Notch concentration and low Delta concentration,
but cannot be in both states at the same time. Alternative models that do not include mutual
inactivation fail to account for the observed data (Supplementary Fig. 8).
The three features described above emerge naturally in this model. First, in the absence of
cis-Delta, the rate of Notch activation is proportional to the trans-Delta concentration, generating
a graded response. Second, a sharp response to cis-Delta results from mutual inactivation, which
causes an excess of either protein to strongly diminish the activity of the other. Finally, the switching
point occurs when Notch and cis-Delta concentrations are comparable, and is therefore only weakly

73
dependent on trans-Delta.
The mutual-inactivation model predicts cis-inhibition, not just of Notch by Delta but also of
Delta by Notch. This interaction is supported by results in other systems [12,21,22]. We tested this
prediction in our system using a transactivation assay based on co-culture of Delta-expressing sending
cells with Notch reporter cells. Expression of Notch in the Delta-expressing cells reduced their ability
to transactivate, as predicted (Supplementary Fig. 9). The exact biochemical mechanism of mutual
inactivation remains unclear, but we observed no sharp drop in the total cellular Delta-mCherry
fluorescence during switching, suggesting that the inactive complex may be stable in these conditions
(Fig. 3c, d).
This signalling switch has important implications for multicellular patterning. To understand
these implications, consider two neighbouring cells that produce Notch and Delta at constant rates
(Fig. 4a). A slight excess of Notch production in one cell and a slight excess of Delta production in
its neighbour can generate a strong signalling bias in one direction: the first cell becomes a receiver
and the second becomes a sender. In this way, a small difference in production rates between cells
is amplified into a much larger difference in Notch activity (Fig. 4b). This amplification does not
require transcriptional regulation or feedback.
The send-receive signalling switch can facilitate formation of sharp boundaries. For example, in
Drosophila Notch and Delta sharply delineate wing vein boundaries [4,5]. In this system, Delta pro-
duction is initially expressed in a graded profile transverse to the vein. Eventually, Notch signalling
is restricted to two sharp side bands on either side of the vein axis.
As a simplified model, we simulated the development of a field of cells with a graded rate of
Delta production and a uniform rate of Notch production (Fig. 4c). The mutual-inactivation model
generated sharply defined side bands of Notch signalling at positions where the two production
rates intersect, that is, where sender and receiver cells are next to each other (Fig. 4c). Moreover,
this model explains a striking mutant behaviour that occurs in the Drosophila wing vein system.
Although Notch and Delta are individually haploinsufficient (causing thicker veins), the Notch+/−
Delta+/− double mutant restores the wild-type phenotype [23]. This suppression of the single-mutant
phenotypes in the double mutant emerges automatically in the model because proportional rescaling
of the Notch and Delta production rates does not move their intersection points (Fig. 4d). This
suppression is maintained across a broad range of parameter values and persists even with additional
feedbacks (Supplementary Fig. 10c), but is difficult to explain in other models (Supplementary Fig.
10a and Supplementary Information).
The send-receive signalling switch can also facilitate lateral-inhibition patterning. When Notch
transcriptionally downregulates Delta expression, the resulting intercellular positive-feedback loop
can generate ‘checkerboard’ patterns of Notch activity [24,25] (Fig. 4e). Without mutual inactiva-
tion, pattern formation requires a minimum Hill coefficient of n = 2, or higher, in the regulatory

74
feedback loop (Fig. 4f, left, and Supplementary Information). Although we cannot rule out such
cooperativity, or additional feedback loops, no evidence for strongly cooperative transactivation was
observed here or previously (Fig. 2d and Supplementary Fig. 1). In contrast, mutual inactivation
allows patterning even without cooperativity, by introducing a sharp response to changes in Delta
expression (Fig. 4f, right). In addition, for strong enough cis-inhibition, mutual inactivation allows
cells with high Delta concentrations to coexist next to one another in the steady state, leading to a
broader range of possible patterns (Supplementary Fig. 17). Finally, we note that low concentrations
of free Notch and Delta exist in sender and, respectively, receiver cells for finite mutual-inactivation
strengths (Supplementary Fig. 11). The resulting signalling between like cells (senders or receivers)
can have a role in lateral-inhibition patterning dynamics.
Modeling box
Here we describe a simple model of Notch-Delta interactions that explains the experimental data
and provides insight into developmental patterning processes. The model involves several reactions.
First, during intercellular signalling, Notch in one cell binds to extracellular Delta, of concentration
Dtrans, leading to release of the Notch intracellular domain and degradation of its extracellular
domain [6]. Similarly, Notch in a neighbouring cell, Ntrans, can bind to Delta. Second, Notch binds
irreversibly to Delta in the same cell to form a stable, inactive, complex, which is effectively removed
from the system [12]. Finally, Notch and Delta are produced at constant rates, and degraded and/or
diluted at a constant rate, in addition to being removed through the interactions described above.
These reactions can be expressed as a set of ordinary differential equations for the concentrations
of free Notch, N , and free Delta, D, in an individual cell. An additional equation represents the
intracellular domain of Notch, S, which activates expression of the fluorescent reporter gene:
dN
dt= βN − γN −
DN
kc− DtransN
kt,
dD
dt= βD − γD −
DN
kc− DNtrans
kt,
dS
dt=DtransN
kt− γSS.
Here Dtrans represents Dplate in Figs 2 and 3, but could also represent Delta concentration in one or
more neighbouring cells (Supplementary Information). Similarly, D in these equations corresponds
to cis-Delta in the experiments, and βN and βD denote the production rates of Notch and Delta,
respectively. The combined degradation and dilution rate, γ, is assumed for simplicity to be the
same for Notch and Delta, and γS is the rate of decay of S. We write kc and kt to denote the
strengths of cis-inhibition and transactivation, respectively. See Supplementary Information for a

75
more detailed description.
In the steady state, mutual inactivation leads to a switch between two qualitatively distinct
behaviours, depending on the relative production rates of Delta and Notch. When βD > βN , ex-
cess Delta effectively inactivates almost all Notch, allowing cells to send, but not efficiently receive,
signals. Conversely, when βD < βN , excess Notch effectively inactivates Delta, allowing cells to
receive, but not efficiently send, signals. Thus, the system approaches two mutually exclusive sig-
nalling states: high Delta/low Notch (‘sending’; pink shading in Figure), and high Notch/low Delta
(‘receiving’; blue shading in Figure). We note that this switch is not bistable.
In the steady state, the transition between the two regimes is ultrasensitive: near the threshold,
a relatively small change in βD or βN can lead to a much larger change in signalling (Supplementary
Fig. 11). Related biochemical kinetics occur in bacterial small RNA and protein sequestration
[27-29]. In Fig. 3, ultrasensitivity occurs dynamically in response to the decay of the total Delta
concentration (Supplementary Information).

76
Figure 1: System for analyzing signal integration in the Notch-Delta pathway. a, Notch (blue) andDelta (red) interactions are indicated schematically. b, Notch activity integrates cis-and trans-Delta.c, T-REx-CHO-K1 cell line for analysing Notch activity. The hN1G4esn cell line stably incorporatesa variant of human NOTCH1 in which the activator Gal4esn replaces the Notch intracellular domain(here hN1(ECD) is the extracellular domain of hN1). This cell line also contains genes for histone2B (H2B)citrine (YFP) reporter controlled by an upstream activating sequence (UAS) promoter, atetracycline-inducible (TO) DeltamCherry fusion protein and a constitutively expressed H2Bcerulean(cyan fluorescent protein, or CFP) for image segmentation (not shown). A similar cell line expressingfull-length human NOTCH1 (the hN1 cell line) was also analysed (Supplementary Figs 1 and 2).These cells exhibit no detectable endogenous Notch or Delta activities. NotchDelta interactions areindicated schematically and do not represent molecular interaction mechanisms [11].

77
Figure 2: Transactivation of Notch occurs in a graded fashion. a, Experimental design. The rateof increase of fluorescence (slope of green line) is a measure of Notch activity. b, Typical hN1G4esn
filmstrip showing activation of Notch reporter (green), with Dplate = 1.16 µg ml−1 and frame timesas indicated (Supplementary Movie 1; compare with Supplementary Fig. 6). c, hN1G4esn cellsrespond in a graded manner to variations in Dplate. The data show the median fluorescence ofindividual cells within a single field of view for the indicated values of Dplate (see SupplementaryFig. 15 for distributions). RFU, relative fluorescence unit. d, The relationship between Dplate andNotch activity (in RFU per hour, from the linear regime in c). The Hill-function fit is indicated bythe black line, which has Hill coefficient n = 1.7 (95% confidence interval, n = 0.8−−2.7). Similarresults were obtained using the hN1 cell line (Supplementary Fig. 1). We note that doxycycline doesnot directly affect Notch activation or cell growth, nor does Dplate affect cell growth (SupplementaryFig. 12).

78
Figure 3: Cis-trans signal integration by Notch. a, Experimental protocol. Inset, the rise time, τrise,is the time required for Notch activity (black line or slope of green line) to change by a factor ofe. dox, doxycycline. b, Filmstrip of hN1G4esn cells, with Dplate = 1.45 µg ml−1 (SupplementaryMovie 2), showing Delta-mCherry fluorescence (red) and concomitant activation of Notch reporter(green) at the indicated times (compare with Supplementary Fig. 6). c, Population average (median)response for the same movie shows a slow decay of Delta-mCherry fluorescence (red data), but asharp response of reporter expression (green data). Constitutively expressed pCMV-H2B-cerulean(blue data) remains constant (control). Compare with the single-cell tracks in Supplementary Fig.13 and the response to modulation of doxycycline in Supplementary Fig. 14. d, Single-cell responsefor two individual cells (solid and dashed lines, colours as in c). Black arrows mark cell divisions. e,Single-cell traces in d replotted, but shifted up after each cell division event to ‘add back’ sister-cellfluorescence, to show the continuity of Notch activity (see also Supplementary Fig. 13). f, Histogramof τrise from 26 non-overlapping cell lineages (Supplementary Fig. 13). g, Notch response to bothcis- and trans-Delta. Data shown are from two duplicate movies acquired at each of 12 Dplate valuesfor hN1G4esn cells. Green colouring indicates data that exceed a detection threshold. Note thatonset (the black-to-green transition) occurs at approximately the same time for all Dplate values. h,Simulations based on the model in Box 1 are qualitatively similar to data in g (see SupplementaryInformation and Supplementary Fig. 16 for model details). a.u., arbitrary units.
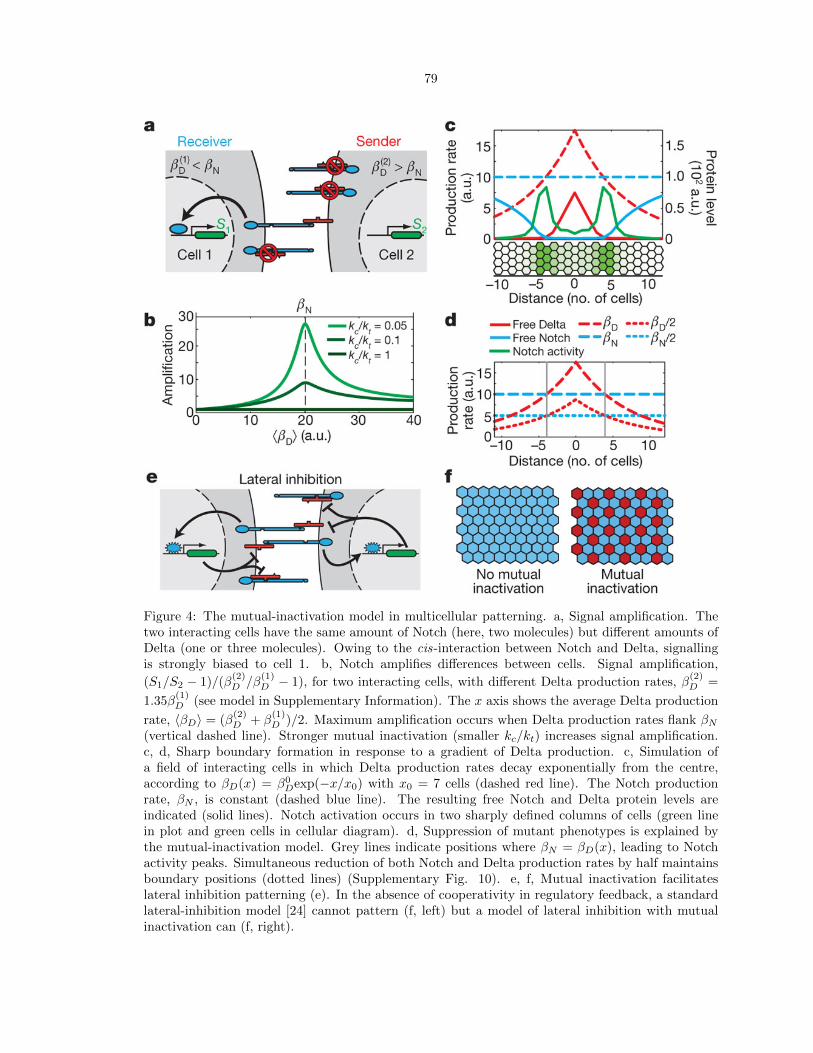
79
Figure 4: The mutual-inactivation model in multicellular patterning. a, Signal amplification. Thetwo interacting cells have the same amount of Notch (here, two molecules) but different amounts ofDelta (one or three molecules). Owing to the cis-interaction between Notch and Delta, signallingis strongly biased to cell 1. b, Notch amplifies differences between cells. Signal amplification,
(S1/S2 − 1)/(β(2)D /β
(1)D − 1), for two interacting cells, with different Delta production rates, β
(2)D =
1.35β(1)D (see model in Supplementary Information). The x axis shows the average Delta production
rate, 〈βD〉 = (β(2)D + β
(1)D )/2. Maximum amplification occurs when Delta production rates flank βN
(vertical dashed line). Stronger mutual inactivation (smaller kc/kt) increases signal amplification.c, d, Sharp boundary formation in response to a gradient of Delta production. c, Simulation ofa field of interacting cells in which Delta production rates decay exponentially from the centre,according to βD(x) = β0
Dexp(−x/x0) with x0 = 7 cells (dashed red line). The Notch productionrate, βN , is constant (dashed blue line). The resulting free Notch and Delta protein levels areindicated (solid lines). Notch activation occurs in two sharply defined columns of cells (green linein plot and green cells in cellular diagram). d, Suppression of mutant phenotypes is explained bythe mutual-inactivation model. Grey lines indicate positions where βN = βD(x), leading to Notchactivity peaks. Simultaneous reduction of both Notch and Delta production rates by half maintainsboundary positions (dotted lines) (Supplementary Fig. 10). e, f, Mutual inactivation facilitateslateral inhibition patterning (e). In the absence of cooperativity in regulatory feedback, a standardlateral-inhibition model [24] cannot pattern (f, left) but a model of lateral inhibition with mutualinactivation can (f, right).

80
Methods summary
We assembled genetic constructs and cell lines by standard methods (Supplementary Table 1).
All cell lines used in the main text (Supplementary Table 2) were derived from T-REx-CHO-
K1(Invitrogen). Cell lines were constructed by sequential rounds of Lipofectamine 2000 (Invitrogen)
transfection and selection. We isolated stably transfected clones by limiting dilution or FACS.
Time-lapse microscopy was performed with cells plated on 24-well glass-bottom plates (MatTek).
For plate-bound Delta experiments, IgG-Deltaext was adsorbed to the plate together with 5 µg ml−1
hamster fibronectin (Innovative Research) before cell plating. Before imaging, cells were switched to
a low-fluorescence medium, consisting of 5% FBS in αMEM lacking riboflavin, folic acid, phenol red
and vitamin B12. Movies were acquired using an Olympus IX81-ZDC microscope, equipped with an
environmental chamber at 37◦C supplying 5% CO2, a ×20, numerical-aperture-0.7 objective, and
automated acquisition software (METAMORPH (version 7.5.6.0), Molecular Devices).
We obtained Western blots for Gal4 using standard protocols. Blots were probed using rabbit
anti-Gal4 DBD primary antibody (sc-577, Santa Cruz Biotechnology; 1:200) followed by incuba-
tion with horseradish peroxidaselabelled anti-rabbit IgG secondary antibody (Amersham; 1:2,000).
Bands were quantified using a VersaDoc gel imaging system (Bio-Rad). Quantitative PCR with
reverse transcription was performed using standard protocols based on the RNeasy kit (Qiagen) and
the iScript cDNA synthesis kit (Bio-Rad).
We analysed co-culture experiments for YFP fluorescence using a FACScalibur flow cytometer
(Becton Dickinson) and standard protocols. Movies were analysed in several stages. First, individual
cell nuclei were identified in CFP images using a custom algorithm (MATLAB, MathWorks R2007a)
based on edge detection and thresholding of constitutively expressed H2B-cerulean fluorescence.
Then, for analysis of single-cell expression trajectories, individual nuclei were tracked across frames
using custom software (MATLAB, C) based on the softassign algorithm (Supplementary Informa-
tion). All single-cell trajectories were validated manually. For further details, see Supplementary
Information.
References
1. Artavanis-Tsakonas, S., Rand, M. D. & Lake, R. J. Notch signaling: Cell fate control and
signal integration in development. Science 284, 770-776 (1999).
2. Goodyear, R. & Richardson, G. Pattern formation in the basilar papilla: Evidence for cell
rearrangement. J. Neurosci. 17, 6289-6301 (1997).
3. Heitzler, P. & Simpson, P. The choice of cell fate in the epidermis of Drosophila. Cell 64,
1083-1092 (1991).

81
4. Huppert, S. S., Jacobsen, T. L. & Muskavitch, M. A. Feedback regulation is central to Delta-
Notch signalling required for Drosophila wing vein morphogenesis. Development 124, 3283-
3291 (1997).
5. De Celis, J. F., Bray, S. & Garcia-Bellido, A. Notch signalling regulates veinlet expression
and establishes boundaries between veins and interveins in the Drosophila wing. Development
124, 1919-1928 (1997).
6. Bray, S. J. Notch signalling: A simple pathway becomes complex. Nature Rev. Mol. Cell Biol.
7, 678-689 (2006).
7. de Celis, J. F. & Bray, S. Feed-back mechanisms affecting Notch activation at the dorsoventral
boundary in the Drosophila wing. Development 124, 3241-3251 (1997).
8. Micchelli, C. A., Rulifson, E. J. & Blair, S. S. The function and regulation of cut expression
on the wing margin of Drosophila: Notch, Wingless and a dominant negative role for Delta
and Serrate. Development 124, 1485-1495 (1997).
9. Klein, T., Brennan, K. & Arias, A. M. An intrinsic dominant negative activity of Serrate that
is modulated during wing development in Drosophila. Dev. Biol. 189, 123-134 (1997).
10. Miller, A. C., Lyons, E. L. & Herman, T. G. cis-Inhibition of notch by endogenous delta biases
the outcome of lateral inhibition. Curr. Biol. 19, 1378-1383 (2009).
11. Cordle, J. et al. A conserved face of the Jagged/Serrate DSL domain is involved in Notch
trans-activation and cis-inhibition. Nature Struct. Mol. Biol. 15, 849-857 (2008).
12. Matsuda, M. & Chitnis, A. B. Interaction with Notch determines endocytosis of specific Delta
ligands in zebrafish neural tissue. Development 136, 197-206 (2009).
13. Kakidani, H. & Ptashne, M. GAL4 activates gene expression in mammalian cells. Cell 52,
161-167 (1988).
14. Struhl, G. & Adachi, A. Nuclear access and action of notch in vivo. Cell 93, 649-660 (1998).
15. Aster, J. C. et al. Essential roles for ankyrin repeat and transactivation domains in induction
of T-cell leukemia by Notch1. Mol. Cell. Biol. 20, 7505-7515 (2000).
16. Yang, L. T. et al. Fringe glycosyltransferases differentially modulate Notch1 proteolysis in-
duced by Delta1 and Jagged1. Mol. Biol. Cell 16, 927-942 (2005).
17. Rothenberg, E. V., Moore, J. E. & Yui, M. A. Launching the T-cell-lineage developmental
programme. Nature Rev. Immunol. 8, 9-21 (2008).

82
18. Varnum-Finney, B. et al. Immobilization of Notch ligand, Delta-1, is required for induction of
notch signaling. J. Cell Sci. 113, 4313-4318 (2000).
19. Wang, S. et al. Notch receptor activation inhibits oligodendrocyte differentiation. Neuron 21,
63-75 (1998).
20. Rosenfeld, N., Young, J. W., Alon, U., Swain, P. S. & Elowitz, M. B. Gene regulation at the
single-cell level. Science 307, 1962-1965 (2005).
21. Jacobsen, T. L., Brennan, K., Arias, A. M. & Muskavitch, M. A. Cis-interactions between
Delta and Notch modulate neurogenic signalling in Drosophila. Development 125, 4531-4540
(1998).
22. Shaye, D. D. & Greenwald, I. LIN-12/Notch trafficking and regulation of DSL ligand activity
during vulval induction in Caenorhabditis elegans. Development 132, 5081-5092 (2005).
23. De Celis, J. F. & Bray, S. J. The Abruptex domain of Notch regulates negative interactions
between Notch, its ligands and Fringe. Development 127, 1291-1302 (2000).
24. Collier, J. R., Monk, N. A., Maini, P. K. & Lewis, J. H. Pattern formation by lateral inhibition
with feedback: A mathematical model of Delta-Notch intercellular signalling. J. Theor. Biol.
183, 429-446 (1996).
25. Plahte, E. Pattern formation in discrete cell lattices. J. Math. Biol. 43, 411-445 (2001).
26. Melen, G. J., Levy, S., Barkai, N. & Shilo, B. Z. Threshold responses to morphogen gradients
by zero-order ultrasensitivity. Mol. Syst. Biol. 1, doi:10.1038/ msb4100036 (2005).
27. Levine, E., Zhang, Z., Kuhlman, T. & Hwa, T. Quantitative characteristics of gene regulation
by small RNA. PLoS Biol. 5, e229 (2007).
28. Buchler, N. E. & Louis, M. Molecular titration and ultrasensitivity in regulatory networks. J.
Mol. Biol. 384, 1106-1119 (2008).
29. Lenz, D. H. et al. The small RNA chaperone Hfq and multiple small RNAs control quorum
sensing in Vibrio harveyi and Vibrio cholerae. Cell 118, 69-82 (2004).

83
Supplementary Information
Construct Name Promoter Gene Mammalian Selection Role in this work
pEV‐UAS‐H2B‐citrine UAS H2B‐citrine Zeocin Reporter for hN1‐Gal4esn
pEV‐12xCSL‐H2B‐citrine
12xCSL H2B‐citrine Zeocin Reporter for hN1
pcDNA3‐hN1‐mod1 CMV hNotch1 Neomycin hN1 construct
pcDNA3‐hN1‐mcherry
CMV hN1‐mcherry Neomycin hN1 construct (used)
pCDNA3‐hNECD –Gal4esn
CMV hNECD –Gal4esn
Neomycin hN1‐Gal4esn construct
pcDNA5/TO‐hNICD‐Gal4esn
CMV‐TO hNICD‐Gal4esn Hygromycin hNICD‐Gal4esn
pcDNA5/TO‐Delta‐mcherry
CMV‐TO Delta‐mcherry Hygromycin Inducible Delta‐mCherry
pcDNA5/TO‐Gal4esn CMV‐TO Gal4esn Hygromycin Inducible Gal4esn
pCS‐H2B‐cerulean CMV H2B‐cerulean ‐ Segmentation color
pcDNA6‐UAS‐H2B‐citrine
UAS H2B‐citrine Blasticidin Reporter in dual reporter line
pEV‐12xCSL‐H2B‐mcherry
12xCSL H2B‐mcherry Zeocin Reporter in dual reporter line
Figure : Supplementary Table S1: Table of plasmids/constructs

84
Stable Cell Line Parental Line Transfected Construct Antibiotic Selection
T‐REx‐CHO‐K1 (Invitrogen) ‐ ‐ Blasticidin (10 ug/ml)
12xCSL‐H2B‐Citrine T‐REx‐CHO‐K1 pEV‐12xCSL‐H2B‐Citrine Zeocin (400 ug/ml), Blasticidin (10 ug/ml)
UAS‐H2B‐Citrine + CMV‐H2B‐Cerulean T‐REx‐CHO‐K1
pEV‐UAS‐H2B‐Citrine pCS‐H2B‐Cerulean Zeocin (400 ug/ml), Blasticidin (10 ug/ml)
hN1‐No‐Delta 12xCSL‐H2B‐Citrine pcDNA3‐hN1‐mCherry Zeocin (400 ug/ml), Blasticidin (10 ug/ml),
Geneticin (600 ug/ml)
hN1G4esn‐No‐Delta UAS‐H2B‐Citrine + CMV‐Cerulean pcDNA3‐hNECD‐Gal4esn
Zeocin (400 ug/ml), Blasticidin (10 ug/ml), Geneticin (600 ug/ml)
hN1 hN1‐No‐Delta pcDNA5‐TO‐Dl‐mCherry
pCS‐H2B‐Cerulean Zeocin (400 ug/ml), Blasticidin (10 ug/ml), Geneticin (600 ug/ml), Hygromycin (500 ug/ml)
hN1G4esn hN1G4esn‐No‐Delta pcDNA5‐TO‐Dl‐mCherry Zeocin (400 ug/ml), Blasticidin (10 ug/ml),
Geneticin (600 ug/ml), Hygromycin (500 ug/ml)
TO‐DMC T‐REx‐CHO‐K1 pcDNA5‐TO‐Dl‐mCherry Hygromycin (500 ug/ml), Blasticidin (10 ug/ml)
TO‐DMC+hN1G4esn (for fig. S9) TO‐DMC pcDNA3‐hNECD‐Gal4esn
Hygromycin (500 ug/ml), Blasticidin (10 ug/ml), Geneticin (600 ug/ml)
TO‐Gal4esn UAS‐H2B‐Citrine + CMV‐H2B‐Cerulean pcDNA5/TO‐Gal4esn
Zeocin (400 ug/ml), Blasticidin (10 ug/ml), Hygromycin (500 ug/ml)
UAS‐H2B‐Citrine CHO‐K1 (CCL‐61) pcDNA‐UAS‐H2B‐Citrine Blasticidin (10 ug/ml)
UAS‐H2B‐Citrine + 12xCSL‐H2B‐mCherry
(dual reporter) UAS‐H2B‐Citrine pEV‐12xCSL‐H2B‐Citrine Zeocin (400 ug/ml), Blasticidin (10ug/ml)
Figure : Supplementary Table S2: Table of cell lines

85
3www.nature.com/nature
SUPPLEMENTARY INFORMATIONdoi: 10.1038/nature08959
Figure S1
103 104 105 106103
104
105
106
Total YFP (12xCSL) [RFU]
Tota
l RFP
(UA
S) [R
FU]
Slope=0.92R2=0.91
backgroundfluorescence
UntransfectedTransfected with hNICD-Gal4esn
A
B
H2B-Citrine
UAS hNICD-Gal4esn
H2B-mCherry
12xCSL
H2B-CitrineUAS H2B-mCherry12xCSL
hNICD-Gal4esn
hN1hN1
hNotch1
H2B-Citrine12xCSL
DeltaTO mCherry
0 0.5 1 1.50
50
100
150
200
Calibrated Dplate [μg/ml]
YFP
prod
uctio
n ra
te [R
FU h
r-1]
C
D
2
S2: Table of stable cell lines
Stable Cell Line Parental Line Transfected Construct Antibiotic Selection T‐REx‐CHO‐K1 (Invitrogen) ‐ ‐ Blasticidin (10 ug/ml)
12xCSL‐H2B‐Citrine T‐REx‐CHO‐K1 pEV‐12xCSL‐H2B‐Citrine Zeocin (400 ug/ml), Blasticidin (10 ug/ml) UAS‐H2B‐Citrine + CMV‐H2B‐Cerulean T‐REx‐CHO‐K1
pEV‐UAS‐H2B‐Citrine pCS‐H2B‐Cerulean Zeocin (400 ug/ml), Blasticidin (10 ug/ml)
hN1‐No‐Delta 12xCSL‐H2B‐Citrine pcDNA3‐hN1‐mCherry Zeocin (400 ug/ml), Blasticidin (10 ug/ml),
Geneticin (600 ug/ml)
hN1G4esn‐No‐Delta UAS‐H2B‐Citrine + CMV‐Cerulean pcDNA3‐hNECD‐Gal4esn
Zeocin (400 ug/ml), Blasticidin (10 ug/ml), Geneticin (600 ug/ml)
hN1 hN1‐No‐Delta pcDNA5‐TO‐Dl‐mCherry
pCS‐H2B‐Cerulean Zeocin (400 ug/ml), Blasticidin (10 ug/ml), Geneticin (600 ug/ml), Hygromycin (500 ug/ml)
hN1G4esn hN1G4esn‐No‐Delta pcDNA5‐TO‐Dl‐mCherry Zeocin (400 ug/ml), Blasticidin (10 ug/ml),
Geneticin (600 ug/ml), Hygromycin (500 ug/ml)
TO‐DMC T‐REx‐CHO‐K1 pcDNA5‐TO‐Dl‐mCherry Hygromycin (500 ug/ml), Blasticidin (10 ug/ml) TO‐DMC+hN1G4esn
(for fig. S9) TO‐DMC pcDNA3‐hNECD‐Gal4esn Hygromycin (500 ug/ml), Blasticidin (10 ug/ml),
Geneticin (600 ug/ml)
TO‐Gal4esn UAS‐H2B‐Citrine + CMV‐H2B‐Cerulean pcDNA5/TO‐Gal4esn
Zeocin (400 ug/ml), Blasticidin (10 ug/ml), Hygromycin (500 ug/ml)
UAS‐H2B‐Citrine CHO‐K1 (CCL‐61) pcDNA‐UAS‐H2B‐Citrine Blasticidin (10 ug/ml) UAS‐H2B‐Citrine +
12xCSL‐H2B‐mCherry (dual reporter) UAS‐H2B‐Citrine pEV‐12xCSL‐H2B‐Citrine Zeocin (400 ug/ml), Blasticidin (10ug/ml)
Supplementary Figures
Figure S1: hN1G4esn and hN1 cell lines exhibit similar response. (A) The hN1 cell line stably incorporates genes for full length hNotch1, Histone 2B (H2B)‐Citrine (YFP) reporter controlled by a synthetic 12XCSL promoter30, and a Tet‐inducible Delta‐mCherry fusion protein. It also constitutively express H2B‐Cerulean (CFP) for image segmentation (not shown). Note that the hN1 cell line includes an mCherry domain fused to the C‐terminus of hNotch1, which is not detectable experimentally and therefore omitted in the diagram. These cells exhibit no detectable endogenous Notch or Delta activities. (B) Notch response to trans‐Delta in the hN1 cell line is similar to the one in hN1G4esn (Fig. 2). Hill coefficient n=1.6 (95% CI: 0.6‐2.5). (C‐D) Co‐linear response of the 12xCSL and the UAS promoters. (C) A fusion protein consisting of Gal4esn and the Notch Intracellular Domain (ICD) was transiently transfected into a CHO‐K1 cell line containing two stably integrated reporters: 12xCSL‐H2B‐Citrine and UAS‐H2B‐mCherry. (C) Total RFP fluorescence versus total YFP fluorescence for transfected (blue circles) or untransfected (red circles) cells shows a co‐linear response of the two reporters to the fusion activator (plotted on a log‐log scale). A linear regression fit shows a slope of 0.92 (R2=0.91), corresponding to a nearly linear relation between the two reporters (red line). Background fluorescence (gray area) is due to basal leakiness of reporters. Note that, due to the finite transfection efficiency of the transient transfection, only some of the cells contain the fusion activator. Data points are extracted from fluorescence images
3
of cells, and analyzed using the techniques described in the text and methods. This result together with the non‐cooperative behavior of the Galesn‐UAS system shown in Fig. S2 is consistent with a non‐cooperative activation of the 12xCSL promoter by Notch ICD.
Figure S2: The Gal4esn‐UAS transcription factor‐promoter interaction shows no cooperativity. This figure describes a measurement of the relationship between Gal4esn concentration and the transcriptional activity of its target UAS promoter. As in Fig. 3A and ref. 2, the approach involves allowing the transcription factor to decay and/or dilute while following the activity of its target promoter. (a) Schematic of cell line design. In this cell line, Gal4esn is expressed from a tet‐dependent promoter under the control of the doxycyline inducer. Gal4esn activates expression of an H2B‐YFP (Citrine) reporter gene. (b) Schematic of experimental design. Prior to the start of the movie, cells were induced with a pulse of doxycycline, which was then washed out immediately before the beginning of time‐lapse movie recording. Consequently, Gal4esn was expressed, and then allowed to degrade and/or dilute over time (red curve, bottom panel), while H2B‐YFP fluorescence was monitored in individual cell lineages (top panel). γgal denotes the effective decay rate of Gal4
esn. For large enough pulses of Gal4esn expression, the resulting data (shown schematically) would be expected to show constant rates of production of YFP (slopes of green line), interrupted by a ~2‐fold decrease in YFP levels at cell division events, due to partitioning of the YFP to daughter cells. To avoid discontinuities inherent to cell division events, the “lost” fluorescence after division is replaced (computationally) after each cell division event (dashed line and arrows). The slope of the resulting (dashed) trace is directly related to the activity of the UAS promoter, shown in the inset of (d). Here we focus on the relative timescale required for the slope to fall from 73% to 23% of its initial value as Gal4esn decays (cf. Fig. 3A). (c) Observed YFP accumulation in individual cell lineages. These traces have been corrected for cell division events as shown in (b). (d) Histogram of measured values determined from traces like those in (c) shows that, despite variability in initial levels of expression, the timescales, , required for turn off were relatively constant. (e) Using a time‐course Western blot against Gal4esn, we observed the Gal4esn half‐life to be between ~3‐5 hours (i.e. ). A calibration with varying levels of cell lysate was also run to
test linearity of measurement (bottom). (f) Inferring the Hill coefficient of the Gal4esn‐UAS interaction based on the measured values of and , using the relationship shown in equation, inset. The black
line shows how measurements of constrain the possible range of underlying Hill coefficients. The
dark gray region indicates the range of values consistent with variability in the measurement of in (f). The light gray region indicates the measured range of . The intersection between the two gray
regions provide the range of likely for values. This result shows that the effective cooperativity of the Gal4esn‐UAS interaction does not significantly exceed 1.
Figure S3: TO‐Delta‐mCherry cells trans‐activate as efficiently as OP9‐Delta cells. We compared the relative abilities of the TO‐Delta‐mCherry cell line, the OP9‐Delta cell line, and Dplate to trans‐activate Notch. Stromal OP9 cells stably expressing mDll1 (OP9‐Delta) and control OP9 cells not expressing Delta1 (both are a generous gift from Ellen Rothenberg) and inducible CHO TO‐Delta‐mCherry cells were co‐cultured with hN1G4esn‐No‐Delta cells (containing Notch and a reporter only—see Fig. S5). Cells were
Figure : Figure S1: hN1G4esn and hN1 cell lines exhibit similar response. (A) The hN1 cell line stablyincorporates genes for full length hNotch1, Histone 2B (H2B)-Citrine (YFP) reporter controlledby a synthetic 12XCSL promoter[30], and a Tet-inducible Delta-mCherry fusion protein. It alsoconstitutively expresses H2B-Cerulean (CFP) for image segmentation (not shown). Note that thehN1 cell line includes an mCherry domain fused to the C-terminus of hNotch1, which is not detectableexperimentally and therefore omitted in the diagram. These cells exhibit no detectable endogenousNotch or Delta activities. (B) Notch response to trans-Delta in the hN1 cell line is similar to theone in hN1G4esn (Fig. 2). Hill coefficient n = 1.6 (95% CI: 0.6-2.5). (C-D) Co-linear responseof the 12xCSL and the UAS promoters. (C) A fusion protein consisting of Gal4esn and the NotchIntracellular Domain (ICD) was transiently transfected into a CHO-K1 cell line containing two stablyintegrated reporters: 12xCSL-H2B-Citrine and UAS-H2B-mCherry. (C) Total RFP fluorescenceversus total YFP fluorescence for transfected (blue circles) or untransfected (red circles) cells showsa co-linear response of the two reporters to the fusion activator (plotted on a log-log scale). Alinear regression fit shows a slope of 0.92 (R2 = 0.91), corresponding to a nearly linear relationbetween the two reporters (red line). Background fluorescence (gray area) is due to basal leakinessof reporters. Note that, due to the finite transfection efficiency of the transient transfection, onlysome of the cells contain the fusion activator. Data points are extracted from fluorescence imagesof cells, and analyzed using the techniques described in the text and methods. This result togetherwith the non-cooperative behavior of the Galesn-UAS system shown in Fig. S2 is consistent with anon-cooperative activation of the 12xCSL promoter by Notch ICD.

86
4www.nature.com/nature
doi: 10.1038/nature08959 SUPPLEMENTARY INFORMATION
0 0.15 0.3 0.450
2
4
6
8
10
12
14
Num
ber o
f cel
l lin
eage
s
[hours-1]
Gal4esn
UASYFP
TOGal4esn
dox
0 17 33 50
time [hours]
YFP
6
3
0
x 104
a
c
e
d
f
b
n H
gal
(hr -1 )Gal4esn degradation rate
nH=(gal)-1
0 0.1 0.2 0.3 0.4 0.5 0.60
1
2
3
4
5
6
7
8
Experimentalrange of gal
Add dox Remove doxStart Movie
t=0
Gal
4esn
t
~e-γgalt
YFP
Promoter activity
calibration
(wb: Gal4)
2.5 5 10
28 kD
Unind. 0hr 2hr 6hr 1hr 4hr
7.510
gal measurement
YFP
Prom
oter
Activ
ity
t
Figure S2
t
3
of cells, and analyzed using the techniques described in the text and methods. This result together with the non‐cooperative behavior of the Galesn‐UAS system shown in Fig. S2 is consistent with a non‐cooperative activation of the 12xCSL promoter by Notch ICD.
Figure S2: The Gal4esn‐UAS transcription factor‐promoter interaction shows no cooperativity. This figure describes a measurement of the relationship between Gal4esn concentration and the transcriptional activity of its target UAS promoter. As in Fig. 3A and ref. 2, the approach involves allowing the transcription factor to decay and/or dilute while following the activity of its target promoter. (a) Schematic of cell line design. In this cell line, Gal4esn is expressed from a tet‐dependent promoter under the control of the doxycyline inducer. Gal4esn activates expression of an H2B‐YFP (Citrine) reporter gene. (b) Schematic of experimental design. Prior to the start of the movie, cells were induced with a pulse of doxycycline, which was then washed out immediately before the beginning of time‐lapse movie recording. Consequently, Gal4esn was expressed, and then allowed to degrade and/or dilute over time (red curve, bottom panel), while H2B‐YFP fluorescence was monitored in individual cell lineages (top panel). γgal denotes the effective decay rate of Gal4
esn. For large enough pulses of Gal4esn expression, the resulting data (shown schematically) would be expected to show constant rates of production of YFP (slopes of green line), interrupted by a ~2‐fold decrease in YFP levels at cell division events, due to partitioning of the YFP to daughter cells. To avoid discontinuities inherent to cell division events, the “lost” fluorescence after division is replaced (computationally) after each cell division event (dashed line and arrows). The slope of the resulting (dashed) trace is directly related to the activity of the UAS promoter, shown in the inset of (d). Here we focus on the relative timescale required for the slope to fall from 73% to 23% of its initial value as Gal4esn decays (cf. Fig. 3A). (c) Observed YFP accumulation in individual cell lineages. These traces have been corrected for cell division events as shown in (b). (d) Histogram of measured values determined from traces like those in (c) shows that, despite variability in initial levels of expression, the timescales, , required for turn off were relatively constant. (e) Using a time‐course Western blot against Gal4esn, we observed the Gal4esn half‐life to be between ~3‐5 hours (i.e. ). A calibration with varying levels of cell lysate was also run to
test linearity of measurement (bottom). (f) Inferring the Hill coefficient of the Gal4esn‐UAS interaction based on the measured values of and , using the relationship shown in equation, inset. The black
line shows how measurements of constrain the possible range of underlying Hill coefficients. The
dark gray region indicates the range of values consistent with variability in the measurement of in (f). The light gray region indicates the measured range of . The intersection between the two gray
regions provide the range of likely for values. This result shows that the effective cooperativity of the Gal4esn‐UAS interaction does not significantly exceed 1.
Figure S3: TO‐Delta‐mCherry cells trans‐activate as efficiently as OP9‐Delta cells. We compared the relative abilities of the TO‐Delta‐mCherry cell line, the OP9‐Delta cell line, and Dplate to trans‐activate Notch. Stromal OP9 cells stably expressing mDll1 (OP9‐Delta) and control OP9 cells not expressing Delta1 (both are a generous gift from Ellen Rothenberg) and inducible CHO TO‐Delta‐mCherry cells were co‐cultured with hN1G4esn‐No‐Delta cells (containing Notch and a reporter only—see Fig. S5). Cells were
Figure S2 (caption on next page)

87
Figure (previous page): Figure S2 (previous page): The Gal4esn-UAS transcription factor-promoterinteraction shows no cooperativity. This figure describes a measurement of the relationship betweenGal4esn concentration and the transcriptional activity of its target UAS promoter. As in Fig. 3Aand ref. 2, the approach involves allowing the transcription factor to decay and/or dilute whilefollowing the activity of its target promoter. (a) Schematic of cell line design. In this cell line,Gal4esn is expressed from a tet-dependent promoter under the control of the doxycyline inducer.Gal4esn activates expression of an H2B-YFP (Citrine) reporter gene. (b) Schematic of experimentaldesign. Prior to the start of the movie, cells were induced with a pulse of doxycycline, which was thenwashed out immediately before the beginning of time-lapse movie recording. Consequently, Gal4esn
was expressed, and then allowed to degrade and/or dilute over time (red curve, bottom panel),while H2B-YFP fluorescence was monitored in individual cell lineages (top panel). γgal denotes theeffective decay rate of Gal4esn. For large enough pulses of Gal4esn expression, the resulting data(shown schematically) would be expected to show constant rates of production of YFP (slopes ofgreen line), interrupted by a 2-fold decrease in YFP levels at cell division events, due to partitioningof the YFP to daughter cells. To avoid discontinuities inherent to cell division events, the “lost”fluorescence after division is replaced (computationally) after each cell division event (dashed lineand arrows). The slope of the resulting (dashed) trace is directly related to the activity of the UASpromoter, shown in the inset of (d). Here we focus on τ , the relative timescale required for theslope to fall from 73% to 23% of its initial value as Gal4esn decays (cf. Fig. 3A). (c) Observed YFPaccumulation in individual cell lineages. These traces have been corrected for cell division events asshown in (b). (d) Histogram of measured τ values determined from traces like those in (c) showsthat, despite variability in initial levels of expression, the timescales, τ , required for turn off wererelatively constant. (e) Using a time-course Western blot against Gal4esn, we observed the Gal4esn
half-life to be between 3-5 hours (i.e. γgal ∼ 0.2 − 0.33). A calibration with varying levels of celllysate was also run to test linearity of measurement (bottom). (f) Inferring the Hill coefficient of theGal4esn-UAS interaction based on the measured values of τ and γgal, using the relationship shownin equation, inset. The black line shows how measurements of γgal constrain the possible range ofunderlying Hill coefficients. The dark gray region indicates the range of nH values consistent withvariability in the measurement of τ in (f). The light gray region indicates the measured range ofγgal. The intersection between the two gray regions provides the range of likely for nH values. Thisresult shows that the effective cooperativity of the Gal4esn-UAS interaction does not significantlyexceed 1.

88
5www.nature.com/nature
SUPPLEMENTARY INFORMATIONdoi: 10.1038/nature08959
OP9-Delta
responding cells:hN1G4esn -No-Delta
OP9-Mag
Activating cells:
TO-Delta-mCherry
+Dox
TO-Delta-mCherry
-Dox
+ Dplate
- Dplate
Figure S3
0
1
2
3
4
5x 10⁵
YFP
fluor
esce
nce
[RFU
]
3
of cells, and analyzed using the techniques described in the text and methods. This result together with the non‐cooperative behavior of the Galesn‐UAS system shown in Fig. S2 is consistent with a non‐cooperative activation of the 12xCSL promoter by Notch ICD.
Figure S2: The Gal4esn‐UAS transcription factor‐promoter interaction shows no cooperativity. This figure describes a measurement of the relationship between Gal4esn concentration and the transcriptional activity of its target UAS promoter. As in Fig. 3A and ref. 2, the approach involves allowing the transcription factor to decay and/or dilute while following the activity of its target promoter. (a) Schematic of cell line design. In this cell line, Gal4esn is expressed from a tet‐dependent promoter under the control of the doxycyline inducer. Gal4esn activates expression of an H2B‐YFP (Citrine) reporter gene. (b) Schematic of experimental design. Prior to the start of the movie, cells were induced with a pulse of doxycycline, which was then washed out immediately before the beginning of time‐lapse movie recording. Consequently, Gal4esn was expressed, and then allowed to degrade and/or dilute over time (red curve, bottom panel), while H2B‐YFP fluorescence was monitored in individual cell lineages (top panel). γgal denotes the effective decay rate of Gal4
esn. For large enough pulses of Gal4esn expression, the resulting data (shown schematically) would be expected to show constant rates of production of YFP (slopes of green line), interrupted by a ~2‐fold decrease in YFP levels at cell division events, due to partitioning of the YFP to daughter cells. To avoid discontinuities inherent to cell division events, the “lost” fluorescence after division is replaced (computationally) after each cell division event (dashed line and arrows). The slope of the resulting (dashed) trace is directly related to the activity of the UAS promoter, shown in the inset of (d). Here we focus on the relative timescale required for the slope to fall from 73% to 23% of its initial value as Gal4esn decays (cf. Fig. 3A). (c) Observed YFP accumulation in individual cell lineages. These traces have been corrected for cell division events as shown in (b). (d) Histogram of measured values determined from traces like those in (c) shows that, despite variability in initial levels of expression, the timescales, , required for turn off were relatively constant. (e) Using a time‐course Western blot against Gal4esn, we observed the Gal4esn half‐life to be between ~3‐5 hours (i.e. ). A calibration with varying levels of cell lysate was also run to
test linearity of measurement (bottom). (f) Inferring the Hill coefficient of the Gal4esn‐UAS interaction based on the measured values of and , using the relationship shown in equation, inset. The black
line shows how measurements of constrain the possible range of underlying Hill coefficients. The
dark gray region indicates the range of values consistent with variability in the measurement of in (f). The light gray region indicates the measured range of . The intersection between the two gray
regions provide the range of likely for values. This result shows that the effective cooperativity of the Gal4esn‐UAS interaction does not significantly exceed 1.
Figure S3: TO‐Delta‐mCherry cells trans‐activate as efficiently as OP9‐Delta cells. We compared the relative abilities of the TO‐Delta‐mCherry cell line, the OP9‐Delta cell line, and Dplate to trans‐activate Notch. Stromal OP9 cells stably expressing mDll1 (OP9‐Delta) and control OP9 cells not expressing Delta1 (both are a generous gift from Ellen Rothenberg) and inducible CHO TO‐Delta‐mCherry cells were co‐cultured with hN1G4esn‐No‐Delta cells (containing Notch and a reporter only—see Fig. S5). Cells were
4
plated at a ratio of (70% Delta cells :30% Notch cells) at cell density of 1x10⁵ cells/ml and incubated for 48 hours, and then imaged in an epifluorescence microscope. TO‐Delta‐mCherry cells were either induced with 100ng/ml Dox or not induced, as indicated. A set of controls with Notch reporter cells grown with or without plate‐bound Delta (indicated by +Dplate and ‐Dplate, respectively) were measured at the same time. Green and Black circles correspond to YFP fluorescence of activated and non‐activated Notch cells, respectively (n=259 cells in each sample).
Figure S4: Calibration of plate bound Delta. Plates were incubated with different concentrations of IgG‐Deltaext (see methods for complete protocol). We determined the relationship between the concentration of IgG‐Deltaext used during incubation and the amount of IgG‐Deltaext actually adsorbed to the plate using a fluorescence binding assay. Right after incubation, plates were treated with anti‐human‐IgG conjugated to Alexa488 (Invitrogen). Fluorescence levels were measured using a plate reader (Wallac 1420, Perkin‐Elmer). As seen in the figure, the binding of IgG‐Deltaext starts to saturate at
concentrations bigger than 2ug/ml and is well‐fit by the Michaelis‐Menten curve ,
with and where is the concentration of IgG‐Deltaext used in the incubation step. In addition, to assess the spatial uniformity of , we took snapshots of the bound antibody using a
fluorescence microscope (not shown). We estimate the plate‐plate variation in at 10‐20%.
Figure S5: Notch activity responds to trans‐activation by cell‐bound Delta in a graded fashion. (A) In order to analyze trans‐activation between cells, we co‐cultured two cell lines, one expressing hN1G4esn and a reporter (hN1G4esn‐No‐Delta cell line, left), and one containing only inducible Delta‐mCherry (TO‐DMC cell line, right). See Table S2 for strain descriptions. (B) Filmstrip of intercellular trans‐activation taken from Movie S3. Here, the hN1G4esn‐No‐Delta cell line (green nuclei) was co‐cultured with TO‐DMC cell line induced with 10ng/ml doxycycline to express Delta‐mCherry (red cytoplasmic staining). Cell lines were co‐cultured at a density ratio of 80:20 (TO‐DMC: hN1G4esn–No‐Delta). Note the increasing Notch reporter fluorescence over time. (C) In contrast, without induction (no doxycycline), we observed much lower activation of Delta‐mCherry expression and Notch activity in the reporter cell lines. Note that color (intensity) scales in (B) and (C) are the same. (D) Single cell tracks from the two movies shown in B and C. (E) Distinguishing between two possible models of activation in this experiment: graded and switch‐like (schematic). Both models assume that some fraction of the cells do not respond even at maximal activation (here, we assume 20% ‘non responders’). In the graded model, the responding population shows an increase of its median (black circles) response above a threshold, with higher induction levels (coefficient of variation is kept fixed). In the switch‐like model, cells are in either the ‘on’ or ‘off’ states; only the fraction of cells occupying the ‘on’ state increases with Delta. Note that the two models predict qualitatively different responses of the mean number of activated cells with increasing Delta. (F) Experimental analysis of Notch reporter activation in individual cells (YFP production rates) at different levels of mean Delta‐mCherry induction. The green circles correspond to single cell YFP production rates in the hN1G4esn‐No‐Delta cell line above the threshold, determined by the basal expression without any Delta‐mCherry induction in the TO‐DMC cell line (a). The black circles correspond to cells that do not respond or that respond at levels below the threshold. The blue circles correspond to the median of activated cells. Error bars denote the 25 and 75 percentiles of the activated cells distributions. The response is consistent with a graded, rather than switch‐like, model of trans‐
3
of cells, and analyzed using the techniques described in the text and methods. This result together with the non‐cooperative behavior of the Galesn‐UAS system shown in Fig. S2 is consistent with a non‐cooperative activation of the 12xCSL promoter by Notch ICD.
Figure S2: The Gal4esn‐UAS transcription factor‐promoter interaction shows no cooperativity. This figure describes a measurement of the relationship between Gal4esn concentration and the transcriptional activity of its target UAS promoter. As in Fig. 3A and ref. 2, the approach involves allowing the transcription factor to decay and/or dilute while following the activity of its target promoter. (a) Schematic of cell line design. In this cell line, Gal4esn is expressed from a tet‐dependent promoter under the control of the doxycyline inducer. Gal4esn activates expression of an H2B‐YFP (Citrine) reporter gene. (b) Schematic of experimental design. Prior to the start of the movie, cells were induced with a pulse of doxycycline, which was then washed out immediately before the beginning of time‐lapse movie recording. Consequently, Gal4esn was expressed, and then allowed to degrade and/or dilute over time (red curve, bottom panel), while H2B‐YFP fluorescence was monitored in individual cell lineages (top panel). γgal denotes the effective decay rate of Gal4
esn. For large enough pulses of Gal4esn expression, the resulting data (shown schematically) would be expected to show constant rates of production of YFP (slopes of green line), interrupted by a ~2‐fold decrease in YFP levels at cell division events, due to partitioning of the YFP to daughter cells. To avoid discontinuities inherent to cell division events, the “lost” fluorescence after division is replaced (computationally) after each cell division event (dashed line and arrows). The slope of the resulting (dashed) trace is directly related to the activity of the UAS promoter, shown in the inset of (d). Here we focus on the relative timescale required for the slope to fall from 73% to 23% of its initial value as Gal4esn decays (cf. Fig. 3A). (c) Observed YFP accumulation in individual cell lineages. These traces have been corrected for cell division events as shown in (b). (d) Histogram of measured values determined from traces like those in (c) shows that, despite variability in initial levels of expression, the timescales, , required for turn off were relatively constant. (e) Using a time‐course Western blot against Gal4esn, we observed the Gal4esn half‐life to be between ~3‐5 hours (i.e. ). A calibration with varying levels of cell lysate was also run to
test linearity of measurement (bottom). (f) Inferring the Hill coefficient of the Gal4esn‐UAS interaction based on the measured values of and , using the relationship shown in equation, inset. The black
line shows how measurements of constrain the possible range of underlying Hill coefficients. The
dark gray region indicates the range of values consistent with variability in the measurement of in (f). The light gray region indicates the measured range of . The intersection between the two gray
regions provide the range of likely for values. This result shows that the effective cooperativity of the Gal4esn‐UAS interaction does not significantly exceed 1.
Figure S3: TO‐Delta‐mCherry cells trans‐activate as efficiently as OP9‐Delta cells. We compared the relative abilities of the TO‐Delta‐mCherry cell line, the OP9‐Delta cell line, and Dplate to trans‐activate Notch. Stromal OP9 cells stably expressing mDll1 (OP9‐Delta) and control OP9 cells not expressing Delta1 (both are a generous gift from Ellen Rothenberg) and inducible CHO TO‐Delta‐mCherry cells were co‐cultured with hN1G4esn‐No‐Delta cells (containing Notch and a reporter only—see Fig. S5). Cells were
Figure : Figure S3: TO-Delta-mCherry cells trans-activate as efficiently as OP9-Delta cells. We com-pared the relative abilities of the TO-Delta-mCherry cell line, the OP9-Delta cell line, and Dplate
to trans-activate Notch. Stromal OP9 cells stably expressing mDll1 (OP9-Delta) and control OP9cells not expressing Delta[1] (both are a generous gift from Ellen Rothenberg) and inducible CHOTO-Delta-mCherry cells were co-cultured with hN1G4esn-No-Delta cells (containing Notch and areporter only–see Fig. S5). Cells were plated at a ratio of (70% Delta cells :30% Notch cells) at celldensity of 1×10⁵ cells/ml and incubated for 48 hours, and then imaged in an epifluorescence micro-scope. TO-Delta-mCherry cells were either induced with 100ng/ml Dox or not induced, as indicated.A set of controls with Notch reporter cells grown with or without plate-bound Delta (indicated by+Dplate and -Dplate, respectively) were measured at the same time. Green and Black circles corre-spond to YFP fluorescence of activated and non-activated Notch cells, respectively (n=259 cells ineach sample).

89
6www.nature.com/nature
doi: 10.1038/nature08959 SUPPLEMENTARY INFORMATION
0 1 2 3 4 50
2
4
6
8
10
12x 104
Nominal Delta level [μg/ml]
Fluo
resc
ence
[RFU
]
F=FMax
DD+K
Figure S4
K=2.78 ± 0.55
4
plated at a ratio of (70% Delta cells :30% Notch cells) at cell density of 1x10⁵ cells/ml and incubated for 48 hours, and then imaged in an epifluorescence microscope. TO‐Delta‐mCherry cells were either induced with 100ng/ml Dox or not induced, as indicated. A set of controls with Notch reporter cells grown with or without plate‐bound Delta (indicated by +Dplate and ‐Dplate, respectively) were measured at the same time. Green and Black circles correspond to YFP fluorescence of activated and non‐activated Notch cells, respectively (n=259 cells in each sample).
Figure S4: Calibration of plate bound Delta. Plates were incubated with different concentrations of IgG‐Deltaext (see methods for complete protocol). We determined the relationship between the concentration of IgG‐Deltaext used during incubation and the amount of IgG‐Deltaext actually adsorbed to the plate using a fluorescence binding assay. Right after incubation, plates were treated with anti‐human‐IgG conjugated to Alexa488 (Invitrogen). Fluorescence levels were measured using a plate reader (Wallac 1420, Perkin‐Elmer). As seen in the figure, the binding of IgG‐Deltaext starts to saturate at
concentrations bigger than 2ug/ml and is well‐fit by the Michaelis‐Menten curve ,
with and where is the concentration of IgG‐Deltaext used in the incubation step. In addition, to assess the spatial uniformity of , we took snapshots of the bound antibody using a
fluorescence microscope (not shown). We estimate the plate‐plate variation in at 10‐20%.
Figure S5: Notch activity responds to trans‐activation by cell‐bound Delta in a graded fashion. (A) In order to analyze trans‐activation between cells, we co‐cultured two cell lines, one expressing hN1G4esn and a reporter (hN1G4esn‐No‐Delta cell line, left), and one containing only inducible Delta‐mCherry (TO‐DMC cell line, right). See Table S2 for strain descriptions. (B) Filmstrip of intercellular trans‐activation taken from Movie S3. Here, the hN1G4esn‐No‐Delta cell line (green nuclei) was co‐cultured with TO‐DMC cell line induced with 10ng/ml doxycycline to express Delta‐mCherry (red cytoplasmic staining). Cell lines were co‐cultured at a density ratio of 80:20 (TO‐DMC: hN1G4esn–No‐Delta). Note the increasing Notch reporter fluorescence over time. (C) In contrast, without induction (no doxycycline), we observed much lower activation of Delta‐mCherry expression and Notch activity in the reporter cell lines. Note that color (intensity) scales in (B) and (C) are the same. (D) Single cell tracks from the two movies shown in B and C. (E) Distinguishing between two possible models of activation in this experiment: graded and switch‐like (schematic). Both models assume that some fraction of the cells do not respond even at maximal activation (here, we assume 20% ‘non responders’). In the graded model, the responding population shows an increase of its median (black circles) response above a threshold, with higher induction levels (coefficient of variation is kept fixed). In the switch‐like model, cells are in either the ‘on’ or ‘off’ states; only the fraction of cells occupying the ‘on’ state increases with Delta. Note that the two models predict qualitatively different responses of the mean number of activated cells with increasing Delta. (F) Experimental analysis of Notch reporter activation in individual cells (YFP production rates) at different levels of mean Delta‐mCherry induction. The green circles correspond to single cell YFP production rates in the hN1G4esn‐No‐Delta cell line above the threshold, determined by the basal expression without any Delta‐mCherry induction in the TO‐DMC cell line (a). The black circles correspond to cells that do not respond or that respond at levels below the threshold. The blue circles correspond to the median of activated cells. Error bars denote the 25 and 75 percentiles of the activated cells distributions. The response is consistent with a graded, rather than switch‐like, model of trans‐
Figure : Figure S4: Calibration of plate bound Delta. Plates were incubated with different con-centrations of IgG-Deltaext (see methods for complete protocol). We determined the relationshipbetween the concentration of IgG-Deltaext used during incubation and the amount of IgG-Deltaext
actually adsorbed to the plate using a fluorescence binding assay. Right after incubation, plateswere treated with anti-human-IgG conjugated to Alexa488 (Invitrogen). Fluorescence levels weremeasured using a plate reader (Wallac 1420, Perkin-Elmer). As seen in the figure, the binding ofIgG-Deltaext starts to saturate at concentrations bigger than 2ug/ml and is well-fit by the Michaelis-Menten curve Dplate = Dnominal
1+Dnominal/K, with K = 2.78 and where Dnominal is the concentration of
IgG-Deltaext used in the incubation step. In addition, to assess the spatial uniformity of Dplate, wetook snapshots of the bound antibody using a fluorescence microscope (not shown). We estimatethe plate-plate variation in Dplate at 10-20%.

90
7www.nature.com/nature
SUPPLEMENTARY INFORMATIONdoi: 10.1038/nature08959
AFigure S5
H2B-CitrineUAS
hN1(ECD)-Gal4esn
DeltaTO mCherry
T=0 hrs 5 hrs 15 hrs10 hrs
B Dox = 10 ng/ml
Dox = 0 ng/mlC
D
20% 80%
T=0 hrs 5 hrs 15 hrs10 hrs
0 5 10 150
2
4
6
8
10 x103
Time [hours]
YFP
leve
l [RF
U]
10 ng/ml 0 ng/ml
F
0 2 4 6 80
3
6
9
12
mean Delta- mCherry level [RFU]
YFP
pro
duct
ion
rate
[RFU
/hou
r]
x102
x103
Threshold
Experimental
E
1 2 30
1
2
0
1
2
3 x10⁻²
0 60 120 1800
1
2
3
Notch response [AU]
frac
tioon
of c
ells
0
1
2
switch model
graded model
Schematicx102
Delta level [AU]
Not
ch re
spon
se [A
U]
graded model
switch model
Threshold
hN1G4esn-No-Delta TO-Delta-mCherry
00.05
0.10.19
0.270.35
0.49 0.74 0.97 1.16 1.440
1
2
3
4
YFP
prod
uctio
n ra
te [R
FU/h
our]
Calibrated Dplate [g/ml]
co-culture
Dplate
x103G
4
plated at a ratio of (70% Delta cells :30% Notch cells) at cell density of 1x10⁵ cells/ml and incubated for 48 hours, and then imaged in an epifluorescence microscope. TO‐Delta‐mCherry cells were either induced with 100ng/ml Dox or not induced, as indicated. A set of controls with Notch reporter cells grown with or without plate‐bound Delta (indicated by +Dplate and ‐Dplate, respectively) were measured at the same time. Green and Black circles correspond to YFP fluorescence of activated and non‐activated Notch cells, respectively (n=259 cells in each sample).
Figure S4: Calibration of plate bound Delta. Plates were incubated with different concentrations of IgG‐Deltaext (see methods for complete protocol). We determined the relationship between the concentration of IgG‐Deltaext used during incubation and the amount of IgG‐Deltaext actually adsorbed to the plate using a fluorescence binding assay. Right after incubation, plates were treated with anti‐human‐IgG conjugated to Alexa488 (Invitrogen). Fluorescence levels were measured using a plate reader (Wallac 1420, Perkin‐Elmer). As seen in the figure, the binding of IgG‐Deltaext starts to saturate at
concentrations bigger than 2ug/ml and is well‐fit by the Michaelis‐Menten curve ,
with and where is the concentration of IgG‐Deltaext used in the incubation step. In addition, to assess the spatial uniformity of , we took snapshots of the bound antibody using a
fluorescence microscope (not shown). We estimate the plate‐plate variation in at 10‐20%.
Figure S5: Notch activity responds to trans‐activation by cell‐bound Delta in a graded fashion. (A) In order to analyze trans‐activation between cells, we co‐cultured two cell lines, one expressing hN1G4esn and a reporter (hN1G4esn‐No‐Delta cell line, left), and one containing only inducible Delta‐mCherry (TO‐DMC cell line, right). See Table S2 for strain descriptions. (B) Filmstrip of intercellular trans‐activation taken from Movie S3. Here, the hN1G4esn‐No‐Delta cell line (green nuclei) was co‐cultured with TO‐DMC cell line induced with 10ng/ml doxycycline to express Delta‐mCherry (red cytoplasmic staining). Cell lines were co‐cultured at a density ratio of 80:20 (TO‐DMC: hN1G4esn–No‐Delta). Note the increasing Notch reporter fluorescence over time. (C) In contrast, without induction (no doxycycline), we observed much lower activation of Delta‐mCherry expression and Notch activity in the reporter cell lines. Note that color (intensity) scales in (B) and (C) are the same. (D) Single cell tracks from the two movies shown in B and C. (E) Distinguishing between two possible models of activation in this experiment: graded and switch‐like (schematic). Both models assume that some fraction of the cells do not respond even at maximal activation (here, we assume 20% ‘non responders’). In the graded model, the responding population shows an increase of its median (black circles) response above a threshold, with higher induction levels (coefficient of variation is kept fixed). In the switch‐like model, cells are in either the ‘on’ or ‘off’ states; only the fraction of cells occupying the ‘on’ state increases with Delta. Note that the two models predict qualitatively different responses of the mean number of activated cells with increasing Delta. (F) Experimental analysis of Notch reporter activation in individual cells (YFP production rates) at different levels of mean Delta‐mCherry induction. The green circles correspond to single cell YFP production rates in the hN1G4esn‐No‐Delta cell line above the threshold, determined by the basal expression without any Delta‐mCherry induction in the TO‐DMC cell line (a). The black circles correspond to cells that do not respond or that respond at levels below the threshold. The blue circles correspond to the median of activated cells. Error bars denote the 25 and 75 percentiles of the activated cells distributions. The response is consistent with a graded, rather than switch‐like, model of trans‐
Figure S5 (caption on next page)

91
Figure : Figure S5 (previous page): Notch activity responds to trans-activation by cell-bound Deltain a graded fashion. (A) In order to analyze trans-activation between cells, we co-cultured two celllines, one expressing hN1G4esn and a reporter (hN1G4esn-No-Delta cell line, left), and one containingonly inducible Delta-mCherry (TO-DMC cell line, right). See Table S2 for strain descriptions. (B)Filmstrip of intercellular trans-activation taken from Movie S3. Here, the hN1G4esn-No-Delta cellline (green nuclei) was co-cultured with the TO-DMC cell line induced with 10ng/ml doxycycline toexpress Delta-mCherry (red cytoplasmic staining). Cell lines were co-cultured at a density ratio of80:20 (TO-DMC: hN1G4esn-No-Delta). Note the increasing Notch reporter fluorescence over time.(C) In contrast, without induction (no doxycycline), we observed much lower activation of Delta-mCherry expression and Notch activity in the reporter cell lines. Note that color (intensity) scalesin (B) and (C) are the same. (D) Single cell tracks from the two movies shown in B and C. (E)Distinguishing between two possible models of activation in this experiment: graded and switch-like(schematic). Both models assume that some fraction of the cells do not respond even at maximalactivation (here, we assume 20% ‘non responders’). In the graded model, the responding populationshows an increase of its median (black circles) response above a threshold, with higher inductionlevels (coefficient of variation is kept fixed). In the switch-like model, cells are in either the ‘on’ or‘off’ states; only the fraction of cells occupying the ‘on’ state increases with Delta. Note that the twomodels predict qualitatively different responses of the mean number of activated cells with increasingDelta. (F) Experimental analysis of Notch reporter activation in individual cells (YFP productionrates) at different levels of mean Delta-mCherry induction. The green circles correspond to singlecell YFP production rates in the hN1G4esn-No-Delta cell line above the threshold, determined bythe basal expression without any Delta-mCherry induction in the TO-DMC cell line (a). The blackcircles correspond to cells that do not respond or that respond at levels below the threshold. Theblue circles correspond to the median of activated cells. Error bars denote the 25 and 75 percentilesof the activated cells’ distributions. The response is consistent with a graded, rather than switch-like,model of trans-activation (e). (G) For comparison, a similar analysis was performed on the plate-bound Delta induction data shown in Fig. 2 c,d. Here, individual data points correspond to ratesof YFP production. Note the graded, saturating response of the median response (blue data pointsand line) to Dplate. The red lines indicate a best fit of these median responses to a Hill function, with95% confidence intervals bounded by the dashed red lines. The best fit Hill coefficient was 1.8± 0.9,in agreement with values obtained in Fig. 2D. Note that the relative fluorescence unit (RFU) scalesin (F) and (G) are different due to the use of different imaging conditions. Together, these resultsshow, first, that plate-bound and cell-expressed Delta trans-activate with similar cooperativity, andsecond, that the analysis based on population average response shown in Fig. 2D for plate-boundDelta produces equivalent results to the single-cell analysis of activation by cellular Delta.

92
9www.nature.com/nature
SUPPLEMENTARY INFORMATIONdoi: 10.1038/nature08959
T=0 18 hrs 27 hrs 36 hrs 45 hrs 54 hrs
T=0 18 hrs 27 hrs 36 hrs 45 hrs 54 hrs
Dp=1.45 ug/ml, with Dox pulse
Dp=0 ug/ml, with Dox pulse
A
T=0 12 hrs 24 hrs 36 hrs 48 hrs
T=0 12 hrs 24 hrs 36 hrs 48 hrs
Dp=1.16 ug/ml, no Dox
Dp=0 ug/ml, no Dox
B
Figure S6
5
activation (e). (G) For comparison, a similar analysis was performed on the plate‐bound Delta induction data shown in Fig. 2 c,d. Here, individual data points correspond to rates of YFP production. Note the graded, saturating response of the median response (blue data points and line) to Dplate. The red lines indicate a best fit of these median responses to a Hill function, with 95% confidence intervals bounded by the dashed red lines. The best fit Hill coefficient was 1.8 ± 0.9, in agreement with values obtained in Fig. 2D. Note that the relative fluorescence unit (RFU) scales in (F) and (G) are different due to the use of different imaging conditions. Together, these results show, first, that plate‐bound and cell‐expressed Delta trans‐activate with similar cooperativity, and second, that the analysis based on population average response shown in Fig. 2D for plate‐bound Delta produces equivalent results to the single‐cell analysis of activation by cellular Delta.
Figure S6: Induction at Dplate=0 is small compared to higher Dplate levels. (A) Filmstrips comparing activation of hN1G4esn cells at Dplate=0 and Dplate=1.16 μg/ml (Fig. 2B). No induction is observed at Dplate=0. (B) Filmstrips comparing activation of hN1G4esn cells induced with a doxycycline pulse at Dplate=0 and Dplate=1.16ug/ml (Fig. 2B). Only very few cells are induced in this case compared to higher Dplate. Thus, at this cell density transactivation between hN1G4esn cells has only a small effect (this is also seen in the average data in Fig. 3G).
Figure S7: The hN1 cell line also shows an ultrasensitive response. hN1 cells show delayed turn‐on in Notch signaling in response to slow decay of Delta‐mCherry. Protocol is as described in Fig. 3A.
Figure S8: Delta inactivation by Notch is required for sharp responses to cis‐Delta at fixed threshold. We simulated a model in which Delta inactivates Notch catalytically. In this model Delta is assumed to be recycled back after interaction with Notch (See theoretical supplementary for derivation and parameters). Note that, unlike the simulations based on the mutual inactivation model (Fig. 3H), here the turn‐on curves do not exhibit sharp responses, and the threshold positions vary with Dplate. Note that the range of Dplate was scaled up to show the full response spectrum because a much higher Dplate is required to overcome the effect of Dcis.
Figure S9: Notch cis‐inactivates Delta. (A) Cells expressing hN1G4esn and a UAS‐H2B‐Citrine reporter (hN1G4esn–No‐Delta) were cocultured with cells expressing Delta (TO‐DMC) or cells expressing Notch and Delta (TO‐Delta‐mCherry+hN1G4esn). Note that TO‐Delta‐mCherry+hN1G4esn cell line does not contain a reporter. This enables measurement of the response only from the Notch reporter cells. The level of Delta‐mCherry in both of the inducing cell lines is similar across a wide dox induction range (not shown) providing evidence that Notch does not induce Delta degradation. Experimental procedure: Cells were co‐cultured at the indicated ratios and plated at 1x10⁵ cells/ml. Cells were subjected to a 12 hour doxycycline pulse (weak induction) with different dox levels. FACS analysis was performed 24 hours after the dox pulse using a FACSCalibur. (B) Fluorescence distributions in co‐culture experiments. A total of 50,000 cells were measured for each sample. Only cells containing the Notch reporter are shown. The activation threshold (gray vertical line) is defined as a fluorescence level greater than that of 99.5% of negative control (dox=0). (C) Fraction of cells above threshold for the co‐culture experiments shown in (B). Standard errors were estimated using a bootstrapping method by calculating the standard error of 20 non‐overlapping subsamples. Note that the difference in the fraction of activated cells between the
Figure : Figure S6: Induction at Dplate=0 is small compared to higher Dplate levels. (A) Filmstripscomparing activation of hN1G4esn cells at Dplate=0 and Dplate=1.16 µg/ml (Fig. 2B). No inductionis observed at Dplate=0. (B) Filmstrips comparing activation of hN1G4esn cells induced with adoxycycline pulse at Dplate=0 and Dplate=1.16ug/ml (Fig. 2B). Only very few cells are induced inthis case compared to higher Dplate. Thus, at this cell density transactivation between hN1G4esn
cells has only a small effect (this is also seen in the average data in Fig. 3G).

93
10www.nature.com/nature
doi: 10.1038/nature08959 SUPPLEMENTARY INFORMATION
0 10 20 30 40 500
1
2
3
4
5
6x103 x104
0
1
2
3
4
5
6
time [hours]
YFP
leve
l [RF
U]
mea
n RF
P le
vel [
RFU
]
Figure S7
5
activation (e). (G) For comparison, a similar analysis was performed on the plate‐bound Delta induction data shown in Fig. 2 c,d. Here, individual data points correspond to rates of YFP production. Note the graded, saturating response of the median response (blue data points and line) to Dplate. The red lines indicate a best fit of these median responses to a Hill function, with 95% confidence intervals bounded by the dashed red lines. The best fit Hill coefficient was 1.8 ± 0.9, in agreement with values obtained in Fig. 2D. Note that the relative fluorescence unit (RFU) scales in (F) and (G) are different due to the use of different imaging conditions. Together, these results show, first, that plate‐bound and cell‐expressed Delta trans‐activate with similar cooperativity, and second, that the analysis based on population average response shown in Fig. 2D for plate‐bound Delta produces equivalent results to the single‐cell analysis of activation by cellular Delta.
Figure S6: Induction at Dplate=0 is small compared to higher Dplate levels. (A) Filmstrips comparing activation of hN1G4esn cells at Dplate=0 and Dplate=1.16 μg/ml (Fig. 2B). No induction is observed at Dplate=0. (B) Filmstrips comparing activation of hN1G4esn cells induced with a doxycycline pulse at Dplate=0 and Dplate=1.16ug/ml (Fig. 2B). Only very few cells are induced in this case compared to higher Dplate. Thus, at this cell density transactivation between hN1G4esn cells has only a small effect (this is also seen in the average data in Fig. 3G).
Figure S7: The hN1 cell line also shows an ultrasensitive response. hN1 cells show delayed turn‐on in Notch signaling in response to slow decay of Delta‐mCherry. Protocol is as described in Fig. 3A.
Figure S8: Delta inactivation by Notch is required for sharp responses to cis‐Delta at fixed threshold. We simulated a model in which Delta inactivates Notch catalytically. In this model Delta is assumed to be recycled back after interaction with Notch (See theoretical supplementary for derivation and parameters). Note that, unlike the simulations based on the mutual inactivation model (Fig. 3H), here the turn‐on curves do not exhibit sharp responses, and the threshold positions vary with Dplate. Note that the range of Dplate was scaled up to show the full response spectrum because a much higher Dplate is required to overcome the effect of Dcis.
Figure S9: Notch cis‐inactivates Delta. (A) Cells expressing hN1G4esn and a UAS‐H2B‐Citrine reporter (hN1G4esn–No‐Delta) were cocultured with cells expressing Delta (TO‐DMC) or cells expressing Notch and Delta (TO‐Delta‐mCherry+hN1G4esn). Note that TO‐Delta‐mCherry+hN1G4esn cell line does not contain a reporter. This enables measurement of the response only from the Notch reporter cells. The level of Delta‐mCherry in both of the inducing cell lines is similar across a wide dox induction range (not shown) providing evidence that Notch does not induce Delta degradation. Experimental procedure: Cells were co‐cultured at the indicated ratios and plated at 1x10⁵ cells/ml. Cells were subjected to a 12 hour doxycycline pulse (weak induction) with different dox levels. FACS analysis was performed 24 hours after the dox pulse using a FACSCalibur. (B) Fluorescence distributions in co‐culture experiments. A total of 50,000 cells were measured for each sample. Only cells containing the Notch reporter are shown. The activation threshold (gray vertical line) is defined as a fluorescence level greater than that of 99.5% of negative control (dox=0). (C) Fraction of cells above threshold for the co‐culture experiments shown in (B). Standard errors were estimated using a bootstrapping method by calculating the standard error of 20 non‐overlapping subsamples. Note that the difference in the fraction of activated cells between the
Figure : Figure S7: The hN1 cell line also shows an ultrasensitive response. hN1 cells show delayedturn-on in Notch signaling in response to slow decay of Delta-mCherry. Protocol is as described inFig. 3A.
11www.nature.com/nature
SUPPLEMENTARY INFORMATIONdoi: 10.1038/nature08959
0100
200300
020
4060
0
1
2
3
4x 10⁴
Repo
rter
[AU
]
Figure S8
Time [hours] Dplate [μg/ml]
5
activation (e). (G) For comparison, a similar analysis was performed on the plate‐bound Delta induction data shown in Fig. 2 c,d. Here, individual data points correspond to rates of YFP production. Note the graded, saturating response of the median response (blue data points and line) to Dplate. The red lines indicate a best fit of these median responses to a Hill function, with 95% confidence intervals bounded by the dashed red lines. The best fit Hill coefficient was 1.8 ± 0.9, in agreement with values obtained in Fig. 2D. Note that the relative fluorescence unit (RFU) scales in (F) and (G) are different due to the use of different imaging conditions. Together, these results show, first, that plate‐bound and cell‐expressed Delta trans‐activate with similar cooperativity, and second, that the analysis based on population average response shown in Fig. 2D for plate‐bound Delta produces equivalent results to the single‐cell analysis of activation by cellular Delta.
Figure S6: Induction at Dplate=0 is small compared to higher Dplate levels. (A) Filmstrips comparing activation of hN1G4esn cells at Dplate=0 and Dplate=1.16 μg/ml (Fig. 2B). No induction is observed at Dplate=0. (B) Filmstrips comparing activation of hN1G4esn cells induced with a doxycycline pulse at Dplate=0 and Dplate=1.16ug/ml (Fig. 2B). Only very few cells are induced in this case compared to higher Dplate. Thus, at this cell density transactivation between hN1G4esn cells has only a small effect (this is also seen in the average data in Fig. 3G).
Figure S7: The hN1 cell line also shows an ultrasensitive response. hN1 cells show delayed turn‐on in Notch signaling in response to slow decay of Delta‐mCherry. Protocol is as described in Fig. 3A.
Figure S8: Delta inactivation by Notch is required for sharp responses to cis‐Delta at fixed threshold. We simulated a model in which Delta inactivates Notch catalytically. In this model Delta is assumed to be recycled back after interaction with Notch (See theoretical supplementary for derivation and parameters). Note that, unlike the simulations based on the mutual inactivation model (Fig. 3H), here the turn‐on curves do not exhibit sharp responses, and the threshold positions vary with Dplate. Note that the range of Dplate was scaled up to show the full response spectrum because a much higher Dplate is required to overcome the effect of Dcis.
Figure S9: Notch cis‐inactivates Delta. (A) Cells expressing hN1G4esn and a UAS‐H2B‐Citrine reporter (hN1G4esn–No‐Delta) were cocultured with cells expressing Delta (TO‐DMC) or cells expressing Notch and Delta (TO‐Delta‐mCherry+hN1G4esn). Note that TO‐Delta‐mCherry+hN1G4esn cell line does not contain a reporter. This enables measurement of the response only from the Notch reporter cells. The level of Delta‐mCherry in both of the inducing cell lines is similar across a wide dox induction range (not shown) providing evidence that Notch does not induce Delta degradation. Experimental procedure: Cells were co‐cultured at the indicated ratios and plated at 1x10⁵ cells/ml. Cells were subjected to a 12 hour doxycycline pulse (weak induction) with different dox levels. FACS analysis was performed 24 hours after the dox pulse using a FACSCalibur. (B) Fluorescence distributions in co‐culture experiments. A total of 50,000 cells were measured for each sample. Only cells containing the Notch reporter are shown. The activation threshold (gray vertical line) is defined as a fluorescence level greater than that of 99.5% of negative control (dox=0). (C) Fraction of cells above threshold for the co‐culture experiments shown in (B). Standard errors were estimated using a bootstrapping method by calculating the standard error of 20 non‐overlapping subsamples. Note that the difference in the fraction of activated cells between the
Figure : Figure S8: Delta inactivation by Notch is required for sharp responses to cis-Delta atfixed threshold. We simulated a model in which Delta inactivates Notch catalytically. In this modelDelta is assumed to be recycled back after interaction with Notch (see theoretical supplementaryfor derivation and parameters). Note that, unlike the simulations based on the mutual inactivationmodel (Fig. 3H), here the turn-on curves do not exhibit sharp responses, and the threshold positionsvary with Dplate. Note that the range of Dplate was scaled up to show the full response spectrumbecause a much higher Dplate is required to overcome the effect of Dcis.

94
12www.nature.com/nature
doi: 10.1038/nature08959 SUPPLEMENTARY INFORMATION
100 102 1040
1
2
3
4
5
6
100 102 104 100 102 104
x10-2
YFP YFP YFP
frac
tion
of c
ells
Figure S9
H2B-CitrineUAS
hN1(ECD)-Gal4esn
DeltaTO mCherry
H2B-CitrineUAS
hN1(ECD)-Gal4esn
DeltaTO mCherry
hN1(ECD)-Gal4esn
A
B Dox =0 Dox =1.6 ng/ml Dox =100 ng/ml
80%
20%
80%
20%
activatingcell:
DD+N
vs
1.60
10
20
30
40
50
60
70
redu
ctio
n in
act
ivat
ion
abov
e th
resh
old
[%]
repeat1repeat2
1.6 100100(80:20) co-culture
Dox (ng/ml):(90:10) co-culture
DC
0 1.6 1000
5
10
15
activ
ated
frac
tion
of re
port
er c
ells
[%]
Doxycycline induction [ng/ml]
N
N
R
R
D
N D
co-cultures20% 80%
Dox
5
activation (e). (G) For comparison, a similar analysis was performed on the plate‐bound Delta induction data shown in Fig. 2 c,d. Here, individual data points correspond to rates of YFP production. Note the graded, saturating response of the median response (blue data points and line) to Dplate. The red lines indicate a best fit of these median responses to a Hill function, with 95% confidence intervals bounded by the dashed red lines. The best fit Hill coefficient was 1.8 ± 0.9, in agreement with values obtained in Fig. 2D. Note that the relative fluorescence unit (RFU) scales in (F) and (G) are different due to the use of different imaging conditions. Together, these results show, first, that plate‐bound and cell‐expressed Delta trans‐activate with similar cooperativity, and second, that the analysis based on population average response shown in Fig. 2D for plate‐bound Delta produces equivalent results to the single‐cell analysis of activation by cellular Delta.
Figure S6: Induction at Dplate=0 is small compared to higher Dplate levels. (A) Filmstrips comparing activation of hN1G4esn cells at Dplate=0 and Dplate=1.16 μg/ml (Fig. 2B). No induction is observed at Dplate=0. (B) Filmstrips comparing activation of hN1G4esn cells induced with a doxycycline pulse at Dplate=0 and Dplate=1.16ug/ml (Fig. 2B). Only very few cells are induced in this case compared to higher Dplate. Thus, at this cell density transactivation between hN1G4esn cells has only a small effect (this is also seen in the average data in Fig. 3G).
Figure S7: The hN1 cell line also shows an ultrasensitive response. hN1 cells show delayed turn‐on in Notch signaling in response to slow decay of Delta‐mCherry. Protocol is as described in Fig. 3A.
Figure S8: Delta inactivation by Notch is required for sharp responses to cis‐Delta at fixed threshold. We simulated a model in which Delta inactivates Notch catalytically. In this model Delta is assumed to be recycled back after interaction with Notch (See theoretical supplementary for derivation and parameters). Note that, unlike the simulations based on the mutual inactivation model (Fig. 3H), here the turn‐on curves do not exhibit sharp responses, and the threshold positions vary with Dplate. Note that the range of Dplate was scaled up to show the full response spectrum because a much higher Dplate is required to overcome the effect of Dcis.
Figure S9: Notch cis‐inactivates Delta. (A) Cells expressing hN1G4esn and a UAS‐H2B‐Citrine reporter (hN1G4esn–No‐Delta) were cocultured with cells expressing Delta (TO‐DMC) or cells expressing Notch and Delta (TO‐Delta‐mCherry+hN1G4esn). Note that TO‐Delta‐mCherry+hN1G4esn cell line does not contain a reporter. This enables measurement of the response only from the Notch reporter cells. The level of Delta‐mCherry in both of the inducing cell lines is similar across a wide dox induction range (not shown) providing evidence that Notch does not induce Delta degradation. Experimental procedure: Cells were co‐cultured at the indicated ratios and plated at 1x10⁵ cells/ml. Cells were subjected to a 12 hour doxycycline pulse (weak induction) with different dox levels. FACS analysis was performed 24 hours after the dox pulse using a FACSCalibur. (B) Fluorescence distributions in co‐culture experiments. A total of 50,000 cells were measured for each sample. Only cells containing the Notch reporter are shown. The activation threshold (gray vertical line) is defined as a fluorescence level greater than that of 99.5% of negative control (dox=0). (C) Fraction of cells above threshold for the co‐culture experiments shown in (B). Standard errors were estimated using a bootstrapping method by calculating the standard error of 20 non‐overlapping subsamples. Note that the difference in the fraction of activated cells between the
6
two samples is largest at intermediate Delta induction. This is consistent with the mutual inactivation model since the titration level of Notch should have larger effect at lower Delta expressions. (D) Qualitatively similar results were obtained in a repeat performed on a different day (dark gray vs light gray). Furthermore the relative reduction in activation of cells between the two samples remains similar even when the relative fractions of the two cell lines are changed to 10% Delta (or Delta+ Notch) cells and 90% Notch reporter cells.
Figure S10: Comparison of the mutual inactivation model to alternative models of boundary formation. (A) Three alternative models are compared to the mutual inactivation model discussed in the main text (blue). The ‘band‐pass’ model (red) assumes that the Notch target promoter responds only to a narrow range (“band”) of Notch signaling levels. This band‐pass function was represented by a product of activating and repressing Hill functions, each with Hill coefficient, n=8 (see section III of the supplementary modeling text). The high Hill coefficient is required to match the sharpness of the pattern generated with that obtained in the mutual inactivation model. For simplicity, no cis‐inhibition was considered in this case. The second alternative model (“bandpass + signal activates Notch”, green) adds an additional transcriptional feedback of Notch signaling on the production rate of Notch, so that Notch signaling activates expression of Notch. Such feedback makes the outer edge of the pattern sharper. The third alternative model (magenta, “bandpass + signal downregulates Delta”) adds feedback through Delta (Notch signaling downregulates production of Delta). This lateral inhibition type feedback tends to broaden the signal response. All models are defined in the supplementary theory section. See Table S3 for parameter values. Note that the two feedback models require fine tuning of the parameters to show a qualitative effect of the feedbacks (i.e. differentiate the feedback models from the simple bandpass). The four different panels correspond to Notch signaling profiles of the different models for N+/‐, D+/‐, and N+/‐ D+/‐ heterozygous mutants. All profiles were normalized to their maximal level to allow comparison of the boundary positions in different heterozygous mutant combinations. Top left corresponds to the wild‐type case. Top right: Only the mutual inactivation model (blue) is consistent with the observed broad but sharp wing vein phenotypes of the N+/‐ mutant3. Bottom left: The D+/‐ phenotype of the mutual inactivation model (blue), but not the other models, shows broadening of the signaling profile (note the extended tails at a distance of ~5 cell diameters on the x‐axis) and eliminates sharp side‐bands (note that the central “dip” is an effect of the sharp kink in the morphogen profile at 0, and would not occur with a more realistic morphogen profile). These effects occur when the D+/‐ mutation makes the Delta production rate smaller than the Notch production rate. See also discussion in (B). Bottom right: In the mutual inactivation model, but not the other models, the double mutant N+/‐ D+/‐ regains the wild‐type phenotype due to the ratiometric property discussed in Fig. 4D, Box 1, and in the text. This suppression is independent of the exact shape and length scale of the gradient. (B) Strong cis‐inhibition selectively reduces signaling in the D+/‐ mutant. Here we plot the 4 un‐normalized mutant profiles for the mutual inactivation model with a different parameter set (Table S3), with stronger cis‐inhibition. The reporter level for the N+/+ D+/‐ mutant is substantially smaller than those of the wild type and all others mutants at all positions along the morphogen gradient. Such ubiquituous subthreshold activity of the reporter can be expected to resemble the null Delta phenotype of thicker and less sharply defined veins. Note that suppression in the double mutant persists for these new parameters, as shown by the invariance of the positions of the
Figure S9 (caption on next page)

95
Figure : Figure S9 (previous page): Notch cis-inactivates Delta. (A) Cells expressing hN1G4esn
and a UAS-H2B-Citrine reporter (hN1G4esn-No-Delta) were co-cultured with cells expressing Delta(TO-DMC) or cells expressing Notch and Delta (TO-Delta-mCherry+hN1G4esn). Note that TO-Delta-mCherry+hN1G4esn cell line does not contain a reporter. This enables measurement of theresponse only from the Notch reporter cells. The level of Delta-mCherry in both of the inducingcell lines is similar across a wide dox induction range (not shown) providing evidence that Notchdoes not induce Delta degradation. Experimental procedure: Cells were co-cultured at the indicatedratios and plated at 1 × 10⁵ cells/ml. Cells were subjected to a 12 hour doxycycline pulse (weakinduction) with different dox levels. FACS analysis was performed 24 hours after the dox pulse usinga FACSCalibur. (B) Fluorescence distributions in co-culture experiments. A total of 50,000 cellswere measured for each sample. Only cells containing the Notch reporter are shown. The activationthreshold (gray vertical line) is defined as a fluorescence level greater than that of 99.5% of negativecontrol (dox=0). (C) Fraction of cells above threshold for the co-culture experiments shown in(B). Standard errors were estimated using a bootstrapping method by calculating the standarderror of 20 non-overlapping subsamples. Note that the difference in the fraction of activated cellsbetween the two samples is largest at intermediate Delta induction. This is consistent with themutual inactivation model since the titration level of Notch should have larger effect at lower Deltaexpressions. (D) Qualitatively similar results were obtained in a repeat performed on a different day(dark gray vs light gray). Furthermore the relative reduction in activation of cells between the twosamples remains similar even when the relative fractions of the two cell lines are changed to 10%Delta (or Delta+ Notch) cells and 90% Notch reporter cells.

96
13www.nature.com/nature
SUPPLEMENTARY INFORMATIONdoi: 10.1038/nature08959
N+/+ D+/+
Mutual inactivationbandpass modelbandpass+Signal activates Notch
Figure S10A
N-/+ D-/+
N+/- D+/+
N+/+ D+/-
Distance [# of cells]Distance [# of cells]
repo
rter
(nor
mal
ized
)re
port
er (n
orm
aliz
ed)
bandpass+Signal downregulates Delta
5 10 15 200
0.2
0.4
0.6
0.8
1
5 10 15 20
0
0.2
0.4
0.6
0.8
1
No NN feedback
knn= 0.1
knn= 0.21544
knn= 0.46416
knn= 1
5 10 15 200
0.2
0.4
0.6
0.8
1
Repo
rter
(nor
mal
ized
)
5 10 15 20
N+/+ D+/+
N-/+ D-/+
Distance [# of cells] Distance [# of cells]
C
B
5 10 15 200
0.05
0.1
0.15
0.2
Repo
rter
D+/+ N+/+D+/+ N+/-D+/- N+/+D+/- N+/-
Distance [# of cells]
6
two samples is largest at intermediate Delta induction. This is consistent with the mutual inactivation model since the titration level of Notch should have larger effect at lower Delta expressions. (D) Qualitatively similar results were obtained in a repeat performed on a different day (dark gray vs light gray). Furthermore the relative reduction in activation of cells between the two samples remains similar even when the relative fractions of the two cell lines are changed to 10% Delta (or Delta+ Notch) cells and 90% Notch reporter cells.
Figure S10: Comparison of the mutual inactivation model to alternative models of boundary formation. (A) Three alternative models are compared to the mutual inactivation model discussed in the main text (blue). The ‘band‐pass’ model (red) assumes that the Notch target promoter responds only to a narrow range (“band”) of Notch signaling levels. This band‐pass function was represented by a product of activating and repressing Hill functions, each with Hill coefficient, n=8 (see section III of the supplementary modeling text). The high Hill coefficient is required to match the sharpness of the pattern generated with that obtained in the mutual inactivation model. For simplicity, no cis‐inhibition was considered in this case. The second alternative model (“bandpass + signal activates Notch”, green) adds an additional transcriptional feedback of Notch signaling on the production rate of Notch, so that Notch signaling activates expression of Notch. Such feedback makes the outer edge of the pattern sharper. The third alternative model (magenta, “bandpass + signal downregulates Delta”) adds feedback through Delta (Notch signaling downregulates production of Delta). This lateral inhibition type feedback tends to broaden the signal response. All models are defined in the supplementary theory section. See Table S3 for parameter values. Note that the two feedback models require fine tuning of the parameters to show a qualitative effect of the feedbacks (i.e. differentiate the feedback models from the simple bandpass). The four different panels correspond to Notch signaling profiles of the different models for N+/‐, D+/‐, and N+/‐ D+/‐ heterozygous mutants. All profiles were normalized to their maximal level to allow comparison of the boundary positions in different heterozygous mutant combinations. Top left corresponds to the wild‐type case. Top right: Only the mutual inactivation model (blue) is consistent with the observed broad but sharp wing vein phenotypes of the N+/‐ mutant3. Bottom left: The D+/‐ phenotype of the mutual inactivation model (blue), but not the other models, shows broadening of the signaling profile (note the extended tails at a distance of ~5 cell diameters on the x‐axis) and eliminates sharp side‐bands (note that the central “dip” is an effect of the sharp kink in the morphogen profile at 0, and would not occur with a more realistic morphogen profile). These effects occur when the D+/‐ mutation makes the Delta production rate smaller than the Notch production rate. See also discussion in (B). Bottom right: In the mutual inactivation model, but not the other models, the double mutant N+/‐ D+/‐ regains the wild‐type phenotype due to the ratiometric property discussed in Fig. 4D, Box 1, and in the text. This suppression is independent of the exact shape and length scale of the gradient. (B) Strong cis‐inhibition selectively reduces signaling in the D+/‐ mutant. Here we plot the 4 un‐normalized mutant profiles for the mutual inactivation model with a different parameter set (Table S3), with stronger cis‐inhibition. The reporter level for the N+/+ D+/‐ mutant is substantially smaller than those of the wild type and all others mutants at all positions along the morphogen gradient. Such ubiquituous subthreshold activity of the reporter can be expected to resemble the null Delta phenotype of thicker and less sharply defined veins. Note that suppression in the double mutant persists for these new parameters, as shown by the invariance of the positions of the
Figure S10 (caption on next page)

97
Figure : Figure S10 (previous page): Comparison of the mutual inactivation model to alternativemodels of boundary formation. (A) Three alternative models are compared to the mutual inac-tivation model discussed in the main text (blue). The ‘band-pass’ model (red) assumes that theNotch target promoter responds only to a narrow range (“band”) of Notch signaling levels. Thisband-pass function was represented by a product of activating and repressing Hill functions, eachwith Hill coefficient, n = 8 (see Section III of the supplementary modeling text). The high Hillcoefficient is required to match the sharpness of the pattern generated with that obtained in themutual inactivation model. For simplicity, no cis-inhibition was considered in this case. The secondalternative model (“bandpass + signal activates Notch”, green) adds an additional transcriptionalfeedback of Notch signaling on the production rate of Notch, so that Notch signaling activates ex-pression of Notch. Such feedback makes the outer edge of the pattern sharper. The third alternativemodel (magenta, “bandpass + signal downregulates Delta”) adds feedback through Delta (Notchsignaling downregulates production of Delta). This lateral inhibition type feedback tends to broadenthe signal response. All models are defined in the supplementary theory section. See Table S3 forparameter values. Note that the two feedback models require fine tuning of the parameters to showa qualitative effect of the feedbacks (i.e. to differentiate the feedback models from the simple band-pass). The four different panels correspond to Notch signaling profiles of the different models forN+/+, D+/+, and N+/- D+/- heterozygous mutants. All profiles were normalized to their maximallevel to allow comparison of the boundary positions in different heterozygous mutant combinations.Top left corresponds to the wild-type case. Top right: Only the mutual inactivation model (blue) isconsistent with the observed broad but sharp wing vein phenotypes of the N+/- mutant[3]. Bottomleft: The D+/- phenotype of the mutual inactivation model (blue), but not the other models, showsbroadening of the signaling profile (note the extended tails at a distance of approximately five celldiameters on the x-axis) and eliminates sharp side-bands (note that the central “dip” is an effect ofthe sharp kink in the morphogen profile at 0, and would not occur with a more realistic morphogenprofile). These effects occur when the D+/- mutation makes the Delta production rate smaller thanthe Notch production rate. See also discussion in (B). Bottom right: In the mutual inactivationmodel, but not the other models, the double mutant N+/- D+/- regains the wild-type phenotypedue to the ratiometric property discussed in Fig. 4D, Box 1, and in the text. This suppression isindependent of the exact shape and length scale of the gradient. (B) Strong cis-inhibition selectivelyreduces signaling in the D+/- mutant. Here we plot the four un-normalized mutant profiles for themutual inactivation model with a different parameter set (Table S3), with stronger cis-inhibition.The reporter level for the N+/+ D+/- mutant is substantially smaller than those of the wild typeand all other mutants at all positions along the morphogen gradient. Such ubiquituous subthresholdactivity of the reporter can be expected to resemble the null Delta phenotype of thicker and lesssharply defined veins. Note that suppression in the double mutant persists for these new parameters,as shown by the invariance of the positions of the bands between wild-type and N+/- D+/-. Moregenerally, suppression in the double mutant is maintained across a wide range of parameter values.(C) Positive feedback through Notch has a modest effect on suppression in the double mutant. Herewe considered a variant of the mutual inactivation model in which Notch activity leads to increasedexpression of Notch. The strength of this feedback is quantified by the parameter knn, which denotesthe amount of Notch signaling necessary to half-maximally induce the additional Notch production(supplementary theory section). Only intermediate values of knn change the spatial pattern (i.e.broaden it) without destroying its qualitative shape. Within this range, suppression is generallymaintained except for a modest expansion (<∼ 1 cell) in the double mutant compared to wild-type.
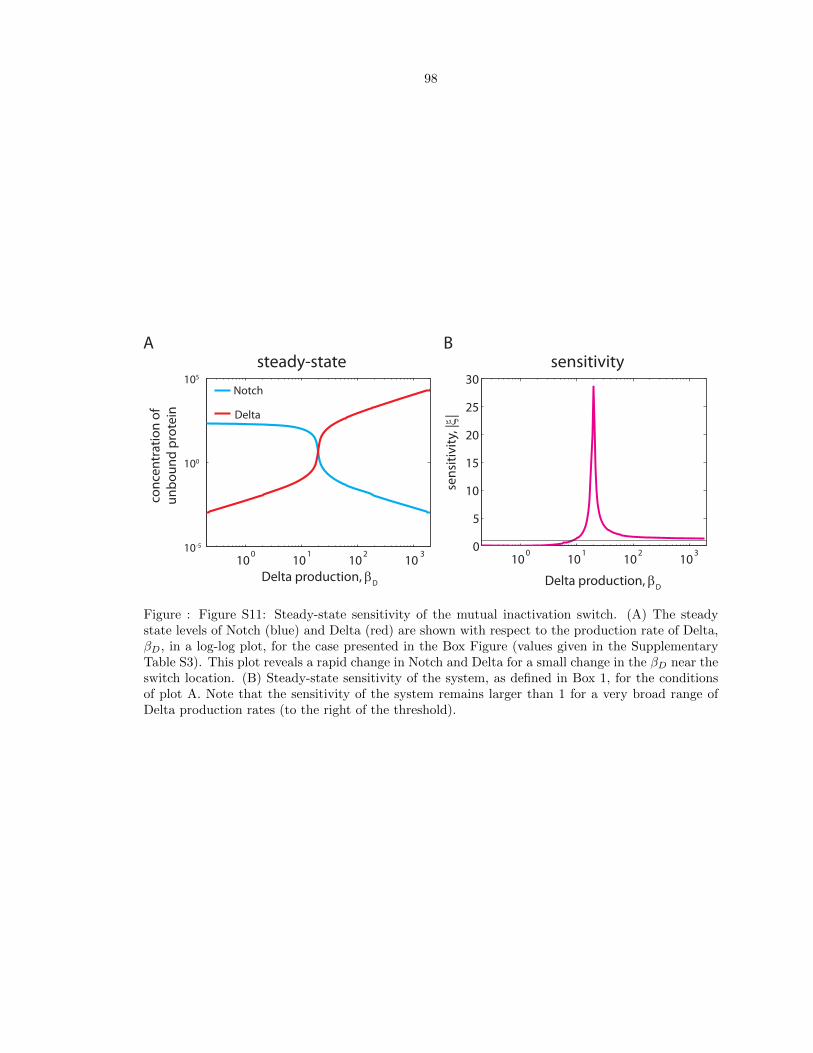
98
15www.nature.com/nature
SUPPLEMENTARY INFORMATIONdoi: 10.1038/nature08959
100
101
102
1030
5
10
15
20
25
30
sens
itivi
ty, |ξ|
10-5
100
105
Delta production, βD
conc
entr
atio
n of
unbo
und
prot
ein
Notch
Delta
A Bsteady-state sensitivity
100
101
102
103
Delta production, βD
Figure S11
7
bands between wild‐type and N+/‐ D+/‐. More generally, suppression in the double mutant is maintained across a wide range of parameter values. (C) Positive feedback through Notch has a modest effect on suppression in the double mutant. Here we considered a variant of the mutual inactivation model in which Notch activity leads to increased expression of Notch. The strength of this feedback is quantified by the parameter knn, which denotes the amount of Notch signaling necessary to half‐maximally induce the additional Notch production (supplementary theory section). Only intermediate values of knn change the spatial pattern (i.e. broaden it) without destroying its qualitative shape. Within this range, suppression is generally maintained except for a modest expansion (< ~1 cell) in the double mutant compared to wild‐type. Figure S11: Steady‐state sensitivity of the mutual inactivation switch. (A) The steady state levels of Notch (blue) and Delta (red) are shown with respect to the production rate of Delta, , in a log‐log plot, for the case presented in the Box Figure (values given in the Supplementary Table S3). This plot reveals a rapid change in Notch and Delta for a small change in the near the switch location. (B) Steady‐state sensitivity of the system, as defined in Box 1, for the conditions of plot A. Note that the sensitivity of the system remains larger than 1 for a very broad range of Delta production rates (to the right of the threshold).
Figure S12: Negative controls show that Notch signaling is not affected by doxycycline, and growth rate is not affected by doxycycline and Dplate. (A) Cells expressing Notch (hN1G4esn ‐No‐Delta) were induced by Dplate to similar levels of Notch activity in the presence or absence of 100ng/ml doxycycline (protocol was similar to the ones used in Fig.2), showing that Notch activity is not influenced directly by doxycycine. (B) The growth rate of the Notch reporter cells was not affected by presence of doxycycline. (C) Mean growth rate of the cells shown in Fig. 2C,D,E is not affected by Dplate. Growth rate was defined as the rate of increase in the number of cells per field of view (fov) over time.
Figure S13: Relation of population average data (median over all segmented cells) and single cell data. (A) Plots of total cellular fluorescence versus time for each of 26 non‐overlapping cell lineages from the movie shown in Figs. 3B, (blue lines). Sudden drops in total fluorescence are due to cell division events, as in Fig. 3D. We compare the median of these 26 responses (cyan) to the median over all cells (green). Note that this latter curve is identical to that shown in Fig. 3. For discussion see supplementary methods. (B) Analysis of sharp responses to cis‐Delta in individual cells. The concentration of Delta‐mCherry (red) and the shifted level of YFP (green, cf. Fig. 3e) are plotted as a function of time for two different cell lineages. Delta‐mCherry concentrations were estimated from total Delta‐mCherry fluorescence levels by assuming linear growth in cell volume during each cell cycle. The Delta‐mCherry data were fit to exponential decays (superimposed black lines). The YFP response curves were fit to generate the turn‐on function (superimposed black lines). The fit has four free parameters: a constant offset, a final slope, a turn‐on time (ton), and τrise (see supplementary methods). Inset: plots of resulting Hill function fits for the production rate of YFP as a function of the concentration of Delta‐mCherry. These fits produced best fit Hill coefficients of n=22±10 and n=5.5±0.8 for cells 1 and 2, respectively. (C) Analysis of slope distributions of cis‐Delta response shows a switch‐like, rather than graded behavior. All 26 single cell traces were divided into short, 6 hour segments. The response on each segment was
Figure : Figure S11: Steady-state sensitivity of the mutual inactivation switch. (A) The steadystate levels of Notch (blue) and Delta (red) are shown with respect to the production rate of Delta,βD, in a log-log plot, for the case presented in the Box Figure (values given in the SupplementaryTable S3). This plot reveals a rapid change in Notch and Delta for a small change in the βD near theswitch location. (B) Steady-state sensitivity of the system, as defined in Box 1, for the conditionsof plot A. Note that the sensitivity of the system remains larger than 1 for a very broad range ofDelta production rates (to the right of the threshold).

99
16www.nature.com/nature
doi: 10.1038/nature08959 SUPPLEMENTARY INFORMATION
0 0.5 1 1.50
2
4
6
8
10
Calibrated Dplate [μg/ml]
mea
n gr
owth
rate
[cel
ls/f
ov/h
our]
R2=0.0089 (uncorrelated)
0
2
4
6
8
Fold
act
ivat
ion
-Dox +Dox -Dox +Dox
Dplate=0 ug/ml Dplate=0.74 ug/ml
hN1G4esn -No-Delta hN1G4esn -NO-Delta
hN1G4esn , No Dox
n=8 fovs
0
1
2
3
4
mea
n gr
owth
rate
[cel
ls/f
ov/h
our]
-Dox+Dox
Figure S12
A
C
B
7
bands between wild‐type and N+/‐ D+/‐. More generally, suppression in the double mutant is maintained across a wide range of parameter values. (C) Positive feedback through Notch has a modest effect on suppression in the double mutant. Here we considered a variant of the mutual inactivation model in which Notch activity leads to increased expression of Notch. The strength of this feedback is quantified by the parameter knn, which denotes the amount of Notch signaling necessary to half‐maximally induce the additional Notch production (supplementary theory section). Only intermediate values of knn change the spatial pattern (i.e. broaden it) without destroying its qualitative shape. Within this range, suppression is generally maintained except for a modest expansion (< ~1 cell) in the double mutant compared to wild‐type. Figure S11: Steady‐state sensitivity of the mutual inactivation switch. (A) The steady state levels of Notch (blue) and Delta (red) are shown with respect to the production rate of Delta, , in a log‐log plot, for the case presented in the Box Figure (values given in the Supplementary Table S3). This plot reveals a rapid change in Notch and Delta for a small change in the near the switch location. (B) Steady‐state sensitivity of the system, as defined in Box 1, for the conditions of plot A. Note that the sensitivity of the system remains larger than 1 for a very broad range of Delta production rates (to the right of the threshold).
Figure S12: Negative controls show that Notch signaling is not affected by doxycycline, and growth rate is not affected by doxycycline and Dplate. (A) Cells expressing Notch (hN1G4esn ‐No‐Delta) were induced by Dplate to similar levels of Notch activity in the presence or absence of 100ng/ml doxycycline (protocol was similar to the ones used in Fig.2), showing that Notch activity is not influenced directly by doxycycine. (B) The growth rate of the Notch reporter cells was not affected by presence of doxycycline. (C) Mean growth rate of the cells shown in Fig. 2C,D,E is not affected by Dplate. Growth rate was defined as the rate of increase in the number of cells per field of view (fov) over time.
Figure S13: Relation of population average data (median over all segmented cells) and single cell data. (A) Plots of total cellular fluorescence versus time for each of 26 non‐overlapping cell lineages from the movie shown in Figs. 3B, (blue lines). Sudden drops in total fluorescence are due to cell division events, as in Fig. 3D. We compare the median of these 26 responses (cyan) to the median over all cells (green). Note that this latter curve is identical to that shown in Fig. 3. For discussion see supplementary methods. (B) Analysis of sharp responses to cis‐Delta in individual cells. The concentration of Delta‐mCherry (red) and the shifted level of YFP (green, cf. Fig. 3e) are plotted as a function of time for two different cell lineages. Delta‐mCherry concentrations were estimated from total Delta‐mCherry fluorescence levels by assuming linear growth in cell volume during each cell cycle. The Delta‐mCherry data were fit to exponential decays (superimposed black lines). The YFP response curves were fit to generate the turn‐on function (superimposed black lines). The fit has four free parameters: a constant offset, a final slope, a turn‐on time (ton), and τrise (see supplementary methods). Inset: plots of resulting Hill function fits for the production rate of YFP as a function of the concentration of Delta‐mCherry. These fits produced best fit Hill coefficients of n=22±10 and n=5.5±0.8 for cells 1 and 2, respectively. (C) Analysis of slope distributions of cis‐Delta response shows a switch‐like, rather than graded behavior. All 26 single cell traces were divided into short, 6 hour segments. The response on each segment was
Figure : Figure S12: Negative controls show that Notch signaling is not affected by doxycycline,and growth rate is not affected by doxycycline and Dplate. (A) Cells expressing Notch (hN1G4esn
-No-Delta) were induced by Dplate to similar levels of Notch activity in the presence or absence of100ng/ml doxycycline (protocol was similar to the ones used in Fig.2), showing that Notch activityis not influenced directly by doxycycine. (B) The growth rate of the Notch reporter cells was notaffected by presence of doxycycline. (C) Mean growth rate of the cells shown in Fig. 2C,D,E is notaffected by Dplate. Growth rate was defined as the rate of increase in the number of cells per fieldof view (fov) over time.

100
17www.nature.com/nature
SUPPLEMENTARY INFORMATIONdoi: 10.1038/nature08959
0 20 40 600
5
10
15x 104
YFP
[RFU
]
Time [hours]
Figure S13
A B
C
median of 26 tracked cells
median of all cells
0 1 2 3 40
1
2
3 x103
x104
0 20 40 600
1
2
3
4
5
6
7 x 10⁴
Time [hours]
Shift
ed Y
FP, R
FP [R
FU]
cell 1 YFPcell 2 YFP
cell 1 fitcell 2 fit
cell 1 Deltacell 2 Delta
Delta-mCherry [RFU]
YFP
Slop
e [R
FU/h
r]
Time [hours]
0 20 40 600
5
10
15
20
x 103
YFP
prod
uctio
n ra
te [R
FU/h
r]
7
bands between wild‐type and N+/‐ D+/‐. More generally, suppression in the double mutant is maintained across a wide range of parameter values. (C) Positive feedback through Notch has a modest effect on suppression in the double mutant. Here we considered a variant of the mutual inactivation model in which Notch activity leads to increased expression of Notch. The strength of this feedback is quantified by the parameter knn, which denotes the amount of Notch signaling necessary to half‐maximally induce the additional Notch production (supplementary theory section). Only intermediate values of knn change the spatial pattern (i.e. broaden it) without destroying its qualitative shape. Within this range, suppression is generally maintained except for a modest expansion (< ~1 cell) in the double mutant compared to wild‐type. Figure S11: Steady‐state sensitivity of the mutual inactivation switch. (A) The steady state levels of Notch (blue) and Delta (red) are shown with respect to the production rate of Delta, , in a log‐log plot, for the case presented in the Box Figure (values given in the Supplementary Table S3). This plot reveals a rapid change in Notch and Delta for a small change in the near the switch location. (B) Steady‐state sensitivity of the system, as defined in Box 1, for the conditions of plot A. Note that the sensitivity of the system remains larger than 1 for a very broad range of Delta production rates (to the right of the threshold).
Figure S12: Negative controls show that Notch signaling is not affected by doxycycline, and growth rate is not affected by doxycycline and Dplate. (A) Cells expressing Notch (hN1G4esn ‐No‐Delta) were induced by Dplate to similar levels of Notch activity in the presence or absence of 100ng/ml doxycycline (protocol was similar to the ones used in Fig.2), showing that Notch activity is not influenced directly by doxycycine. (B) The growth rate of the Notch reporter cells was not affected by presence of doxycycline. (C) Mean growth rate of the cells shown in Fig. 2C,D,E is not affected by Dplate. Growth rate was defined as the rate of increase in the number of cells per field of view (fov) over time.
Figure S13: Relation of population average data (median over all segmented cells) and single cell data. (A) Plots of total cellular fluorescence versus time for each of 26 non‐overlapping cell lineages from the movie shown in Figs. 3B, (blue lines). Sudden drops in total fluorescence are due to cell division events, as in Fig. 3D. We compare the median of these 26 responses (cyan) to the median over all cells (green). Note that this latter curve is identical to that shown in Fig. 3. For discussion see supplementary methods. (B) Analysis of sharp responses to cis‐Delta in individual cells. The concentration of Delta‐mCherry (red) and the shifted level of YFP (green, cf. Fig. 3e) are plotted as a function of time for two different cell lineages. Delta‐mCherry concentrations were estimated from total Delta‐mCherry fluorescence levels by assuming linear growth in cell volume during each cell cycle. The Delta‐mCherry data were fit to exponential decays (superimposed black lines). The YFP response curves were fit to generate the turn‐on function (superimposed black lines). The fit has four free parameters: a constant offset, a final slope, a turn‐on time (ton), and τrise (see supplementary methods). Inset: plots of resulting Hill function fits for the production rate of YFP as a function of the concentration of Delta‐mCherry. These fits produced best fit Hill coefficients of n=22±10 and n=5.5±0.8 for cells 1 and 2, respectively. (C) Analysis of slope distributions of cis‐Delta response shows a switch‐like, rather than graded behavior. All 26 single cell traces were divided into short, 6 hour segments. The response on each segment was
8
smoothed and its maximal slope was measured. Black and green points represent the values of individual slopes falling below or above a threshold, respectively. Note that the fraction of activated (green) points, but not their median value, increases over time, consistent with a switch‐like model (Fig. 5e). The threshold value was determined from the early time points where cells are off. A few segments far from the switching point were filtered out, corresponding to saturating fluorescence levels or varying YFP expression at very late times (YFP curves in (b)). Similar filtering did not affect the distribution of trans‐activation rates (Fig S5g). Blue circles represent the medians of the individual above‐threshold (green) slopes in 30 hour bins. Error bars represent the 25th to 75th percentiles of each distribution. Comparison with trans‐Delta distributions (Figs. S5e,f,g) shows that the response to cis‐Delta agrees with a threshold like model.
Figure S14: Initial Delta‐mCherry levels correlate with turn‐on time. (A) Notch signaling response was measured for varying Delta‐mCherry induction levels. The experimental setup was similar to the scheme shown in Fig. 3A. Cells were grown on fixed Dplate=0.74 ug/ml and subjected to 12 hour pulses of varying doxycycline concentrations, as indicated in (B). Increased induction levels correspond to higher Delta‐mCherry induction (B) and corresponding delays in the turn‐on time (A). When doxycycline is not removed from the media (darkest green), cells show a negligible response to Dplate. (C) Here, ton was calculated for the data in (A) and (B). For each Delta‐mCherry induction level (same legend as in (B)), the Delta‐mCherry fluorescence at the start of the movie (t=0) and at ton are plotted. These data show that the time of Notch activation, ton, varies with the initial level of Delta‐mCherry expression, but occurs at an approximately constant Delta‐mCherry concentration, as expected from the experimental scheme in Fig. 3A. Note that fluorescence levels differ in this figure from those in Fig. S13 due to variations in optical parameters (e.g. lamp intensity) between the two experiments.
Figure S15: Distribution of activated cells at different Dplate shows graded response. Distributions of hN1G4esn cells after onset of induction (t=50 hours) in Figure 3G. Activated cells (green circles) respond in a graded fashion to Dplate levels. Note that even at maximal activation there is a fraction of non‐responding cells (black circles). Such variable behavior typically occurs due to silencing of viral promoters such as the CMV promoter used here. The blue circles represent the median of activated cells. Note that in figure 2C we plot the median of all cells (green and black circles). The median of all cells exhibits a similar slope to the median of activated cells at longer times, but it shows an initial lag in the response. This lag occurs since the median of all cells remains unchanged until more than 50% of the cells respond to Dplate. See also discussion in Fig. S5.
Figure S16: Effect of finite lifetimes and expression delays in the model. Time traces of Notch (blue), Delta (red), and the reporter (green) obtained from numerical simulations of the cis‐inhibition model. Solid and dashed green lines are reporter traces for different parameter values, indicated on plot. (A) A 100x increase in the lifetime of the reporter mRNA leads to a delay of a few hours in the turn‐on of reporter expression. (B) A similar effect is found for a 100x increase in the lifetime of the Signal. (C) A 1‐hour delay in the expression of the reporter from the activating signal leads to a corresponding delay in reporter turn‐on. (D) Despite these time shifts, the dynamic sensitivity of the system, defined as the
Figure : Figure S13: Relation of population average data (median over all segmented cells) andsingle cell data. (A) Plots of total cellular fluorescence versus time for each of 26 non-overlappingcell lineages from the movie shown in Figs. 3B, (blue lines). Sudden drops in total fluorescence aredue to cell division events, as in Fig. 3D. We compare the median of these 26 responses (cyan) tothe median over all cells (green). Note that this latter curve is identical to that shown in Fig. 3. Fordiscussion see supplementary methods. (B) Analysis of sharp responses to cis-Delta in individualcells. The concentration of Delta-mCherry (red) and the shifted level of YFP (green, cf. Fig. 3e)are plotted as a function of time for two different cell lineages. Delta-mCherry concentrations wereestimated from total Delta-mCherry fluorescence levels by assuming linear growth in cell volumeduring each cell cycle. The Delta-mCherry data were fit to exponential decays (superimposed blacklines). The YFP response curves were fit to generate the turn-on function (superimposed blacklines). The fit has four free parameters: a constant offset, a final slope, a turn-on time (ton), andτrise (see supplementary methods). Inset: plots of resulting Hill function fits for the productionrate of YFP as a function of the concentration of Delta-mCherry. These fits produced best fit Hillcoefficients of n = 22 ± 10 and n = 5.5 ± 0.8 for cells 1 and 2, respectively. (C) Analysis of slopedistributions of cis-Delta response shows a switch-like, rather than graded behavior. All 26 singlecell traces were divided into short, 6 hour segments. The response on each segment was smoothedand its maximal slope was measured. Black and green points represent the values of individualslopes falling below or above a threshold, respectively. Note that the fraction of activated (green)points, but not their median value, increases over time, consistent with a switch-like model (Fig.5e). The threshold value was determined from the early time points where cells are off. A fewsegments far from the switching point were filtered out, corresponding to saturating fluorescencelevels or varying YFP expression at very late times (YFP curves in (b)). Similar filtering did notaffect the distribution of trans-activation rates (Fig S5g). Blue circles represent the medians of theindividual above-threshold (green) slopes in 30 hour bins. Error bars represent the 25th to 75thpercentiles of each distribution. Comparison with trans-Delta distributions (Figs. S5e,f,g) showsthat the response to cis-Delta agrees with a threshold-like model.

101
18www.nature.com/nature
doi: 10.1038/nature08959 SUPPLEMENTARY INFORMATION
0 20 40 600
1
2
3
4
5x 10⁴
Time [hours]
mCh
erry
[RFU
] Dox=0 ng/ml1 ng/ml
1.6 ng/ml2.5 ng/ml4 ng/ml
100 ng/ml(not washed out)
0 20 40 600
1
2
Time [hours]
YFP
[RFU
]
x 103A
C
B
Figure S14
ton [hours]
mCh
erry
[RFU
]
0 20 400
1
2
x 104
mCherry at t=0
mCherry at t=ton
8
smoothed and its maximal slope was measured. Black and green points represent the values of individual slopes falling below or above a threshold, respectively. Note that the fraction of activated (green) points, but not their median value, increases over time, consistent with a switch‐like model (Fig. 5e). The threshold value was determined from the early time points where cells are off. A few segments far from the switching point were filtered out, corresponding to saturating fluorescence levels or varying YFP expression at very late times (YFP curves in (b)). Similar filtering did not affect the distribution of trans‐activation rates (Fig S5g). Blue circles represent the medians of the individual above‐threshold (green) slopes in 30 hour bins. Error bars represent the 25th to 75th percentiles of each distribution. Comparison with trans‐Delta distributions (Figs. S5e,f,g) shows that the response to cis‐Delta agrees with a threshold like model.
Figure S14: Initial Delta‐mCherry levels correlate with turn‐on time. (A) Notch signaling response was measured for varying Delta‐mCherry induction levels. The experimental setup was similar to the scheme shown in Fig. 3A. Cells were grown on fixed Dplate=0.74 ug/ml and subjected to 12 hour pulses of varying doxycycline concentrations, as indicated in (B). Increased induction levels correspond to higher Delta‐mCherry induction (B) and corresponding delays in the turn‐on time (A). When doxycycline is not removed from the media (darkest green), cells show a negligible response to Dplate. (C) Here, ton was calculated for the data in (A) and (B). For each Delta‐mCherry induction level (same legend as in (B)), the Delta‐mCherry fluorescence at the start of the movie (t=0) and at ton are plotted. These data show that the time of Notch activation, ton, varies with the initial level of Delta‐mCherry expression, but occurs at an approximately constant Delta‐mCherry concentration, as expected from the experimental scheme in Fig. 3A. Note that fluorescence levels differ in this figure from those in Fig. S13 due to variations in optical parameters (e.g. lamp intensity) between the two experiments.
Figure S15: Distribution of activated cells at different Dplate shows graded response. Distributions of hN1G4esn cells after onset of induction (t=50 hours) in Figure 3G. Activated cells (green circles) respond in a graded fashion to Dplate levels. Note that even at maximal activation there is a fraction of non‐responding cells (black circles). Such variable behavior typically occurs due to silencing of viral promoters such as the CMV promoter used here. The blue circles represent the median of activated cells. Note that in figure 2C we plot the median of all cells (green and black circles). The median of all cells exhibits a similar slope to the median of activated cells at longer times, but it shows an initial lag in the response. This lag occurs since the median of all cells remains unchanged until more than 50% of the cells respond to Dplate. See also discussion in Fig. S5.
Figure S16: Effect of finite lifetimes and expression delays in the model. Time traces of Notch (blue), Delta (red), and the reporter (green) obtained from numerical simulations of the cis‐inhibition model. Solid and dashed green lines are reporter traces for different parameter values, indicated on plot. (A) A 100x increase in the lifetime of the reporter mRNA leads to a delay of a few hours in the turn‐on of reporter expression. (B) A similar effect is found for a 100x increase in the lifetime of the Signal. (C) A 1‐hour delay in the expression of the reporter from the activating signal leads to a corresponding delay in reporter turn‐on. (D) Despite these time shifts, the dynamic sensitivity of the system, defined as the
Figure : Figure S14: Initial Delta-mCherry levels correlate with turn-on time. (A) Notch signalingresponse was measured for varying Delta-mCherry induction levels. The experimental setup wassimilar to the scheme shown in Fig. 3A. Cells were grown on fixed Dplate=0.74 µg/ml and subjectedto 12 hour pulses of varying doxycycline concentrations, as indicated in (B). Increased inductionlevels correspond to higher Delta-mCherry induction (B) and corresponding delays in the turn-ontime (A). When doxycycline is not removed from the media (darkest green), cells show a negligibleresponse to Dplate. (C) Here, ton was calculated for the data in (A) and (B). For each Delta-mCherryinduction level (same legend as in (B)), the Delta-mCherry fluorescence at the start of the movie(t=0) and atton are plotted. These data show that the time of Notch activation, ton, varies with theinitial level of Delta-mCherry expression, but occurs at an approximately constant Delta-mCherryconcentration, as expected from the experimental scheme in Fig. 3A. Note that fluorescence levelsdiffer in this figure from those in Fig. S13 due to variations in optical parameters (e.g. lampintensity) between the two experiments.

102
19www.nature.com/nature
SUPPLEMENTARY INFORMATIONdoi: 10.1038/nature08959
0
1
2 x 10⁴
calibrated Dplate 0 0.02 0.05 0.1 0.19 0.27 0.35 0.49 0.74 0.97 1.16 1.45 µg/ml
Figure S15
8
smoothed and its maximal slope was measured. Black and green points represent the values of individual slopes falling below or above a threshold, respectively. Note that the fraction of activated (green) points, but not their median value, increases over time, consistent with a switch‐like model (Fig. 5e). The threshold value was determined from the early time points where cells are off. A few segments far from the switching point were filtered out, corresponding to saturating fluorescence levels or varying YFP expression at very late times (YFP curves in (b)). Similar filtering did not affect the distribution of trans‐activation rates (Fig S5g). Blue circles represent the medians of the individual above‐threshold (green) slopes in 30 hour bins. Error bars represent the 25th to 75th percentiles of each distribution. Comparison with trans‐Delta distributions (Figs. S5e,f,g) shows that the response to cis‐Delta agrees with a threshold like model.
Figure S14: Initial Delta‐mCherry levels correlate with turn‐on time. (A) Notch signaling response was measured for varying Delta‐mCherry induction levels. The experimental setup was similar to the scheme shown in Fig. 3A. Cells were grown on fixed Dplate=0.74 ug/ml and subjected to 12 hour pulses of varying doxycycline concentrations, as indicated in (B). Increased induction levels correspond to higher Delta‐mCherry induction (B) and corresponding delays in the turn‐on time (A). When doxycycline is not removed from the media (darkest green), cells show a negligible response to Dplate. (C) Here, ton was calculated for the data in (A) and (B). For each Delta‐mCherry induction level (same legend as in (B)), the Delta‐mCherry fluorescence at the start of the movie (t=0) and at ton are plotted. These data show that the time of Notch activation, ton, varies with the initial level of Delta‐mCherry expression, but occurs at an approximately constant Delta‐mCherry concentration, as expected from the experimental scheme in Fig. 3A. Note that fluorescence levels differ in this figure from those in Fig. S13 due to variations in optical parameters (e.g. lamp intensity) between the two experiments.
Figure S15: Distribution of activated cells at different Dplate shows graded response. Distributions of hN1G4esn cells after onset of induction (t=50 hours) in Figure 3G. Activated cells (green circles) respond in a graded fashion to Dplate levels. Note that even at maximal activation there is a fraction of non‐responding cells (black circles). Such variable behavior typically occurs due to silencing of viral promoters such as the CMV promoter used here. The blue circles represent the median of activated cells. Note that in figure 2C we plot the median of all cells (green and black circles). The median of all cells exhibits a similar slope to the median of activated cells at longer times, but it shows an initial lag in the response. This lag occurs since the median of all cells remains unchanged until more than 50% of the cells respond to Dplate. See also discussion in Fig. S5.
Figure S16: Effect of finite lifetimes and expression delays in the model. Time traces of Notch (blue), Delta (red), and the reporter (green) obtained from numerical simulations of the cis‐inhibition model. Solid and dashed green lines are reporter traces for different parameter values, indicated on plot. (A) A 100x increase in the lifetime of the reporter mRNA leads to a delay of a few hours in the turn‐on of reporter expression. (B) A similar effect is found for a 100x increase in the lifetime of the Signal. (C) A 1‐hour delay in the expression of the reporter from the activating signal leads to a corresponding delay in reporter turn‐on. (D) Despite these time shifts, the dynamic sensitivity of the system, defined as the
Figure : Figure S15: Distribution of activated cells at different Dplate shows graded response. Distri-butions of hN1G4esn cells after onset of induction (t=50 hours) in Figure 3G. Activated cells (greencircles) respond in a graded fashion to Dplate levels. Note that even at maximal activation thereis a fraction of non-responding cells (black circles). Such variable behavior typically occurs due tosilencing of viral promoters such as the CMV promoter used here. The blue circles represent themedian of activated cells. Note that in Figure 2C we plot the median of all cells (green and blackcircles). The median of all cells exhibits a similar slope to the median of activated cells at longertimes, but it shows an initial lag in the response. This lag occurs since the median of all cells remainsunchanged until more than 50% of the cells respond to Dplate. See also discussion in Fig. S5.

103
20www.nature.com/nature
doi: 10.1038/nature08959 SUPPLEMENTARY INFORMATION
0
5
10
15
sens
itivi
ty
γm γS τ
0.110
0.1
10
0 1
0 20 40 60 800
0.2
0.4
0.6
0.8
1
time (hours)
conc
entr
atio
n (r
fu)
0 20 40 60 800
0.2
0.4
0.6
0.8
1
Time Delay
time (hours)
conc
entr
atio
n (r
fu)
0 20 40 60 800
0.2
0.4
0.6
0.8
1
time (hours)
conc
entr
atio
n (r
fu)
NotchDeltaReporter Reporter
γm=0.1
γm=10
γS=0.1
γS=10
τ=1τ=0
mRNA decay rate signal decay rateA B
C D
Figure S16
8
smoothed and its maximal slope was measured. Black and green points represent the values of individual slopes falling below or above a threshold, respectively. Note that the fraction of activated (green) points, but not their median value, increases over time, consistent with a switch‐like model (Fig. 5e). The threshold value was determined from the early time points where cells are off. A few segments far from the switching point were filtered out, corresponding to saturating fluorescence levels or varying YFP expression at very late times (YFP curves in (b)). Similar filtering did not affect the distribution of trans‐activation rates (Fig S5g). Blue circles represent the medians of the individual above‐threshold (green) slopes in 30 hour bins. Error bars represent the 25th to 75th percentiles of each distribution. Comparison with trans‐Delta distributions (Figs. S5e,f,g) shows that the response to cis‐Delta agrees with a threshold like model.
Figure S14: Initial Delta‐mCherry levels correlate with turn‐on time. (A) Notch signaling response was measured for varying Delta‐mCherry induction levels. The experimental setup was similar to the scheme shown in Fig. 3A. Cells were grown on fixed Dplate=0.74 ug/ml and subjected to 12 hour pulses of varying doxycycline concentrations, as indicated in (B). Increased induction levels correspond to higher Delta‐mCherry induction (B) and corresponding delays in the turn‐on time (A). When doxycycline is not removed from the media (darkest green), cells show a negligible response to Dplate. (C) Here, ton was calculated for the data in (A) and (B). For each Delta‐mCherry induction level (same legend as in (B)), the Delta‐mCherry fluorescence at the start of the movie (t=0) and at ton are plotted. These data show that the time of Notch activation, ton, varies with the initial level of Delta‐mCherry expression, but occurs at an approximately constant Delta‐mCherry concentration, as expected from the experimental scheme in Fig. 3A. Note that fluorescence levels differ in this figure from those in Fig. S13 due to variations in optical parameters (e.g. lamp intensity) between the two experiments.
Figure S15: Distribution of activated cells at different Dplate shows graded response. Distributions of hN1G4esn cells after onset of induction (t=50 hours) in Figure 3G. Activated cells (green circles) respond in a graded fashion to Dplate levels. Note that even at maximal activation there is a fraction of non‐responding cells (black circles). Such variable behavior typically occurs due to silencing of viral promoters such as the CMV promoter used here. The blue circles represent the median of activated cells. Note that in figure 2C we plot the median of all cells (green and black circles). The median of all cells exhibits a similar slope to the median of activated cells at longer times, but it shows an initial lag in the response. This lag occurs since the median of all cells remains unchanged until more than 50% of the cells respond to Dplate. See also discussion in Fig. S5.
Figure S16: Effect of finite lifetimes and expression delays in the model. Time traces of Notch (blue), Delta (red), and the reporter (green) obtained from numerical simulations of the cis‐inhibition model. Solid and dashed green lines are reporter traces for different parameter values, indicated on plot. (A) A 100x increase in the lifetime of the reporter mRNA leads to a delay of a few hours in the turn‐on of reporter expression. (B) A similar effect is found for a 100x increase in the lifetime of the Signal. (C) A 1‐hour delay in the expression of the reporter from the activating signal leads to a corresponding delay in reporter turn‐on. (D) Despite these time shifts, the dynamic sensitivity of the system, defined as the
9
logarithmic derivative of the Signal with respect to the total amount of Delta at any given time instant, is mostly unchanged. The sensitivity coefficient, shown in the bar plot for the different cases presented in plots A‐C, increases at most 30% for the smallest lifetimes, and is effectively constant in the presence of delay in the reporter expression.
Figure S17: Lateral inhibition model with mutual inactivation (See theoretical supplementary section) facilitates broader range of patterns. Increasing the strength of mutual inactivation (reduced ) enables patterning (second panel), as well as the formation of alternative patterns in which cells with high Delta levels can stably co‐exist next to each other (third and fourth panels). Such alternative patterns cannot be achieved using standard lateral inhibition model (even in the presence of cooperative feedback).
‐‐‐‐‐‐‐‐‐‐‐‐‐‐‐‐‐‐‐‐‐‐‐‐‐‐‐‐‐‐‐‐‐‐‐‐‐‐‐‐‐‐‐‐‐‐‐‐‐‐‐‐‐‐‐‐‐‐‐‐‐‐‐‐‐‐‐‐‐‐‐‐‐‐‐‐‐‐‐‐‐‐‐‐‐‐‐‐‐‐‐‐‐‐‐‐‐‐‐‐‐‐‐‐‐‐‐‐‐‐‐‐‐‐‐‐‐‐‐‐‐‐‐‐‐‐‐‐‐‐‐‐‐
Supplementary Movies
Movie S1: Trans‐activation of hN1G4esn by plate bound Delta. Movie used to generate filmstrip in Fig. 2B.
Movie S2: Effect of cis‐Delta on hN1G4esn activation. Movie used to generate filmstrip in Fig. 3B.
Movie S3: Trans‐activation of hN1G4esn‐No‐Delta by co‐culture with Delta‐expressing cells. Movie used to generate filmstrip in Fig S5.
Figure : Figure S16: Effect of finite lifetimes and expression delays in the model. Time tracesof Notch (blue), Delta (red), and the reporter (green) obtained from numerical simulations of thecis-inhibition model. Solid and dashed green lines are reporter traces for different parameter values,indicated on plot. (A) A 100x increase in the lifetime of the reporter mRNA leads to a delay of afew hours in the turn-on of reporter expression. (B) A similar effect is found for a 100x increase inthe lifetime of the Signal. (C) A 1-hour delay in the expression of the reporter from the activatingsignal leads to a corresponding delay in reporter turn-on. (D) Despite these time shifts, the dynamicsensitivity of the system, defined as the logarithmic derivative of the Signal with respect to the totalamount of Delta at any given time instant, is mostly unchanged. The sensitivity coefficient, shownin the bar plot for the different cases presented in plots A-C, increases at most 30% for the smallestlifetimes, and is effectively constant in the presence of delay in the reporter expression.
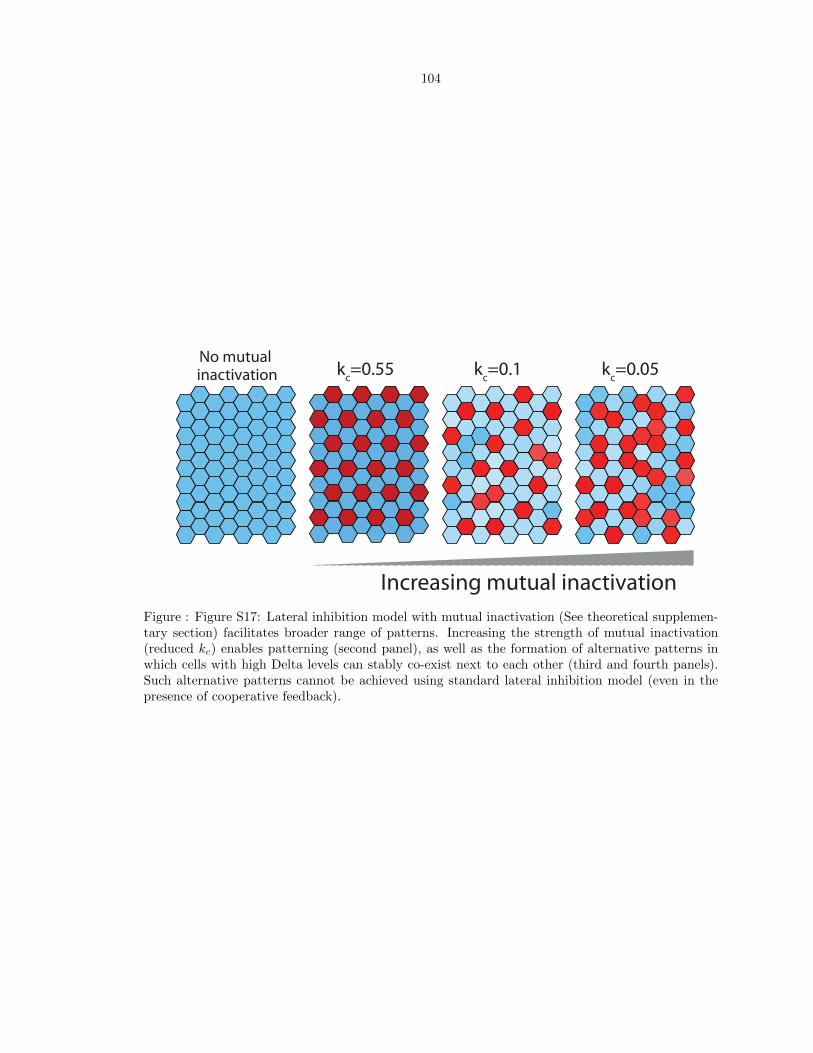
104
21www.nature.com/nature
SUPPLEMENTARY INFORMATIONdoi: 10.1038/nature08959
No mutualkc=0.55 kc=0.1 kc=0.05
Increasing mutual inactivation
inactivation
Figure S17
9
logarithmic derivative of the Signal with respect to the total amount of Delta at any given time instant, is mostly unchanged. The sensitivity coefficient, shown in the bar plot for the different cases presented in plots A‐C, increases at most 30% for the smallest lifetimes, and is effectively constant in the presence of delay in the reporter expression.
Figure S17: Lateral inhibition model with mutual inactivation (See theoretical supplementary section) facilitates broader range of patterns. Increasing the strength of mutual inactivation (reduced ) enables patterning (second panel), as well as the formation of alternative patterns in which cells with high Delta levels can stably co‐exist next to each other (third and fourth panels). Such alternative patterns cannot be achieved using standard lateral inhibition model (even in the presence of cooperative feedback).
‐‐‐‐‐‐‐‐‐‐‐‐‐‐‐‐‐‐‐‐‐‐‐‐‐‐‐‐‐‐‐‐‐‐‐‐‐‐‐‐‐‐‐‐‐‐‐‐‐‐‐‐‐‐‐‐‐‐‐‐‐‐‐‐‐‐‐‐‐‐‐‐‐‐‐‐‐‐‐‐‐‐‐‐‐‐‐‐‐‐‐‐‐‐‐‐‐‐‐‐‐‐‐‐‐‐‐‐‐‐‐‐‐‐‐‐‐‐‐‐‐‐‐‐‐‐‐‐‐‐‐‐‐
Supplementary Movies
Movie S1: Trans‐activation of hN1G4esn by plate bound Delta. Movie used to generate filmstrip in Fig. 2B.
Movie S2: Effect of cis‐Delta on hN1G4esn activation. Movie used to generate filmstrip in Fig. 3B.
Movie S3: Trans‐activation of hN1G4esn‐No‐Delta by co‐culture with Delta‐expressing cells. Movie used to generate filmstrip in Fig S5.
Figure : Figure S17: Lateral inhibition model with mutual inactivation (See theoretical supplemen-tary section) facilitates broader range of patterns. Increasing the strength of mutual inactivation(reduced kc) enables patterning (second panel), as well as the formation of alternative patterns inwhich cells with high Delta levels can stably co-exist next to each other (third and fourth panels).Such alternative patterns cannot be achieved using standard lateral inhibition model (even in thepresence of cooperative feedback).
105
Supplementary Methods
Description of genetic constructs
All genetic constructs used in this paper were constructed using standard cloning and PCR tech-
niques. All constructs were fully sequenced and the maps, sequences and construction details are
available upon request. We provide below a description of the sources for vectors and DNA fragments
used, as well as the main construction steps.
Reporter plasmids pEV-UAS-H2B-Citrine and pEV-12xCSL-H2B-Citrine were constructed as
follows: The backbone vector pEV was constructed in the lab by amplifying pSecTagA without the
secretion tag Murine Ig kappa-chain V-J2-C (Invitrogen, V900-20) and religating it with the SacII
restriction site. The UAS-H2B-citrine and 12xCSL-H2B-Citrine were amplified or subcloned from
earlier constructs and they contain the following DNA fragments: H2B-citrine originally obtained
from pCS H2B citrine (a gift from Sean Megason and Scott Fraser[4]). UAS was obtained from
ULyn-GFP (a gift from Scott Fraser[5]). 12xCSL was amplified from 12xCSL DsRedExpress (a gift
from Urban Lendahl[6]).
pcDNA3-hN1-mod1 was constructed by first adding an NheI site to pcDNA3 hN1 (a gift from
Jon Aster[7]). To add this NheI site we amplified the DNA fragment between the NotI to the
XhoI site and included the NheI site in the reverse primer. The resulting amplicon was ligated into
pcDNA3-hNI cut with the same restriction sites. This modified plasmid was then used to create
pcDNA3-hN1-mCherry by inserting mCherry originally amplified from pFA6-link-mcherry-SpHis5
(a gift from Roger Tsien and Kurt Thorn[8,9]) into the NheI and XhoI sites.
pcDNA3-hNECD-Gal4esn was constructed by cutting pcDNA3-hN1-mod1 with NotI and XhoI
to remove hNICD. Gal4esn was constructed by PCR amplification from Saccharomyces cerevisiae as
described in Ptashne et al [10]. Gal4esn amplified with NotI and SalI restriction sites was inserted
into the cut vector in the sites above. We note here that Gal4esn was chosen over the more popular
Gal4-VP16, since it does not use the viral activator VP16 which is extremely strong and generates
high background signal.
pcDNA5/TO-hNICD-Gal4esn was constructed using the pcDNA5/TO vector (Invitrogen , V1033-
20) cut with BamHI and NotI, and by amplifying hNICD-Gal4esn with the same restriction sites from
pcDNA3-hN1-Gal4esn (a construct not used here but was constructed by introducing Gal4esn into
pcDNA3-hN1-mod1). pcDNA5/TO-Delta-mCherry was constructed by first modifying pcDNA5/TO
(Invitrogen, V1033-20) to add a NheI restriction site by cutting with HindIII and BamHI and then
ligating in two annealed oligos, which contained the NheI site. The vector was then digested with
NheI and BamHI. Delta-mCherry was cut from a previously constructed vector with the same restric-
tion sites as pcDNA5/TO. Delta originally came from pBOS-rDelta1[11] (a gift from Gerry Wein-
master) and was fused to mCherry using fusion PCR. The overlapping sequence between the two

106
fused proteins is: GTGTTATAGCGACTGAGGTTgtgagcaagggcgaggagga. pcDNA5/TO-Gal4esn
was constructed by removal of the mCherry from pcDNA5/TO-Gal4esn-mCherry through BamHI
and NotI digestion. A small DNA fragment (made from annealed oligos) containing a stop codon
as well as the BamHI and NotI overhangs was ligated into the cut pcDNA5/TO-Gal4esn-mCherry
vector. The pcDNA5/TO-Gal4esn-mCherry vector was originally created by first performing a fusion
PCR of Gal4esn and mCherry (sources for Gal4esn and mCherry previously described). The PCR
product was ligated into the pcDNA5/TO vector from Invitrogen. pCS-H2B-cerulean was a gift
from Sean Megason and Scott Fraser[4].
pcDNA6-UAS-H2B-Citrine was constructed by subcloning UAS-H2B-citrine from pEV-UAS-
H2B-Citrine into pcDNA6/ V5-HisA (Invitrogen, V220-01) using MfeI and BstBI restriction sites.
pEV-12xCSL-H2B-mcherry was constructed by amplifying the 12xCSL promoter from 12xCSL
DsRedExpress then fusing it to H2B-mCherry. The resulting amplicon was digested with MfeI
and BglII and inserted into pEV between MfeI and BamHI. H2B-mCherry was constructed by
fusion PCR of H2B and mCherry fragments.
Generation of stable cell lines and cell-culture protocols
As a base cell line we used T-REx-CHO-K1 cells (Chinese Hamster Ovary cells supporting the T-
REx inducible system, Invitrogen) which were grown in Alpha MEM Earle’s Salts (Irvine Scientific)
supplemented with 10% Tet System Approved FBS (Clontech), 100 U/ml penicillin -100 ug/ml
streptomycin - 0.292 mg/ml L-glutamine (Gibco), and 10 ug/ml Blasticidin (InvivoGen) at 37◦C
in the presence of 5% CO2 under a humidified atmosphere. For construction of stable cell lines,
cells were plated 24 h prior to transfection in 24-well tissue-culture-treated plates such that 80-95%
confluency would be reached by the time of transfection. Cells were transfected using Lipofectamine
2000 (Invitrogen) as per the manufacturer’s instructions. The amount of total DNA used was 800
ng/well: 100 ng of DNA containing the desired cassette + 700 ng empty plasmid (pOri).
Stable cell lines containing either the 12xCSL-H2B-Citrine or UAS-H2B-Citrine reporters were
created by transfection of pEV-12xCSL-H2B-Citrine or pEV-UAS-H2B-Citrine into T-REx-CHO-K1
cells. A plasmid containing H2B-Cerulean under constitutive CMV promoter (pCS-H2B-Cerulean)
was co-transfected together with the pEV-UAS-H2B-Citrine. Positive cells were selected by replating
transfected cells into 6-well tissue-culture-treated plates with media containing 400 µg/ml Zeocin
(Invitrogen) and 10 µg/ml Blasticidin 24 h post-transfection. Cells transfected with DNA lacking an
antibiotic resistance gene were used as a control to monitor positive cell selection. After the control
cells died, and after several passages of the selecting cells, positive cell populations were either sorted
by FACS (FACSAria, Beckman Dickinson) or diluted in 96-well tissue-culture-treated plates in order
to obtain single clones to test for reporter activity. For FACS, cells were transiently transfected with
pEF-GV-ICD (a plasmid containing a fusion of Gal4-VP16 and Notch ICD) 24 h prior to cell analysis

107
and sorting. Individual cells expressing high levels of citrine were sorted into single wells in a 96-
well tissue-culture-treated plates. Alternatively, positive cell populations were plated into 96-well
tissue-culture-treated plates at 0.2 cells/well in order to increase the likelihood of obtaining a single
cell/well. Individual cells were grown in selection media until enough cells were available to test
reporter activity. Each clonal cell population was tested by transient transfection with pEF-GV-ICD,
and clones with the best dynamic range of reporter induction were identified by microscopy and used
for the next round of stable cell line creation. For the addition of Notch constructs into the two stable
reporter cell lines constructed above, plasmids containing either hN1 fused to mCherry (pcDNA3-
hN1-mCherry) or hN1G4esn (pcDNA3-hNECD-Gal4esn) were transfected into the 12xCSL-H2B-
Citrine or UAS-H2B-Citrine reporter cell lines, respectively. Positive cell populations were selected
as previously described with selection media that contained 400 µg/ml Zeocin, 10 µg/ml Blasticidin,
and 600 µg/ml Geneticin (Invitrogen). Clonal cell populations were obtained by FACS or dilution as
detailed above. Positive cell populations used for FACS were plated in wells treated with 2.5 µg/ml
IgG-Deltaext 48 hours before sorting. Individual cells expressing high levels of citrine were sorted.
Clones were tested by plating cells in wells treated with or without 2.5 µg/ml IgG-Deltaext and
monitoring activation of the 12xCSL-H2B-Citrine or UAS-H2B-Citrine reporter by microscopy 48-72
hours post-Delta exposure. Single hN1 and hN1G4esn clones with minimal H2B-Citrine background
expression and high reporter activation when exposed to Delta were selected for further use.
To create the final cell lines hN1 and hN1G4esn shown schematically in Figs. 1C, S1, a plasmid
expressing Dl-mCherry under an inducible promoter (pcDNA-TO-Dl-mCherry) was transfected into
each of these cell lines. A plasmid containing H2B-Cerulean under constitutive CMV promoter (pCS-
H2B-Cerulean) was co-transfected with the Delta-mCherry into the hN1 cell line. Cells were grown
in selection media containing 400 µg/ml Zeocin, 10 µg/ml Blasticidin, 600 µg/ml Geneticin, and
500 µg/ml Hygromycin (InvivoGen) for each of the hN1 cell lines. After selection, cells were either
treated with 1 µg/ml doxycyclin and subjected to FACS or diluted into 96-well tissue-culture-treated
plates as previously described. For FACS, single cells expressing high levels of mCherry were sorted.
Clonal cell populations were grown and tested for low mCherry background expression in the absence
of doxycycline and good inducibility of mCherry expression when exposed to 1 µg/ml doxycycline.
Optimal clones for each of the above cell lines were identified by microscopy and used in further
experiments. A separate cell line containing only inducible Delta-mCherry (used in co-culture ex-
periments), was created by transfecting T-REx-CHO-K1 cells with pcDNA-TO-Dl-mCherry. Clones
were generated in a similar process as above, albeit with a selection media containing only Blasti-
cidin and Hygromycin. This cell line was used to generate the TO-DMC+hN1G4esn used in Fig. S9
by stably transfecting into it the pcDNA3-hNECD-Gal4esn construct (600 µg/ml Geneticin). We
note that the fusion to mCherry could in principle affect various activities of Delta. Therefore, we
verified that Delta-mCherry can trans-activate Notch reporter cells efficiently (as shown in Fig. S3).

108
This does not rule out the possibility that other activities or properties of Delta may be affected by
the fusion.
For creation of the TO-Gal4esn cell line, the UAS-H2B-Citrine + CMV-H2B-Cerulean cell line was
transfected with the pcDNA5/TO-Gal4esn plasmid. Cells were grown in selection media containing
400 µg/ml Zeocin, 10 µg/ml Blasticidin, and 500 µg/ml Hygromycin. After selection, cells were
diluted into 96-well tissue-culture-treated plates to obtain single clones. Clones were tested for
Gal4esn inducibility by plating cells either with or without 1 µg/ml doxycycline. The clone with
the lowest Citrine background expression in the absence of doxycycline and good inducible Citrine
expression in the presence of doxycycline was chosen for further use in experiments.
For production of a double reporter cell line used in Figure S1, CHO-K1 cells (without T-REx,
ATCC, CCL-61) were first transfected with pcDNA-UAS-H2B-Cit. A positive cell population was
selected with media containing 10 µg/ml Blasticidin. After the initial selection, positive clones were
obtained by FACS as previously described for the individual reporter stable cell lines. Each clone was
then tested by transfection with pEF-GV-ICD, and a clone with the best reporter dynamic range was
identified by microscopy and used to transfect in pEV-12xCSL-H2B-mCherry. Transfected cells were
selected in media containing 10 µg/ml Blasticidin and 400 µg/ml Zeocin. A positive double reporter
clone was identified by the method described above. In the clone chosen for further experiments,
both reporters showed minimal background activation and high levels of Citrine and mCherry when
transfected with pEF-GV-ICD.
Measurements of relative Notch expression levels in hN1G4esn and hN1
To estimate the levels of ectopically expressed Notch receptors in the hN1G4esn and hN1 we per-
formed qRT-PCR on the two cell lines in which levels of Notch mRNA were compared to levels of
endogenous β-actin mRNA. We found Notch levels 2.3± 0.15- and 4.5± 0.4-fold smaller than those
of β-actin in the hN1G4esn and hN1 cell lines, respectively. These results are within the physio-
logical range of endogenous Notch receptors as observed in early T-cell progenitors where Notch is
active[12]. See below for details of qRT-PCR analysis.
Description of experimental protocols and microscopy
Delta plating, preparation of cells for imaging, and calibration assay for IgG-Deltaext.
Protocol for setting up a time lapse movie: Cells were plated on a glass-bottom 24-well plate (Mat-
tek). To bind IgG-Deltaext to the plate, IgG-Deltaext was serially diluted to different concentrations
in cold 1xPBS (Invitrogen) containing 5µg/ml hamster fibronectin (Innovative Research). 500µl
of diluted IgG-Deltaext was incubated at 4◦C for 1 hour on a rocker. Cells were trypsinized and
diluted to 2×10⁴ cells/ml (1×10⁵ cells/ml for coculture experiments) in growth medium containing
100ng/ml doxycycline (Sigma Aldrich). The cells were plated immediately after the incubation onto

109
the 24 well plate containing IgG-Deltaext. Prior to imaging, wells were washed twice with fresh
medium and medium was replaced with low fluorescence imaging media αMEM without Phenol
red, riboflavin, folic acid, and vitamin B12 (Invitrogen, custom made) and with 5% FBS and 1%
L-glutamine+Penicilin-Streptomycin 100x mix (Invitrogen). Calibration of the IgG-Deltaext bound
to the plates is discussed in the captions of Fig. S4.
Microscopy details: Cells were imaged in an Olympus IX81-ZDC microscope equipped with an
ASI 2000XY stage and a cooled back-thinned iKon-M CCD camera (Andor). All movies were taken
with a 20x, 0.7NA objective. The microscope is also equipped with an incubator that maintains the
temperature at 37C and with an environmental chamber with a humidified 5% CO2 flow (custom
made). The microscopy setup is automatically controlled using commercial Metamorph (Molecular
Devices) software. 48 stage positions (2 in each well) are set up manually and their coordinates are
stored in the computer. In each position, the program first focuses using the Zero Drift Control
module (Olympus Inc.), then takes a DIC image, and three fluorescent images (mCherry, citrine,
CFP). Images are taken every 20 minutes for all positions. Typical total movie time is approximately
48 hours.
Western Blot: TO-Gal4esn cells were plated in wells of a 6-well tissue-culture-treated plate at
5x10⁵ cells/well. The cells were induced with 100 ng/ml of doxycycline. After 24 hr of induction,
one well of cells was harvested (0 hr post-doxycycline removal) while the doxycycline was washed out
of 4 additional wells. Those cells were harvested at 1 hr, 2hr, 4 hr and 6hr post-doxycycline removal
(an uninduced sample was used as a control). The harvested cells were counted, and 4x10⁶cells were
pelleted and lysed with 200µl 1.5x complete SDS loading buffer (76.7 mM Tris-HCL, pH 6.8, 1.5%
(w/v) SDS, 15% (v/v) Glycerol, 0.01% (w/v) Bromophenol blue, 30 mM Dithiothreitol (DTT), 213.8
mM 2-Mercaptoethanol, 1x protease inhibitors (Roche Applied Science), 6 mM ethylenediaminete-
traacetic acid (EDTA)). Cellular extracts were boiled for 5 min at 95◦C, vortexed, chilled on ice and
centrifuged in a Beckman TLA-100.3 ultracentrifuge rotor at 55,000 rpm for 1 h at 4◦C. For each
sample, 10µl of supernatant was resolved in triplicate on a NuPAGE Novex 4-12% Bis-Tris Midi Gel
(Invitrogen) and transferred to a 0.2 µm nitrocellulose membrane using the iBlot from Invitrogen
(a standard curve made from serial dilutions of the 0 hr post-doxycycline sample was also included
on the gel). The membrane was blocked with 5% (w/v) dry milk and 2% (w/v) BSA in 1xTBST
(20 mM Tris base, 137 mM sodium chloride, 0.1% (v/v) Tween 20, pH 7.6), incubated with primary
antibody in blocking buffer, followed by incubation with horseradish peroxidase-labeled secondary
antibody in blocking buffer. SuperSignal West Femto chemiluminescent substrate kit was used for
detection (Pierce). The following primary antibody was used: rabbit anti-Gal4 DBD (sc-577, Santa
Cruz Biotechnology, 1:200). The secondary antibody used was horseradish peroxidase-linked anti-
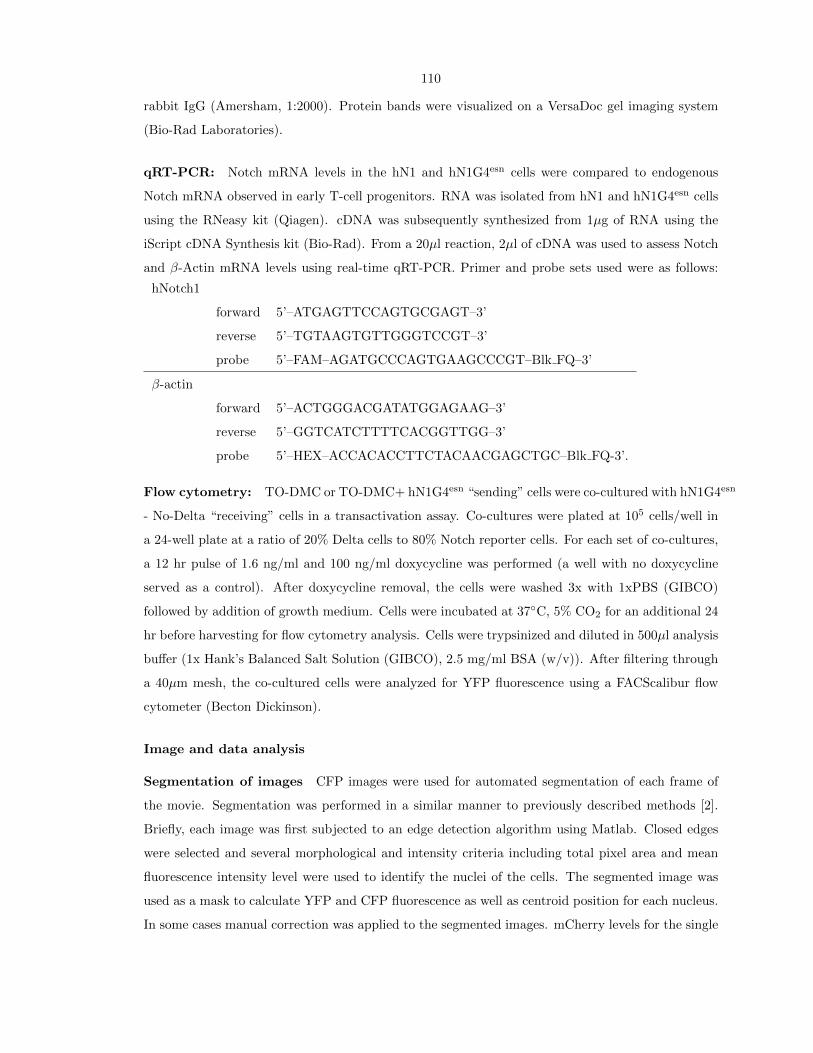
110
rabbit IgG (Amersham, 1:2000). Protein bands were visualized on a VersaDoc gel imaging system
(Bio-Rad Laboratories).
qRT-PCR: Notch mRNA levels in the hN1 and hN1G4esn cells were compared to endogenous
Notch mRNA observed in early T-cell progenitors. RNA was isolated from hN1 and hN1G4esn cells
using the RNeasy kit (Qiagen). cDNA was subsequently synthesized from 1µg of RNA using the
iScript cDNA Synthesis kit (Bio-Rad). From a 20µl reaction, 2µl of cDNA was used to assess Notch
and β-Actin mRNA levels using real-time qRT-PCR. Primer and probe sets used were as follows:
hNotch1
forward 5’–ATGAGTTCCAGTGCGAGT–3’
reverse 5’–TGTAAGTGTTGGGTCCGT–3’
probe 5’–FAM–AGATGCCCAGTGAAGCCCGT–Blk FQ–3’
β-actin
forward 5’–ACTGGGACGATATGGAGAAG–3’
reverse 5’–GGTCATCTTTTCACGGTTGG–3’
probe 5’–HEX–ACCACACCTTCTACAACGAGCTGC–Blk FQ-3’.
Flow cytometry: TO-DMC or TO-DMC+ hN1G4esn “sending” cells were co-cultured with hN1G4esn
- No-Delta “receiving” cells in a transactivation assay. Co-cultures were plated at 105 cells/well in
a 24-well plate at a ratio of 20% Delta cells to 80% Notch reporter cells. For each set of co-cultures,
a 12 hr pulse of 1.6 ng/ml and 100 ng/ml doxycycline was performed (a well with no doxycycline
served as a control). After doxycycline removal, the cells were washed 3x with 1xPBS (GIBCO)
followed by addition of growth medium. Cells were incubated at 37◦C, 5% CO2 for an additional 24
hr before harvesting for flow cytometry analysis. Cells were trypsinized and diluted in 500µl analysis
buffer (1x Hank’s Balanced Salt Solution (GIBCO), 2.5 mg/ml BSA (w/v)). After filtering through
a 40µm mesh, the co-cultured cells were analyzed for YFP fluorescence using a FACScalibur flow
cytometer (Becton Dickinson).
Image and data analysis
Segmentation of images CFP images were used for automated segmentation of each frame of
the movie. Segmentation was performed in a similar manner to previously described methods [2].
Briefly, each image was first subjected to an edge detection algorithm using Matlab. Closed edges
were selected and several morphological and intensity criteria including total pixel area and mean
fluorescence intensity level were used to identify the nuclei of the cells. The segmented image was
used as a mask to calculate YFP and CFP fluorescence as well as centroid position for each nucleus.
In some cases manual correction was applied to the segmented images. mCherry levels for the single

111
cell tracks in Fig. 3E were obtained by manual segmentation of the entire cell, in order to include
total mCherry fluorescence.
Generating population-averaged response curves To generate the YFP response curve for
each movie (such as the ones in Figs. 2C and 3C), the total YFP fluorescence of each cell was
calculated and background fluorescence was subtracted. Each data point on Figs. 2C and 3C
represent the median of this total fluorescence per cell over all cells of one frame in the movie. The
median, rather than the mean, was used for two reasons: (1) the median is less sensitive to occasional
bright outliers such as dead cells and multinucleated cells which may offset the mean. (2) median
fluorescence taken in each frame roughly follows the response of the median cell lineage (see below),
and thus better captures the sharp turn on feature shown in Fig. 3C-H. As shown in Fig. S13,
the median curve essentially follows one of the single cell tracks for a while before switching to the
next median curve. Hence, for such ‘turn-on response’ as in Fig. 3C, the median curve stays low
until half the cells switch on. It then assumes a slope similar to that of the cells that have already
responded. Thus, the rise time of the median curve provides a much better estimation of the median
of the single cell lineage rise times than does the rise time of the mean curve (not shown).
The mean Delta-mCherry decay curve in Fig. 3C was calculated by taking the total mCherry
level above background for each frame and dividing by the number of cells in that frame.
Single cell tracking was performed using a modified version of the Soft Assign algorithm 2,13
and was verified and corrected manually for each cell lineage tracked.
Data analysis Hill coefficients on Figs 2D, S1 were obtained by fitting the data to a Hill function
of the form y = A xn
K+xn where x is the Dplate value, y is the YFP production rate value, and A, K,
and n are free fitting parameters. The fit was performed using a weighted non-linear least squares
algorithm (Matlab). The weights vector was taken to be 1k+yi
, where yi is the production rate value
for the ith data point and k is a minimal error parameter (typically 10% of max(yi)). This weighting
takes into account both logarithmic errors (assuming a log-normal distribution of yi’s) and smaller
fixed errors (i.e errors not proportional to yi levels).We verified that the value obtained for the Hill
coefficients, n, was not sensitive to the exact fitting procedure and parameters. The single cell rise
times for the distribution obtained in Fig. 3F were calculated by fitting the shifted YFP curves
(such as the ones in Fig. 3E) to the following functional form:
y(t) = S(t+1
γln
(1 + exp(−γ(t− tc))
1 + exp(γtc)
)+ c. (1)
Here, y represents the shifted YFP fluorescence level, t, represent time, tc is the time at which
the response turns on (i.e the ‘knee’), γ quantifies the sharpness of turn-on, S is the maximal slope
at > tc, and c = y(0) is a constant. This functional form is derived in the following way: We first

112
assume an effective Hill function response of the production rate of YFP (dy/dt) to the level of
Delta-mCherry (DMC):
dy
dt= S
kmdkmd + (DMC)m
. (2)
Here, m and kd represent the effective Hill coefficient and the Delta-mCherry value that gives
half-maximal expression, respectively. We assume an exponential decay of Delta-mCherry (i.e.
Dcis): DMC = D0 exp(−γ0t) where D0 and γ0 are initial Delta-mCherry level and degradation
rate, respectively. Hence the YFP production rate as a function of time is given by:
dy
dt= S
1
1 + exp(−γ(t− tc)). (3)
Here, γ = mγ0 and exp(γtc) =(D0
kd
)m, The functional form in Eq. (1) is obtained by integrating
Eq. (2) over time. Fitting of the data to Eq. (1) was performed similarly to the Hill function fits
described above. The rise time is then given by τrise = 2/γ. We note that while eq. (1) is only an
approximation to the actual response curve it fits the data well and enables estimation of rise times
in simulated data.
Supplementary material — theory
Cells responding to trans-Delta (Dplate) and cis-Delta (Di)
Model with mutual inactivation of Delta and Notch in cis Let us first consider the case
where cells containing Notch (Ni), Delta (Di), and a reporter of Notch signaling activity (Ri) are
subjected to Dplate (Dp). The reactions we consider are the following:
Ni + Dp [NiDp]→ Si+Dp trans–activation, with association/dissociation rates k±D and
cleavage rate kS ,
Ni + Di [NiD i]→ ∅ cis–inhibition, with association/dissociation rates k±C and inacti-
vation/dilution rate γND,
Si →Ri Signal activation of reporter.
The first reaction represents the interaction of Notch with plate-bound Delta to form a complex
that can then either dissociate or be cleaved to release the intracellular domain of Notch, denoted Si.
The dynamics of Dp are not relevant for the results presented below; thus we consider Dp not to be
consumed in this binding reaction, so that its level is constant. The second reaction describes cis-
inhibition with mutual inactivation of Notch and Delta. Note that we ignore the interaction between
Delta in the cell and Notch in neighboring cells (trans-Notch), which is explicitly accounted for in the
model presented in the Box. This interaction will be considered below. The third reaction represents
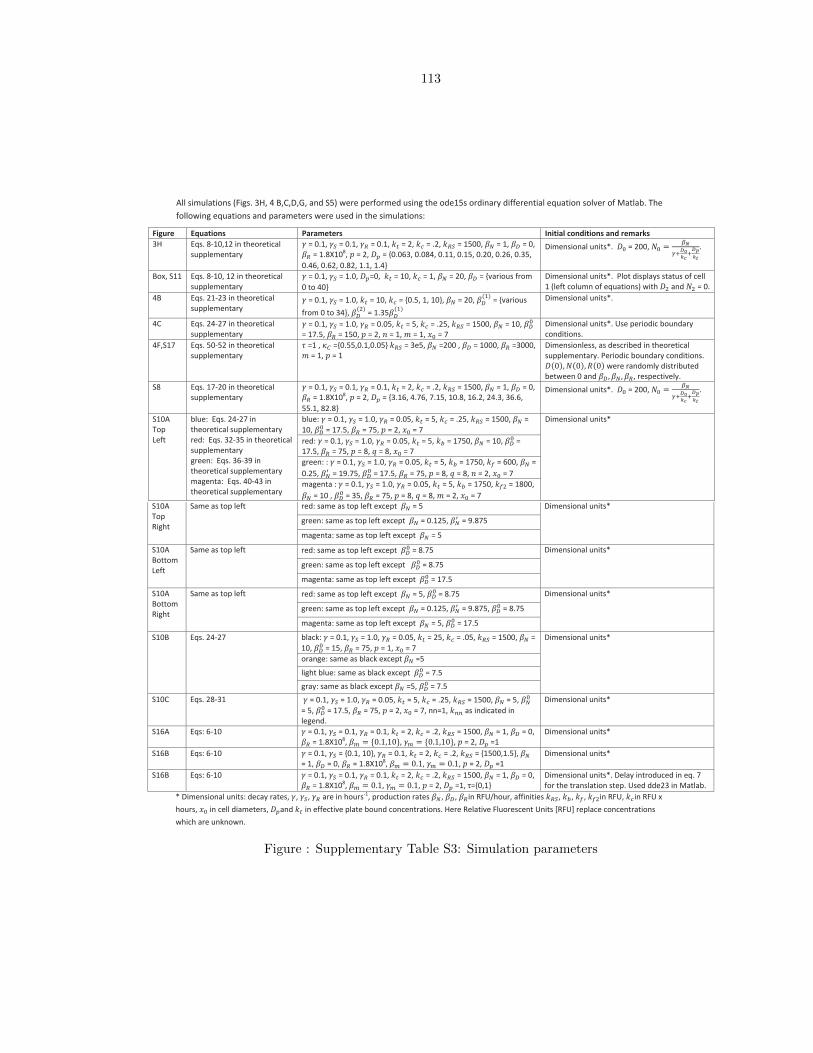
113
30www.nature.com/nature
doi: 10.1038/nature08959 SUPPLEMENTARY INFORMATION
Table S3: Simulation Parameters
All simulations (Figs. 3H, 4 B,C,D,G, and S5) were performed using the ode15s ordinary differential equation solver of Matlab. The following equations and parameters were used in the simulations:
Figure Equations Parameters Initial conditions and remarks 3H Eqs. 8‐10,12 in theoretical
supplementary � = 0.1, �� = 0.1, �� = 0.1, �� = 2, �� = .2, ��� = 1500, �� = 1, �� = 0, �� = 1.8X10⁸, � = 2, �� = {0.063, 0.084, 0.11, 0.15, 0.20, 0.26, 0.35, 0.46, 0.62, 0.82, 1.1, 1.4}
Dimensional units*. �� = 200, �� � ���������
����.
Box, S11 Eqs. 8‐10, 12 in theoretical supplementary
� = 0.1, �� = 1.0, ��=0, �� = 10, �� = 1, �� = 20, �� = {various from 0 to 40}
Dimensional units*. Plot displays status of cell 1 (left column of equations) with �� and �� = 0.
4B Eqs. 21‐23 in theoretical supplementary
� = 0.1, �� = 1.0, �� = 10, �� = {0.5, 1, 10}, �� = 20, ����� = {various from 0 to 34}, ����� = 1.35�����
Dimensional units*.
4C Eqs. 24‐27 in theoretical supplementary
� = 0.1, �� = 1.0, �� = 0.05, �� = 5, �� = .25, ��� = 1500, �� = 10, ��� = 17.5, �� = 150, � = 2, � = 1, � = 1, �� = 7
Dimensional units*. Use periodic boundary conditions.
4F,S17 Eqs. 50‐52 in theoretical supplementary
� =1 , �� ={0.55,0.1,0.05} ��� = 3e5, �� =200 , �� = 1000, �� =3000, � = 1, � = 1
Dimensionless, as described in theoretical supplementary. Periodic boundary conditions. ��0�� ��0�� ��0� were randomly distributed between 0 and ��� ��� ��, respectively.
S8 Eqs. 17‐20 in theoretical supplementary
� = 0.1, �� = 0.1, �� = 0.1, �� = 2, �� = .2, ��� = 1500, �� = 1, �� = 0, �� = 1.8X10⁸, � = 2, �� = {3.16, 4.76, 7.15, 10.8, 16.2, 24.3, 36.6, 55.1, 82.8}
Dimensional units*. �� = 200, �� � ���������
����.
S10A Top Left
blue: Eqs. 24‐27 in theoretical supplementary red: Eqs. 32‐35 in theoretical supplementary green: Eqs. 36‐39 in theoretical supplementary magenta: Eqs. 40‐43 in theoretical supplementary
blue: � = 0.1, �� = 1.0, �� = 0.05, �� = 5, �� = .25, ��� = 1500, �� = 10, ��� = 17.5, �� = 75, � = 2, �� = 7
Dimensional units*
red: � = 0.1, �� = 1.0, �� = 0.05, �� = 5, �� = 1750, �� = 10, ��� = 17.5, �� = 75, � = 8, � = 8, �� = 7 green: : � = 0.1, �� = 1.0, �� = 0.05, �� = 5, �� = 1750, �� = 600, �� = 0.25, ��� = 19.75, ��� = 17.5, �� = 75, � = 8, � = 8, � = 2, �� = 7 magenta : � = 0.1, �� = 1.0, �� = 0.05, �� = 5, �� = 1750, ��� = 1800, �� = 10 , ��� = 35, �� = 75, � = 8, � = 8, � = 2, �� = 7
Figure Equations Parameters Initial conditions and remarks
S10A Top Right
Same as top left red: same as top left except = 5 Dimensional units*
green: same as top left except = 0.125, = 9.875
magenta: same as top left except = 5
S10A Bottom Left
Same as top left red: same as top left except = 8.75 Dimensional units*
green: same as top left except = 8.75
magenta: same as top left except = 17.5
S10A Bottom Right
Same as top left red: same as top left except = 5, = 8.75 Dimensional units*
green: same as top left except = 0.125, = 9.875, = 8.75
magenta: same as top left except = 5, = 17.5
S10B Eqs. 24‐27 black: = 0.1, = 1.0, = 0.05, = 25, = .05, = 1500, = 10, = 15, = 75, = 1, = 7
Dimensional units*
orange: same as black except =5
light blue: same as black except = 7.5
gray: same as black except =5, = 7.5
S10C Eqs. 28‐31 = 0.1, = 1.0, = 0.05, = 5, = .25, = 1500, = 5, = 5, = 17.5, = 75, = 2, = 7, nn=1, as indicated in legend.
Dimensional units*
S16A Eqs: 6‐10 = 0.1, = 0.1, = 0.1, = 2, = .2, = 1500, = 1, = 0, = 1.8X10⁸, , , = 2, =1
Dimensional units*
S16B Eqs: 6‐10 = 0.1, = {0.1, 10}, = 0.1, = 2, = .2, = {1500,1.5}, = 1, = 0, = 1.8X10⁸, , , = 2, =1
Dimensional units*
S16B Eqs: 6‐10 = 0.1, = 0.1, = 0.1, = 2, = .2, = 1500, = 1, = 0, = 1.8X10⁸, , , = 2, =1, τ={0,1}
Dimensional units*. Delay introduced in eq. 7 for the translation step. Used dde23 in Matlab.
* Dimensional units: decay rates, , , are in hours‐1, production rates , , in RFU/hour, affinities , , , in RFU, in RFU x
hours, in cell diameters, and in effective plate bound concentrations. Here Relative Fluorescent Units [RFU] replace concentrations
which are unknown.
Figure : Supplementary Table S3: Simulation parameters

114
the combined process in which the Notch intracellular domain translocates into the nucleus, binds
with the CSL complex, and induces the expression of the reporter mRNA (mR). This process is
represented below phenomenologically by an increasing Hill function in the reporter production term.
These reactions are translated to the following set of ordinary differential equations:
Ni = βN − γNNi −(k+DNiDp − k−D [NiDp]
)−(k+CNiDi − k−C [NiDi]
), (1)
Di = βD − γDDi −(k+CNiDi − k−C [NiDi]
), (2)
˙[NiDp] = k+DNiDp − k−D [NiDp]− kS [NiDp] , (3)
˙[NiDi] = k+CNiDi − k−C [NiDi]− γND [NiDi] , (4)
Si = kS [NiDp]− γSSi, (5)
mRi = fA (Si;βm, p, kRS)− γmmRi, (6)
Ri = αRmRi − γRRi. (7)
The function fA (Si;βm, p, kRS) is an activating Hill function of the form βmSpi
kpRS+Spi
. We assume fast
cleavage of the Notch-Dplate complex, which allows us to apply the quasi-steady-state approximation
to its dynamics ( ˙[NiDp] ≈ 0). Furthermore, we assume that Notch binds to cis-Delta irreversibly
(k−C = 0), and in that way the dynamics of Notch no longer depend on the [NiDi] complex. Finally, we
consider that the relaxation time of the receptor mRNA is much shorter than the protein relaxation
times. With these approximations, the model is reduced to
Ni = βN − γNi −NiDp
kt−Ni
Di
kc, (8)
Di = βD − γDi −NiDi
kc, (9)
Si = NiDp
kt− γSSi, (10)
Ri = fA
(1
γSNiDp
kt;βR, p, kRS
)− γRRi, (11)
where we have defined βR = βmαR
γm, k−1t ≡ k+DkS
k−D+kSand k−1c ≡ k+C . We also take the simplifying
assumption that γN = γD ≡ γ (solving with different degradation rates is straightforward). Addi-
tionally, and based on the simplifying assumption that the promoter of the reporter R is a far from
saturation (i.e., that kRS � 1γSNi
Dp
kt), we approximate its expression as
Ri = βR
(1
γSkRSNiDp
kt
)p− γRRi. (12)
We define the total concentration of Delta in the cell as Dtot = Di + [NiDi]. Using Eqs. (2) and

115
(4) and assuming γ = γND, we find that Dtot follows a simple linear dynamics:
Dtot = βD − γDtot. (13)
This result holds even if the Notch-Delta binding is reversible (k−C 6= 0), provided γ = γND.
The assumption of equal decay rates for both active Delta and the [NiDi] complex is based on the
experimental fact that adding Notch to our Delta-expressing cells does not lead to extra decrease
of Delta levels beyond dilution. The trivial decay dynamics given by Eq. (13) are observed e.g. in
the experiments of Fig. 3C, in which βD = 0. Equations (8)–(10) and (12) are the ones used in the
simulations shown in Figs. 3H and Box.
Ultrasensitive response of the mutual inactivation switch Equations (8)–(9) and (12) can
be readily solved in the steady state, leading to the following stationary levels of Notch and Delta:
Nst =βN − βD
2g− γkc
2+
√(βN − βD
2g− γkc
2
)2
+kcγβNg
, (14)
Dst =βD
γ + Nst
kc
, (15)
where g = γ + Dp/kt. This solution is plotted in the Modeling box of the main text, for the
parameter values given in the Supplementary Table S3. For βN > βD the system reaches a steady
state of high Notch and low Delta, in which the cell can send, but not receive, signals. Conversely,
when βD > βN the steady state corresponds to high Delta and low Notch, and the cell can receive,
but not send, signals. In order to quantify how sensitive the cell is in the region around the switch,
we define the sensitivity parameter as the logarithmic derivative of the steady-state signal Sst with
respect to a control parameter [1], which here we take to be the production rate of Delta, βD:
ξ =d logSst
d log βD,
According to Eq. (10), Sst = DpNst/γSkt, so that using the result given in (14) at the switch
location (βD = βN, where the sensitivity is maximal), and in the limit of large cis-inhibition,
γkc � βN/(γ +Dp/kt), the sensitivity of the switch is approximately [2]
ξ ≈
√βN
4kcγ(γ +Dp/kt), (16)
For the parameters used in the Box figure, and given in the Supplementary Table S3, the switch is
cleary ultrasensitive, with a sensitivity coefficient ξ ≈ 22.4. This result does not change qualitatively
when including reversibility in the binding of Notch and cis-Delta, since in the steady state a nonzero

116
value of k−C would simply lead to a renormalization of the cis-inhibition parameter in the steady-state
calculation, equal to kc =γ+k−Cγk+C
.
The sensitivity parameter has been defined above in terms of the signal, Si, but the experimen-
tally accesible quantity is the reporter’s promoter activity, Ri. The relationship between the reporter
sensitivity and the signal sensitivity is given in a straightforward way by
ξR =d log Rst
d log βD=d log Rst
d logSst
d logSst
d log βD≈ p ξ ,
where we have assumed that the reporter promoter is far from saturation, as in Eq. (12). Thus the
sensitivity measured in our experiments, ξR, is a combination of the switch sensitivity, ξ, and the
cooperativity p of the reporter promoter.
Another difference between the steady-state calculation presented above and the experimental
measurements presented in Fig. 3 is the fact that in the experiments Delta production rate, βD, is
zero, and only the decay of an initial concentration of Delta is observed, as expressed by Eq. (13).
Under these conditions, in our experiments we measure the transient sensitivity [1] of the reporter’s
promoter activity as a function of the instantaneous total concentration of Delta, Dtot. Extensive
numerical simulations of our model show that both parameters are similar to each other within 20%
in our parameter range.
Alternative model without Delta inactivation by Notch An alternative model that fails
to account for several distinctive features of this system (see text) proposes that the receptor-
ligand interaction is catalytic in Delta (in which case Delta is said to be rapidly recycled). The
corresponding reactions are the following:
Ni + Dp [NiDp]→ Si+Dp trans–activation, with association/dissociation rates k±D and
cleavage rate kS ,
Ni + Di [NiD i]→ Di cis–inhibition, with association/dissociation rates k±C and inacti-
vation rate kE ,
Si →Ri Signal activation of reporter.
The cis-inhibition reaction now conserves Delta, unlike the mutual-inactivation model. Using the
same assumptions as were made in the preceding case, we obtain the following ordinary differential

117
equations:
Ni = βN − γNi −NiDp
kt−Ni
Di
kc, (17)
Di = βD − γDi, (18)
Si = NiDp
kt− γSSi, (19)
Ri = fA
(1
γSNiDp
kt;βR, p, kRS
)− γRRi, (20)
which are the basis of the data in Fig. S8.
We note that in this case the steady-state solution of Eqs. (17)-(18) leads to the straightforward
relation
Nst =γβN
1 +Dp
γkt+ βD
kc
,
which shows no sensitivity (ξ = 1) with respect to the control parameter βD.
Effect of finite mRNA and signal lifetimes and reporter expression delay In the previous
paragraphs we have assumed that the lifetimes of the signal, Si, and of the reporter mRNA, mRi,
are very small in comparison with those of the proteins. We have also considered that the expression
of the reporter is instantaneously determined by the level of signal. In order to ascertain that these
approximations do not affect the qualitative behavior of our model as described above, we performed
simulations of models (1)-(7), maintaining the assumptions of a fast cleavage of the Notch-Dplate
complex and irreversible binding between Notch and cis-Delta. We also added a finite delay τ in
the Hill function fA describing the transcription of the reporter mRNA, Eq. (6), which is now made
to depend on the signal Si at an earlier time τ .
Figure S16 shows the effect of these three factors, namely γm, γS , and τ , independently of
each other. As expected, slower decays of the reporter mRNA and signal (plots A and B) lead
to a delay in the turn-on of the reporter. A similar effect is observed in the presence of a time
delay in the expression of the reporter with respect to the signal (plot C). In spite of these time
shifts, the ultrasensitivity of the switch is not substantially affected, with at most a 30% change
in ξ for lifetime variations in the 100× range. We also note that in these simulations the reporter
expression is assumed to depend cooperatively on the signal, with a Hill coefficient p = 2 that is on
the order of the experimentally observed value. Other parameters used in Fig. S16 are given in the
Supplementary Table S3.
Two cells with varying Delta expression
In Fig. 4B of the text we show the amplification of Notch signaling in a cell with some β(1)D with a
neighbor identical except for a higher Delta production rate β(2)D such that β
(2)D & βN & β
(1)D . The
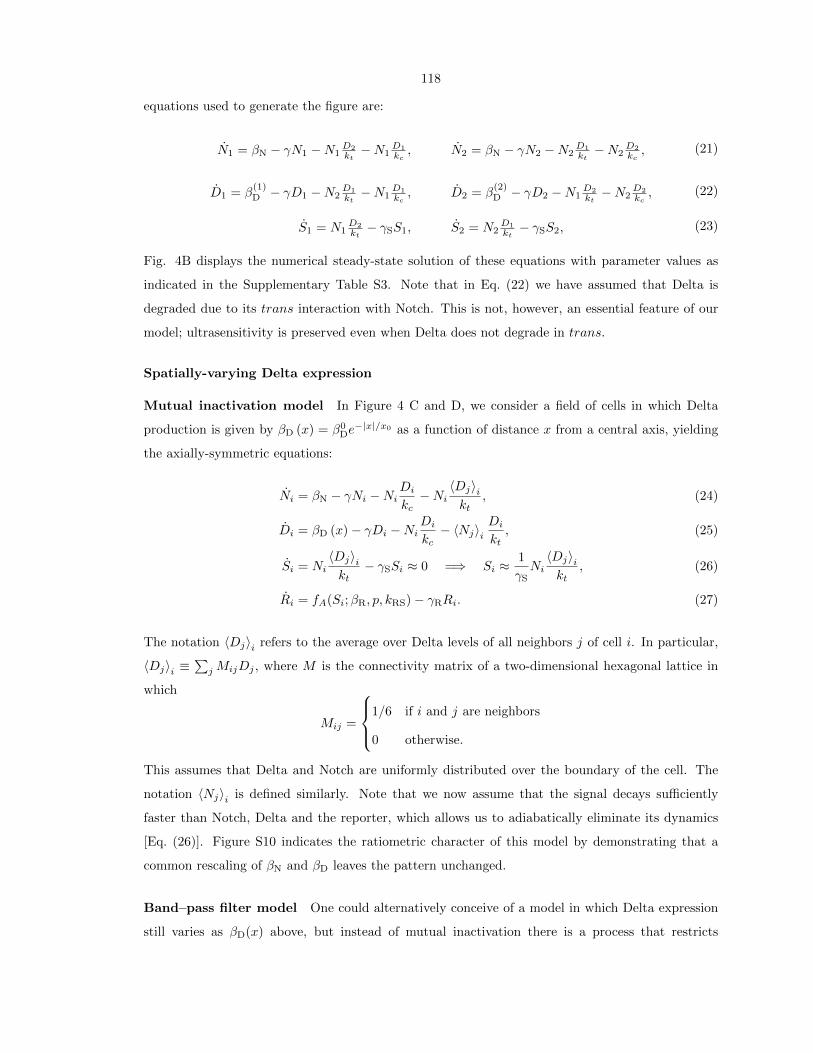
118
equations used to generate the figure are:
N1 = βN − γN1 −N1D2
kt−N1
D1
kc, N2 = βN − γN2 −N2
D1
kt−N2
D2
kc, (21)
D1 = β(1)D − γD1 −N2
D1
kt−N1
D1
kc, D2 = β
(2)D − γD2 −N1
D2
kt−N2
D2
kc, (22)
S1 = N1D2
kt− γSS1, S2 = N2
D1
kt− γSS2, (23)
Fig. 4B displays the numerical steady-state solution of these equations with parameter values as
indicated in the Supplementary Table S3. Note that in Eq. (22) we have assumed that Delta is
degraded due to its trans interaction with Notch. This is not, however, an essential feature of our
model; ultrasensitivity is preserved even when Delta does not degrade in trans.
Spatially-varying Delta expression
Mutual inactivation model In Figure 4 C and D, we consider a field of cells in which Delta
production is given by βD (x) = β0De−|x|/x0 as a function of distance x from a central axis, yielding
the axially-symmetric equations:
Ni = βN − γNi −NiDi
kc−Ni
〈Dj〉ikt
, (24)
Di = βD (x)− γDi −NiDi
kc− 〈Nj〉i
Di
kt, (25)
Si = Ni〈Dj〉ikt− γSSi ≈ 0 =⇒ Si ≈
1
γSNi〈Dj〉ikt
, (26)
Ri = fA(Si;βR, p, kRS)− γRRi. (27)
The notation 〈Dj〉i refers to the average over Delta levels of all neighbors j of cell i. In particular,
〈Dj〉i ≡∑jMijDj , where M is the connectivity matrix of a two-dimensional hexagonal lattice in
which
Mij =
1/6 if i and j are neighbors
0 otherwise.
This assumes that Delta and Notch are uniformly distributed over the boundary of the cell. The
notation 〈Nj〉i is defined similarly. Note that we now assume that the signal decays sufficiently
faster than Notch, Delta and the reporter, which allows us to adiabatically eliminate its dynamics
[Eq. (26)]. Figure S10 indicates the ratiometric character of this model by demonstrating that a
common rescaling of βN and βD leaves the pattern unchanged.
Band–pass filter model One could alternatively conceive of a model in which Delta expression
still varies as βD(x) above, but instead of mutual inactivation there is a process that restricts

119
expression of the reporter within a narrow band of signal values centered about some kb. This
band–pass model is governed by the following equations:
Ni = βN − γNi, (28)
Di = βD (x)− γDi, (29)
Si = Ni〈Dj〉ikt− γSSi ≈ 0 =⇒ Si ≈
1
γSNi〈Dj〉ikt
, (30)
Ri = βRSpi
kpb + Spi
kqbkqb + Sqi
− γRRi. (31)
Figure S10 shows that this model is not ratiometric.
Band–pass filter model with Signal activating Notch Adding a proposed mechanism by
which Notch signaling induces Notch expression to the band–pass filter model, we have
Ni = βN + β′NSni
knf + Sni− γNi, (32)
Di = βD (x)− γDi, (33)
Si = Ni〈Dj〉ikt− γSSi ≈ 0 =⇒ Si ≈
1
γSNi〈Dj〉ikt
, (34)
Ri = βRSpi
kpb + Spi
kqbkqb + Sqi
− γRRi. (35)
Figure S10 shows that the addition of the Notch induction term does not generate a ratiometric
response.
Band–pass filter model with Signal repressing Delta Another potential feedback which we
can include in the band–pass filter model is one in which Notch signaling represses Delta expression.
In this case the model reads
Ni = βN − γNi, (36)
Di =βD (x)
1 + (S/kf2)m − γDi, (37)
Si = Ni〈Dj〉ikt− γSSi ≈ 0 =⇒ Si ≈
1
γSNi〈Dj〉ikt
, (38)
Ri = βRSpi
kpb + Spi
kqbkqb + Sqi
− γRRi. (39)
Also for this feedback, Fig. S10 shows that the resulting response is not ratiometric.

120
Lateral inhibition patterning
In order to see the effect of Notch-Delta mutual inactivation on lateral inhibition patterning, let us
first consider the classic lateral inhibition model studied by Collier et al. [3]:
Ni+Dj [NiD j ]→Si+Ni+Dj trans–activation, with association/dissociation rates k±D and
cleavage rate kS ,
Si → Ri Signal activation of reporter/repressor as Hill function,
Ri Di Repression of Delta.
The trans-activation here does not entail the degradation or inactivation of either Notch or
Delta. The third reaction introduces feedback of incoming signaling on Delta expression. Applied
to a two-dimensional hexagonal lattice of cells (as shown in Fig. 4F), these become the following set
of ordinary differential equations:
Ni = βN − γNi, (40)
Di = fR (Ri;βD,m, kDR)− γDi, (41)
Si = Ni〈Dj〉ikt− γSSi ≈ 0 =⇒ Si ≈
1
γSNi〈Dj〉ikt
, (42)
Ri = fA(Si;βR, p, kRS)− γRRi. (43)
The function fR (Ri;βD,m, kDR) is a repressive Hill function of the form βDkmDR
kmDR+Rmi
. It is now
worth switching to dimensionless units by transforming variables as t ≡ tγR, N ≡ NN0
, D ≡ DD0
, and
R ≡ RkDR
where N0 ≡ βN
γ and D0 ≡ γSkRS
kt1N0
to give
τNi = 1−Ni, (44)
τDi = βD1
1 +Rmi−Di, (45)
Ri = βR
(Ni 〈Dj〉i
)p1 +
(Ni 〈Dj〉i
)p −Ri. (46)
where τ ≡ γRγ , βD ≡ βD
D0γ, and βR ≡ βR
kDRγR.
These equations can, under certain parameter ranges, generate lateral inhibition patterns as was
shown by Collier et al. [3]. Recently, Plahte [4] has shown that the product of cooperativities
pm ≡ n must exceed 1 for a one-dimensional array of cells. Here we show that for a two-dimensional
hexagonal lattice the condition on the product of cooperativities is more stringent, n > 2.
It is immediately clear that a necessary condition for patterning is the instability of the homo-
geneous steady state (N∗, D∗, R∗) in which every cell has the same value of Ni, Di, and Ri. Thus
a linear stability analysis about the homogeneous steady state can provide necessary conditions for

121
patterning [4]. The stability analysis requires the computation of the Jacobian at the homogeneous
steady state, which is in this case complicated by the large number of variables (three times the
number of cells). This is made simpler by an observation originally from Othmer and Scriven [5] that
the Jacobian can be expressed as the sum of two tensor products of matrices, one for the internal
dynamics and the other for interactions with neighbors: J = Ik ⊗H + M ⊗ B. The matrix tensor
product is defined as A⊗B =
(a11B ··· a1kB
.... . .
...ak1B ··· akkB
). Also, here Ik is the k × k identity matrix (k is the
number of cells involved in the interactions in question), Hij = ∂qi∂qj
is the change in production of
species i for a change in species j in the same cell, M is the connectivity matrix as defined above,
and Bij = ∂qi∂〈qj〉 is the change in production of species i for a change in species j in a neighboring
cell. N , D, and R correspond to species i = 1, 2, 3 respectively. For the model described above, the
matrices are:
H =
− 1τ 0 0
0 − 1τ − D∗
τR∗mg0
R∗
N∗ pf0 0 −1
and B =
0 0 0
0 0 0
0 R∗
D∗ pf0 0
, (47)
where g0 ≡ (R∗)m
1+(R∗)m and f0 ≡ 11+(N∗D∗)p are both ≤ 1. Othmer and Scriven [5] proved that the
eigenvalues of the overall Jacobian are the eigenvalues of the various matrices H + qkB where qk are
the eigenvalues of the connectivity matrix M . Thus the eigenvalues λ of the Jacobian are set by the
characteristic equation: ∣∣∣∣∣∣∣∣∣− 1τ − λ 0 0
0 − 1τ − λ − D∗
τR∗mg0
R∗
N∗ pf0R∗
D∗ pf0qk −1− λ
∣∣∣∣∣∣∣∣∣ = 0, (48)
which aside from λ = − 1τ happens to be quadratic in λ, meaning that for every qk there are two
eigenvalues of the Jacobian
λ± =−(1 + 1
τ
)±√(
1 + 1τ
)2 − 4τ (pmg0f0qk + 1)
2. (49)
For instability we need only a single λ to have a real part that is positive, which will be so if
pmg0f0qk ≤ −1. An analysis of the matrix M in [5] tells us that q ≥ −0.5, meaning that pmg0f0 > 2
and, as g0, f0 ≤ 1, pm ≡ n > 2 is a lower bound on the overall cooperativity of the system that
must be satisfied for patterning to occur.
cis-Inhibition To incorporate cis-inhibition we add an interaction Ni + Di [NiDi] → ∅, and
modify the trans-activation to annihilate Notch and Delta. Here it is more convenient to switch into
a different set of dimensionless parameters in which Notch and Delta are normalized by the same

122
quantity: t ≡ γRt, N ≡ NN0
, D ≡ DD0
, and R ≡ RR0
where N0 = D0 ≡ γkt, and R0 ≡ kDR. The
equations are then
τNi = βN −Ni −Ni 〈Dj〉i −NiDi
κc, (50)
τDi = βD1
1 +Rmi−Di − 〈Nj〉iDi −Ni
Di
κc, (51)
Ri = βR
(Ni 〈Dj〉i
)pkpRS +
(Ni 〈Dj〉i
)p −Ri. (52)
where τ ≡ γRγ , βN ≡ βN
γN0, βD ≡ βD
γD0, βR ≡ βR
γRR0, κc ≡ kc
kt, and kRS ≡ kRSγSkt
N0D0. These were used in
Figs. 4F (right panel) and S17, which demonstrate patterning even with pm ≡ n = 1.
References
1. N.E. Buchler and M. Louis. Molecular titration and ultrasensitivity in regulatory networks.
J. Mol. Biol. 384, 1106 (2008).
2. E. Levine, Z. Zhang, T. Kuhlman, T. Hwa. Quantitative characteristics of gene regulation by
small RNA. PLOS Biol. 5(9), e229 (2007).
3. J.R. Collier, N.A.M. Monk, P.K. Maini, J.H. Lewis. Pattern formation by lateral inhibition
with feedback: A mathematical model of Delta-Notch intercellular signalling. J. Theor. Biol.
183, 429 (1996).
4. E. Plahte. Pattern formation in discrete cell lattices. J. Math. Biol. 43, 411 (2001).
5. H.G. Othmer, L.E. Scriven. Instability and dynamic pattern in cellular networks. J. Theor.
Biol. 32, 507 (1971).


![Notch Signaling Pathway - adipogen.com · coordinate activation of this signaling pathway [3]. FIGURE 1: Notch Receptors and their Ligands. Mammals possess four Notch receptors (Notch1–4)](https://static.fdocuments.in/doc/165x107/5d4b2a7688c99342638ba60b/notch-signaling-pathway-coordinate-activation-of-this-signaling-pathway-3.jpg)

