Notch Signaling Inhibition by LY411575 Attenuates ...
13
Research Article Notch Signaling Inhibition by LY411575 Attenuates Osteoblast Differentiation and Decreased Ectopic Bone Formation Capacity of Human Skeletal (Mesenchymal) Stem Cells Nihal AlMuraikhi, 1 Dalia Ali, 1,2 Radhakrishnan Vishnubalaji, 3 Muthurangan Manikandan, 1 Muhammad Atteya, 1,4 Abdulaziz Siyal, 1 Musaad Alfayez, 1 Abdullah Aldahmash, 1,5 Moustapha Kassem , 1,2,6 and Nehad M. Alajez 3 1 Stem Cell Unit, Department of Anatomy, College of Medicine, King Saud University, Riyadh 11461, Saudi Arabia 2 Molecular Endocrinology Unit (KMEB), Department of Endocrinology, University Hospital of Odense and University of Southern Denmark, Odense, Denmark 3 Cancer Research Center, Qatar Biomedical Research Institute (QBRI), Hamad Bin Khalifa University (HBKU), Qatar Foundation (QF), PO Box 34110, Doha, Qatar 4 Histology Department, Faculty of Medicine, Cairo University, Cairo, Egypt 5 Prince Naif Health Research Center, King Saud University, Riyadh 11461, Saudi Arabia 6 Department of Cellular and Molecular Medicine, Danish Stem Cell Center (DanStem), University of Copenhagen, 2200 Copenhagen, Denmark Correspondence should be addressed to Nehad M. Alajez; [email protected] Received 24 March 2019; Accepted 23 June 2019; Published 22 August 2019 Academic Editor: Christian Morsczeck Copyright © 2019 Nihal AlMuraikhi et al. This is an open access article distributed under the Creative Commons Attribution License, which permits unrestricted use, distribution, and reproduction in any medium, provided the original work is properly cited. Background. Chemical biology approaches using small molecule inhibitors targeting specific signaling pathways are useful tools to dissect the molecular mechanisms governing stem cell differentiation and for their possible use in therapeutic interventions. Methods. Stem cell signaling small molecule library functional screen was performed employing human bone marrow skeletal (mesenchymal) stem cells (hBMSCs). Alkaline phosphatase (ALP) activity and formation of mineralized matrix visualized by Alizarin red staining were employed as markers for osteoblastic differentiation. Global gene expression profiling was conducted using the Agilent microarray platform, and data normalization and bioinformatics were performed using GeneSpring software. Pathway analyses were conducted using the Ingenuity Pathway Analysis (IPA) tool. In vivo ectopic bone formation was performed using hBMSC mixed with hydroxyapatite–tricalcium phosphate granules that were implanted subcutaneously in 8- week-old female nude mice. Hematoxylin and eosin staining and Sirius red staining were performed to identify bone formation in vivo. Results. Among the tested molecules, LY411575, a potent γ-secretase and Notch signaling inhibitor, exhibited significant inhibitory effects on osteoblastic differentiation of hBMSCs manifested by reduced ALP activity, mineralized matrix formation, and decreased osteoblast-specific gene expression as well as in vivo ectopic bone formation. Global gene expression profiling of LY411575-treated cells revealed changes in multiple signaling pathways, including focal adhesion, insulin, TGFβ, IL6, and Notch signaling, and decreased the expression of genes associated with functional categories of tissue development. Among the affected signaling networks were TGFβ1, SPP1, and ERK regulatory networks. Conclusions. We identified γ-secretase inhibitor (LY411575) as a potent regulator of osteoblastic differentiation of hBMSC that may be useful as a therapeutic option for treating conditions associated with ectopic bone formation. Hindawi Stem Cells International Volume 2019, Article ID 3041262, 12 pages https://doi.org/10.1155/2019/3041262
Transcript of Notch Signaling Inhibition by LY411575 Attenuates ...

Research ArticleNotch Signaling Inhibition by LY411575 Attenuates OsteoblastDifferentiation and Decreased Ectopic Bone FormationCapacity of Human Skeletal (Mesenchymal) Stem Cells
Nihal AlMuraikhi,1 Dalia Ali,1,2 Radhakrishnan Vishnubalaji,3 Muthurangan Manikandan,1
Muhammad Atteya,1,4 Abdulaziz Siyal,1 Musaad Alfayez,1 Abdullah Aldahmash,1,5
Moustapha Kassem ,1,2,6 and Nehad M. Alajez 3
1Stem Cell Unit, Department of Anatomy, College of Medicine, King Saud University, Riyadh 11461, Saudi Arabia2Molecular Endocrinology Unit (KMEB), Department of Endocrinology, University Hospital of Odense and University ofSouthern Denmark, Odense, Denmark3Cancer Research Center, Qatar Biomedical Research Institute (QBRI), Hamad Bin Khalifa University (HBKU),Qatar Foundation (QF), PO Box 34110, Doha, Qatar4Histology Department, Faculty of Medicine, Cairo University, Cairo, Egypt5Prince Naif Health Research Center, King Saud University, Riyadh 11461, Saudi Arabia6Department of Cellular and Molecular Medicine, Danish Stem Cell Center (DanStem), University of Copenhagen,2200 Copenhagen, Denmark
Correspondence should be addressed to Nehad M. Alajez; [email protected]
Received 24 March 2019; Accepted 23 June 2019; Published 22 August 2019
Academic Editor: Christian Morsczeck
Copyright © 2019 Nihal AlMuraikhi et al. This is an open access article distributed under the Creative Commons AttributionLicense, which permits unrestricted use, distribution, and reproduction in any medium, provided the original work isproperly cited.
Background. Chemical biology approaches using small molecule inhibitors targeting specific signaling pathways are useful tools todissect the molecular mechanisms governing stem cell differentiation and for their possible use in therapeutic interventions.Methods. Stem cell signaling small molecule library functional screen was performed employing human bone marrow skeletal(mesenchymal) stem cells (hBMSCs). Alkaline phosphatase (ALP) activity and formation of mineralized matrix visualized byAlizarin red staining were employed as markers for osteoblastic differentiation. Global gene expression profiling was conductedusing the Agilent microarray platform, and data normalization and bioinformatics were performed using GeneSpring software.Pathway analyses were conducted using the Ingenuity Pathway Analysis (IPA) tool. In vivo ectopic bone formation wasperformed using hBMSC mixed with hydroxyapatite–tricalcium phosphate granules that were implanted subcutaneously in 8-week-old female nude mice. Hematoxylin and eosin staining and Sirius red staining were performed to identify bone formationin vivo. Results. Among the tested molecules, LY411575, a potent γ-secretase and Notch signaling inhibitor, exhibited significantinhibitory effects on osteoblastic differentiation of hBMSCs manifested by reduced ALP activity, mineralized matrix formation,and decreased osteoblast-specific gene expression as well as in vivo ectopic bone formation. Global gene expression profiling ofLY411575-treated cells revealed changes in multiple signaling pathways, including focal adhesion, insulin, TGFβ, IL6, andNotch signaling, and decreased the expression of genes associated with functional categories of tissue development. Among theaffected signaling networks were TGFβ1, SPP1, and ERK regulatory networks. Conclusions. We identified γ-secretase inhibitor(LY411575) as a potent regulator of osteoblastic differentiation of hBMSC that may be useful as a therapeutic option for treatingconditions associated with ectopic bone formation.
HindawiStem Cells InternationalVolume 2019, Article ID 3041262, 12 pageshttps://doi.org/10.1155/2019/3041262
1. Introduction
Human bone marrow skeletal (mesenchymal) stem cells(hBMSC) are clonogenic cells present within bone marrowstroma and capable of differentiation to various mesoderm-type cells including osteoblasts and adipocytes [1]. Theosteoblastic differentiation fate of hBMSCs is tightly regu-lated by intracellular signaling pathways [2] that includeNotch [3], TGFβ [4], bone morphogenetic proteins [3], andWnt/β-catenin [5].
In mammals, the Notch family has four receptors,Notch1-4, and five receptor-binding ligands, Jagged1/2 anddelta-like 1/3/4 [6]. Notch signaling is activated when a cog-nate ligand binds to Notch receptor leading to a sequentialproteolytic cleavage by γ-secretase enzyme and the releaseof the Notch intracellular domain (NICD) [7]. NICD is thefunctional part of Notch signaling which translocates intothe nucleus and regulates target gene transcription [3, 7]. Inaddition to Notch, γ-secretase enzyme is a vital proteolyticenzyme that catalyzes the cleavage of additional integralmembrane proteins such as Amyloid Beta Precursor Protein(APP), CD44, and N-cadherin [8]. Previous studies havedemonstrated that the Notch signaling pathway is a regulatorof bone formation [3, 9, 10]. Notch signaling has beenreported either to enhance or to inhibit osteoblast differenti-ation and mineralization which is dependent on the cellmodel utilized and culture conditions [9].
Chemical biology approaches employing small moleculeinhibitors are useful tools to target specific intracellular sig-naling pathways in order to dissect mechanisms involved instem cell differentiation [11, 12]. Here, we identified a smallmolecule LY411575 through a small molecule library screen[11], as an inhibitor of in vitro osteoblast differentiationand in vivo ectopic bone formation of hBMSC. Global geneexpression analysis revealed that LY411575 affects, in addi-tion to Notch target genes, a number of intracellular signalingnetworks known to influence osteoblast differentiation andbone formation.
2. Materials and Methods
2.1. Cell Culture. A telomerized hBMSC line (hBMSC-TERT)was used in this study as a model for primary hBMSC.hBMSC-TERT was created through an overexpression ofthe human telomerase reverse transcriptase (hTERT) gene.hBMSC-TERT expresses typical characteristics of primaryhBMSC including stemness markers, multipotency, andmolecular signature of global gene expression [13–16].
The cells were cultured in DMEM, a basal medium sup-plemented with 4,500mg/l D-glucose, 4mM L-glutamine,and 110mg/l 10% sodium pyruvate, in addition to 10% fetalbovine serum (FBS), 1% penicillin-streptomycin, and 1%nonessential amino acids. All reagents were purchasedfrom Thermo Fisher Scientific Life Sciences, Waltham, MA(http://www.thermofisher.com). Cells were incubated in 5%CO2 incubators at 37
°C and 95% humidity.
2.2. Osteoblastic Differentiation. At 80%–90% confluence,the cells were incubated in osteoblast induction medium(DMEM) containing 10% FBS, 1% penicillin-streptomycin,
50mg/ml L-ascorbic acid (Wako Chemicals GmbH,Neuss, Germany, http://www.wako-chemicals.de/), 10mM b-glycerophosphate (Sigma-Aldrich), 10nM calcitriol (1a,25-dihydroxyvitamin D3; Sigma-Aldrich), and 10nM dexameth-asone (Sigma-Aldrich). The stem cell signaling small moleculeinhibitor library and LY411575 were purchased from Selleck-chem Inc. (Houston, TX, http://www.selleckchem.com). Smallmolecule inhibitors were added to the osteoblast inductionmedium at a concentration of 3.0 μM. The cells were exposedto the inhibitor or vehicle dimethyl sulfoxide (DMSO)throughout the differentiation period.
2.3. Cell Viability Assay. Cell viability assay was done usingthe alamarBlue assay according to the manufacturer’s rec-ommendations (Thermo Fisher Scientific) where cells werecultured in 96-well plates in 200 μl of the medium. Onday10, 20 μl/well (10%) of alamarBlue substrate was addedand plates were incubated for 1 hr in the dark at 37°C.Readings were taken using BioTek Synergy II microplatereader (BioTek Inc., Winooski, VT, US) using fluorescentmode (Ex 530nm/Em 590nm).
2.4. Quantification of Alkaline Phosphatase Activity. Alkalinephosphatase (ALP) activity quantification was performedusing the BioVision ALP activity colorimetric assay kit (Bio-Vision Inc., Milpitas, CA, http://www.biovision.com/) withsome adjustments. The cells were cultured in 96-well platesfor 10 days. The cells were then rinsed once with PBS andfixed using 3.7% formaldehyde in 90% ethanol for 30 secondsat room temperature. Fixative was removed, and 50 μl/well ofp-nitrophenyl phosphate solution was added and incubatedfor 30–60 minutes. Using a SpectraMax/M5 fluorescencespectrophotometer plate reader, the optical densities werethen measured at 405 nm and ALP enzymatic activity wasnormalized to cell number.
2.5. Alkaline Phosphatase Staining. Alkaline phosphatasestaining was performed at day 10 of osteoblast differentia-tion. Cultured cells were washed in PBS and fixed in 10mMacetone/citrate buffer at pH4.2 for 5min at room tempera-ture. The fixative was replaced with Naphthol/Fast Red stain(0.2mg/ml of Naphthol AS-TR phosphate substrate (Sigma);0.417mg/ml of Fast Red (Sigma)) for 1 hr at room tempera-ture. Then, cells were washed with water and scanned underthe microscope.
2.6. Alizarin Red S Staining for Mineralized MatrixFormation. Alizarin red S staining was performed on day21 of osteoblast differentiation. Cultured cells were washedtwice with PBS and fixed with 4% paraformaldehyde for15min at room temperature. The fixative was removed, andthe cells were then rinsed with distilled water and stainedwith the 2% Alizarin red S staining kit (ScienceCell ResearchLaboratories, Cat. No. 0223) for 20–30min at room temper-ature. Subsequently, the cells were washed with water andscanned under the microscope.
2.7. RNA Extraction and cDNA Synthesis. Total RNA wasextracted from cell pellets at day 10 and 21 postosteoblastdifferentiation induction, using the Total RNA Purification
2 Stem Cells International

Kit (Norgen Biotek Corp., Thorold, ON, Canada, https://norgenbiotek.com/) according to the manufacturer’s instruc-tions. The concentrations of total RNA extracted weremeasured using NanoDrop 2000 (Thermo Fisher ScientificLife Sciences). cDNA was synthesized using 500ng oftotal RNA using the cDNA Transcription Kit (ThermoFisher Scientific Life Sciences) according to the manufac-turer’s instructions.
Quantitative reverse transcriptase-polymerase chain reac-tion (qRT-PCR) was performed using the Applied Biosys-tems ViiA™ 7 Real-Time PCR System (Thermo FisherScientific Life Sciences). Primers used in the presented studyare listed in Table 1. Relative expression was calculated usingthe 2ΔCT value method, and analysis was performed as pre-viously described [17].
2.8. Gene Expression Profiling and Pathway Analyses. Onehundred fifty nanograms of total RNA from day 10 osteo-blastic differentiated hBMSCs were labeled using a low inputQuick Amp Labeling Kit (Agilent Technologies, Santa Clara,CA, http://www.agilent.com) and hybridized to the Agi-lent Human SurePrint G3 Human GE 8 × 60 k microar-ray chip. All microarray experiments were accomplishedat the Microarray Core Facility (Stem Cell Unit, Departmentof Anatomy, King Saud University College of Medicine,Riyadh, Saudi Arabia). The resulted data were normalizedand analyzed using GeneSpring 13.0 software (AgilentTechnologies). Pathway analysis was performed using Gene-Spring 13.0 as described previously [18]. Twofold cutoff andP corr < 0 05 (Benjamini-Hochberg multiple testing cor-rected) were used to define significantly changed transcripts.Pathway and functional annotation analysis were conductedusing the Ingenuity pathway (Ingenuity Systems, http://www.ingenuity.com) [19]. Differentially expressed genes exhibit-ing ≥2 FC (fold change) and corrected P value < 0.05 werechosen for analysis. Enriched network categories were algo-rithmically generated based on their connectivity and rankedaccording to Z score.
2.9. In Vivo Ectopic Bone Formation Assay. Ethical approvalfor all animal experiments was granted by the Animal CareCommittees of King Saud University (No. KSU-SE-18-2).All in vivo experiments were conducted as per the guidelinesof the Animal Care Committees of King Saud University. Invivo experiments were performed as previously described[11, 20]. Briefly, the cells were trypsinized to a single-cell sus-pension and resuspended in a culture medium with/withoutthe tested drug, LY411575 (3.0 μM). Around 5 × 10⁵ cellswere seeded onto 40mg Triosite hydroxyapatite–tricalciumphosphate granules per implant (HA/TCP, Biomatlante/-Zimmer, Albertslund, Denmark; 0.5 to 1mm granules) andkept overnight at 37°C, 5% CO2. HA/TCP granules in combi-nation with cells were then implanted subcutaneously (fourimplants per cell line) in the dorsolateral area of immune-compromised nude mice for 4 weeks. The implants wererecovered, fixed in formalin, decalcified using formic acidsolution (0.4M formic acid and 0.5M sodium formate), forthree days, embedded, and sectioned at 4 μm. Staining wasperformed with hematoxylin and eosin or Sirius red to iden-tify the areas of newly formed bone.
2.10. Quantification of Ectopic Bone Formation. Slides weredigitized using high-resolution whole-slide digital ScanScopescanner (Aperio Technologies Inc.). The digital images fromhematoxylin and eosin-stained slides were then viewed andquantified using the tools of ImageJ software. The wholeimplant is contoured to obtain the total implant area in pixels(TA). All areas of bone are selected to get a total bone area inpixels (BA). The BA/TA ratio was calculated and reported aspercentage (n = 3 sections per implant and 4 implants/treat-ment). The digital images from Sirius red-stained slides wereviewed and analyzed using Aperio’s viewing and image analy-sis tools. In each slide, five rectangular fields of a fixed area of1.18mm2 were randomly selected. Color deconvolution (colorseparation) algorithm (Aperio Technologies Inc.) was thenapplied so as to detect and measure the area of red color ofstained collagen and calculate its area relative to the total area.
Table 1: List of SYBR-Green primers used in current study.
Gene name Forward primer Reverse primer
ACTB 5′AGCCATGTACGTTGCTA 5′AGTCCGCCTAGAAGCAALPL 5′GGAACTCCTGACCCTTGACC3′ 5′TCCTGTTCAGCTCGTACTGC3′COL1A1 5′GAGTGCTGTCCCGTCTGC3′ 5′TTTCTTGGTCGGTGGGTG3′Osteonectin 5′GAGGAAACCGAAGAGGAGG3′ 5′GGGGTGTTGTTCTCATCCAG3′RUNX2 5′GTAGATGGACCTCGGGAACC3′ 5′GAGGCGGTCAGAGAACAAAC3′LIF 5′GCCACCCATGTCACAACAAC 5′CCCCCTGGGCTGTGTAATAGNOTCH3 5′CCTGTGGCCCTCATGGTATC 5′CATGGGTTGGGGTCACAGTCRRAD 5′GCGGAAACCCTAAAGTCCGA 5′GTCCGGGACCGTCCACTIL6 CGAGCCCACCGGGAACGAAA GGACCGAAGGCGTTGTGGAG
COL4A1 ATCCGGGTCTTCCTGGCCCC CCGGTGTCACCACGACTGCC
ID3 5′TCATCTCCAACGACAAAAGG 5′ACCAGGTTTAGTCTCCAGGAATNF 5′ACTTTGGAGTGATCGGCC3′ 5′GCTTGAGGGTTTGCTACAAC3′
3Stem Cells International
TideglusibPurmorphamine
BMS-833923Baricitinib (LY3009104, INCB028050)
QuercetinRKI-1447
Fasudil (HA-1077) HCIGSK429286A
�iazovivinVismodegib (GDC-0449)
Enzastaurin (LY317615)TWS119
AR-A0144181-Azakenpaullone
AZD1080
AZD2858CHIR-98014
CHIR-99021 (CT99021) HCISB415286Indirubin
BIOWnt-C59 (C59)
PF-5274857XAV-939ICG-001IWP-L6
LGK-974KY02111SANT-1
LDE225 (NVP-LDE225, erismodegib)IWR-1-endo
ZM 39923 HCIWHI-P154TG101209
XL019NVP-BSK805 2HCI
CYT387Tafacitinib (CP-690550) citrate
CEP-33779TG101348 (SAR302503)
AZ 960WP1066
LY2784544Ruxolitinib (INCB018424)
Pacritinib (SB1518)S-Ruxolitinib (INCB018424)
Tofacitinib (CP-690550, tasocitinib)LY2157299GW788388
K02288SB525334LY364947
Astragaloside ASB505124
RepSoxGo 6983
Ro 31-8220 mesylatePirfenidoneSotrastaurin
LY2109761Hesperetin
DAPT (GSI-IX)LY2811376
MK-0752LY411575YO-01027
Semagacestat (LY450139)Avagacestat (BMS-708163)
AG-490 (tyrphostin B42)AT9283
SB216763SB431542
Y-276322HCIDMSO
0 100 200
Percent ALP activity
300 400
(a)
DMSO
LY411575
(b)
150
100
50% A
LP ac
tivity
0DMSO LY411575
⁎⁎⁎
(c)
150
100
50
Rela
tive c
ell v
iabi
lity
0DMSO LY411575
(d)
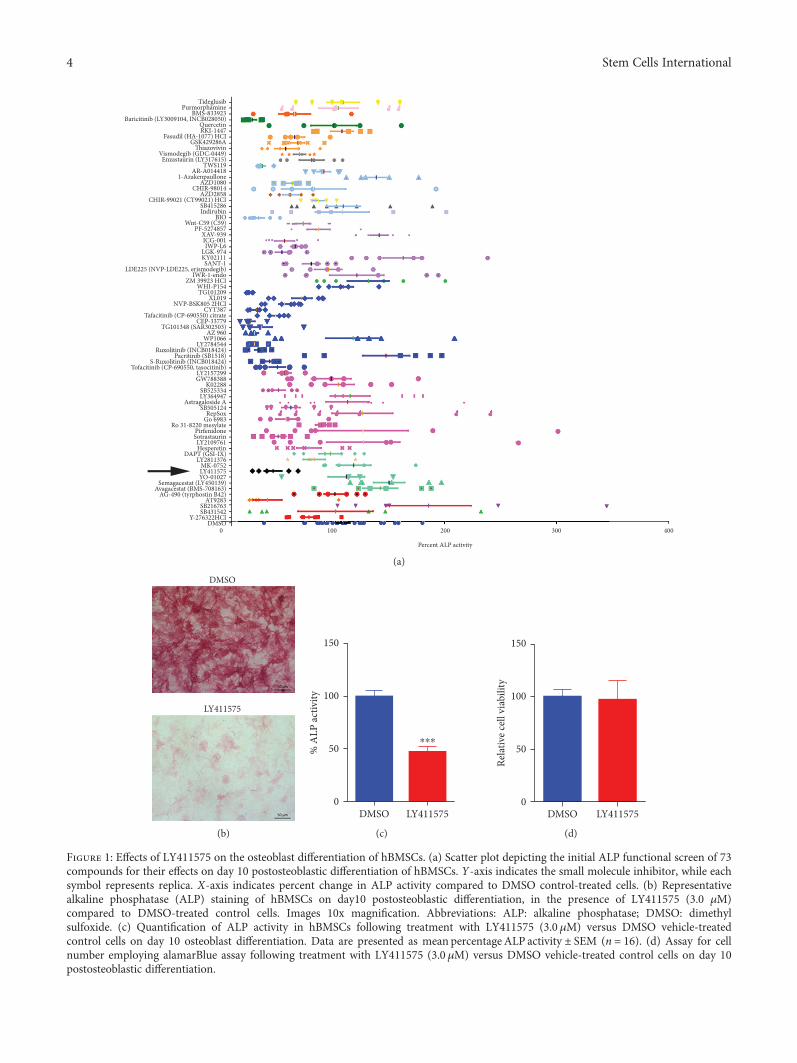
Figure 1: Effects of LY411575 on the osteoblast differentiation of hBMSCs. (a) Scatter plot depicting the initial ALP functional screen of 73compounds for their effects on day 10 postosteoblastic differentiation of hBMSCs. Y-axis indicates the small molecule inhibitor, while eachsymbol represents replica. X-axis indicates percent change in ALP activity compared to DMSO control-treated cells. (b) Representativealkaline phosphatase (ALP) staining of hBMSCs on day10 postosteoblastic differentiation, in the presence of LY411575 (3.0 μM)compared to DMSO-treated control cells. Images 10x magnification. Abbreviations: ALP: alkaline phosphatase; DMSO: dimethylsulfoxide. (c) Quantification of ALP activity in hBMSCs following treatment with LY411575 (3.0 μM) versus DMSO vehicle-treatedcontrol cells on day 10 osteoblast differentiation. Data are presented as mean percentage ALP activity ± SEM (n = 16). (d) Assay for cellnumber employing alamarBlue assay following treatment with LY411575 (3.0 μM) versus DMSO vehicle-treated control cells on day 10postosteoblastic differentiation.
4 Stem Cells International
2.11. Statistical Analysis. Statistical analysis and graphingwere performed using Microsoft Excel 2016 and GraphPadPrism 8 software (GraphPad software, San Diego, CA,U.S.A.), respectively. Results were presented as mean ± SEMfrom at least two independent experiments, and statisticaltesting was performed using the unpaired, two-tailed Studentt-test. P values < 0.05 were considered statistically significant.
3. Results
3.1. LY411575 Inhibits Osteoblast Differentiation of hBMSCs.We have recently reported the result of a small moleculelibrary screen that identified several inhibitors of osteoblastdifferentiation of hBMSCs [11]. Among these, LY411575exhibited potent inhibitory effects (Figure 1(a)). hBMSCstreated with LY411575 (3 μM) exhibited marked reductionin ALP cytochemical staining and ALP activity comparedto DMSO-vehicle-treated control cells (Figures 1(b) and1(c)). LY411575 did not affect hBMSC cell viability, imply-ing a specific impairment of osteoblastic differentiation(Figure 1(d)).
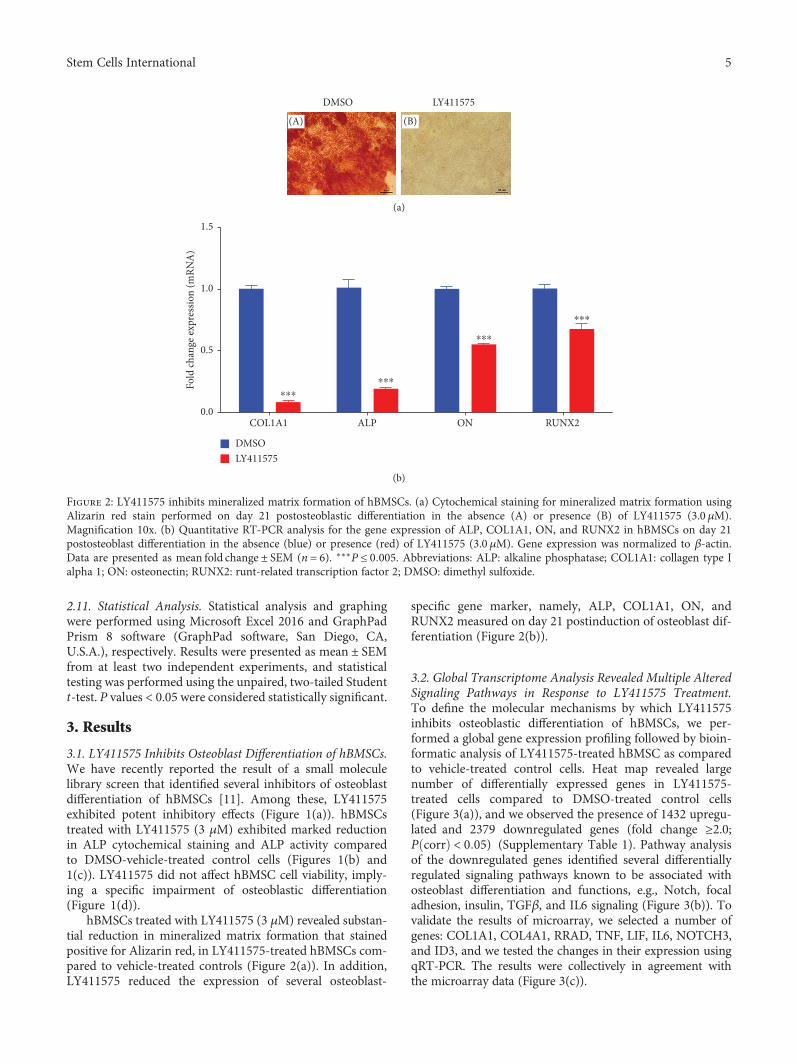
hBMSCs treated with LY411575 (3 μM) revealed substan-tial reduction in mineralized matrix formation that stainedpositive for Alizarin red, in LY411575-treated hBMSCs com-pared to vehicle-treated controls (Figure 2(a)). In addition,LY411575 reduced the expression of several osteoblast-
specific gene marker, namely, ALP, COL1A1, ON, andRUNX2 measured on day 21 postinduction of osteoblast dif-ferentiation (Figure 2(b)).
3.2. Global Transcriptome Analysis Revealed Multiple AlteredSignaling Pathways in Response to LY411575 Treatment.To define the molecular mechanisms by which LY411575inhibits osteoblastic differentiation of hBMSCs, we per-formed a global gene expression profiling followed by bioin-formatic analysis of LY411575-treated hBMSC as comparedto vehicle-treated control cells. Heat map revealed largenumber of differentially expressed genes in LY411575-treated cells compared to DMSO-treated control cells(Figure 3(a)), and we observed the presence of 1432 upregu-lated and 2379 downregulated genes (fold change ≥2.0;P corr < 0 05) (Supplementary Table 1). Pathway analysisof the downregulated genes identified several differentiallyregulated signaling pathways known to be associated withosteoblast differentiation and functions, e.g., Notch, focaladhesion, insulin, TGFβ, and IL6 signaling (Figure 3(b)). Tovalidate the results of microarray, we selected a number ofgenes: COL1A1, COL4A1, RRAD, TNF, LIF, IL6, NOTCH3,and ID3, and we tested the changes in their expression usingqRT-PCR. The results were collectively in agreement withthe microarray data (Figure 3(c)).
DMSO
(A) (B)
LY411575
(a)
1.5
1.0
0.5
Fold
chan
ge ex
pres
sion
(mRN
A)
0.0COL1A1 ALP ON RUNX2
⁎⁎⁎
⁎⁎⁎
⁎⁎⁎
⁎⁎⁎
DMSOLY411575
(b)
Figure 2: LY411575 inhibits mineralized matrix formation of hBMSCs. (a) Cytochemical staining for mineralized matrix formation usingAlizarin red stain performed on day 21 postosteoblastic differentiation in the absence (A) or presence (B) of LY411575 (3.0 μM).Magnification 10x. (b) Quantitative RT-PCR analysis for the gene expression of ALP, COL1A1, ON, and RUNX2 in hBMSCs on day 21postosteoblast differentiation in the absence (blue) or presence (red) of LY411575 (3.0 μM). Gene expression was normalized to β-actin.Data are presented as mean fold change ± SEM (n = 6). ∗∗∗P ≤ 0 005. Abbreviations: ALP: alkaline phosphatase; COL1A1: collagen type Ialpha 1; ON: osteonectin; RUNX2: runt-related transcription factor 2; DMSO: dimethyl sulfoxide.
5Stem Cells International

We subsequently determined the enriched functionalcategories and intracellular signaling networks regulated byLY411575 during the osteogenic differentiation of hBMSCs.The list of differentially expressed genes was subjected to coresignificance analysis using manually curated human func-
tional category annotations and network databases. Diseaseand functional analysis revealed a significant reduction inthe gene expression in several functional categories includingthose involved in tissue development as illustrated inFigures 4(b) and 4(c). Upstream regulator analysis revealed
0 3.6
LY411575 DMSO
–3.6
Color range
(a)
0
Focal_adhesion
10 20 30Matched entities
40 50
Insulin_signalingSenescence_and_autophagyMAPK_signaling_pathway
mRNA_processingRegulation_of_actin_cytoskeletonIntegrin-mediated_cell_adhesion
TNF_alpha_signaling_pathwayToll-like_receptor_signaling_pathway
TGF_beta_signaling_pathwayWnt_signaling_pathway_and_pluripotency
DNA_damage_responseMicroRNAs_in_cardiomyocyte_hypertrophy
Prolactin_signaling_pathwaySelenium_pathway
Proteasome_degradationIL-6_signaling_pathwayIL-4_signaling_pathwayIL-3_signaling_pathway
Signaling_of_hepatocyte_growth_factor_receptorAsparagine_N-linked_glycosylation
Cell_junction_organizationOne_carbon_metabolism
IL-7_signaling_pathwayEBV_LMP1_signaling
Urea_cycle_and_metabolism_of_amino_groupsGlutathione_metabolism
miRNAs_involved_in_DDRBase_excision_repair
Aflatoxin_B1_metabolism
(b)
1.5
1.0
0.5
Fold
chan
ge ex
pres
sion
(mRN
A)
0.0
COL4
A1
COL1
A1
RRA
D
TNF
LIF
IL6
NO
TCH
3
ID3
⁎⁎⁎
⁎⁎⁎
⁎⁎⁎
⁎⁎⁎
⁎⁎⁎
⁎⁎⁎
⁎⁎⁎
⁎⁎⁎
DMSOLY411575
(c)
Figure 3: LY411575 affects multiple genetic pathways in hBMSCs. (a) Heat map and unsupervised hierarchical clustering performed ondifferentially expressed genes during osteoblastic differentiation of LY411575-treated hBMSCs compared to DMSO-treated control cells.(b) Bar chart illustrating the distribution of the top twenty enriched genetic pathways enriched in the significantly downregulated genesidentified in LY411575-treated hBMSCs compared to DMSO-treated control cells. (c) Validation of a selected panel of downregulatedgenes in LY411575-treated hBMSCs compared to DMSO-treated control using qRT-PCR. Gene expression was normalized to β-actin.Data are presented as mean fold change ± SEM (n = 6); ∗∗∗P < 0 001.
6 Stem Cells International

Sized by: −log (P value)
All
Colored by: Zscore Decreasing <−4.592 8.802 increasing
(a)
All > tissue development
Proliferation Formation Growth Development Fibrogenesis
morphogenesis
organization
differentiation
outgrowth
lymphopoiesis hematopoiesis
morphology size
Neuritogenesis Accumulation
(b)
Outgrowth of neuronsProliferation of neuronal cells
Outgrowth of neuritesGrowth of neurites
NeuritogenesisMorphogenesis of neurons
FibrogenesisFromation of filaments
Developement of neuronsDifferentiation of connective tissue cells
Formation of actin stress fibersFormation of actin filaments
Formation of muscle cellsDevelopment of connective tissue cellsProliferation of connective tissue cells
Growth of connective tissueProliferation of muscle cells
Growth of muscle tisssue–5 –4 –3 –2
Activation Z score–1 0
(c)
TGFB1
More extreme in datasetIncreased measurement
Decreased measurement
Predicted activation
Predicted inhibition
More confidence
Glow indicates activitywhen oppositeof measurement
Less
Less
Tgf beta IL1B IFNG TNF
TP53SMARCA4CEBPASMAD4EGR1SP3
SMAD1 NFKBIA SP1 NOTCH1 CTNNB1
Predicted relationshipsLeads to activationLeads to inhibitionFindings inconsistentwith state of downstreammolecule
Effect not predicted
(d)
Figure 4: Continued.
7Stem Cells International

several networks: TGFβ, SPP1, and ERK, with suppressedupstream regulators and suppression of NOTCH activity(Figures 4(d)–4(f)). Our data suggest that LY411575 regu-lates a number of signaling network beyond Notch signalingto inhibit osteoblastic differentiation of hBMSCs.
3.3. LY411575 Inhibits In Vivo Ectopic Bone Formation.LY411575-treated hBMSCs compared to vehicle-treated con-trol cells formed significantly lesser amount of ectopic bonefollowing subcutaneous implantation in immune-deficientmice (Figures 5(a) and 5(b)) and quantitative histological
Predicted relationshipsLeads to activationLeads to inhibitionFindings inconsistentwith state of downstreammolecule
Effect not predicted
More extreme in datasetIncreased measurement
Decreased measurement
Predicted activation
Predicted inhibition
More confidence
Glow indicates activitywhen oppositeof measurement
Less
Less
SPP1
ERK1/2 Jnk ERK
estrogen receptoCTNNB1TP53SP1EGR1JUNDNOTCH1SMAD4NFKBIA
MYC RELB
TGFB1NFkB (family)
(e)
More extreme in datasetIncreased measurement
Decreased measurement
Predicted activation
Predicted inhibition
More confidence
Glow indicates activitywhen oppositeof measurement
Predicted relationshipsLeads to activationLeads to inhibitionFindings inconsistentwith state of downstreammolecule
Effect not predicted
Less
Less
ERK
TNF EGFR
NOTCH1SP3SP1 EGR1MYCNFKBIAJUNDPGRESR1TP53CTNNB1
SPHK1 Mek ERK1/2
(f)
Figure 4: Inhibition of tissue development functional category and NOTCH-associated signaling networks in LY411575-treated hBMSCs. (a)Disease and function heat map depicting activation (red) or inhibition (blue) of the indicated functional and disease categories identified inthe differentially expressed transcripts in LY411575-treated hBMSCs. (b, c) Heat map-illustrating affected tissue development functionalcategory and associated functional annotations, respectively. Illustration of the TGFβ1 (d), SPP1 (e), and ERK (f) genetic networks withpredicted activated state of the network based on transcriptome data and with subsequent predicted effects on downstream effectormolecules. Figure legend illustrates the relationship between molecules within the network.
8 Stem Cells International
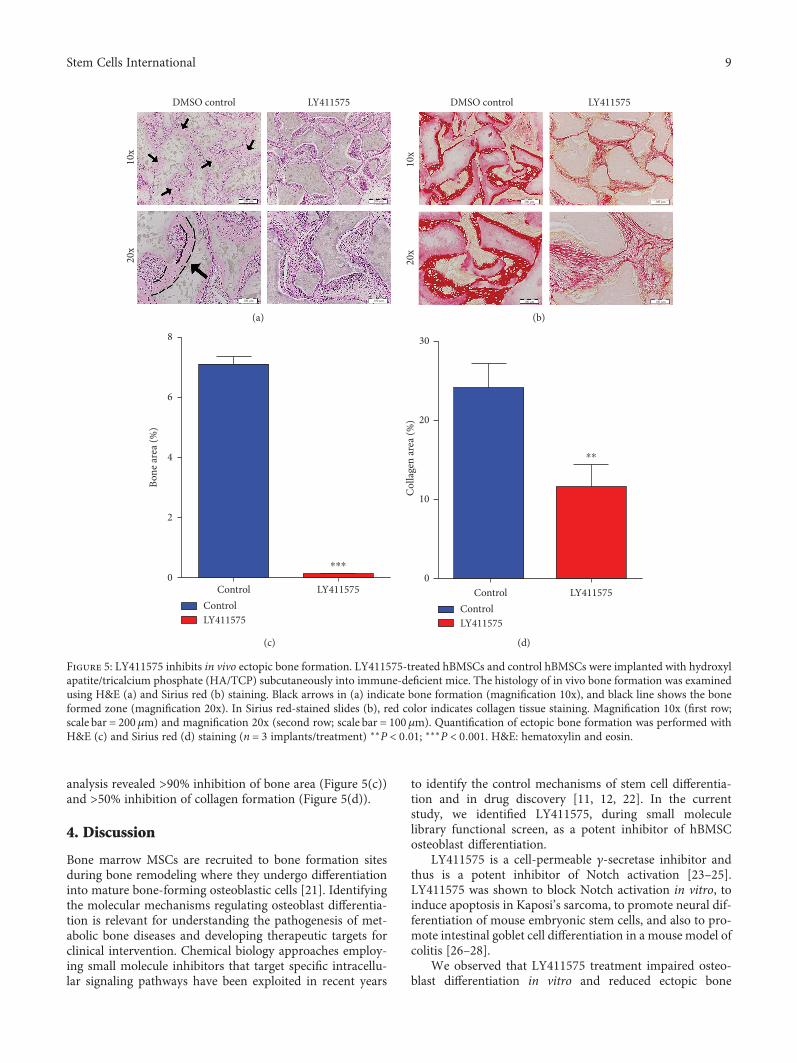
analysis revealed >90% inhibition of bone area (Figure 5(c))and >50% inhibition of collagen formation (Figure 5(d)).
4. Discussion
Bone marrow MSCs are recruited to bone formation sitesduring bone remodeling where they undergo differentiationinto mature bone-forming osteoblastic cells [21]. Identifyingthe molecular mechanisms regulating osteoblast differentia-tion is relevant for understanding the pathogenesis of met-abolic bone diseases and developing therapeutic targets forclinical intervention. Chemical biology approaches employ-ing small molecule inhibitors that target specific intracellu-lar signaling pathways have been exploited in recent years
to identify the control mechanisms of stem cell differentia-tion and in drug discovery [11, 12, 22]. In the currentstudy, we identified LY411575, during small moleculelibrary functional screen, as a potent inhibitor of hBMSCosteoblast differentiation.
LY411575 is a cell-permeable γ-secretase inhibitor andthus is a potent inhibitor of Notch activation [23–25].LY411575 was shown to block Notch activation in vitro, toinduce apoptosis in Kaposi’s sarcoma, to promote neural dif-ferentiation of mouse embryonic stem cells, and also to pro-mote intestinal goblet cell differentiation in a mouse model ofcolitis [26–28].
We observed that LY411575 treatment impaired osteo-blast differentiation in vitro and reduced ectopic bone
DMSO control
10x
20x
LY411575
(a)
DMSO control LY411575
10x
20x
(b)
8
6
4
2
Bone
area
(%)
0Control LY411575
⁎⁎⁎
ControlLY411575
(c)
30
20
10Col
lage
n ar
ea (%
)
0Control LY411575
⁎⁎
ControlLY411575
(d)
Figure 5: LY411575 inhibits in vivo ectopic bone formation. LY411575-treated hBMSCs and control hBMSCs were implanted with hydroxylapatite/tricalcium phosphate (HA/TCP) subcutaneously into immune-deficient mice. The histology of in vivo bone formation was examinedusing H&E (a) and Sirius red (b) staining. Black arrows in (a) indicate bone formation (magnification 10x), and black line shows the boneformed zone (magnification 20x). In Sirius red-stained slides (b), red color indicates collagen tissue staining. Magnification 10x (first row;scale bar = 200μm) and magnification 20x (second row; scale bar = 100μm). Quantification of ectopic bone formation was performed withH&E (c) and Sirius red (d) staining (n = 3 implants/treatment) ∗∗P < 0 01; ∗∗∗P < 0 001. H&E: hematoxylin and eosin.
9Stem Cells International

formation in vivo. The role of Notch signaling in regulatingosteoblast differentiation has been reported in several studiesusing primary human and murine MSCs [29–31], and thesestudies have reported that Notch signaling promoted osteo-blast differentiation which is concordant with our data.
Employing global gene expression profiling of hBMSCfollowing treatment with LY411575, we observed significantchanges in multiple intracellular signaling pathways includ-ing focal adhesion, insulin, TGFβ, and IL6, in addition toNotch signaling, suggesting that LY411575 interacts withmultiple signaling pathways. It is plausible that LY411575treatment leads to changes in a number of signaling path-ways, secondary to its effects on Notch signaling, and sug-gests the existence of crosstalks between Notch signalingand other signaling pathways. For example, Zavadil and col-leagues reported functional integration between Notch andTGFβ signaling during epithelial to mesenchymal transition(EMT) [32]. Similar crosstalk between Notch and insulin sig-naling has been reported in lung adenocarcinoma cells underhypoxic environment [33]. Also, LY411575-treated hBMSCsexhibited significant downregulation (~-21.0 FC) of the ID3gene expression which is one of the BMP-signaling targetgenes. Maeda et al. [34] have reported that ID1 and ID3 pro-moted bone formation in response to BMP stimulationin vivo and that ID1, ID2, and ID3 enhanced cell prolifera-tion of early osteoblast progenitors [35]. Finally, previouspublished studies have demonstrated the importance ofthese signaling pathways in regulating osteoblasts differenti-ation including focal adhesion [36], insulin [37–39], TGFβ[4, 40], IL6 [41, 42], Notch signaling [3, 9, 31], and cell cycleregulation [43].
Recently, Chen et al. [44] have reported that LY411575suppressed osteoclast differentiation and bone resorptionvia suppressing Notch signaling. This study corroborates thatNotch signaling in addition to its effects on osteoblast differ-entiation supports osteoclast functions and bone resorption.Thus, LY411575 can regulate both osteoblastic and osteoclas-tic activity and can be a good approach for treating bone dis-eases with mixed sclerotic and osteolytic lesions, e.g., cancerbone metastases.
5. Conclusions
LY411575 has been used for the treatment of a variety ofneurological disorders including Alzheimer’s disease and[45] has potential therapeutic use in the treatment of Kapo-si’s sarcoma and breast and colorectal cancer. Our data sug-gest the possible use of LY411575 in skeletal diseasesassociated with increased bone formation, e.g., osteosclero-tic bone metastases or ectopic calcification association withrenal osteodystrophy.
Data Availability
Supporting data are provided as supplementary data.
Conflicts of Interest
The authors declare no conflict of interest.
Acknowledgments
Wewould like to thank the Deanship of Scientific Research atKing Saud University (Research Group No. RG-1440-019)for funding this work.
Supplementary Materials
Supplementary Table 1: list of differentially expressed genes(2.0 FC, P corr < 0 05) in human bone marrow mesenchy-mal stem cells (hBMSCs) differentiated into osteoblasts(day 10) in the presence of LY411575 compared to DMSO.(Supplementary Materials)
References
[1] A. Aldahmash, W. Zaher, M. Al-Nbaheen, and M. Kassem,“Human stromal (mesenchymal) stem cells: basic biologyand current clinical use for tissue regeneration,” Annals ofSaudi Medicine, vol. 32, no. 1, pp. 68–77, 2012.
[2] B. M. Abdallah, A. Jafari, W. Zaher, W. Qiu, and M. Kassem,“Skeletal (stromal) stem cells: an update on intracellular sig-naling pathways controlling osteoblast differentiation,” Bone,vol. 70, pp. 28–36, 2015.
[3] J. Cao, Y. Wei, J. Lian et al., “Notch signaling pathway pro-motes osteogenic differentiation of mesenchymal stem cellsby enhancing BMP9/Smad signaling,” International Journalof Molecular Medicine, vol. 40, no. 2, pp. 378–388, 2017.
[4] M. Elsafadi, M. Manikandan, S. Almalki et al., “TGFbeta1-induced differentiation of human bone marrow-derived MSCsis mediated by changes to the actin cytoskeleton,” Stem CellsInternational, vol. 2018, Article ID 6913594, 14 pages, 2018.
[5] W. Qiu, T. E. Andersen, J. Bollerslev, S. Mandrup, B. M.Abdallah, and M. Kassem, “Patients with high bone massphenotype exhibit enhanced osteoblast differentiation andinhibition of adipogenesis of human mesenchymal stem cells,”Journal of Bone and Mineral Research, vol. 22, no. 11,pp. 1720–1731, 2007.
[6] R. Kopan and M. X. Ilagan, “The canonical Notch signalingpathway: unfolding the activation mechanism,” Cell, vol. 137,no. 2, pp. 216–233, 2009.
[7] Z. Xiao, J. Zhang, X. Peng et al., “The Notch γ-secretaseinhibitor ameliorates kidney fibrosis via inhibition of TGF-β/Smad2/3 signaling pathway activation,” The InternationalJournal of Biochemistry & Cell Biology, vol. 55, pp. 65–71,2014.
[8] R. Kopan and M. X. Ilagan, “γ-Secretase: proteasome of themembrane?,” Nature Reviews Molecular Cell Biology, vol. 5,no. 6, pp. 499–504, 2004.
[9] Y. Ji, Y. Ke, and S. Gao, “Intermittent activation of notchsignaling promotes bone formation,” American Journal ofTranslational Research, vol. 9, no. 6, pp. 2933–2944, 2017.
[10] S. Zanotti, A. Smerdel-Ramoya, L. Stadmeyer, D. Durant,F. Radtke, and E. Canalis, “Notch inhibits osteoblast differen-tiation and causes osteopenia,” Endocrinology, vol. 149, no. 8,pp. 3890–3899, 2008.
[11] N. AlMuraikhi, D. Ali, A. Alshanwani et al., “Stem cell libraryscreen identified ruxolitinib as regulator of osteoblastic differ-entiation of human skeletal stem cells,” Stem Cell Research &Therapy, vol. 9, no. 1, p. 319, 2018.
10 Stem Cells International

[12] A. Jafari, M. S. Siersbaek, L. Chen et al., “Pharmacological inhi-bition of protein kinase G1 enhances bone formation byhuman skeletal stem cells through activation of RhoA-Akt sig-naling,” Stem Cells, vol. 33, no. 7, pp. 2219–2231, 2015.
[13] B. M. Abdallah, M. Haack-Sorensen, J. S. Burns et al., “Main-tenance of differentiation potential of human bone marrowmesenchymal stem cells immortalized by human telomerasereverse transcriptase gene despite of extensive proliferation,”Biochemical and Biophysical Research Communications,vol. 326, no. 3, pp. 527–538, 2005.
[14] M. Al-Nbaheen, R. Vishnubalaji, D. Ali et al., “Human stromal(mesenchymal) stem cells from bone marrow, adipose tissueand skin exhibit differences in molecular phenotype and differ-entiation potential,” Stem Cell Reviews and Reports, vol. 9,no. 1, pp. 32–43, 2013.
[15] J. Simonsen, C. Rosada, N. Sernici et al., “Telomerase expres-sion extends lifespan and prevents senescence-associatedimpairment of osteoblast functions,” Nature Biotechnology,vol. 20, 2002.
[16] N. A. Twine, L. Harkness, J. Adjaye, A. Aldahmash, M. R. Wil-kins, and M. Kassem, “Molecular phenotyping of telomerizedhuman bone marrow skeletal stem cells reveals a genetic pro-gram of enhanced proliferation and maintenance of differentia-tion responses,” JBMR Plus, vol. 2, no. 5, pp. 257–267, 2018.
[17] K. J. Livak and T. D. Schmittgen, “Analysis of relative geneexpression data using real-time quantitative PCR and the2−ΔΔCT method,” Methods, vol. 25, no. 4, pp. 402–408, 2001.
[18] R. Vishnubalaji, M. Manikandan, M. Fahad et al., “Molecularprofiling of ALDH1+ colorectal cancer stem cells reveals pref-erential activation of MAPK, FAK, and oxidative stress pro-survival signalling pathways,” Oncotarget, vol. 9, no. 17,pp. 13551–13564, 2018.
[19] S. E. Calvano, W. Xiao, D. R. Richards et al., “A network-basedanalysis of systemic inflammation in humans,” Nature,vol. 437, no. 7061, pp. 1032–1037, 2005.
[20] B. M. Abdallah, N. Ditzel, and M. Kassem, “Assessment ofbone formation capacity using in vivo transplantation assays:procedure and tissue analysis,” Methods in Molecular Biology,vol. 455, pp. 89–100, 2008.
[21] S. Khosla, J. J. Westendorf, and M. J. Oursler, “Building boneto reverse osteoporosis and repair fractures,” The Journal ofClinical Investigation, vol. 118, no. 2, pp. 421–428, 2008.
[22] B. Lu and A. Atala, “Small molecules and small molecule drugsin regenerative medicine,” Drug Discovery Today, vol. 19,no. 6, pp. 801–808, 2014.
[23] B. De Strooper, W. Annaert, P. Cupers et al., “A presenilin-1-dependent gamma-secretase-like protease mediates release ofNotch intracellular domain,” Nature, vol. 398, no. 6727,pp. 518–522, 1999.
[24] Y. Ran, F. Hossain, A. Pannuti et al., “γ‐secretase inhibitors incancer clinical trials are pharmacologically and functionallydistinct,” EMBO Molecular Medicine, vol. 9, no. 7, pp. 950–966, 2017.
[25] G. T. Wong, D. Manfra, F. M. Poulet et al., “Chronic treatmentwith the γ-secretase inhibitor LY-411,575 inhibits β-amyloidpeptide production and alters lymphopoiesis and intestinal celldifferentiation,” Journal of Biological Chemistry, vol. 279,no. 13, pp. 12876–12882, 2004.
[26] E. Abranches, M. Silva, L. Pradier et al., “Neural differentiationof embryonic stem cells in vitro: a road map to neurogenesis inthe embryo,” PLoS One, vol. 4, no. 7, article e6286, 2009.
[27] C. L. Curry, L. L. Reed, T. E. Golde, L. Miele, B. J. Nickoloff,and K. E. Foreman, “Gamma secretase inhibitor blocks Notchactivation and induces apoptosis in Kaposi’s sarcoma tumorcells,” Oncogene, vol. 24, no. 42, pp. 6333–6344, 2005.
[28] R. Okamoto, K. Tsuchiya, Y. Nemoto et al., “Requirement ofNotch activation during regeneration of the intestinal epithe-lia,” American Journal of Physiology. Gastrointestinal and LiverPhysiology, vol. 296, no. 1, pp. G23–G35, 2009.
[29] P. Liu, Y. Ping, M. Ma et al., “Anabolic actions of Notch onmature bone,” Proceedings of the National Academy of Sciencesof the United States of America, vol. 113, no. 15, pp. E2152–E2161, 2016.
[30] K. Tezuka, M. Yasuda, N. Watanabe et al., “Stimulation ofosteoblastic cell differentiation by Notch,” Journal of Boneand Mineral Research, vol. 17, no. 2, pp. 231–239, 2002.
[31] F. Ugarte, M. Ryser, S. Thieme et al., “Notch signalingenhances osteogenic differentiation while inhibiting adipogen-esis in primary human bone marrow stromal cells,” Experi-mental Hematology, vol. 37, no. 7, pp. 867–875.e1, 2009.
[32] J. Zavadil, L. Cermak, N. Soto-Nieves, and E. P. Bottinger,“Integration of TGF‐β/Smad and Jagged1/Notch signalling inepithelial‐to‐mesenchymal transition,” The EMBO Journal,vol. 23, no. 5, pp. 1155–1165, 2004.
[33] S. Eliasz, S. Liang, Y. Chen et al., “Notch-1 stimulates survivalof lung adenocarcinoma cells during hypoxia by activating theIGF-1R pathway,” Oncogene, vol. 29, no. 17, pp. 2488–2498,2010.
[34] Y. Maeda, K. Tsuji, A. Nifuji, and M. Noda, “Inhibitoryhelix-loop-helix transcription factors Id1/Id3 promote boneformation in vivo,” Journal of Cellular Biochemistry, vol. 93,no. 2, pp. 337–344, 2004.
[35] Y. Peng, Q. Kang, Q. Luo et al., “Inhibitor of DNA bin-ding/differentiation helix-loop-helix proteins mediate bonemorphogenetic protein-induced osteoblast differentiation ofmesenchymal stem cells,” The Journal of Biological Chemis-try, vol. 279, no. 31, pp. 32941–32949, 2004.
[36] R. M. Salasznyk, R. F. Klees, W. A. Williams, A. Boskey, andG. E. Plopper, “Focal adhesion kinase signaling pathways reg-ulate the osteogenic differentiation of human mesenchymalstem cells,” Experimental Cell Research, vol. 313, no. 1,pp. 22–37, 2007.
[37] K. Fulzele, R. C. Riddle, D. J. DiGirolamo et al., “Insulinreceptor signaling in osteoblasts regulates postnatal boneacquisition and body composition,” Cell, vol. 142, no. 2,pp. 309–319, 2010.
[38] A. Hayrapetyan, J. A. Jansen, and J. J. van den Beucken, “Sig-naling pathways involved in osteogenesis and their applicationfor bone regenerative medicine,” Tissue Engineering Part B:Reviews, vol. 21, no. 1, pp. 75–87, 2015.
[39] S. N. Pramojanee, M. Phimphilai, N. Chattipakorn, and S. C.Chattipakorn, “Possible roles of insulin signaling in osteo-blasts,” Endocrine Research, vol. 39, no. 4, pp. 144–151, 2014.
[40] R. J. Akhurst, D. R. Fitzpatrick, D. J. Fowlis, D. Gatherer, F. A.Millan, and H. Slager, “The role of Tgf-βS in mammaliandevelopment and neoplasia,” Molecular Reproduction andDevelopment, vol. 32, no. 2, pp. 127–135, 1992.
[41] J. E. Huh and S. Y. Lee, “IL-6 is produced by adipose-derivedstromal cells and promotes osteogenesis,” Biochimica et Bio-physica Acta, vol. 1833, no. 12, pp. 2608–2616, 2013.
[42] Z. Xie, S. Tang, G. Ye et al., “Interleukin-6/interleukin-6 recep-tor complex promotes osteogenic differentiation of bone
11Stem Cells International

marrow-derived mesenchymal stem cells,” Stem Cell Research& Therapy, vol. 9, no. 1, p. 13, 2018.
[43] L. Chen, K. Holmstrom, W. Qiu et al., “MicroRNA-34ainhibits osteoblast differentiation and in vivo bone formationof human stromal stem cells,” Stem Cells, vol. 32, no. 4,pp. 902–912, 2014.
[44] X. Chen, X. Chen, Z. Zhou et al., “LY411575, a potentγ‐secretase inhibitor, suppresses osteoclastogenesis in vitroand LPS‐induced calvarial osteolysis in vivo,” Journal of Cellu-lar Physiology, pp. 1–13, 2019.
[45] G. S. Basi, S. Hemphill, E. F. Brigham et al., “Amyloid precur-sor protein selective gamma-secretase inhibitors for treatmentof Alzheimer’s disease,” Alzheimer's Research & Therapy,vol. 2, no. 6, p. 36, 2010.
12 Stem Cells International

Hindawiwww.hindawi.com
International Journal of
Volume 2018
Zoology
Hindawiwww.hindawi.com Volume 2018
Anatomy Research International
PeptidesInternational Journal of
Hindawiwww.hindawi.com Volume 2018
Hindawiwww.hindawi.com Volume 2018
Journal of Parasitology Research
GenomicsInternational Journal of
Hindawiwww.hindawi.com Volume 2018
Hindawi Publishing Corporation http://www.hindawi.com Volume 2013Hindawiwww.hindawi.com
The Scientific World Journal
Volume 2018
Hindawiwww.hindawi.com Volume 2018
BioinformaticsAdvances in
Marine BiologyJournal of
Hindawiwww.hindawi.com Volume 2018
Hindawiwww.hindawi.com Volume 2018
Neuroscience Journal
Hindawiwww.hindawi.com Volume 2018
BioMed Research International
Cell BiologyInternational Journal of
Hindawiwww.hindawi.com Volume 2018
Hindawiwww.hindawi.com Volume 2018
Biochemistry Research International
ArchaeaHindawiwww.hindawi.com Volume 2018
Hindawiwww.hindawi.com Volume 2018
Genetics Research International
Hindawiwww.hindawi.com Volume 2018
Advances in
Virolog y Stem Cells International
Hindawiwww.hindawi.com Volume 2018
Hindawiwww.hindawi.com Volume 2018
Enzyme Research
Hindawiwww.hindawi.com Volume 2018
International Journal of
MicrobiologyHindawiwww.hindawi.com
Nucleic AcidsJournal of
Volume 2018
Submit your manuscripts atwww.hindawi.com