The Liquid State and Principles of Solidification of Cast Iron
13
The Liquid State and Principles of Solidification of Cast Iron Doru M. Stefanescu, The Ohio State University and The University of Alabama Roxana Ruxanda, Emerson Climate Technologies UPON MELTING OF GRAPHITIC IRON, the graphite will dissolve if enough time at the super- heating temperature is allowed. Thus, the struc- ture of liquid iron is a function of chemical analysis, temperature, and holding time in the liq- uid state. X-ray analysis on liquid cast iron demonstrated that, for a Fe-4.1%C-1%Si alloy, the size of undissolved graphite immediately after melting was 36 to 38 nm (Ref 1). It decreased by half after 5 to 6 h holding at 1220 C (2230 F). The graphite completely dissolved after approxi- mately 11 h. For a low-silicon alloy, Fe-4% C-0.02%Si, the size of the graphite particles after melting was approximately 17 nm, and the graph- ite dissolved completely in 3 to 5 h. Iron-carbon alloys with low carbon content (steels) in liquid state are condensed phases with compact distribution of atoms in short-range order. X-ray and neutron wide-angle diffraction performed by Steeb and Maier (Ref 2) on molten iron-carbon alloys with up to 5.5 wt% C in the temperature range of 1150 to 1600 C (2100 to 2910 F) found that, for pure iron, the number of nearest neighbors (number of atoms in the first coordination sphere) is N I = 9, and the nearest neighbor distance is r I = 2.6 10 10 m. Up to 1% C, the packing density is increased as the dis- tance increases to 2.67 10 10 m, and the number of neighbors increases to 10.4 (Fig. 1). Between 1.8 and 3% C, the nearest neighbor distance remains constant, but the number of neighbors increases to 11.2 atoms, which means that the packing density is further increased. A maximum packing density is reached at 3% C, and it remains constant at higher carbon concentra- tions. At 3.5% C, the authors concluded that short-range-ordered regions rich in carbon exist in the melt, but they were unable to establish their structure. Indeed, viscosity measurements summarized in Fig. 2 (Ref 3) show a correlation between viscosity and percentage of carbon. The melts containing short-range-ordered regions show high viscosity values. Thus, liquid iron-carbon alloys with low carbon content (<3.5% C, i.e., steels and cast irons poor in carbon) are microscopically homo- geneous. Liquid iron-carbon alloys with high carbon (>3.5% C, i.e., cast irons rich in carbon) are colloidal-dispersed systems with carbon clusters in liquid solution. The nature of the car- bon clusters is not clear. There are two hypoth- eses regarding their structure: they are Fe 3 C molecules, or they are C n molecules. From thermodynamic considerations, Darken (Ref 4) concluded that the existence of Fe 3 C molecules in iron-carbon melts is possible. Activity measurements also support short-range order similar to Fe 3 C (Ref 5). Because the nucleation energy for Fe 3 C is smaller than that for graphite, it is thermodynamically possible for the carbon-rich regions to exist as Fe 3 C clusters. Other investigators consider the carbon clus- ters to be stable in iron-carbon melts with more than 2% C (Ref 6, 7). Their size is supposed to be in the range of 1 to 20 nm, and it increases with the carbon equivalent, lower silicon con- tent, and lower holding time and temperature. According to Ref 2, these carbon clusters contain approximately 15 atoms (C 15 ) with a stability time interval of approximately 10 10 s. It is to be expected that the carbon-rich clusters existing in molten iron-carbon alloys are in dynamic equilibrium and that they diffuse within the melt. Fundamentals of Solidification of Cast Iron Solidification processing is one of the oldest manufacturing processes, because it is the prin- cipal component of metal casting processing. While solidification science evolved from the need to better understand and further develop casting processes, solidification science today (2106) is at the base of many new develop- ments that fall out of the realm of traditional metal casting. Solidification is, strictly speaking, the trans- formation of liquid matter into solid matter. The microstructure that results from solidifica- tion may be the final one, in which case it directly affects the mechanical properties of the product. In other cases, heat treatment or other processes may be used after solidification to further modify the solidification microstruc- ture. However, the outcome of this additional processing will be greatly affected by the solid- ification microstructure. Length Scale of Solidification Structures The effect of solidification on the morphol- ogy of the matrix can be deconstructed at four different length scales (Ref 8) (Fig. 3): ASM Handbook, Volume 1A, Cast Iron Science and Technology D.M. Stefanescu, editor Copyright # 2017 ASM International W All rights reserved www.asminternational.org Neutron X-ray Iron, mass% Number of atoms 94 95 96 97 98 99 9 10 11 12 100 Fig. 1 Number of atoms in the first coordination sphere obtained by neutron diffraction and x-ray. Source: Ref 2 r I r I N I N I const. r I , N I const. Short range ordered regions 4.5 4.0 3.5 3.0 2.5 2.0 1.5 1.0 0.5 4 0 5 6 7 8 9 10 4 5 6 7 8 9 10 Carbon concentration, wt% Viscosity of iron-carbon alloys, cP Viscosity of iron-carbon alloys, Pa · s × 10 –3 , Fig. 2 Viscosity of iron-carbon alloys as a function of carbon concentration. Source: Ref 3
Transcript of The Liquid State and Principles of Solidification of Cast Iron

The Liquid State and Principles ofSolidification of Cast IronDoru M. Stefanescu, The Ohio State University and The University of AlabamaRoxana Ruxanda, Emerson Climate Technologies
UPONMELTINGOFGRAPHITIC IRON, thegraphite will dissolve if enough time at the super-heating temperature is allowed. Thus, the struc-ture of liquid iron is a function of chemicalanalysis, temperature, and holding time in the liq-uid state. X-ray analysis on liquid cast irondemonstrated that, for a Fe-4.1%C-1%Si alloy,the size of undissolved graphite immediately aftermelting was 36 to 38 nm (Ref 1). It decreased byhalf after 5 to 6 h holding at 1220 �C (2230 �F).The graphite completely dissolved after approxi-mately 11 h. For a low-silicon alloy, Fe-4%C-0.02%Si, the size of the graphite particles aftermelting was approximately 17 nm, and the graph-ite dissolved completely in 3 to 5 h.Iron-carbon alloys with low carbon content
(steels) in liquid state are condensed phases withcompact distribution of atoms in short-rangeorder. X-ray and neutron wide-angle diffractionperformed by Steeb and Maier (Ref 2) on molteniron-carbon alloys with up to 5.5 wt% C in thetemperature range of 1150 to 1600 �C (2100 to2910 �F) found that, for pure iron, the numberof nearest neighbors (number of atoms in the firstcoordination sphere) is NI = 9, and the nearestneighbor distance is rI = 2.6 � 10�10 m. Up to1%C, the packing density is increased as the dis-tance increases to 2.67 � 10�10 m, and the numberof neighbors increases to 10.4 (Fig. 1). Between1.8 and 3% C, the nearest neighbor distanceremains constant, but the number of neighbors
increases to 11.2 atoms, which means that thepacking density is further increased. Amaximumpacking density is reached at 3% C, and itremains constant at higher carbon concentra-tions. At 3.5% C, the authors concluded thatshort-range-ordered regions rich in carbon existin the melt, but they were unable to establishtheir structure. Indeed, viscosity measurementssummarized in Fig. 2 (Ref 3) show a correlationbetween viscosity and percentage of carbon.The melts containing short-range-orderedregions show high viscosity values.Thus, liquid iron-carbon alloys with low
carbon content (<3.5% C, i.e., steels and castirons poor in carbon) are microscopically homo-geneous. Liquid iron-carbon alloys with highcarbon (>3.5% C, i.e., cast irons rich in carbon)are colloidal-dispersed systems with carbonclusters in liquid solution. The nature of the car-bon clusters is not clear. There are two hypoth-eses regarding their structure: they are Fe3Cmolecules, or they are Cn molecules.From thermodynamic considerations, Darken
(Ref 4) concluded that the existence of Fe3Cmolecules in iron-carbon melts is possible.Activity measurements also support short-rangeorder similar to Fe3C (Ref 5). Because thenucleation energy for Fe3C is smaller than thatfor graphite, it is thermodynamically possible
for the carbon-rich regions to exist as Fe3Cclusters.Other investigators consider the carbon clus-
ters to be stable in iron-carbon melts with morethan 2% C (Ref 6, 7). Their size is supposed tobe in the range of 1 to 20 nm, and it increaseswith the carbon equivalent, lower silicon con-tent, and lower holding time and temperature.According to Ref 2, these carbon clusters containapproximately 15 atoms (C15) with a stabilitytime interval of approximately 10�10 s. It is tobe expected that the carbon-rich clusters existingin molten iron-carbon alloys are in dynamicequilibrium and that they diffuse within the melt.
Fundamentals of Solidification ofCast Iron
Solidification processing is one of the oldestmanufacturing processes, because it is the prin-cipal component of metal casting processing.While solidification science evolved from theneed to better understand and further developcasting processes, solidification science today(2106) is at the base of many new develop-ments that fall out of the realm of traditionalmetal casting.Solidification is, strictly speaking, the trans-
formation of liquid matter into solid matter.The microstructure that results from solidifica-tion may be the final one, in which case itdirectly affects the mechanical properties ofthe product. In other cases, heat treatment orother processes may be used after solidificationto further modify the solidification microstruc-ture. However, the outcome of this additionalprocessing will be greatly affected by the solid-ification microstructure.
Length Scale of SolidificationStructures
The effect of solidification on the morphol-ogy of the matrix can be deconstructed at fourdifferent length scales (Ref 8) (Fig. 3):
ASM Handbook, Volume 1A, Cast Iron Science and TechnologyD.M. Stefanescu, editor
Copyright # 2017 ASM InternationalW
All rights reservedwww.asminternational.org
NeutronX-ray
Iron, mass%
Num
ber
of a
tom
s
949596979899
9
10
11
12
100
Fig. 1 Number of atoms in the first coordinationsphere obtained by neutron diffraction andx-ray. Source: Ref 2
rI
rI
NI
NIconst.
rI, NI const.
Short range orderedregions
4.54.03.53.02.52.01.51.00.54
0
5
6
7
8
9
10
4
5
6
7
8
9
10
Carbon concentration, wt% Vis
cosi
ty o
f iro
n-ca
rbon
allo
ys, c
P
Vis
cosi
ty o
f iro
n-ca
rbon
allo
ys, P
a · s
× 1
0–3
�, �
Fig. 2 Viscosity of iron-carbon alloys as a function ofcarbon concentration. Source: Ref 3
� The macroscale (macrostructure) is of theorder of 10�3 to 1 m. Elements of the macro-scale include shrinkage cavity, macrosegre-gation, cracks, surface roughness (finish),and casting dimensions. A typical exampleof a solidification macrostructure is given inFig. 4, after Boeri and Sikora (Ref 9), whichillustrates columnar grains growing inwardinto the cast iron rod.
� The mesoscale is of the order of 10�4 m. Itallows description of the microstructure fea-tures at the grain level, without resolving theintricacies of the grain structure. As seen inFig. 3, the solid/liquid (S/L) interface is notsharp. Three regions can be observed: liquid,mushy (containing both liquid and solidgrains), and solid. Mechanical propertiesare affected by the solidification structureat the mesoscale level, which is describedby features such as grain size and type
(columnar or equiaxed), the type and con-centration of chemical microsegregation,and the amount of microshrinkage, porosity,and inclusions. The term mesoscale has beenintroduced in solidification science to moreaccurately describe the results of computermodels. An example of a solidificationmesoscale structure is given in Fig. 5, afterMoore (Ref 10).
� The microscale (microstructure) is of theorder of 10�6 to 10�5 m. The microscaledescribes the complex morphology of thesolidification grain. In a sound casting,mechanical properties depend on the solidifi-cation structure at the microscale level. Toevaluate the influence of solidification onthe properties of the castings, it is necessaryto know the as-cast grain morphology(i.e., size and type, columnar or equiaxed)and the length scale of the microstructure
(interphase spacing, e.g., dendrite arm spacingand eutectic lamellar spacing). The termmicrostructure is the classic term used in met-allography to describe features observed underthe microscope, as seen in the micrographfrom Fig. 6, which shows graphite and pearlitein a gray iron.
� The nanoscale (atomic scale) is of the orderof 10�9 m (nanometers) and describes theatomic morphology of the S/L interface. Atthis scale, nucleation and growth kineticsof solidification are discussed in terms ofthe transfer of individual atoms from the liq-uid to the solid state. Features such as dislo-cations, atomic layers, and even individualatoms are observed with electronic micro-scopes. An example of graphite layers in aspheroidal graphite aggregate seen at nano-scale magnification is given in Fig. 7, afterPurdy and Audier (Ref 11).
As discussed in some detail in the followingsections, two basic phenomena must take placein the liquid for solidification to occur: under-cooling and nucleation. If these conditions aremet, the nuclei can grow into the new solidgrains.
Undercooling
Global equilibrium phase diagrams arefrequently used to understand alloy behaviorwhen the alloy is cooled from the liquid stateto room temperature. Global equilibrium requiresuniform chemical potentials and temperatureacross the system. Under such conditions, nochanges occur with time. When global equilib-rium exists, the fraction of phases can be calcu-lated with the lever rule, and the phase diagramgives the uniform composition of the liquid andsolid phases. Such conditions exist only whenthe solidification velocity is much smaller thanthe diffusion velocity. Uniform chemical poten-tials and temperature may truly appear only whensolidification takes place over geological times.
Macro Meso
Solid Mush Liquid
Micro Nano
Fig. 3 Solidification length scale. Source: Ref 8
Fig. 4 Macrostructure of 30 mm (1.2 in.) diameter barsshowing columnar grains (primary austenitedendrites). Source: Ref 9
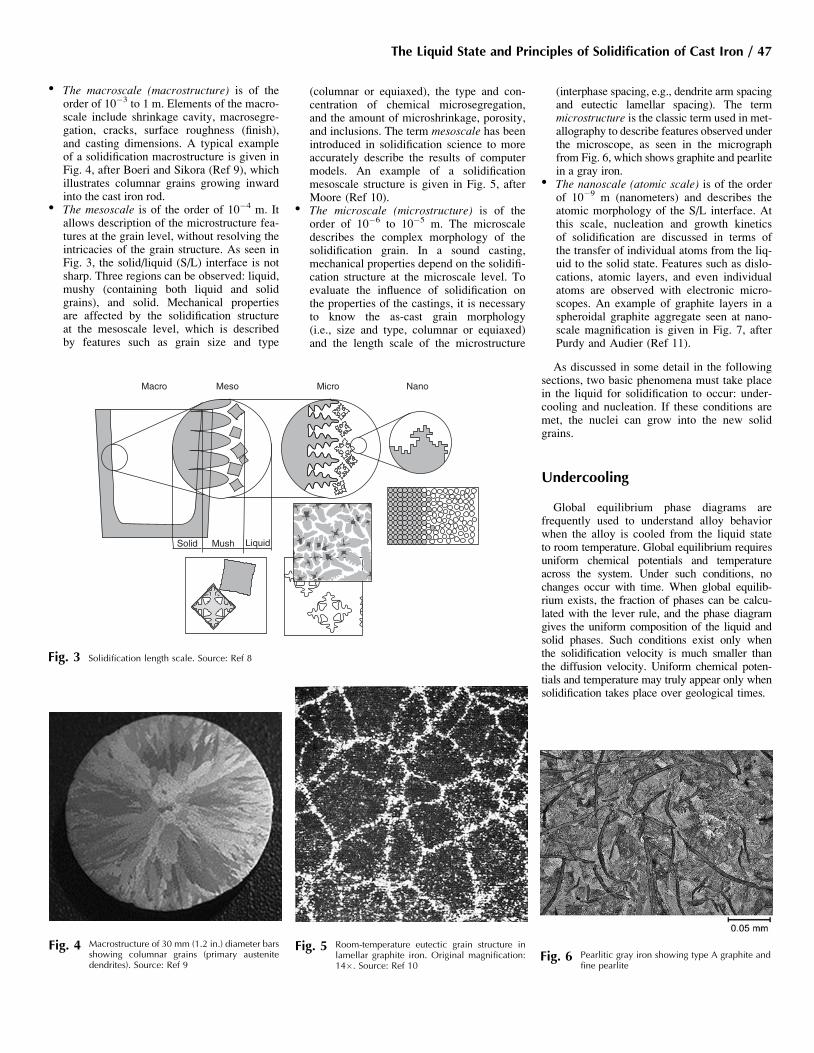
Fig. 5 Room-temperature eutectic grain structure inlamellar graphite iron. Original magnification:14�. Source: Ref 10
Fig. 6 Pearlitic gray iron showing type A graphite andfine pearlite
The Liquid State and Principles of Solidification of Cast Iron / 47

Solidification as encountered in commonprocesses does not occur at equilibrium, becauseduring solidification of most castings, both tem-perature and composition gradients exist acrossthe casting. Elementary thermodynamics demon-strates that a liquid cannot solidify unless someundercooling below the equilibrium (melting)temperature, Te, occurs. Five types of solidifica-tion undercooling have been identified: kineticundercooling, thermal undercooling, constitu-tional (solutal) undercooling, curvature under-cooling, and pressure undercooling.Nevertheless, in most cases, the overall solid-
ification kinetics can be described with suffi-cient accuracy by using the local equilibriumcondition, that is, by using the mass, energy,and species transport equations to express thetemperature and composition variation withineach phase and by using equilibrium phase dia-grams to evaluate the temperature and composi-tion of phase boundaries, such as the S/Linterface (corrections must be made for inter-face curvature). Most phase transformations,with the exception of massive (partitionless)and martensitic transformations, can bedescribed with the local equilibrium condition.When the stable phase cannot nucleate or growsufficiently fast (e.g., gray-to-white transition incast iron), metastable local equilibrium canoccur. For both stable and metastable localequilibria, the chemical potentials of the com-ponents across the interface must be equal forthe liquid and for the solid.However, at large undercooling, the solidifi-
cation velocity exceeds the diffusive speed ofsolute atoms in the liquid phase (rapid solidifi-cation). The solute is trapped into the solid atlevels exceeding the equilibrium solubility.Typically, for solute trapping, the solidificationvelocity must exceed 5 m/s (16 ft/s).Kinetic Undercooling. When a number of
simplifying assumptions are introduced (puremetal, constant pressure, no thermal gradient inthe liquid, and flat S/L interface—that is, theradius of curvature of the interface is r = 1),the only undercooling driving the S/L interface
is the kinetic undercooling. It is a nanoscalelength effect, resulting from the net differencein atoms transported from L to S and from Sto L. Typically for metals, the kinetic undercool-ing is very small, of the order of 0.01 to 0.05 K.When the simplifying assumptions are
relaxed to reflect typical solidification scenar-ios, the free energy of the liquid-solid systemupon the solidification of a discrete volume ofliquid, DFv, will increase by:
�Fv ¼ �GT þ�Gc þ�Gr þ�FP (Eq 1)
where F and G are the Helmholtz and Gibbsfree energy, respectively. The four right-handterms are the change in free energy because oftemperature, composition, curvature, and pres-sure variation, respectively. Solidification can-not occur unless each of these energies isbalanced by a corresponding undercooling ofthe system, as discussed in this section.Thermal Undercooling. If nucleation does
not occur, a pure metal can undercool underthe equilibrium temperature because of heatextraction. The liquid is said to be thermallyundercooled by a quantity:
�TT ¼ Te � T� (Eq 2)
where DTT is the thermal undercooling, Te is theequilibrium (melting) temperature of the inter-face, and T* is the S/L interface temperature.Constitutional (Solutal) Undercooling.
During alloy solidification, solute is rejectedby the solid. This can be understood from thephase diagram in Fig. 8. For a given tempera-ture, T*, the composition of the solid, CS, issmaller than that of the liquid, CL, in equilib-rium with the solid. The ratio k = CS/CL iscalled the partition coefficient. For the case inthe figure (where the equilibrium temperaturesdecrease with increased alloy composition),k < 1. The slope of the liquidus line is mL=dTL/dCL, where TL is the liquidus temperature.Because of solute rejection, a boundary layer,
richer in solute than the bulk liquid, is formedat the S/L interface. A direct consequence of this
phenomenon is that the liquidus temperature islower next to the interface than away from it(Fig. 9). The heat flow from the liquid to the solidimposes a thermal gradient, GT, which dictatesthe local temperature in the melt. If the thermalgradient is lower than the liquidus gradient, GL
(the tangent to TL at the S/L interface), which isthe case shown in Fig. 9, the temperature in theboundary layer will be lower than the equilib-rium liquidus temperature. Thus, a constitu-tionally undercooled region will result. Themagnitude of the local constitutional (solutal)undercooling can be calculated as a function ofthe local composition as:
Fig. 7 Transmission electron microscopy image of a fractured graphite spheroid showing crystallization sites(indicated by arrows) of amorphous graphite. Source: Ref 11
Fig. 8 Left corner of a phase diagram. T*, interfacetemperature; TS, solidus temperature; TL,
liquidus temperature; CS, composition of the solid; CSM,maximum solubility in the solid; CL, composition of theliquid; CE, eutectic composition
Fig. 9 Formation of a constitutionally undercooledregion (dashed area) in the liquid next to the
solid/liquid (S/L) interface because of the lower liquidustemperature produced by the higher solute content. C�
L,composition of the liquid; Co, bulk composition of thealloy at the beginning of solidification; GL, liquidus(solutal) temperature gradient; GT, thermal gradient inthe liquid; TL, liquidus temperature
48 / Fundamentals of the Metallurgy of Cast Iron

�Tc ¼ TL � T� ¼ �m ðC�L � CoÞ (Eq 3)
where DTc is the constitutional undercooling,C�L is the composition of the liquid, Co is the
bulk composition of the alloy at the beginningof solidification, and the other terms are as pre-viously defined.Curvature Undercooling. When a discrete
liquid volume becomes solid, the newly formedS/L interface produces an increase in the energyof the system through the interface energy asso-ciated with it. For solidification to continue,additional undercooling is required. This under-cooling is called the curvature undercooling.Because a smaller radius (higher curvature) ofthe solid results in a higher surface-to-volumeratio, higher curvature is associated with higherundercooling; thus:
�Tr ¼ Te � Tre ¼
g�Sf
K ¼ �K (Eq 4)
where DTr is the curvature undercooling, Tre is
the equilibrium temperature for a sphere ofradius r, g is the S/L interface energy, DSf isthe entropy of fusion, K = 1/r is the curvature,and G is the Gibbs-Thomson coefficient.
Pressure Undercooling. An increase in thepressure applied to the liquid, DP, will cause anincreased undercooling of the liquid, called pres-sure undercooling, DTP. It can be calculated as:
�TP ¼ �P ��v=�Sf (Eq 5)
where Dv is the change in volume. For metals,the pressure undercooling is rather small, ofthe order of 10�2 K/atm. Therefore, typicalpressure changes for usual processes have littleinfluence on the melting temperature, and thepressure undercooling is negligible.Undercooling is a basic condition required
for solidification. However, for solidificationto occur, nuclei must form in the liquid.
Nucleation
It is convenient to classify the types of nucleiavailable in the melt as resulting from homoge-neous nucleation, heterogeneous nucleation,and dynamic nucleation (Ref 8).
Homogeneous Nucleation. When growth isinitiated on substrates having the same chemistryas the solid, it is said that homogeneous nucle-ation has occurred. It is not common in castingalloys. However, it was demonstrated that, undercertain conditions, graphite can nucleate on car-bon-rich regions in the liquid iron that can beconsidered homogeneous nuclei (Ref 12).Heterogeneous nucleation is based on the
assumption that the development of the grainstructure occurs upon a family of substrates ofdifferent chemistry than that of the solid. Het-erogeneous nucleation occurs when substrateparticles are deliberately introduced into a meltto promote equiaxed grain formation. This iscommon practice in liquid processing of castiron because they are inoculated with speciallydesigned alloys.Heterogeneous nucleation is influenced by
the solid metal/solid nucleus interface energy.The value of this energy depends on the crystalstructure of the two phases. The interfacebetween two crystals can be coherent, semico-herent, or incoherent.Coherent interfaces may have slight devia-
tions in the interatomic spacing, which causeslattice deformation and induces a strain inthe lattice (Fig. 10). If the deviation in spacingis too large to be accommodated by strain, dis-locations may form in distorted areas. Theinterface is said to be semicoherent. If thereis no crystallographic matching between thetwo lattices, the structure changes abruptlyfrom one crystal to the other; the interface isincoherent.An efficient heterogeneous nucleant (inocu-
lant) should satisfy the following requirements:
� The substrate must be solid in the melt; itsmelting point must be higher than the melttemperature, and it must not dissolve in themelt.
� There must be a low contact angle betweenthe metal and nucleant particles or a highsurface energy between the liquid and thenucleant.
� The nucleant must expose a large area to theliquid; this can be achieved by producing afine dispersion of nucleant or by using anucleant with a rough surface geometry.
� Because the atoms are attaching to the solidlattice of the substrate, the closer the sub-strate lattice resembles that of the solidphase, the easier nucleation will be. Thismeans that, ideally, the crystal structure ofthe substrate and the solid phase should bethe same, and that their lattice parametersshould be similar (isomorphism). Theyshould have at least analogous crystallineplanes (epitaxy). Because the crystal struc-tures of the solidifying alloy and the sub-strate may be different, the substrate musthave one or more planes with atomicspacing and distribution close to that of oneof the planes of the solid to be nucleated(coherent or semicoherent interface), thatis, have a low linear disregistry, d (Ref 13):
d ¼ ðan � aSÞ=aS (Eq 6)
where an and aS are the interatomic spacingalong shared low-index crystal directions inthe nucleant and the solid nucleus, respectively.
� Low symmetry lattice (complex lattice) isdesirable. While it is impossible to assignnumbers to lattice symmetry, to some extentthe entropy of fusion can be used as a mea-sure of lattice symmetry. In general, lesssymmetrical lattices have higher entropiesof fusion.
� It should have the ability to nucleate at verylow undercooling.
Inoculation and Grain Refining. The nucle-ation concepts introduced in the precedingparagraphs are helpful in the understanding ofthe widely used inoculation processes of castiron. Inoculation is often used in cast iron pro-cessing to control the grain and graphite sizeand, to a lesser extent, graphite morphology.Typical inoculants for cast iron are based onferrosilicon or calcium silicide. Inoculationmust not be confused with modification. Modi-fication, typically obtained through magnesiumadditions to the melt, is a process related mostlyto graphite growth and morphology. The mainpurpose of inoculation is to promote grainrefinement and avoid metastable solidification(chill), while modification is used to changethe morphology of the eutectic aggregates.Bramfitt (Ref 14) argued that the Turnbull/
Vonnegut equation for linear disregistry(Eq 6) cannot be applied to crystallographiccombinations of two phases with planes of dif-fering atomic arrangements (e.g., cubic iron andhexagonal tungsten carbide). He modified theequation in terms of angular difference betweenthe crystallographic directions within the planeto produce the planar disregistry equation:
d hklð ÞShklð Þn ¼
X3
i¼1
duvw½ �i
Scosy
� ��d
uvw½ �in
������
duvw½ �in3
100 (Eq 7)
where (hkl)S is a low-index plane of the sub-strate, [uvw]S is a low-index direction in (hkl)S,(hkl)n is a low-index plane in the nucleated solid,Fig. 10 Coherent and semicoherent interfaces. Source: Ref 8
The Liquid State and Principles of Solidification of Cast Iron / 49
[uvw]n is a low-index direction in (hkl)n, is theinteratomic spacing along [uvw]n, d½uvw�
Sis
the interatomic spacing along [uvw]S, and yis the angle between [uvw]S and [uvw]n. Theeffect of selected carbide and nitride additionsto pure iron (99.95%) were then evaluated.Their effectiveness as nucleants was estimatedbased on the effect of the solidification under-cooling. A good nucleant produced a lowerundercooling. The main results are listed inTable 1 together with the planar disregistrybetween the nucleant and iron. It is observedthat the highly effective inoculants have lowdisregistry (<12). It must be noted that, forcubic metals, there was no difference betweenthe linear and planar disregistry. There is a par-abolic relationship between the critical under-cooling for nucleation and the disregistry:DTcr = 0.25 d2.The size distribution of the nucleant is critical
for heterogeneous nucleation. According to thefree-growth theory developed by Greer et al.(Ref 15), the larger particles are more potent forheterogeneous nucleation and become activefirst. Only a small fraction of the particlesbecome active before the onset of recalescence.A narrow size distribution of particles is moreefficient for heterogeneous nucleation.Another critical parameter for heterogeneous
nucleation is the wettability of the nucleant.The wetting problem can be solved practicallyby the formation of an intermediate phase thatwets the nucleant. Multistep nucleation mechan-isms have been proposed for lamellar and sphe-roidal graphite cast irons, as summarized inRef 8. Typical compositions of inoculants forcast iron are summarized in Table 2, after Elliott(Ref 16).
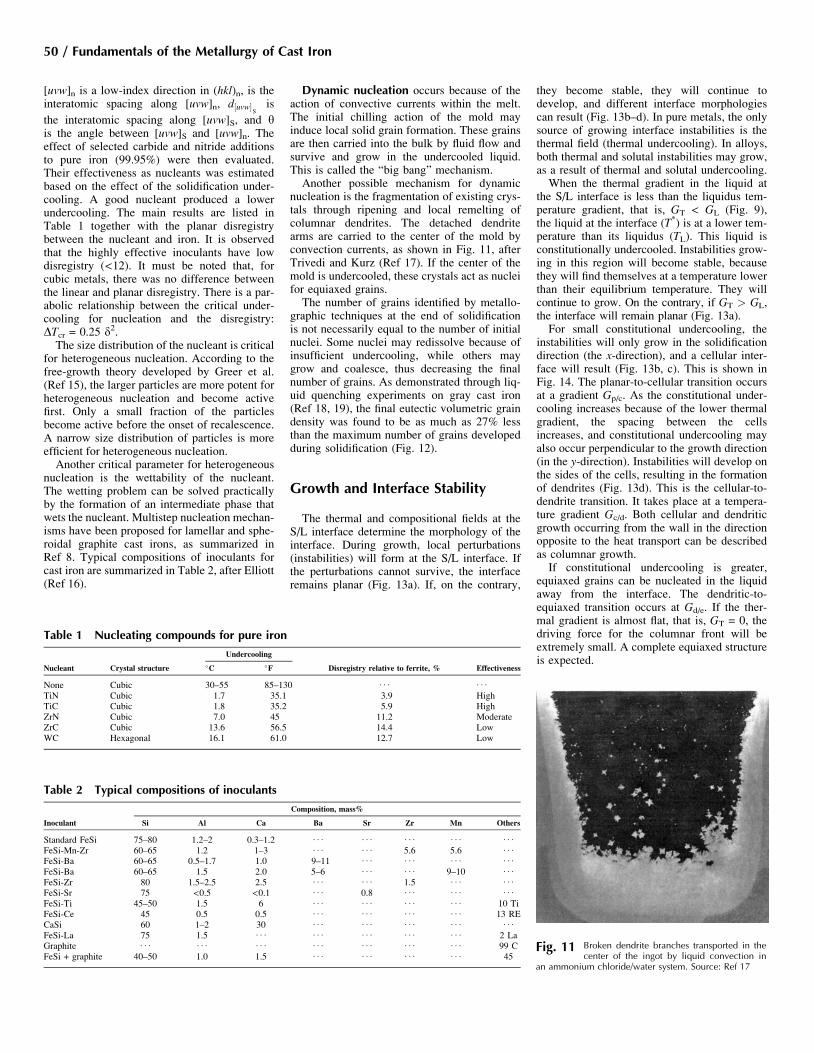
Dynamic nucleation occurs because of theaction of convective currents within the melt.The initial chilling action of the mold mayinduce local solid grain formation. These grainsare then carried into the bulk by fluid flow andsurvive and grow in the undercooled liquid.This is called the “big bang” mechanism.Another possible mechanism for dynamic
nucleation is the fragmentation of existing crys-tals through ripening and local remelting ofcolumnar dendrites. The detached dendritearms are carried to the center of the mold byconvection currents, as shown in Fig. 11, afterTrivedi and Kurz (Ref 17). If the center of themold is undercooled, these crystals act as nucleifor equiaxed grains.The number of grains identified by metallo-
graphic techniques at the end of solidificationis not necessarily equal to the number of initialnuclei. Some nuclei may redissolve because ofinsufficient undercooling, while others maygrow and coalesce, thus decreasing the finalnumber of grains. As demonstrated through liq-uid quenching experiments on gray cast iron(Ref 18, 19), the final eutectic volumetric graindensity was found to be as much as 27% lessthan the maximum number of grains developedduring solidification (Fig. 12).
Growth and Interface Stability
The thermal and compositional fields at theS/L interface determine the morphology of theinterface. During growth, local perturbations(instabilities) will form at the S/L interface. Ifthe perturbations cannot survive, the interfaceremains planar (Fig. 13a). If, on the contrary,
they become stable, they will continue todevelop, and different interface morphologiescan result (Fig. 13b–d). In pure metals, the onlysource of growing interface instabilities is thethermal field (thermal undercooling). In alloys,both thermal and solutal instabilities may grow,as a result of thermal and solutal undercooling.When the thermal gradient in the liquid at
the S/L interface is less than the liquidus tem-perature gradient, that is, GT < GL (Fig. 9),the liquid at the interface (T*) is at a lower tem-perature than its liquidus (TL). This liquid isconstitutionally undercooled. Instabilities grow-ing in this region will become stable, becausethey will find themselves at a temperature lowerthan their equilibrium temperature. They willcontinue to grow. On the contrary, if GT > GL,the interface will remain planar (Fig. 13a).For small constitutional undercooling, the
instabilities will only grow in the solidificationdirection (the x-direction), and a cellular inter-face will result (Fig. 13b, c). This is shown inFig. 14. The planar-to-cellular transition occursat a gradient Gp/c. As the constitutional under-cooling increases because of the lower thermalgradient, the spacing between the cellsincreases, and constitutional undercooling mayalso occur perpendicular to the growth direction(in the y-direction). Instabilities will develop onthe sides of the cells, resulting in the formationof dendrites (Fig. 13d). This is the cellular-to-dendrite transition. It takes place at a tempera-ture gradient Gc/d. Both cellular and dendriticgrowth occurring from the wall in the directionopposite to the heat transport can be describedas columnar growth.If constitutional undercooling is greater,
equiaxed grains can be nucleated in the liquidaway from the interface. The dendritic-to-equiaxed transition occurs at Gd/e. If the ther-mal gradient is almost flat, that is, GT = 0, thedriving force for the columnar front will beextremely small. A complete equiaxed structureis expected.
Table 2 Typical compositions of inoculants
Inoculant
Composition, mass%
Si Al Ca Ba Sr Zr Mn Others
Standard FeSi 75–80 1.2–2 0.3–1.2 . . . . . . . . . . . . . . .
FeSi-Mn-Zr 60–65 1.2 1–3 . . . . . . 5.6 5.6 . . .
FeSi-Ba 60–65 0.5–1.7 1.0 9–11 . . . . . . . . . . . .
FeSi-Ba 60–65 1.5 2.0 5–6 . . . . . . 9–10 . . .
FeSi-Zr 80 1.5–2.5 2.5 . . . . . . 1.5 . . . . . .
FeSi-Sr 75 <0.5 <0.1 . . . 0.8 . . . . . . . . .
FeSi-Ti 45–50 1.5 6 . . . . . . . . . . . . 10 TiFeSi-Ce 45 0.5 0.5 . . . . . . . . . . . . 13 RECaSi 60 1–2 30 . . . . . . . . . . . . . . .
FeSi-La 75 1.5 . . . . . . . . . . . . . . . 2 LaGraphite . . . . . . . . . . . . . . . . . . . . . 99 CFeSi + graphite 40–50 1.0 1.5 . . . . . . . . . . . . 45
Table 1 Nucleating compounds for pure iron
Nucleant Crystal structure
Undercooling
Disregistry relative to ferrite, % Effectiveness�C �F
None Cubic 30–55 85–130 . . . . . .
TiN Cubic 1.7 35.1 3.9 HighTiC Cubic 1.8 35.2 5.9 HighZrN Cubic 7.0 45 11.2 ModerateZrC Cubic 13.6 56.5 14.4 LowWC Hexagonal 16.1 61.0 12.7 Low
Fig. 11 Broken dendrite branches transported in thecenter of the ingot by liquid convection in
an ammonium chloride/water system. Source: Ref 17
50 / Fundamentals of the Metallurgy of Cast Iron

All the transitions described in the previousparagraph are controlled by the initial composi-tion of the alloy, by the solidification velocity(V), and by the thermal gradient. The planar-to-cellular transition during steady-state solidi-fication is governed by the criterion for theonset of constitutional undercooling given by:
GT
V<� mL Co 1� kð Þ
k DL
¼ �ToDL
(Eq 8)
where k is the partition coefficient, DL is theliquid diffusivity, and DTo is the temperaturedifference between the equilibrium liquidusand solidus of the alloy of composition Co. Ifsolidification is not at steady state, DTo is sub-stituted with the undercooling DT at whichsolidification occurs.
Solidification Structures ofSolid Solutions
The simplest liquid-to-solid transformation(solidification) of an alloy occurs when theliquid solution transforms into a solid solution(Fig. 15a). However, for many alloys, solidifi-cation may be completed by some other pro-cess, such as a eutectic (Fig. 15b), peritectic,or monotectic reaction. Because solidificationof hypoeutectic cast iron starts with the solid-ification of austenite dendrites, which aresolid solutions of carbon and other elementsin iron, the details of the solidification ofthe solid solution are important in determin-ing the final microstructure and thus theproperties.
As shown in Fig. 8, the liquid has a differentcomposition (CL) than the solid (CS) from whichit is forming (in the figure, CL > CS). Conse-quences of this phenomenon are the occurrenceof constitutional undercooling and segregation.Constitutional undercooling is instrumental in
destabilizing the S/L interface and promotinginterface morphologies different than planar. Asinferred by Eq 8, there is a critical solute content(Co) of the alloy for a given GT/V ratio combina-tion, at which the interface becomes unstable.This can be presented graphically as shown inFig. 16, where the line for Eq 8 indicates the pla-nar-to-cellular transition. As the GT/V ratio con-tinues to decrease (or Co to increase), the S/Linterface becomes increasingly unstable withsuccessive formation of a columnar dendriticand then equiaxed dendritic structure.
Fig. 12 Nucleation and coalescence of eutectic grains in cast iron. (a) Early solidification. (b) Late solidification. (c) After solidification (room temperature). Original magnification:20�. Source: Ref 18
Fig. 13 Change of morphology of the solid/liquid (S/L) interface as a function of growth velocity (V) in a transparent organic system (pivalic acid, 0.076% ethanol) directionallysolidified under a thermal gradient of 2.98 K/mm. (a) Planar interface, V = 0.2 mm/s. (b) Cellular interface, V = 1.0 mm/s. (c) Cellular interface, V = 3.0 mm/s. (d) Dendriticinterface, V = 7 mm/s. Same scale for all images. Source: Ref 17
The Liquid State and Principles of Solidification of Cast Iron / 51

The formation of the equiaxed dendritic struc-ture requires bulk nucleation. In the absence ofbulk nucleation, the columnar front will continueto grow.Planar Interfaces. Planar growth of alloys
can usually be achieved only in crystal growthfurnaces at high temperature gradients and lowsolidification velocities. For example, for planarsolidification of an alloy with DT = 5 K andGT = 100 K/cm, the maximum allowable solid-ification velocity calculated with Eq 8 is 2 mm/s.However, most commercial cast irons solidifywith nonplanar interfaces, because the solidifica-tion velocity is much higher.Cellular Structures. When constitutional
undercooling occurs, the S/L interface morphol-ogy becomes cellular or dendritic. For condi-tions of growth where the GT/V ratio is onlyslightly smaller than the ratio DT/DL, the
interface is cellular, as shown in Fig. 17(a) fora hypoeutectic iron, after Tian and Stefanescu(Ref 20).Dendritic Structures. The dendritic mor-
phology is the most commonly observed solidi-fication structure of solid solutions, includingaustenite in steel and cast iron. Examples ofdendrites observed in directionally solidifiedcast iron are presented in Fig. 17(b, c).Effect of Crystallographic Orientation. Den-
drites are single grains that have preferredgrowth directions. The morphology of a colum-nar dendrite is influenced by the orientation ofthe grain with respect to that of heat extraction,as shown in Fig. 18, where the heat-extractiondirection is upward (Ref 21).Influence of the Type of Phase Diagram. The
nature of the material as represented by the typeof phase diagram will also influence the den-dritic structures. If the phase diagram showscomplete solid solubility (Fig. 15a), the struc-ture will be single phase, containing only den-drites. If, as is the case for cast iron, the phasediagram contains a eutectic (Fig. 15b), theinterdendritic regions will be composed of the
two-phase eutectic. Figure 19, from Aguadoet al. (Ref 22), presents a low-magnificationmicrostructure of a hypoeutectic gray iron.The microstructure exhibits a large number ofaustenite dendrites with interdendritic austen-ite-graphite eutectic.Effect of Constitutional Undercooling. As
shown in Fig. 16, as the amount of soluteincreases, or as the GT/V ratio decreases, a cel-lular-to-dendritic solidification occurs. This isbecause the constitutional undercooling islarge. Such a transition is not common in castiron, because the solidification conditions areconducive to mostly dendritic structures.Figure 14 indicates that for rather steep ther-
mal gradients, columnar dendrites will form,while for shallow gradients, equiaxed dendritewill solidify. In a continuously cooled casting,the decrease in the GT/V ratio may produce acolumnar-to-equiaxed transition, as seen inFig. 4 for a gray iron bar.Effect of Solidification Velocity. As empha-
sized previously, solidification velocity is,together with the temperature gradient, the mostimportant variable affecting microstructuretransitions. The change in solidification veloc-ity may determine a planar S/L interface tobecome cellular and then dendritic. In addition,the morphology of the equiaxed dendrites(branching and tip radius) depends significantlyon the cooling rate and/or undercooling. Theeffect of solidification velocity over a widerange of velocities can be understood fromFig. 20. At very small velocities, the dendritetip radius is very large, even infinity, in whichcase a planar interface is obtained. As thevelocity increases, the radius decreases, andthe morphology changes from planar to globu-lar/cellular, then to regular equiaxed dendritic.Further increase in solidification velocity inthe range of rapid solidification determines atransition from fully branched to globular/cellu-lar dendrites and finally again to planar inter-face (absolute stability). A typical exampleillustrating the influence of cooling rate onthe morphology of equiaxed dendrites of anAl-7Si alloy is given in Fig. 21 (Ref 23).
Planar
X
T Gp/c
Gc/d Gd/e
TL
Cellular
Dendritic
Equiaxed
Fig. 14 Correlation between the thermal gradient atthe interface and the interface morphology.Source: Ref 8
Fig. 15 Binary phase diagrams. (a) Complete solid solubility. (b) Partial solid solubility with eutectic reaction. L,liquid solution; a and b, solid solutions
Fig. 16 Transition to different interface morphologiesas a function of the temperature gradient/
solidification velocity ratio (GT/V) and soluteconcentration (Co)
52 / Fundamentals of the Metallurgy of Cast Iron

The solidification time scale also influencesthe secondary dendrite arm spacing (SDAS).The SDAS is the distance between adjacentbranches growing from the main dendriticarm. It is directly related to certain mechanicalproperties. It is generally accepted that theSDAS is a function of the local solidificationtime, tf, described by:
SDAS ¼ mo � t1=3f (Eq 9)
where mo is a material-specific constant (coars-ening constant). Extensive experimental dataon secondary arm spacing have also beenreported to fit a SDAS cooling-rate equation(Ref 24):
SDAS ¼ m1 � ð _TÞ�0:340:02(Eq 10)
where m1 is a material-specific constant, and _Tis the cooling rate.Solute Redistribution and Microsegrega-
tion in Dendritic Solidification. Rejection ofsolute from the solid during solidification that isresponsible for the formation of the solutalboundary layer (Fig. 9) produces compositionalnonuniformity across the dendrite during solidi-fication, called microsegregation. To understandthe mechanism of formation of microsegrega-tion, consider the volume element extendingfrom the axis of the dendrite arm to the edge ofthe final dendrite (at the end of solidification)shown in Fig. 22. The thick line in the lower partof the figure represents the composition changein the solid during solidification. At the begin-ning of solidification, when there is no solid
formed, the fraction solid is fS = 0. The first solidto form will have the composition kCo < Co.Assuming no diffusion in the solid and the liquidis of uniform composition, the amount of solutein the solid will continue to increase as solidifica-tion progresses. The composition of the solid willsoon be higher than Co; then it will reach themaximum solubility in solid, CSM, and then theeutectic composition, CE, according to the phasediagram in Fig. 8. The liquid still available willnow solidify as eutectic. The composition of thesolid (the thick line in Fig. ) as well as the amountof eutectic at the end of solidification, fE, can becalculated with the Gulliver-Scheil equation:
CS ¼ kCoð1� fSÞk�1(Eq 11)
Using this approach, it can be calculated thatfor a 3.5% C iron-carbon alloy, the first solid toform (the centers of dendrites) will have a compo-sition of 1.75%C (at fS= 0.01) and that the compo-sition will increase to CSM = 2.14% C whenfS = 0.335. The remaining fraction of the alloy(1� 0.335 = 0.665) solidifies as an interdendritic
Fig. 17 Interface morphology at decanted solid/liquidinterface in a Fe-3.08%C-2.01%Si alloy (GT=
50 K/cm). (a) Austenite cell. (b) Array of austenitedendrites. (c) Paraboloid-shaped austenite dendrite tip.Source: Ref 20
Fig. 19 Low-magnification micrograph of a hypoeutec-tic gray iron (3.26 carbon equivalent). Source:Ref 22
Rapidsolidification
PlanarPlanar
Equiaxed
AbsolutestabilityGlobular/
cellular
Solidification velocity
Den
drite
tip
radi
us
Fig. 20 Correlation between solidification velocityand dendrite tip radius. Source: Ref 8
[100]
[001]
[111]
50 µm 100 µm
]
[111]
Fig. 18 Effect of crystalline anisotropy on interface shape in directional growth (growth velocity of 35 mm/s) ofdirectional-solidification growth patterns in thin films of the CBr4-8mol%C2Cl6 alloy. Source: Ref 21
The Liquid State and Principles of Solidification of Cast Iron / 53

eutectic with an average composition of 4.3% C.The predictions of the Gulliver-Scheil equationshould be used carefully. Generally, the equationtends to underestimate slightly the compositionat the center of a dendrite and to overestimatethe volume fraction of eutectic (for k < 1). Also,if extensive fluid flow exists through the dendriticor “mushy” zone, the average composition of thesolidified castings may be significantly altered inregions that are large compared to the dendritescale. This is called macrosegregation. Detailsregarding this subject and the field of solidifica-tion can be found in Ref 8.Rapid Solidification. The microstructural
length scale of solidified alloys generallydecreases as the rate of heat extraction (coolingrate) increases. The term rapid solidification isnormally applied to casting processes in whichthe liquid cooling rate exceeds 100 K/s (Ref 25).This definition is rather vague because differentalloys respond very differently to high rates ofcooling. Also, some microstructures observed in
rapidly solidified alloys can be achieved by slowcooling when large liquid undercooling isachieved prior to nucleation (Ref 26).Techniques usually used to produce rapidly
solidified alloys are melt spinning, planar flowcasting, or melt extraction, which produce thin(~25 to 100 mm) ribbon, tape, sheet, or fiber;atomization, which produces powder (~10 to200 mm); and surface melting and resolidifica-tion, which produce thin surface layers. Thesemethods may be considered casting techniqueswhere at least one physical dimension of the finalproduct is small. Consolidation is used to yieldlarge products from rapidly solidified alloys(for example, through additive manufacturingtechniques). This consolidation often alters thesolidification microstructure in final products.However, as with ordinary castings, many fea-tures of the solidification structure can remainin the final product (Ref 25).The effect of high cooling rates on the den-
drite morphology can be understood fromFig. 20. It is seen that as the cooling rateincreases in the rapid-solidification range, thetip radius increases. This also means thatbranching decreases and the equiaxed dendritewill become globular/cellular. However, thesetypes of structures are not found in commercialcast iron, because high cooling rates will beconducive to metastable solidification and thuscarbide structures.
Solidification Structuresof Eutectics
Eutectics are alloys that have a fixed compo-sition in terms of species A and B and solidifyas two-phase solids (a + b). The phase diagramin Fig. 15(b) shows a binary eutectic invariantpoint at temperature TE and composition CE.At this point, two solid phases, a and b, solidifysimultaneously from the liquid, L. The eutecticreaction can be written as: L ! a + b. As manyas four phases have been observed to growsimultaneously from the melt. However, mosttechnologically useful eutectic alloys consistof two phases. The particular morphology ofthe eutectic is a function of processing condi-tions and of the nature of the two phases.
Classification of Eutectics. Many eutecticclassifications have been proposed, based ondifferent criteria. A first classification of eutec-tics based on their growth mechanism is:
� Cooperative growth: The two phases of theeutectic grow together as a diffusion couple.
� Divorced growth: The two phases of theeutectic grow separately; there is no directexchange of solute between the two solidphases and no trijunction.
Cooperative eutectics can be further classi-fied based on the ratio between the fractionsof the two phases of the eutectic, fa and fb,and on the morphology of the S/L interface(Ref 27), as shown in Fig. 23. The nondimen-sional entropy of fusion, DSf/R, where R is thegas constant, is used to distinguish between fac-eted and nonfaceted morphologies.Alloys such as lead-tin and Al-Al2Cu, where
there are approximately equal volume fractionsof nonfaceted phases, solidify as regular, lamel-lar eutectics. If one of the phases is nonfaceted,the morphology becomes irregular, because thefaceted phase grows preferentially in a direc-tion determined by specific atomic planes. Thisis the case of lamellar graphite iron, where aus-tenite is nonfaceted and graphite is faceted. Inthis case, one solid phase may project into theliquid far in advance of the other solid phase.When the volume fraction of one phase is
significantly lower than that of the other (typi-cally < 0.28), a fibrous structure will result(for example, the Ni-NbC eutectic). This is aresult of the tendency of the system to mini-mize its interfacial energy by selecting the mor-phology that is associated with the smallestinterfacial area. Fibers have smaller interfacialarea than lamellae. However, when the minorphase is faceted, a lamellar structure may formeven at a very low volume fraction, becausespecific planes may have the lowest interfacialenergy. The minor phase will then grow suchas to expose these planes even when lamellaerather than fibers are formed. The two commer-cially most significant eutectics, aluminum-sili-con and iron-graphite, fall into this category.Note that in the iron-graphite eutectic, the frac-tion graphite is fGr = 0.07. The iron-graphiteeutectic can be either cooperative, irregular, as
Fig. 21 Microstructures of an Al-7Si alloy at various cooling rates. (a) 0.3 �C/s (0.5 �F/s). (b) 3 �C/s (5 �F/s). (c) 10 �C/s (18 �F/s). (d) 30 �C/s (54 �F/s). Source: Ref 23
Edge offinal dendrite
VolumeelementSolid
Liquid
CE
CSM
Co
fS = 0
fE
fS = 1
kCo
Fig. 22 Model of microsegregation occurring in thearm of a growing dendrite. CE, eutectic
composition; CSM, maximum solubility in solid; fs, solidfraction; fE, amount of eutectic critical; Co, initialcomposition of the alloy (bulk composition) at thebeginning of solidification; k, partition coefficient; kCo,composition of the first amount of solid to form
54 / Fundamentals of the Metallurgy of Cast Iron
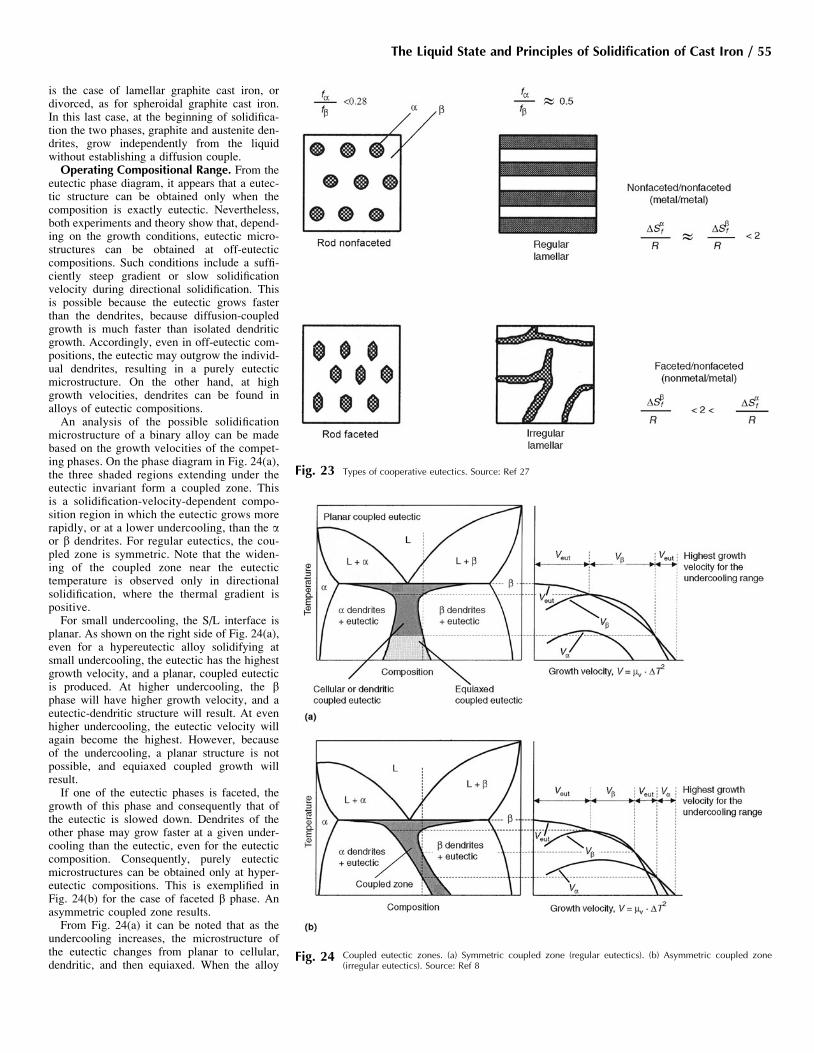
is the case of lamellar graphite cast iron, ordivorced, as for spheroidal graphite cast iron.In this last case, at the beginning of solidifica-tion the two phases, graphite and austenite den-drites, grow independently from the liquidwithout establishing a diffusion couple.Operating Compositional Range. From the
eutectic phase diagram, it appears that a eutec-tic structure can be obtained only when thecomposition is exactly eutectic. Nevertheless,both experiments and theory show that, depend-ing on the growth conditions, eutectic micro-structures can be obtained at off-eutecticcompositions. Such conditions include a suffi-ciently steep gradient or slow solidificationvelocity during directional solidification. Thisis possible because the eutectic grows fasterthan the dendrites, because diffusion-coupledgrowth is much faster than isolated dendriticgrowth. Accordingly, even in off-eutectic com-positions, the eutectic may outgrow the individ-ual dendrites, resulting in a purely eutecticmicrostructure. On the other hand, at highgrowth velocities, dendrites can be found inalloys of eutectic compositions.An analysis of the possible solidification
microstructure of a binary alloy can be madebased on the growth velocities of the compet-ing phases. On the phase diagram in Fig. 24(a),the three shaded regions extending under theeutectic invariant form a coupled zone. Thisis a solidification-velocity-dependent compo-sition region in which the eutectic grows morerapidly, or at a lower undercooling, than the aor b dendrites. For regular eutectics, the cou-pled zone is symmetric. Note that the widen-ing of the coupled zone near the eutectictemperature is observed only in directionalsolidification, where the thermal gradient ispositive.For small undercooling, the S/L interface is
planar. As shown on the right side of Fig. 24(a),even for a hypereutectic alloy solidifying atsmall undercooling, the eutectic has the highestgrowth velocity, and a planar, coupled eutecticis produced. At higher undercooling, the bphase will have higher growth velocity, and aeutectic-dendritic structure will result. At evenhigher undercooling, the eutectic velocity willagain become the highest. However, becauseof the undercooling, a planar structure is notpossible, and equiaxed coupled growth willresult.If one of the eutectic phases is faceted, the
growth of this phase and consequently that ofthe eutectic is slowed down. Dendrites of theother phase may grow faster at a given under-cooling than the eutectic, even for the eutecticcomposition. Consequently, purely eutecticmicrostructures can be obtained only at hyper-eutectic compositions. This is exemplified inFig. 24(b) for the case of faceted b phase. Anasymmetric coupled zone results.From Fig. 24(a) it can be noted that as the
undercooling increases, the microstructure ofthe eutectic changes from planar to cellular,dendritic, and then equiaxed. When the alloy
Fig. 23 Types of cooperative eutectics. Source: Ref 27
Fig. 24 Coupled eutectic zones. (a) Symmetric coupled zone (regular eutectics). (b) Asymmetric coupled zone(irregular eutectics). Source: Ref 8
The Liquid State and Principles of Solidification of Cast Iron / 55

solidifies with a cellular rather than a planarinterface, eutectic colonies are formed.If the undercooling is high, equiaxed eutectic
grains may form even during directional solidi-fication. A typical example is given in Fig. 12(c) for a gray cast iron. The boundaries of thegrains are outlined because of the segregationof phosphorus and the formation of a low-melt-ing-point phosphide eutectic.Caution must be exercised during metallo-
graphic analysis of eutectic microstructures.Serial sectioning, phase-extraction techniques,and examination of two sections meeting at acommon edge have revealed that the microstruc-tures of most eutectics cannot be consideredaggregates of many simply-shaped, discrete par-ticles of one phase embedded in a matrix of theother phase or phases. Rather, if the three-dimen-sional shapes of all phases are examined, theapparently individual particles of each phaseare typically found interconnected in a topologi-cally complex arrangement. This is the case forcompacted graphite iron.Length Scale of Eutectics. The length scale
of the eutectic strongly affects the mechanicaland physical properties of the eutectic aggregate.For cooperative eutectics, the length scale isgiven by the lamellar spacing (interlamellar orinterfiber) spacing, which is affected by solidifi-cation velocity, thermal gradients, undercooling,atomic bonding, relative amounts, crystallo-graphic factors, interfacial energies, impuritycontent, and alloy composition. The lamellarspacing, l, and the solidification velocity arerelated by the simple equation l2V = constant.The effect of solidification velocity is illustratedin Fig. 25. It is seen that the spacing of irregulareutectics is significantly larger than that of regu-lar eutectics.The adjustment in the eutectic spacing during
growth occurs through faults. Two types of faultsare shown in Fig. 26. Figure 26(a) shows a no-netfault in which the number of lamellae on bothsides of the fault is the same. Figure 26(b) showsa net fault in which one side of the fault has onemore lamellae than the other side. This fault isanalogous to an extended dislocation in that thenumber of lamellae above and below the faultdiffer by one (Ref 28).
For equiaxed eutectics, the length scalemay include grain size in addition to lamellarspacing. Metallographic identification of thegrain size is alloy specific.
Solidification Structures ofPeritectics
Peritectic solidification is very common in thesolidification of metallic alloys. Many technicallyimportant alloy systems, such as steels, copperalloys, and rare-earth permanent magnets, displayperitectic reactions in the regions of their phasediagrams where phase and microstructure selec-tion play an important role for the processingand the properties of the material. Basically,peritectic solidificationmeans that at the peritectictemperature, TP, a solid phase g of peritectic com-position, CP, solidifies from a mixture of liquid,L, and solid phase d. The peritectic solidificationcan be written as L + d ! g. A phase diagram
with peritectic solidification is presented inFig. 27. The different reactions occurring alongthe solidus lines, corresponding to various compo-sitions, produce three structural regions: d + g, g,and L + g.
Two different mechanisms are involved inperitectic solidification: peritectic reaction andperitectic transformation. These mechanismsare shown in Fig. 28. In a peritectic reaction,all three phases (d, g, and liquid) are in contactwith each other. In the peritectic transforma-tion, the liquid and the primary d phase areisolated by the g phase. The transformationtakes place by long-range diffusion throughthe secondary g phase. A variety of microstruc-tures can result from peritectic solidification,mostly depending on the GT/V ratio and nucle-ation conditions. The possible structuresinclude cellular, plane-front, bands, and eutec-tic-like structures.Simultaneous growth of two phases in the
form of oriented fibers and lamellae has been
0.11
2
5
10
20
50
1004 40
40
400
Eutectoids
Regular eutectics
Irregular eutectics 400
40004000
4 × 10⁴
1Solidification velocity (V ), mm/s
Spa
cing
(l)
, mm
Spa
cing
(l)
, min
.
Solidification velocity (V ), µin./s
10 102 103
Fig. 25 Comparisonof thelamellar spacing/solidificationvelocity correlation for eutectics and eutectoids.Source: Ref 8
Fig. 26 Cross sections of a directionally solidified lead-cadmium eutectic showing the presence of faults in thelamellae. (a) No-net fault. (b) Net fault. Etchant not reported. Source: Ref 28
Two phase
0.08
1400
2802
2728
2550
1498
LL + δ
L + γ
γ
γ
TMγ
TMδ = 1539
Team
pera
ture
, °C
Team
pera
ture
, °F
0.16 0.53Carbon, %
Single phase
δ + γ
δ
Fig. 27 Schematic phase diagram of the peritectic region of carbon steel. Source: Ref 8
56 / Fundamentals of the Metallurgy of Cast Iron

observed in some peritectic alloys when thecomposition was on the tie-line of the two solidphases and the GT/V ratio was close to the limitof constitutional undercooling for the stablephase having the smaller distribution coefficient(Ref 29). Figure 29 shows such a structure foran iron-nickel alloy.Fluid flow can further complicate the possi-
ble microstructures. While peritectic reactionsare typical for cast steel, they do not occur incast iron, because the carbon content is alwaysabove the higher limit (0.53%) of the peritecticsolidus.
ACKNOWLEDGMENT
This article was adapted from Doru M. Stefa-nescu and Roxana Ruxanda, Fundamentals of
Solidification, Metallography and Microstruc-tures, Volume 9, ASM Handbook, AmericanSociety for Metals, 1985, p 71–92.
REFERENCES
1. M.V. Volostchenko, On the State of Graph-ite in Liquid Iron, Liteinoe Proizvod.,No. 2, 1976, p 5–7
2. S. Steeb and U. Maier, in The Metallurgyof Cast Iron, B. Lux, I. Minkoff, and F.Mollard, Ed., Georgi Publishing, St.Saphorin, Switzerland, 1974, p 1–11
3. W. Krieger and H. Trenkler, Arch. Eisenh€ut-tenwes., Vol 42 (No. 3), 1971, p 175
4. L.S. Darken, “Equilibria in Liquid Ironwith Carbon and Silicon,” Tech. Pub.1163, AIME Metals Technology, 1940, p 1
5. E. Schurmann, private communicationquoted in Ref 1
6. A.A. Vertman and A.M. Samarin, Dokl.Akad. Nauk SSSR, Vol 134 (No. 3), 1960,p 629
7. A.A. Vertman and A.M. Samarin, LiteinoeProizvod., No. 10, 1964
8. D.M. Stefanescu, Science and Engineeringof Casting Solidification, 3rd ed., Springer,2015
9. R.E. Boeri and J.A. Sikora, Int. J. CastMet. Res., Vol 13 (No. 5), 2001, p 307–313
10. J.C. Moore, in Metallography, Structuresand Phase Diagrams, Vol 8, Metals Hand-book, 8th ed., American Society for Metals,Metals Park, OH, 1973, p 93
11. G.R. Purdy and M. Audier, Electron Micro-scopical Observations of Graphite in CastIrons, The Physical Metallurgy of CastIron, H. Fredriksson and M. Hillert, Ed.,Materials Research Society Symposia Proc.(Stockholm), North-Holland, New York,1985, p 13–23
12. D.M. Stefanescu, G. Alonso, P. Larranaga,and R. Suarez, On the Stable Eutectic Solidi-fication of Iron-Carbon-Silicon Alloys, ActaMater., Vol 103, 2016, p 103–114
13. D. Turnbull and R. Vonnegut, Ind. Eng.Chem., Vol 44, 1952, p 1292
14. B. Bramfitt, Metall. Trans., Vol 1, 1970,p 1987–1995
15. A.L. Greer, A.M. Bunn, A. Tronche, P.V.Evans, and D.J. Bristow, Acta Mater.,Vol 48, 2000, p 2823
16. R. Elliott, Cast Iron Technology, Butter-worths, London, 1988
17. R. Trivedi and W. Kurz, Solidification ofSingle-Phase Alloys, Casting, Vol 15,ASM Handbook, D.M. Stefanescu, Ed.,ASM International, 1988, p 114
18. H. Tian, Ph.D. dissertation, University ofAlabama, Tuscaloosa, 1992
19. H. Tian and D.M. Stefanescu, Experimen-tal Evaluation of Some SolidificationKinetics-Related Material ParametersRequired in Modeling of Solidification ofFe-C-Si Alloys, Modeling of Casting,Welding and Advanced Solidification Pro-cesses-VI, T.S. Piwonka, V. Voller, and L.Katgerman, Ed., TMS, Warrendale, PA,1993, p 639
20. H. Tian and D.M. Stefanescu, DendriticGrowth during Directional Solidificationof Hypoeutectic Fe-C-Si Alloys, Metall.Trans. A, Vol 23, 1992, p 681–687
21. S. Akamatsu, G. Faivre, and T. Ihle, Phys.Rev. E, Vol 51, 1995, p 4751–4773
22. E. Aguado, D.M. Stefanescu, J. Sertucha,P. Larranaga, and R. Suarez, Effect ofCarbon Equivalent and Alloying Elementson the Tensile Properties of SuperfineInterdendritic Graphite Irons, Trans. AFS,Vol 122, 2014, p 249–258
23. C.P. Hong and M.F. Zhu, in The Science ofCasting and Solidification, D.M. Stefanescu,
Fig. 29 Quenched solid/liquid interface of simultaneous two-phase growth in peritectic iron-nickel alloy. Source:Ref 29
Fig. 28 Mechanisms of peritectic solidification. Source: Ref 8
The Liquid State and Principles of Solidification of Cast Iron / 57

R. Ruxanda, M. Tierean, and C. Serban,Ed., Editura Lux Libris, Brasov, Romania,2001, p 110–118
24. D. Bouchard and J.S. Kirkaldy, Metall.Mater. Trans. B, Vol 28, 1997, p 651
25. W.J. Boettinger, Metall. Mater. Trans.,Vol 5, 1974, p 2026
26. J.H. Perepezko and J.J. Paike, in RapidlySolidified Amorphous and CrystallineAlloys, B.H. Kear, B.C. Giessen, and M.Cohen, Ed., North-Holland, 1982, p 49
27. W. Kurz and D.J. Fisher, Fundamentals ofSolidification, 3rd ed., Trans Tech Publica-tions, Switzerland, 1989
28. R. Trivedi, J.T. Mason, J.D. Verhoeven,and W. Kurz, Metall. Mater. Trans. A,Vol 22, 1991, p 2523–2533
29. M. Vandyoussefi, H.W. Kerr, and W.Kurz, Acta Mater., Vol 48, 2000,p 2297–2306
58 / Fundamentals of the Metallurgy of Cast Iron