The Life Cycle Energy Consumption and Greenhouse Gas ... · management system. ... Report U The...
58
No. C 243 May 2017 The Life Cycle Energy Consumption and Greenhouse Gas Emissions from Lithium-Ion Batteries A Study with Focus on Current Technology and Batteries for light-duty vehicles Mia Romare, Lisbeth Dahllöf
-
Upload
doannguyet -
Category
Documents
-
view
218 -
download
0
Transcript of The Life Cycle Energy Consumption and Greenhouse Gas ... · management system. ... Report U The...
No. C 243 May 2017
The Life Cycle Energy Consumption and Greenhouse Gas Emissions from Lithium-Ion Batteries
A Study with Focus on Current Technology and Batteries for light-duty vehicles
Mia Romare, Lisbeth Dahllöf

Author: Mia Romare, Lisbeth Dahllöf, IVL Swedish Environmental Research Institute Funded by: Swedish Energy Agency, Swedish Transport Administration Report number C 243 ISBN 978-91-88319-60-9 Edition Only available as PDF for individual printing © IVL Swedish Environmental Research Institute 2017 IVL Swedish Environmental Research Institute Ltd. P.O Box 210 60, S-100 31 Stockholm, Sweden Phone +46-(0)10-7886500 // Fax +46-(0)10-7886590 // www.ivl.se This report has been reviewed and approved in accordance with IVL's audited and approved management system.

Preface The Swedish Energy Agency and the Swedish Transport Administration have financed this study by IVL Swedish Environmental Research Institute Ltd but makes no representation or warranty, express or implied, in respect to the publication’s contents (including its completeness or accuracy) and shall not be responsible for any use of, or reliance on, the publication.

Report U The Life Cycle Energy Consumption and Greenhouse Gas Emissions from Lithium-Ion Batteries – A Study with Focus on Current Technology and Batteries for Light-duty Vehicles
iii
Summary This report presents the findings from the Swedish Energy Agency and the Swedish Transport Administration commissioned study on the Life Cycle energy consumption and greenhouse gas emissions from lithium-ion batteries. It does not include the use phase of the batteries.
The study consists of a review of available life cycle assessments on lithium-ion batteries for light-duty vehicles, and the results from the review are used to draw conclusions on how the production stage impacts the greenhouse gas emissions. The report also focuses on the emissions from each individual stage of the battery production, including; mining, material refining, refining to battery grade, and assembly of components and battery.
The report is largely structured based on a number of questions. The questions are divided in two parts, one focusing on short-term questions and the second on more long-term questions. To sum up the results of this review of life cycle assessments of lithium-ion batteries we used the questions as base.
Part 1 – Review the iteratively specified chemistries and answer the following short-term questions related to the battery production
a) How large are the energy use and greenhouse emissions related to the production of lithium-ion batteries? The results from different assessments vary due to a number of factors including battery design, inventory data, modelling and manufacturing. Based on our review greenhouse gas emissions of 150-200 kg CO2-eq/kWh battery looks to correspond to the greenhouse gas burden of current battery production. Energy use for battery manufacturing with current technology is about 350 – 650 MJ/kWh battery.
b) How large are the greenhouse gas emissions related to different production steps including mining, processing and assembly/manufacturing? Mining and refining seem to contribute a relatively small amount to the current life cycle of the battery. It is nearly independent of the cell chemistry NMC, LFP or LMO calculated per kWh capacity. The largest part of the emissions, around 50%, is currently from battery (including cell) manufacturing, but if the material processing to battery grade is viewed as one total it is in the same order of magnitude. The reviewed studies vary when it comes to the line between these areas and transparency is lacking. When it comes to battery components, the electrodes look to be the dominating contributors. Most of the other components vary in impact between studies, but electronics seem to have a high impact as well.
c) What differences are there in greenhouse gas emissions between different production locations? This review shows that assuming the current level of emissions from manufacturing, the electricity mix of the production location greatly impacts the total result. This is due to the fact that the manufacturing is a large part of the life cycle, and that most of the production energy is electricity. Since production location currently is based on labor cost it can be important to promote a choice based on environmental factors as well. Legislation can be one way to ensure this by giving incentive to choose production location or electricity type based on environmental factors.
Report U The Life Cycle Energy Consumption and Greenhouse Gas Emissions from Lithium-Ion Batteries – A Study with Focus on Current Technology and Batteries for Light-duty Vehicles
iv
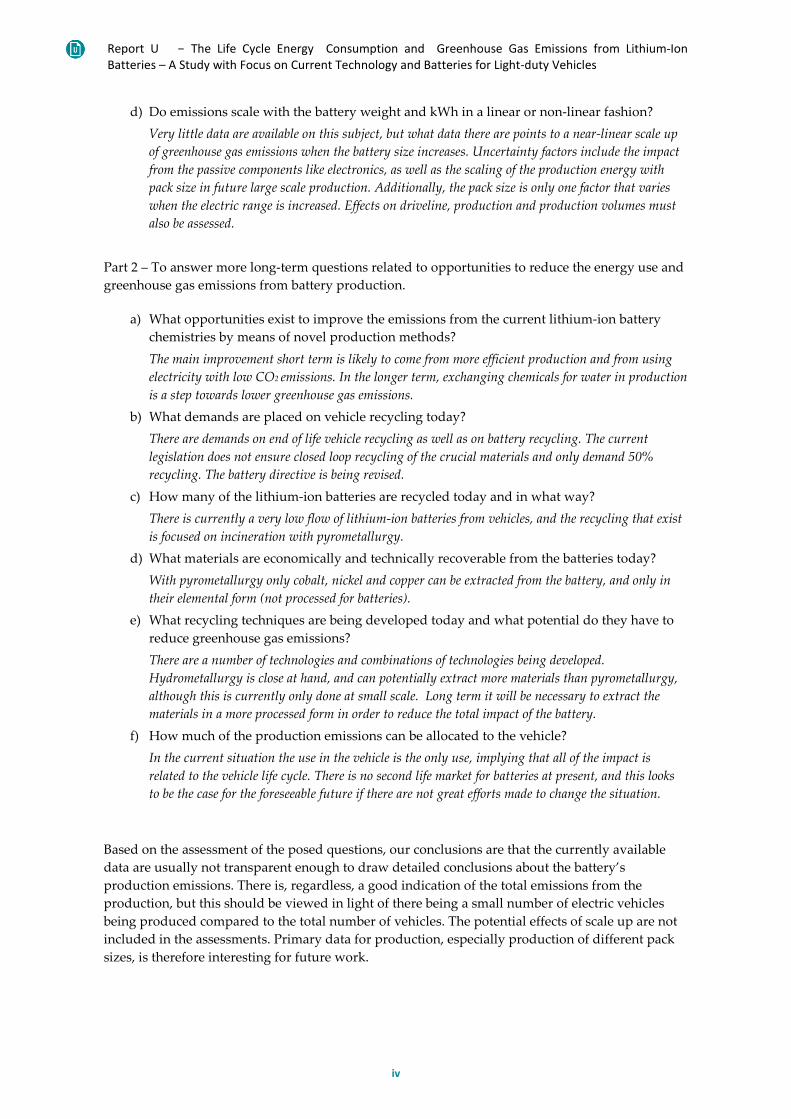
d) Do emissions scale with the battery weight and kWh in a linear or non-linear fashion? Very little data are available on this subject, but what data there are points to a near-linear scale up of greenhouse gas emissions when the battery size increases. Uncertainty factors include the impact from the passive components like electronics, as well as the scaling of the production energy with pack size in future large scale production. Additionally, the pack size is only one factor that varies when the electric range is increased. Effects on driveline, production and production volumes must also be assessed.
Part 2 – To answer more long-term questions related to opportunities to reduce the energy use and greenhouse gas emissions from battery production.
a) What opportunities exist to improve the emissions from the current lithium-ion battery chemistries by means of novel production methods? The main improvement short term is likely to come from more efficient production and from using electricity with low CO2 emissions. In the longer term, exchanging chemicals for water in production is a step towards lower greenhouse gas emissions.
b) What demands are placed on vehicle recycling today? There are demands on end of life vehicle recycling as well as on battery recycling. The current legislation does not ensure closed loop recycling of the crucial materials and only demand 50% recycling. The battery directive is being revised.
c) How many of the lithium-ion batteries are recycled today and in what way? There is currently a very low flow of lithium-ion batteries from vehicles, and the recycling that exist is focused on incineration with pyrometallurgy.
d) What materials are economically and technically recoverable from the batteries today? With pyrometallurgy only cobalt, nickel and copper can be extracted from the battery, and only in their elemental form (not processed for batteries).
e) What recycling techniques are being developed today and what potential do they have to reduce greenhouse gas emissions? There are a number of technologies and combinations of technologies being developed. Hydrometallurgy is close at hand, and can potentially extract more materials than pyrometallurgy, although this is currently only done at small scale. Long term it will be necessary to extract the materials in a more processed form in order to reduce the total impact of the battery.
f) How much of the production emissions can be allocated to the vehicle? In the current situation the use in the vehicle is the only use, implying that all of the impact is related to the vehicle life cycle. There is no second life market for batteries at present, and this looks to be the case for the foreseeable future if there are not great efforts made to change the situation.
Based on the assessment of the posed questions, our conclusions are that the currently available data are usually not transparent enough to draw detailed conclusions about the battery’s production emissions. There is, regardless, a good indication of the total emissions from the production, but this should be viewed in light of there being a small number of electric vehicles being produced compared to the total number of vehicles. The potential effects of scale up are not included in the assessments. Primary data for production, especially production of different pack sizes, is therefore interesting for future work.
Report U The Life Cycle Energy Consumption and Greenhouse Gas Emissions from Lithium-Ion Batteries – A Study with Focus on Current Technology and Batteries for Light-duty Vehicles
v
This report also concludes that there is no fixed answer to the question of the battery’s environmental impact. There is great potential to influence the future impact by legislative actions, especially in the area of recycling. Today there is no economic incentive for recycling of lithium-ion batteries, but by placing the correct requirements on the end of life handling we can create this incentive. Coupling this type of actions with support for technology development both in battery production processes and battery recycling can ensure a sustainable electric vehicle fleet.
The review of the available life cycle assessments also highlighted that there is a need for improving the primary data used in the studies, as there is little new data being presented. Additionally, the studies are often not transparent in their data choices and modelling assumptions, leading to a situation where comparing results becomes very difficult.
Regardless of this, the review found a number of critical factors for determining differences in the results. The assumptions regarding manufacturing were shown to have the greatest variation and impact on the total result. In order to improve our understanding of the environmental impact of the battery production we need more than LCA results. We need more clear technical descriptions of each production step and where they are performed so that the emissions found in the reviewed life cycles assessments can be defined into different stages. Not until we have a clear definition of stages can we assess where the energy consumption and emissions are largest, or what actions that can help lower the impact.
Report U The Life Cycle Energy Consumption and Greenhouse Gas Emissions from Lithium-Ion Batteries – A Study with Focus on Current Technology and Batteries for Light-duty Vehicles
vi
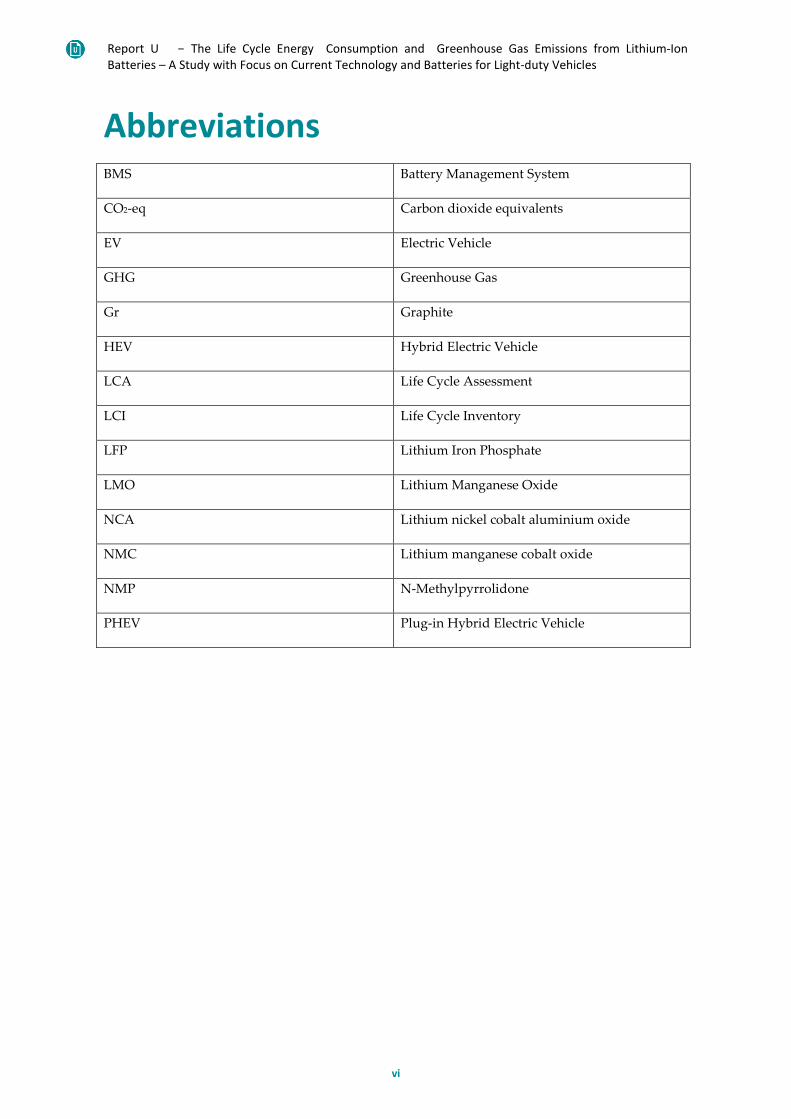
Abbreviations BMS Battery Management System
CO2-eq Carbon dioxide equivalents
EV Electric Vehicle
GHG Greenhouse Gas
Gr Graphite
HEV Hybrid Electric Vehicle
LCA Life Cycle Assessment
LCI Life Cycle Inventory
LFP Lithium Iron Phosphate
LMO Lithium Manganese Oxide
NCA Lithium nickel cobalt aluminium oxide
NMC Lithium manganese cobalt oxide
NMP N-Methylpyrrolidone
PHEV Plug-in Hybrid Electric Vehicle
Report U The Life Cycle Energy Consumption and Greenhouse Gas Emissions from Lithium-Ion Batteries – A Study with Focus on Current Technology and Batteries for Light-duty Vehicles
vii
Table of contents
1 Background ..................................................................................................................... 1
1.1 Battery LCAs ...................................................................................................................................... 1
2 Goal and scope ............................................................................................................... 2
2.1 Method .............................................................................................................................................. 3
3 Lithium-ion batteries – current and future chemistries ................................................. 4
3.1 Lithium-ion battery design ................................................................................................................ 5 3.1.1 Anode and cathode chemistries ............................................................................................... 5 3.1.2 Cell design ................................................................................................................................. 6 3.1.3 Material content of lithium-ion batteries ................................................................................. 7
3.2 Cell choices in the world and in Sweden ........................................................................................... 8 3.3 Future lithium-ion batteries .............................................................................................................. 9
3.3.1 Future cathode and anode materials ...................................................................................... 10
4 Lithium-ion battery production - energy use and greenhouse gas emissions ............. 11
4.1 Previous reviews and findings ......................................................................................................... 12 4.1.1 Peters et al (2017) ................................................................................................................... 12 4.1.2 Ellingsen et al (2016) ............................................................................................................... 14 4.1.3 Ambrose and Kendall (2016)................................................................................................... 14 4.1.4 Kim et al (2016) ....................................................................................................................... 15
4.2 Our review ....................................................................................................................................... 15 4.2.1 Total Energy use ...................................................................................................................... 15 4.2.2 Total greenhouse gas emissions ............................................................................................. 17 4.2.3 Greenhouse gas emissions per production stage ................................................................... 19
4.3 Trends concerning greenhouse gas emissions ................................................................................ 26 4.3.1 Larger batteries ....................................................................................................................... 26 4.3.2 Updated production techniques ............................................................................................. 27 4.3.3 Novel cell materials ................................................................................................................. 28
4.4 Conclusions regarding greenhouse gas emissions and energy use ................................................. 28
5 Lithium-ion battery recycling - energy use and greenhouse gas emissions ................. 30
5.1 Current demands on lithium-ion battery recycling ......................................................................... 31 5.2 Recycling today ................................................................................................................................ 31
5.2.1 Currently used recycling technologies .................................................................................... 32 5.2.2 Potential future recycling technologies .................................................................................. 34
5.3 Greenhouse gas emissions from recycling ...................................................................................... 35 5.4 Second life ....................................................................................................................................... 38
6 Total life cycle greenhouse gas emissions from battery production and recycling ........................................................................................................................ 38

Report U The Life Cycle Energy Consumption and Greenhouse Gas Emissions from Lithium-Ion Batteries – A Study with Focus on Current Technology and Batteries for Light-duty Vehicles
viii
7 Discussion ..................................................................................................................... 40
8 Conclusions ................................................................................................................... 42
9 Proposals for further studies ........................................................................................ 42
10 Acknowledgements ...................................................................................................... 44
11 Bibliography .................................................................................................................. 45
.
Report U The Life Cycle Energy Consumption and Greenhouse Gas Emissions from Lithium-Ion Batteries – A Study with Focus on Current Technology and Batteries for Light-duty Vehicles
1
1 Background The Swedish Energy Agency and the Swedish Transport Administration have requested this study on the greenhouse gas emissions and energy use for lithium-ion battery production for electric cars in order to secure scientifically based information to be used in recommendations for a CO2 neutral car fleet.
In general, more and more electric vehicles are reaching the market, and they are increasing in electric range. Hybrid electric vehicles have the shortest electric range of the available electric vehicle types. In hybrids the energy produced when braking is stored and reused in order to reduce fuel consumption. The next step in electric range comes with plug-in hybrid vehicles. These have a larger battery that can be charged from the grid, in order to prolong the electric range. Lastly we of course also have fully electric vehicles, only powered by a battery and electric motor. All in all we are moving towards more vehicles with batteries, and also towards more batteries in the vehicles.
There are many studies done on the question of greenhouse gas emissions from electric cars, but the results have been shown to differ. Additionally, the studies generally have a high focus on the use phase and how electrified vehicles change the emissions when driving.
As the electrification of the vehicle fleet also implies that a novel part is added - the lithium-ion battery – it is important to understand both the impacts when driving as well as the impacts from the added battery production. It is also important to understand why the available results differ.
As there have been many studies done on the topic of lithium-ion batteries for vehicles, the aim of this study was not to produce new data, but rather to review available literature in order to understand and motivate the key findings and differences found in and between the studies. In addition to giving valuable knowledge about the global warming impact related to battery production, this method of assessing many studies gives insight in where there are data gaps in the assessments and where the data gives a solid indication of emissions sources.
1.1 Battery LCAs We found LCA studies made in Europe, USA and Asia. The universities and institutes that are mainly referred to in this report are found in Table 1. In order to get better understanding of the work done, an estimate of their active time within the field is included.
Report U The Life Cycle Energy Consumption and Greenhouse Gas Emissions from Lithium-Ion Batteries – A Study with Focus on Current Technology and Batteries for Light-duty Vehicles
2
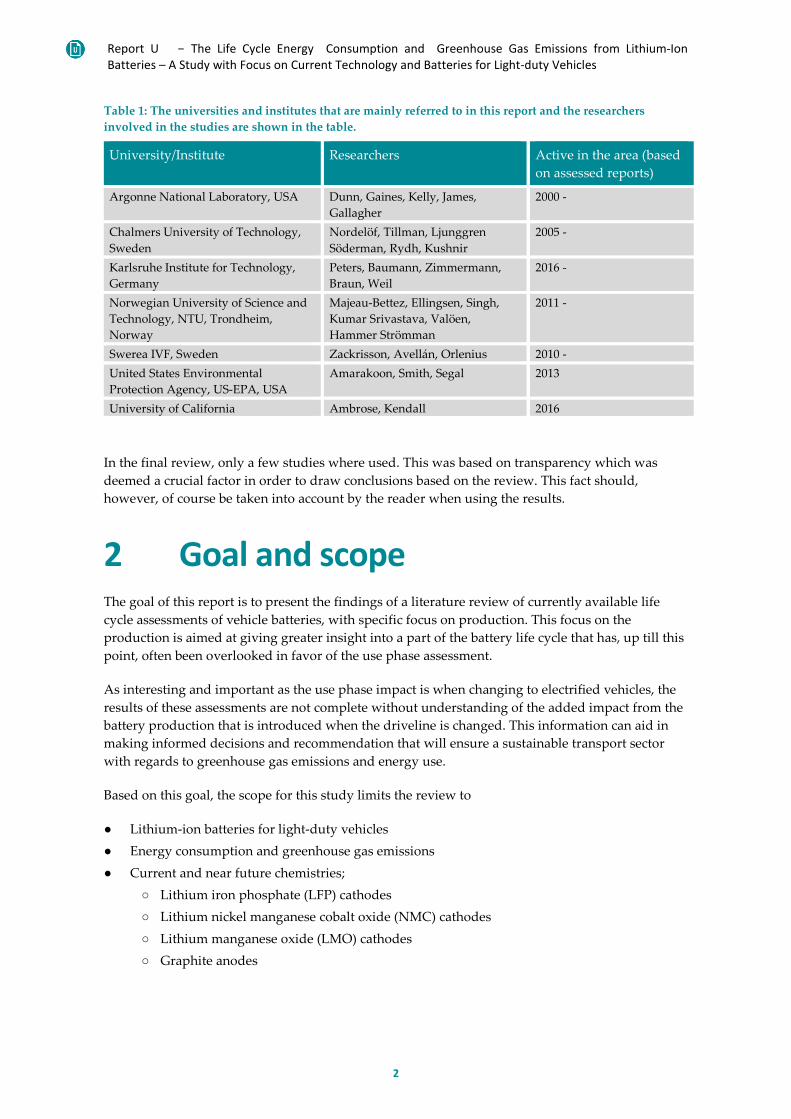
Table 1: The universities and institutes that are mainly referred to in this report and the researchers involved in the studies are shown in the table.
University/Institute Researchers Active in the area (based on assessed reports)
Argonne National Laboratory, USA Dunn, Gaines, Kelly, James, Gallagher
2000 -
Chalmers University of Technology, Sweden
Nordelöf, Tillman, Ljunggren Söderman, Rydh, Kushnir
2005 -
Karlsruhe Institute for Technology, Germany
Peters, Baumann, Zimmermann, Braun, Weil
2016 -
Norwegian University of Science and Technology, NTU, Trondheim, Norway
Majeau-Bettez, Ellingsen, Singh, Kumar Srivastava, Valöen, Hammer Strömman
2011 -
Swerea IVF, Sweden Zackrisson, Avellán, Orlenius 2010 - United States Environmental Protection Agency, US-EPA, USA
Amarakoon, Smith, Segal 2013
University of California Ambrose, Kendall 2016
In the final review, only a few studies where used. This was based on transparency which was deemed a crucial factor in order to draw conclusions based on the review. This fact should, however, of course be taken into account by the reader when using the results.
2 Goal and scope The goal of this report is to present the findings of a literature review of currently available life cycle assessments of vehicle batteries, with specific focus on production. This focus on the production is aimed at giving greater insight into a part of the battery life cycle that has, up till this point, often been overlooked in favor of the use phase assessment.
As interesting and important as the use phase impact is when changing to electrified vehicles, the results of these assessments are not complete without understanding of the added impact from the battery production that is introduced when the driveline is changed. This information can aid in making informed decisions and recommendation that will ensure a sustainable transport sector with regards to greenhouse gas emissions and energy use.
Based on this goal, the scope for this study limits the review to
● Lithium-ion batteries for light-duty vehicles ● Energy consumption and greenhouse gas emissions ● Current and near future chemistries;
○ Lithium iron phosphate (LFP) cathodes ○ Lithium nickel manganese cobalt oxide (NMC) cathodes ○ Lithium manganese oxide (LMO) cathodes ○ Graphite anodes
Report U The Life Cycle Energy Consumption and Greenhouse Gas Emissions from Lithium-Ion Batteries – A Study with Focus on Current Technology and Batteries for Light-duty Vehicles
3
The choice of chemistries was done in an iterative fashion, where the result of assessing the current electric vehicle fleet was used to determine the most interesting battery chemistries to focus on. The review has a near-term focus, looking mainly at the situation today and 10 years forward.
In addition to these over-head conditions; the scope of the review is limited by the main questions proposed in the assignment description by Swedish Energy Agency and the Swedish Transport Administration. The report is largely structured according to these questions, with additional sections being included in order to understand the background and current situation that is the baseline for the results. Chapter 3 is one such chapter that presents the assessment of the current vehicle fleet which led up to the choice of targeted chemistries.
The proposed questions are divided in two parts, one focusing on more short-term questions and the second on more long-term questions. In the summary and conclusions we also use these questions and summarize the answers.
The questions are;
Part 1 – Review the iteratively specified chemistries and answer the following short-term questions related to the battery production
a) How large are the energy use and greenhouse gas emissions related to the production of lithium-ion batteries?
b) How large are the greenhouse gas emissions related to different production steps including mining, processing and assembly/manufacturing?
c) What differences are there in greenhouse gas emissions between different production locations?
d) Do emissions scale with the battery weight and kWh in a linear or non-linear fashion?
Part 2 – To answer more long-term questions related to opportunities to reduce the energy use and greenhouse gas emissions from battery production.
a) What opportunities exist to improve the emissions from the current lithium-ion battery chemistries by means of novel production methods?
b) What demands are placed on vehicle recycling today? c) How many of the lithium-ion batteries are recycled today and in what way? d) What materials are economically and technically recoverable from the batteries today? e) What recycling techniques are being developed today and what potential do they have to
reduce greenhouse gas emissions? f) How much of the production emissions can be allocated to the vehicle?
2.1 Method This report is based on an extensive literature review covering life cycle assessments on batteries for light-duty electric vehicles, as well as some supporting information for these studies. Based on this review the authors have drawn conclusions in order to answer the questions posed in the scope.
Report U The Life Cycle Energy Consumption and Greenhouse Gas Emissions from Lithium-Ion Batteries – A Study with Focus on Current Technology and Batteries for Light-duty Vehicles
4
The following databases where used to collect the literature used in the review:
● Science direct ● Google Scholar ● WorldWide Science ● Scopus and Web of science ● SpringerLink
Focus was on reports from 2015-2017, but older reports and articles where included when relevant. Scientific articles (including ones from open source), conference articles and reports were used for the study.
The search was focused on the following key words
● CO2 or carbon dioxide and NMC or LFP or LCO or LMO. ● Life cycle assessment/LCA and lithium-ion batteries/battery
In addition to the search parameters given above, relevant literature was also collected based on previous review work, including Peters (2017) and Ellingsen (2016). A large, and highly appreciated, support was given by Anders Nordelöf and Duncan Kushnir at Chalmers University of Technology in collecting relevant literature in the areas of electric vehicle LCAs and battery recycling technology respectively. Also the support by Christer Forsgren at Stena Metall was appreciated for the recycling chapter.
The project was driven forward, and the goal and scope modified (if necessary), in reoccurring meetings between IVL, Swedish Energy Agency and the Swedish Transport Administration. The beginning of the project also hosted a workshop where interested parties where informed about the project, and additionally had the opportunities to give input and discuss the questions. This discussion was of course also used in the conclusions drawn from the literature review.
Based on the scope of the study, the life cycle was divided into stages focusing on mining, material processing and manufacturing of the battery. This division is based on a rough assessment of the available literature and could be greatly improved by more detailed study of the technical system. This implies that the division of emissions to different life cycle stages is coupled with high uncertainty, something that should be taken into account by the reader.
3 Lithium-ion batteries – current and future chemistries
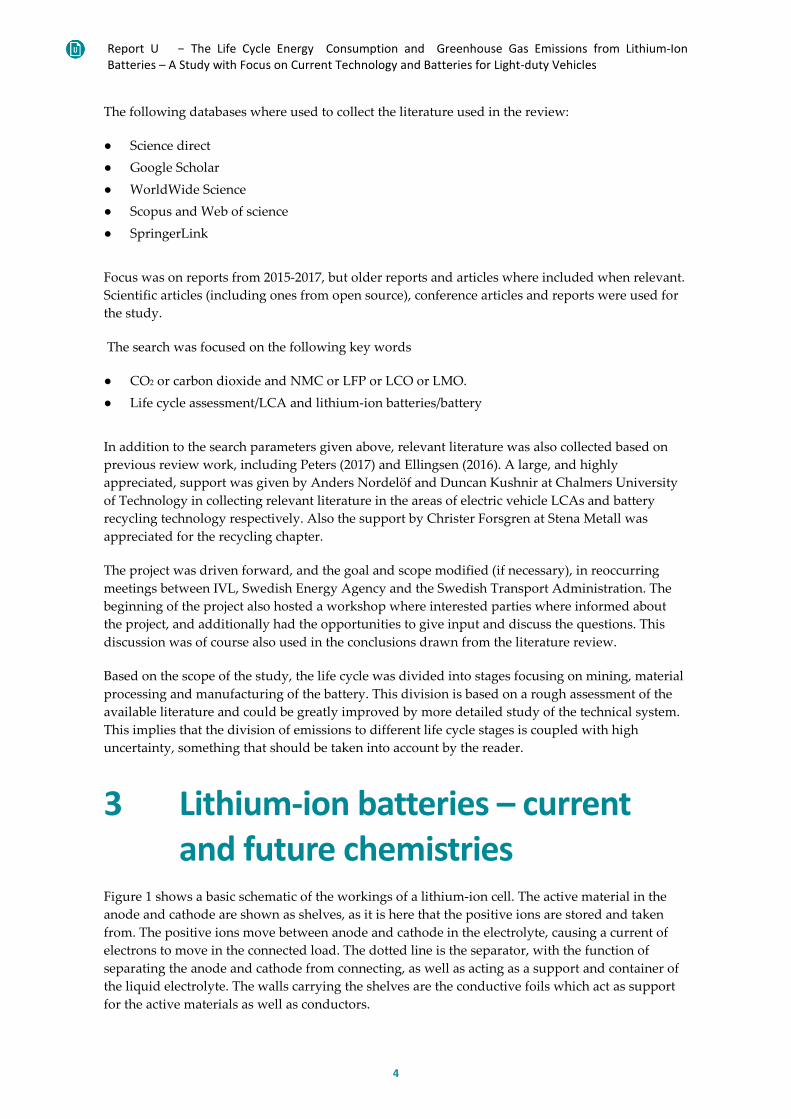
Figure 1 shows a basic schematic of the workings of a lithium-ion cell. The active material in the anode and cathode are shown as shelves, as it is here that the positive ions are stored and taken from. The positive ions move between anode and cathode in the electrolyte, causing a current of electrons to move in the connected load. The dotted line is the separator, with the function of separating the anode and cathode from connecting, as well as acting as a support and container of the liquid electrolyte. The walls carrying the shelves are the conductive foils which act as support for the active materials as well as conductors.
Report U The Life Cycle Energy Consumption and Greenhouse Gas Emissions from Lithium-Ion Batteries – A Study with Focus on Current Technology and Batteries for Light-duty Vehicles
5
To create a full cell many, many layers of the above described set-up are combined. The conductive foils are attached to current collector which are joined together to form the batteries negative and positive connectors. The whole layered structure is then encased in a protective outer casing.
Figure 1: The figure shows a schematic illustration of a lithium-ion cell. The anode and cathode active material “stores” the lithium-ions depending on the state of charge. The electrolyte fills the space between the active material, and the separator makes sure that the anode and cathode cannot react. Current collectors are used as structural support for the active material, as well as transporting the electrons to the load.
In order to provide enough power and energy to work in an application like a vehicle, several lithium-ion battery cells need to be combined into what is most often called a battery pack. In this pack the cells are coupled together according to the requirements of the vehicle and components to control charge, discharge and cooling are added. The cells can be divided into modules to ease control, which implies that a few cells are placed together in a module structure, and after that coupled together to form the larger pack. This allows for more specific control of load and cooling.
3.1 Lithium-ion battery design A lithium-ion battery can be produced with several different combinations of lithium based cathode and anode materials. For vehicles, certain demands are placed on the battery chemistry with regard to power and energy per kg. For this reason, some materials are more common in vehicles.
There is also a difference in demand when looking at full electric vehicle (BEV) and plugin or hybrid vehicles (PHEVs). In general the rule is – the larger the range of electric driving, the larger the battery. High specific energy is crucial for BEVs while PHEVs need a balance between energy and power (Air Resources Board, 2017)
3.1.1 Anode and cathode chemistries There are a few electrode (anode and cathode) materials that currently dominate the electric vehicle battery production. Common is to use a mix of cobalt, nickel and manganese oxides together with the lithium as cathode, but it is also possible to use an iron phosphate. This is coupled with an anode, most commonly graphite.
Load
Report U The Life Cycle Energy Consumption and Greenhouse Gas Emissions from Lithium-Ion Batteries – A Study with Focus on Current Technology and Batteries for Light-duty Vehicles
6
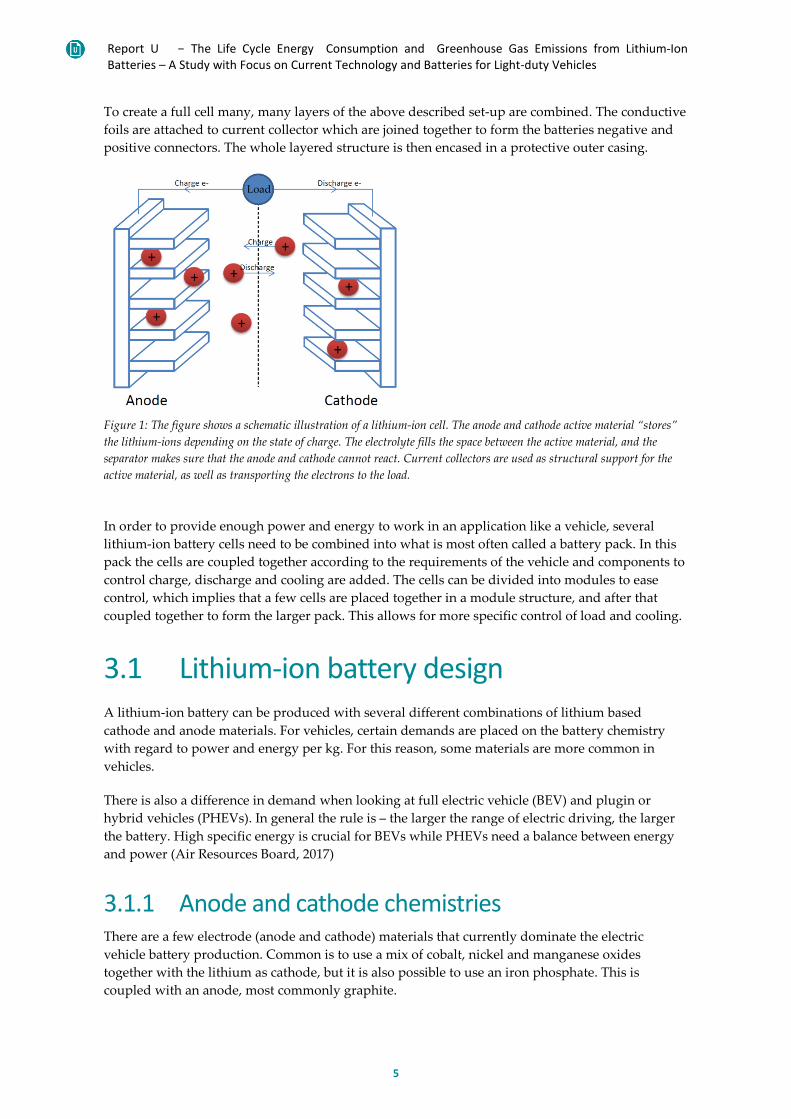
It is, however, possible to combine the cathodes with other anodes like the lithium based lithium titanate. Table 2 gives an overview of the most common cathode materials used in EVs today while Table 3 contains the anode choices.
Table 2: The table gives an overview of the most common battery cathode chemistries and their inherent advantages and disadvantages. (Kushnir, 2015)
Cathode material Abbr. Use Advantages Disadvantages
LiCoO2 Lithium cobalt oxide
LCO Mainly in small scale electronics
Performance, well understood
Safety, uses nickel and cobalt
LiNi0.33Mn0.33Co0.33O2 Lithium manganese cobalt oxide
NMC (333)
Common in EVs Better safety and performance than LCO
Cost, nickel and cobalt
LiFePO4 Lithium iron phosphate
LFP High power option, potential choice for EVs
Excellent power, lifetime and safety, abundant materials
Low energy density
LiMn2O4 Lithium manganese oxide
LMO Historically used in EVS, now less common
Cheap, abundant, high power
Lifetime, low capacity means low energy density
LiNi0.8Co0.15Al0.05O2 Lithium nickel cobalt aluminium oxide
NCA Used in some EVs High capacity and voltage, high power
Safety, cost, uses nickel and cobalt
When it comes to anode materials, there are fewer choices. Most common is to use a graphite anode, this choice is by far the most common anode used in combination with the cathodes in Table 2. A lithium based alternative – lithium titanium oxide – is also possible. Table 3 shows the advantages and disadvantages of each type.
Table 3: The table presents an overview of the most common battery anode chemistries and their inherent advantages and disadvantages. (Kushnir, 2015)
Material Abbr. Use Advantages Disadvantages
Graphite Gr Most common choice in EVs
Decent lifetime, well understood, abundant (because synthetic graphite can be used)
Inefficiency due to SEI formation
Li4Ti5O12 Lithium titanium oxide
LTO Possible to use in EVs
Excellent power and cycle life Lower voltage means less energy, cost
3.1.2 Cell design On top of there being many different alternative lithium-ion battery chemistries, there is also the possibility to design the cell in different ways. There are two main ways of doing this;
Report U The Life Cycle Energy Consumption and Greenhouse Gas Emissions from Lithium-Ion Batteries – A Study with Focus on Current Technology and Batteries for Light-duty Vehicles
7
● Large sheets of the anode-cathode combination is layered and cut into a square shape and then stacked. This is then enclosed in protective containers; either a flexible pouch (aluminium and plastic laminate) or a hard aluminium case (this setup is called a prismatic cell).
● The anode and cathode combination is stacked in large sheets and rolled up to form the many layered structure. The roll is cut to the desired length and inserted into a cylindrical container, often of aluminium.
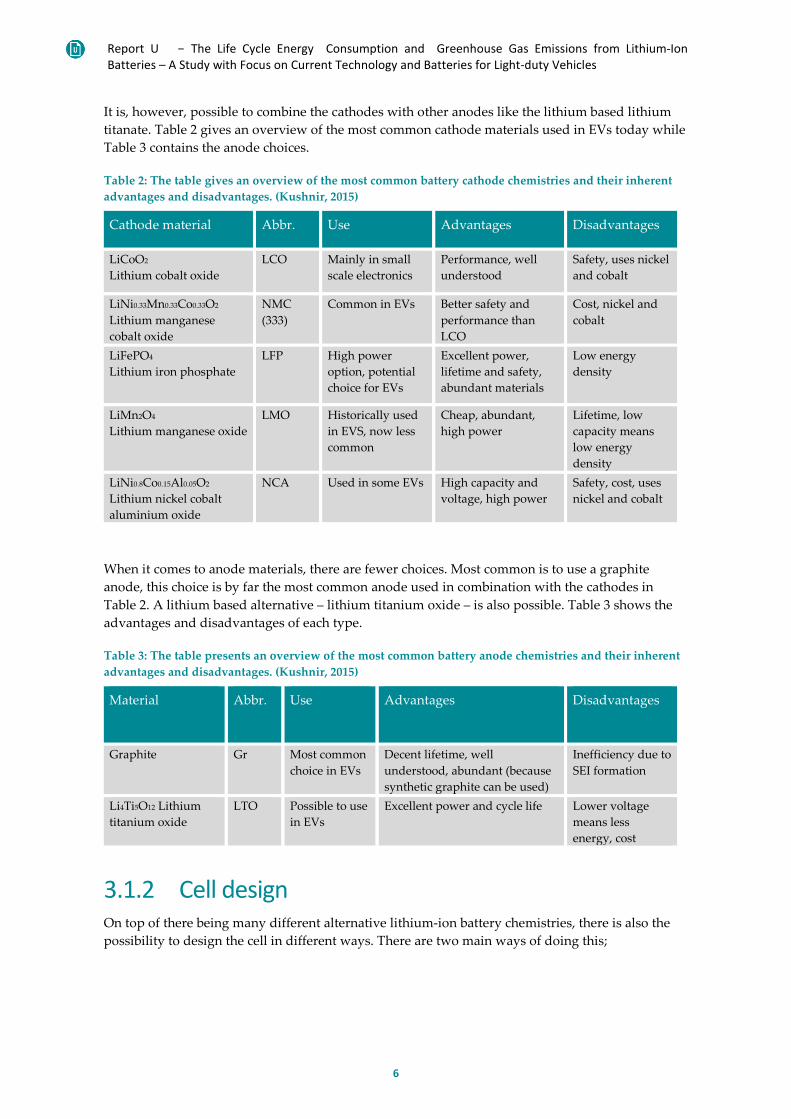
Table 4 shows the properties of the three different cell designs resulting from these two ways of cutting and stacking the cell layers.
Table 4: The table presents an overview of the three most common battery designs for EVs. (Battery University, 2017)
Cell design Advantages Disadvantages
Cylindrical Stable design, pressure resistant, low production cost
Poor packing efficiency, difficult cooling
Prismatic Efficient packing Expensive, heavy passive material, risk of swelling
Pouch Low passive weight, efficient packing Risk of swelling, needs compression
The cylindrical cells use a design that has been common for small scale batteries for a long time. Therefore the production cost has historically been lower for this type, but the flat designs are more common in vehicles due to the more efficient packing.
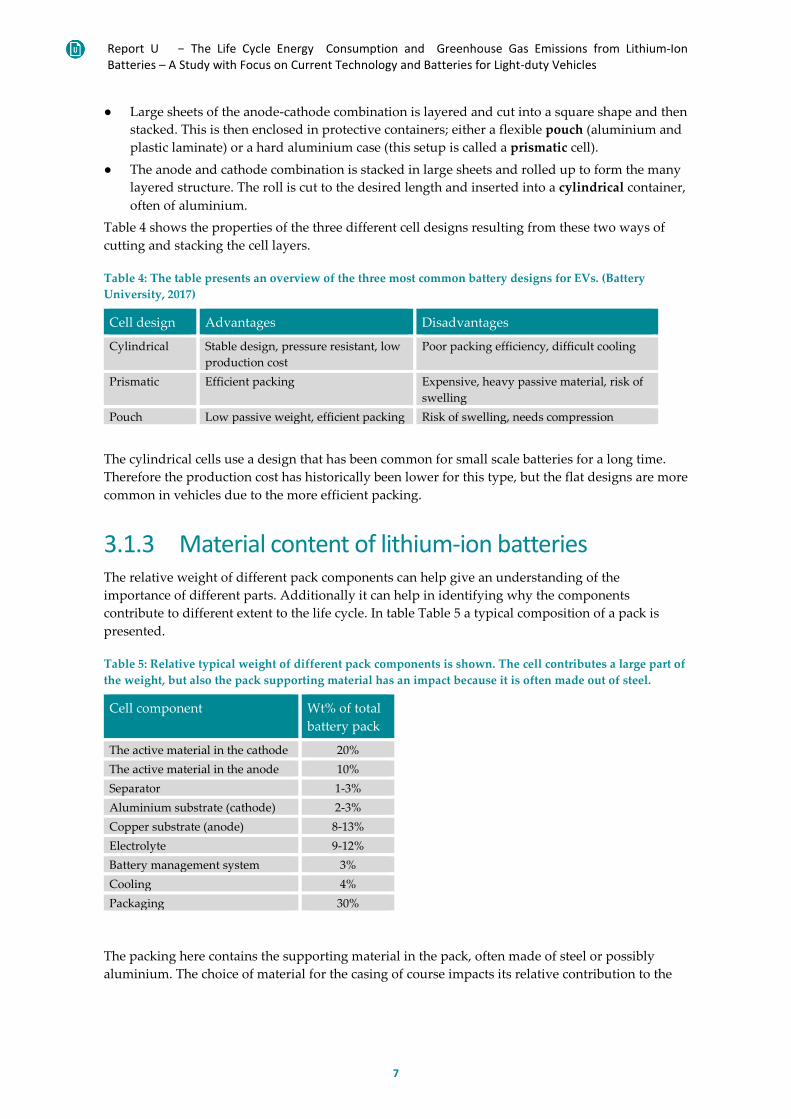
3.1.3 Material content of lithium-ion batteries The relative weight of different pack components can help give an understanding of the importance of different parts. Additionally it can help in identifying why the components contribute to different extent to the life cycle. In table Table 5 a typical composition of a pack is presented.
Table 5: Relative typical weight of different pack components is shown. The cell contributes a large part of the weight, but also the pack supporting material has an impact because it is often made out of steel.
Cell component Wt% of total battery pack
The active material in the cathode 20% The active material in the anode 10% Separator 1-3% Aluminium substrate (cathode) 2-3% Copper substrate (anode) 8-13% Electrolyte 9-12% Battery management system 3% Cooling 4% Packaging 30%
The packing here contains the supporting material in the pack, often made of steel or possibly aluminium. The choice of material for the casing of course impacts its relative contribution to the
Report U The Life Cycle Energy Consumption and Greenhouse Gas Emissions from Lithium-Ion Batteries – A Study with Focus on Current Technology and Batteries for Light-duty Vehicles
8
weight. The cells are the largest part of the pack; in total the components in the pack contribute roughly 60% of the whole weight of the battery.
The numbers presented here are rough estimates based on the currently available chemistries. Future technologies may of course change the relations, but this overview aids in the understanding of the results presented in this report.
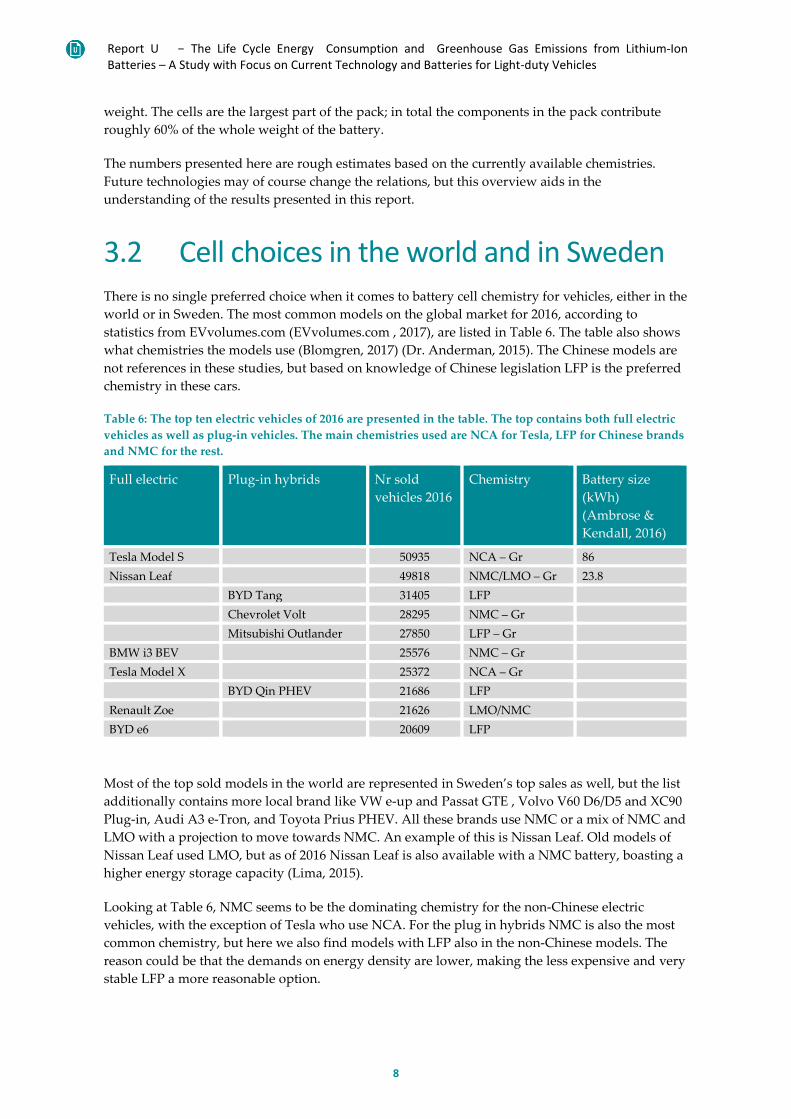
3.2 Cell choices in the world and in Sweden There is no single preferred choice when it comes to battery cell chemistry for vehicles, either in the world or in Sweden. The most common models on the global market for 2016, according to statistics from EVvolumes.com (EVvolumes.com , 2017), are listed in Table 6. The table also shows what chemistries the models use (Blomgren, 2017) (Dr. Anderman, 2015). The Chinese models are not references in these studies, but based on knowledge of Chinese legislation LFP is the preferred chemistry in these cars.
Table 6: The top ten electric vehicles of 2016 are presented in the table. The top contains both full electric vehicles as well as plug-in vehicles. The main chemistries used are NCA for Tesla, LFP for Chinese brands and NMC for the rest.
Full electric Plug-in hybrids Nr sold vehicles 2016
Chemistry Battery size (kWh) (Ambrose & Kendall, 2016)
Tesla Model S 50935 NCA – Gr 86 Nissan Leaf 49818 NMC/LMO – Gr 23.8 BYD Tang 31405 LFP Chevrolet Volt 28295 NMC – Gr Mitsubishi Outlander 27850 LFP – Gr BMW i3 BEV 25576 NMC – Gr Tesla Model X 25372 NCA – Gr BYD Qin PHEV 21686 LFP Renault Zoe 21626 LMO/NMC BYD e6 20609 LFP
Most of the top sold models in the world are represented in Sweden’s top sales as well, but the list additionally contains more local brand like VW e-up and Passat GTE , Volvo V60 D6/D5 and XC90 Plug-in, Audi A3 e-Tron, and Toyota Prius PHEV. All these brands use NMC or a mix of NMC and LMO with a projection to move towards NMC. An example of this is Nissan Leaf. Old models of Nissan Leaf used LMO, but as of 2016 Nissan Leaf is also available with a NMC battery, boasting a higher energy storage capacity (Lima, 2015).
Looking at Table 6, NMC seems to be the dominating chemistry for the non-Chinese electric vehicles, with the exception of Tesla who use NCA. For the plug in hybrids NMC is also the most common chemistry, but here we also find models with LFP also in the non-Chinese models. The reason could be that the demands on energy density are lower, making the less expensive and very stable LFP a more reasonable option.
Report U The Life Cycle Energy Consumption and Greenhouse Gas Emissions from Lithium-Ion Batteries – A Study with Focus on Current Technology and Batteries for Light-duty Vehicles
9
LFP can, however, never achieve the same kWh/kg performance as NMC due to the inherent properties of the materials and for this reason it is likely that electric cars will move towards NMC in combination with novel anode materials. It can be interesting to note, however, that LFP still could be a viable choice for heavy duty application where energy per kg is less important, while power per kg is more important. LFP has better kW/kg than NMC.
The Chinese market has historically been different than the rest of the world, mainly due to legislative reasons. LFP has been the only industrial scale chemistry that fulfilled the high safety demands, and Chinese government limited subsidies to vehicles with NMC batteries in the beginning of 2016. This regulation was however withdrawn in January 2017, again making NMC in vehicles a candidate for subsidies.
BYD have announced at the International Battery Seminar & Exhibition that they will be starting production of NMC in order to produce higher kWh/kg than the LFP chemistry can deliver (Karlström, 2017). This trend, along with the move from LMO towards NMC indicates that NMC is the near-term future choice of battery chemistry for electric vehicles.
It is important to note that cobalt and to some extent nickel are relatively scarce in the earth’s crust, and therefore they pose a risk when included in the batteries. Cobalt is on the EU’s list of critical materials for the European industries (European Commission, 2014), and it is additionally becoming a so called conflict mineral. This implies that it has been found to be mined in places controlled by armed groups, and that purchasing from these mines is forbidden. This of course also impacts the supply and price.
3.3 Future lithium-ion batteries Looking first at the whole battery pack one thing is clear – they are getting bigger – at least when it comes to energy storage capacity. California Air Resource Board has done an overview of new and soon-to-be released models as seen a clear trend towards larger packs (Air Resources Board, 2017). Examples include Nissan Leaf, Tesla model S, Volkswagen e-golf and BMW i3; all on the list of the most common EVs in Sweden.
The larger energy storage does, however, not always imply a larger size. The same report (Air Resources Board, 2017) had found cases where the energy storage had been reported to increase while the dimensions and properties of the battery remained the same. This could be an indication of another trend focusing on packing efficiency. This improvement can include both more space efficient design, but it can also be an effect of decreased so called passive material.
Passive material for example comes from the modules and the additional structural and electronic material needed in them. Increased number of cells in each module is one way to lower the amount of passive material and thus in turn size and weight.
When using assessments of trends and research in order to look at the near future development of lithium-ion batteries we can distinguish between two cases; either we are making small modifications of current technology, or we are making revolutionary leaps in development.
The former has potential to enter into our batteries during the next 10-15 years since they do not require as much research in order to realize. The latter, however, cannot be viewed as probable within this timeframe as there is much research and work to be done in order to realize their full potential.
Report U The Life Cycle Energy Consumption and Greenhouse Gas Emissions from Lithium-Ion Batteries – A Study with Focus on Current Technology and Batteries for Light-duty Vehicles
10
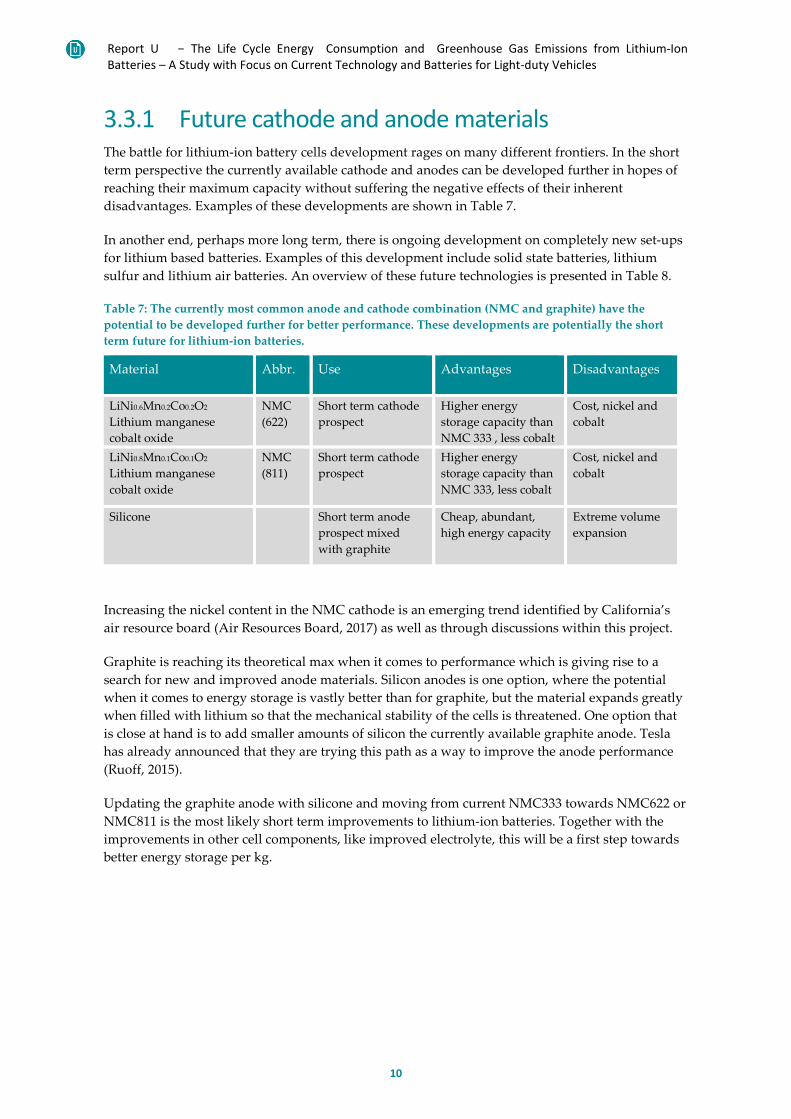
3.3.1 Future cathode and anode materials The battle for lithium-ion battery cells development rages on many different frontiers. In the short term perspective the currently available cathode and anodes can be developed further in hopes of reaching their maximum capacity without suffering the negative effects of their inherent disadvantages. Examples of these developments are shown in Table 7.
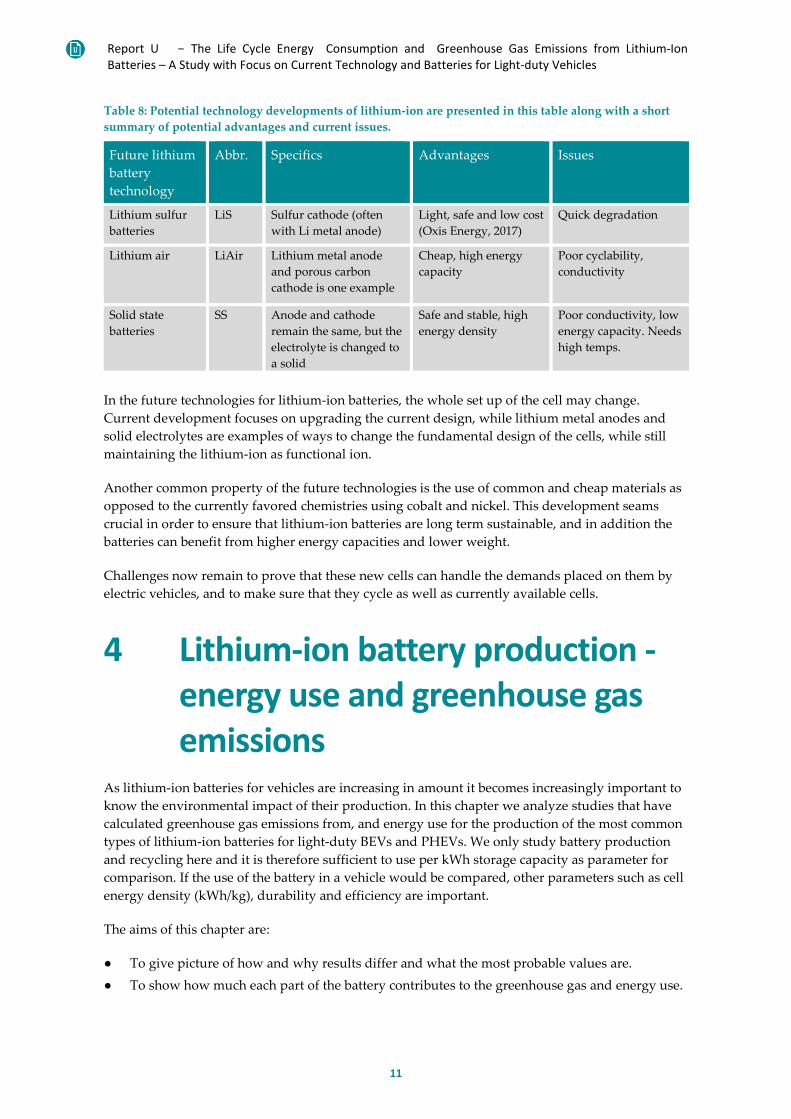
In another end, perhaps more long term, there is ongoing development on completely new set-ups for lithium based batteries. Examples of this development include solid state batteries, lithium sulfur and lithium air batteries. An overview of these future technologies is presented in Table 8.
Table 7: The currently most common anode and cathode combination (NMC and graphite) have the potential to be developed further for better performance. These developments are potentially the short term future for lithium-ion batteries.
Material Abbr. Use Advantages Disadvantages
LiNi0.6Mn0.2Co0.2O2 Lithium manganese cobalt oxide
NMC (622)
Short term cathode prospect
Higher energy storage capacity than NMC 333 , less cobalt
Cost, nickel and cobalt
LiNi0.8Mn0.1Co0.1O2 Lithium manganese cobalt oxide
NMC (811)
Short term cathode prospect
Higher energy storage capacity than NMC 333, less cobalt
Cost, nickel and cobalt
Silicone Short term anode prospect mixed with graphite
Cheap, abundant, high energy capacity
Extreme volume expansion
Increasing the nickel content in the NMC cathode is an emerging trend identified by California’s air resource board (Air Resources Board, 2017) as well as through discussions within this project.
Graphite is reaching its theoretical max when it comes to performance which is giving rise to a search for new and improved anode materials. Silicon anodes is one option, where the potential when it comes to energy storage is vastly better than for graphite, but the material expands greatly when filled with lithium so that the mechanical stability of the cells is threatened. One option that is close at hand is to add smaller amounts of silicon the currently available graphite anode. Tesla has already announced that they are trying this path as a way to improve the anode performance (Ruoff, 2015).
Updating the graphite anode with silicone and moving from current NMC333 towards NMC622 or NMC811 is the most likely short term improvements to lithium-ion batteries. Together with the improvements in other cell components, like improved electrolyte, this will be a first step towards better energy storage per kg.
Report U The Life Cycle Energy Consumption and Greenhouse Gas Emissions from Lithium-Ion Batteries – A Study with Focus on Current Technology and Batteries for Light-duty Vehicles
11
Table 8: Potential technology developments of lithium-ion are presented in this table along with a short summary of potential advantages and current issues.
Future lithium battery technology
Abbr. Specifics Advantages Issues
Lithium sulfur batteries
LiS Sulfur cathode (often with Li metal anode)
Light, safe and low cost (Oxis Energy, 2017)
Quick degradation
Lithium air LiAir Lithium metal anode and porous carbon cathode is one example
Cheap, high energy capacity
Poor cyclability, conductivity
Solid state batteries
SS Anode and cathode remain the same, but the electrolyte is changed to a solid
Safe and stable, high energy density
Poor conductivity, low energy capacity. Needs high temps.
In the future technologies for lithium-ion batteries, the whole set up of the cell may change. Current development focuses on upgrading the current design, while lithium metal anodes and solid electrolytes are examples of ways to change the fundamental design of the cells, while still maintaining the lithium-ion as functional ion.
Another common property of the future technologies is the use of common and cheap materials as opposed to the currently favored chemistries using cobalt and nickel. This development seams crucial in order to ensure that lithium-ion batteries are long term sustainable, and in addition the batteries can benefit from higher energy capacities and lower weight.
Challenges now remain to prove that these new cells can handle the demands placed on them by electric vehicles, and to make sure that they cycle as well as currently available cells.
4 Lithium-ion battery production - energy use and greenhouse gas emissions
As lithium-ion batteries for vehicles are increasing in amount it becomes increasingly important to know the environmental impact of their production. In this chapter we analyze studies that have calculated greenhouse gas emissions from, and energy use for the production of the most common types of lithium-ion batteries for light-duty BEVs and PHEVs. We only study battery production and recycling here and it is therefore sufficient to use per kWh storage capacity as parameter for comparison. If the use of the battery in a vehicle would be compared, other parameters such as cell energy density (kWh/kg), durability and efficiency are important.
The aims of this chapter are:
● To give picture of how and why results differ and what the most probable values are. ● To show how much each part of the battery contributes to the greenhouse gas and energy use.
Report U The Life Cycle Energy Consumption and Greenhouse Gas Emissions from Lithium-Ion Batteries – A Study with Focus on Current Technology and Batteries for Light-duty Vehicles
12
There are many studies done, and they differ in quality due to a number of factors:
● Transparency: they are more or less transparent, thus it is more or less easy to find out which data, what nomenclature or what component division was used.
● Assumptions: they use more or less generalized assumptions for data gaps. ● Reviewed: they are not all reported in peer reviewed articles.
Other aspects to take into consideration are:
● The age of the study. ● If the researchers used ready-made data from earlier studies, the age of these, if they made
own measurements /data collection or if they combined old data into new (e.g. stoichiometric calculations in order to calculate LCI data for certain chemicals).
● The difference in battery chemistry of the assessed batteries.
4.1 Previous reviews and findings In this section the findings from the most relevant and recent reviews are reported in chronological order with the most recent first.
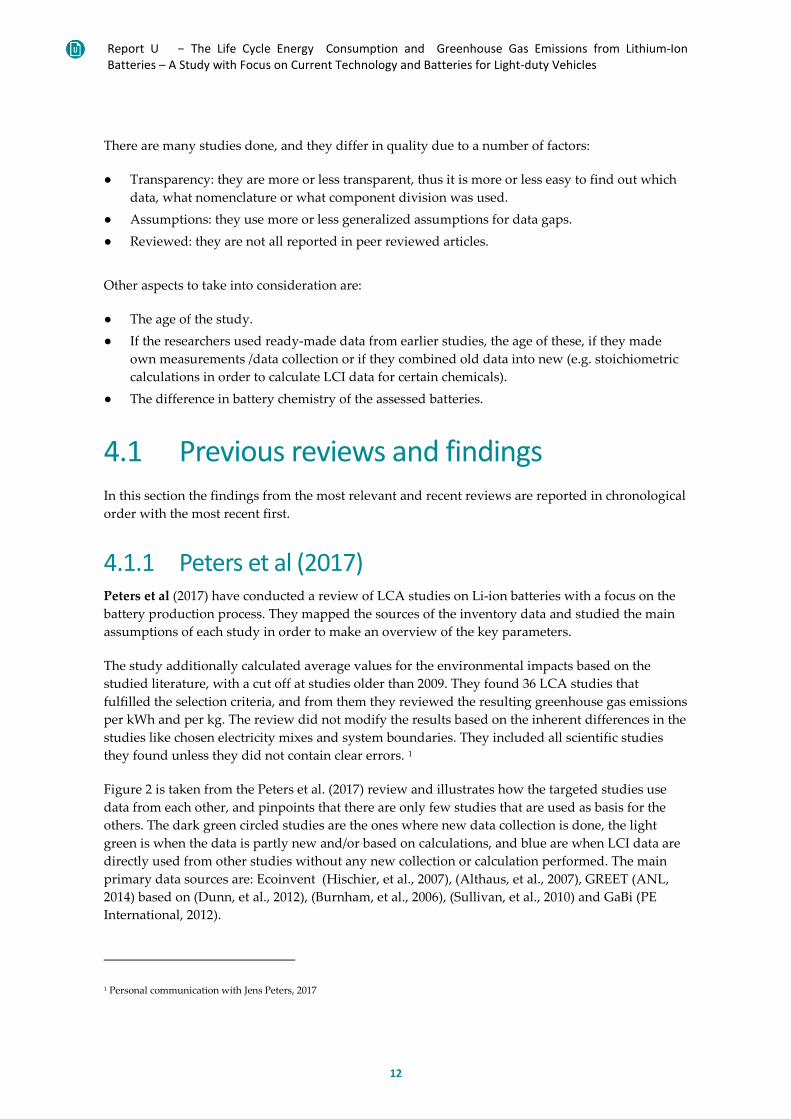
4.1.1 Peters et al (2017) Peters et al (2017) have conducted a review of LCA studies on Li-ion batteries with a focus on the battery production process. They mapped the sources of the inventory data and studied the main assumptions of each study in order to make an overview of the key parameters.
The study additionally calculated average values for the environmental impacts based on the studied literature, with a cut off at studies older than 2009. They found 36 LCA studies that fulfilled the selection criteria, and from them they reviewed the resulting greenhouse gas emissions per kWh and per kg. The review did not modify the results based on the inherent differences in the studies like chosen electricity mixes and system boundaries. They included all scientific studies they found unless they did not contain clear errors. 1
Figure 2 is taken from the Peters et al. (2017) review and illustrates how the targeted studies use data from each other, and pinpoints that there are only few studies that are used as basis for the others. The dark green circled studies are the ones where new data collection is done, the light green is when the data is partly new and/or based on calculations, and blue are when LCI data are directly used from other studies without any new collection or calculation performed. The main primary data sources are: Ecoinvent (Hischier, et al., 2007), (Althaus, et al., 2007), GREET (ANL, 2014) based on (Dunn, et al., 2012), (Burnham, et al., 2006), (Sullivan, et al., 2010) and GaBi (PE International, 2012).
1 Personal communication with Jens Peters, 2017
Report U The Life Cycle Energy Consumption and Greenhouse Gas Emissions from Lithium-Ion Batteries – A Study with Focus on Current Technology and Batteries for Light-duty Vehicles
13
Figure 2: The figure illustrates how LCI used in LCAs on lithium-ion batteries are interlinked and reused (Peters, et al., 2017). Image reused with permission from the author.
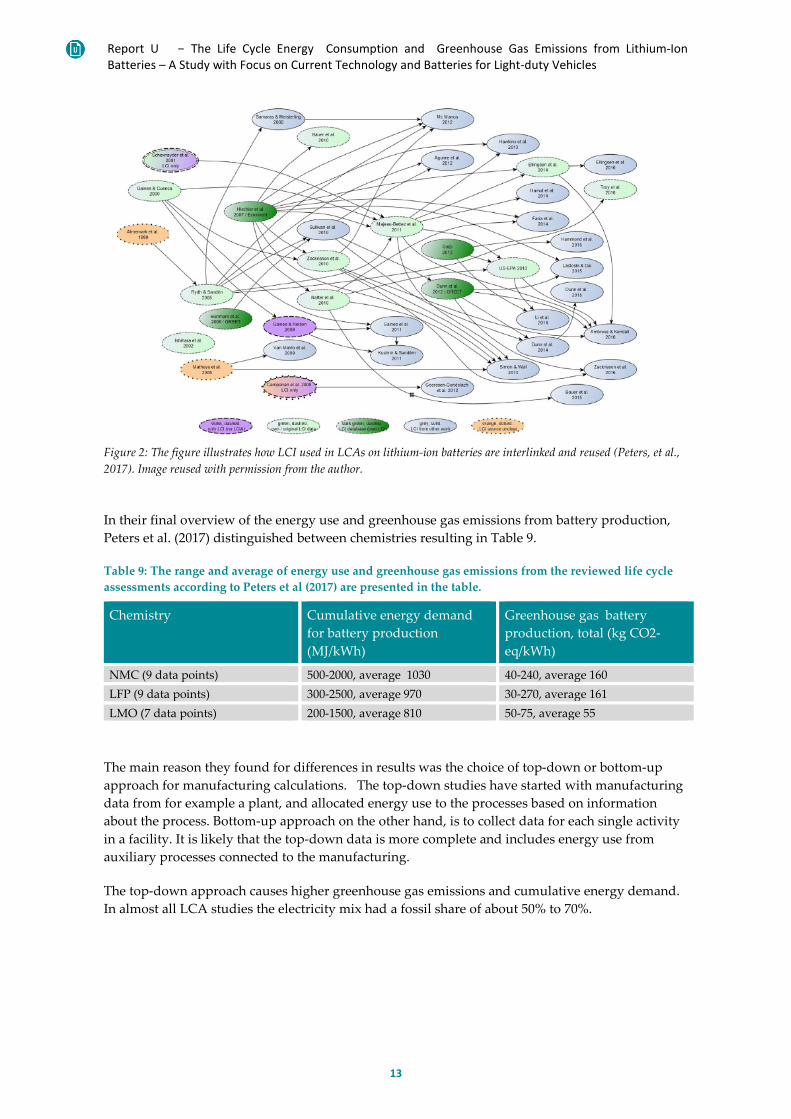
In their final overview of the energy use and greenhouse gas emissions from battery production, Peters et al. (2017) distinguished between chemistries resulting in Table 9.
Table 9: The range and average of energy use and greenhouse gas emissions from the reviewed life cycle assessments according to Peters et al (2017) are presented in the table.
Chemistry Cumulative energy demand for battery production (MJ/kWh)
Greenhouse gas battery production, total (kg CO2-eq/kWh)
NMC (9 data points) 500-2000, average 1030 40-240, average 160 LFP (9 data points) 300-2500, average 970 30-270, average 161 LMO (7 data points) 200-1500, average 810 50-75, average 55
The main reason they found for differences in results was the choice of top-down or bottom-up approach for manufacturing calculations. The top-down studies have started with manufacturing data from for example a plant, and allocated energy use to the processes based on information about the process. Bottom-up approach on the other hand, is to collect data for each single activity in a facility. It is likely that the top-down data is more complete and includes energy use from auxiliary processes connected to the manufacturing.
The top-down approach causes higher greenhouse gas emissions and cumulative energy demand. In almost all LCA studies the electricity mix had a fossil share of about 50% to 70%.
Report U The Life Cycle Energy Consumption and Greenhouse Gas Emissions from Lithium-Ion Batteries – A Study with Focus on Current Technology and Batteries for Light-duty Vehicles
14
4.1.2 Ellingsen et al (2016) Ellingsen et al (2016) also reviewed LCA studies, but they chose only certain studies determined as the most scientific ones2. Ellingsen et al (2016) , like Peters et al. (2017), conclude that the manufacturing data differ a lot. The results range between 2.4 and 1062 MJ/kWh battery cell and it is difficult to get access to primary data from the battery industry. Top-down approach is most likely more complete than bottom-up, but data was aggregated and therefore details could not be extracted and analyzed. Top-down gives higher greenhouse gas emissions than bottom-up, a conclusion that is in line with Peters et al (2017).
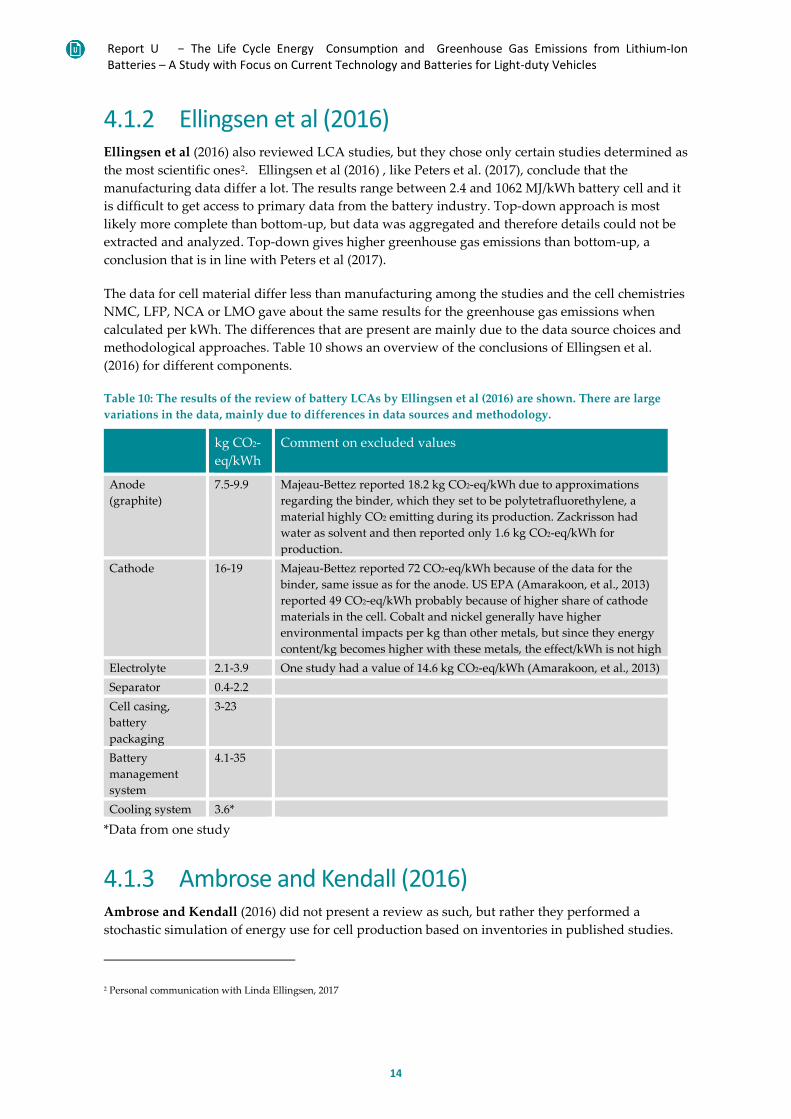
The data for cell material differ less than manufacturing among the studies and the cell chemistries NMC, LFP, NCA or LMO gave about the same results for the greenhouse gas emissions when calculated per kWh. The differences that are present are mainly due to the data source choices and methodological approaches. Table 10 shows an overview of the conclusions of Ellingsen et al. (2016) for different components.
Table 10: The results of the review of battery LCAs by Ellingsen et al (2016) are shown. There are large variations in the data, mainly due to differences in data sources and methodology.
kg CO2-eq/kWh
Comment on excluded values
Anode (graphite)
7.5-9.9 Majeau-Bettez reported 18.2 kg CO2-eq/kWh due to approximations regarding the binder, which they set to be polytetrafluorethylene, a material highly CO2 emitting during its production. Zackrisson had water as solvent and then reported only 1.6 kg CO2-eq/kWh for production.
Cathode 16-19 Majeau-Bettez reported 72 CO2-eq/kWh because of the data for the binder, same issue as for the anode. US EPA (Amarakoon, et al., 2013) reported 49 CO2-eq/kWh probably because of higher share of cathode materials in the cell. Cobalt and nickel generally have higher environmental impacts per kg than other metals, but since they energy content/kg becomes higher with these metals, the effect/kWh is not high
Electrolyte 2.1-3.9 One study had a value of 14.6 kg CO2-eq/kWh (Amarakoon, et al., 2013) Separator 0.4-2.2 Cell casing, battery packaging
3-23
Battery management system
4.1-35
Cooling system 3.6*
*Data from one study
4.1.3 Ambrose and Kendall (2016) Ambrose and Kendall (2016) did not present a review as such, but rather they performed a stochastic simulation of energy use for cell production based on inventories in published studies.
2 Personal communication with Linda Ellingsen, 2017
Report U The Life Cycle Energy Consumption and Greenhouse Gas Emissions from Lithium-Ion Batteries – A Study with Focus on Current Technology and Batteries for Light-duty Vehicles
15
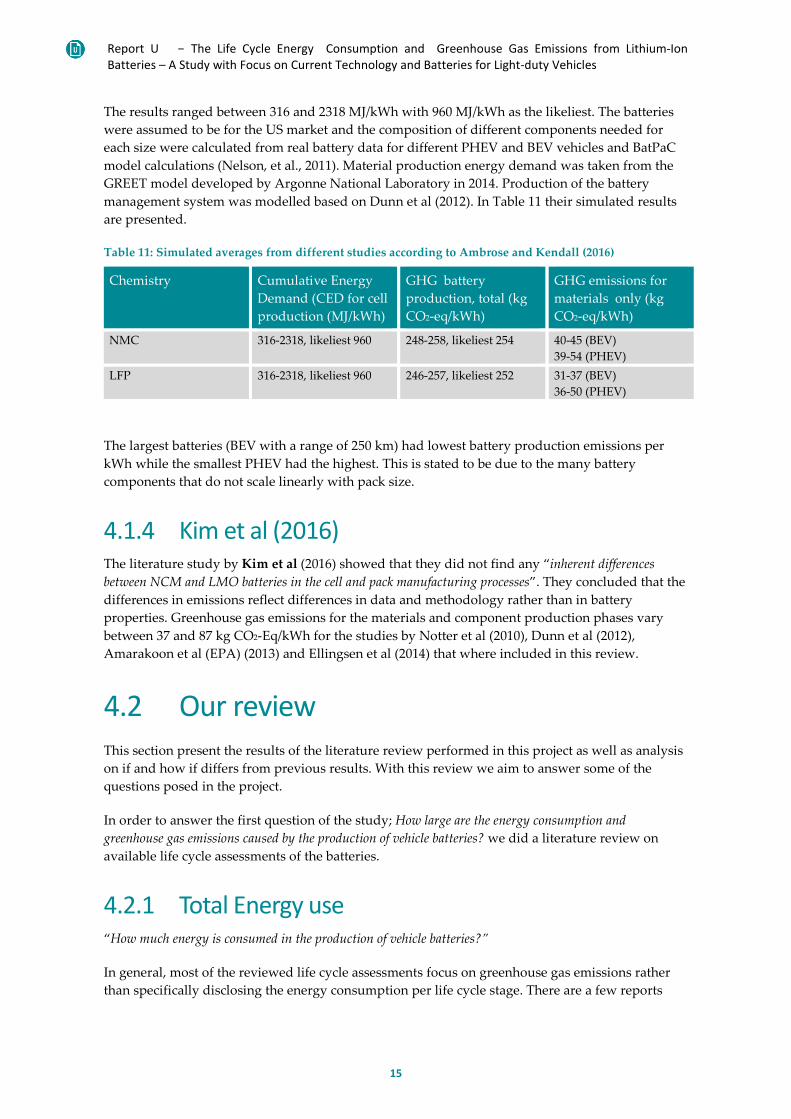
The results ranged between 316 and 2318 MJ/kWh with 960 MJ/kWh as the likeliest. The batteries were assumed to be for the US market and the composition of different components needed for each size were calculated from real battery data for different PHEV and BEV vehicles and BatPaC model calculations (Nelson, et al., 2011). Material production energy demand was taken from the GREET model developed by Argonne National Laboratory in 2014. Production of the battery management system was modelled based on Dunn et al (2012). In Table 11 their simulated results are presented.
Table 11: Simulated averages from different studies according to Ambrose and Kendall (2016)
Chemistry Cumulative Energy Demand (CED for cell production (MJ/kWh)
GHG battery production, total (kg CO2-eq/kWh)
GHG emissions for materials only (kg CO2-eq/kWh)
NMC 316-2318, likeliest 960 248-258, likeliest 254
40-45 (BEV) 39-54 (PHEV)
LFP 316-2318, likeliest 960 246-257, likeliest 252 31-37 (BEV) 36-50 (PHEV)
The largest batteries (BEV with a range of 250 km) had lowest battery production emissions per kWh while the smallest PHEV had the highest. This is stated to be due to the many battery components that do not scale linearly with pack size.
4.1.4 Kim et al (2016) The literature study by Kim et al (2016) showed that they did not find any “inherent differences between NCM and LMO batteries in the cell and pack manufacturing processes”. They concluded that the differences in emissions reflect differences in data and methodology rather than in battery properties. Greenhouse gas emissions for the materials and component production phases vary between 37 and 87 kg CO2-Eq/kWh for the studies by Notter et al (2010), Dunn et al (2012), Amarakoon et al (EPA) (2013) and Ellingsen et al (2014) that where included in this review.
4.2 Our review This section present the results of the literature review performed in this project as well as analysis on if and how if differs from previous results. With this review we aim to answer some of the questions posed in the project.
In order to answer the first question of the study; How large are the energy consumption and greenhouse gas emissions caused by the production of vehicle batteries? we did a literature review on available life cycle assessments of the batteries.
4.2.1 Total Energy use “How much energy is consumed in the production of vehicle batteries?”
In general, most of the reviewed life cycle assessments focus on greenhouse gas emissions rather than specifically disclosing the energy consumption per life cycle stage. There are a few reports
Report U The Life Cycle Energy Consumption and Greenhouse Gas Emissions from Lithium-Ion Batteries – A Study with Focus on Current Technology and Batteries for Light-duty Vehicles
16
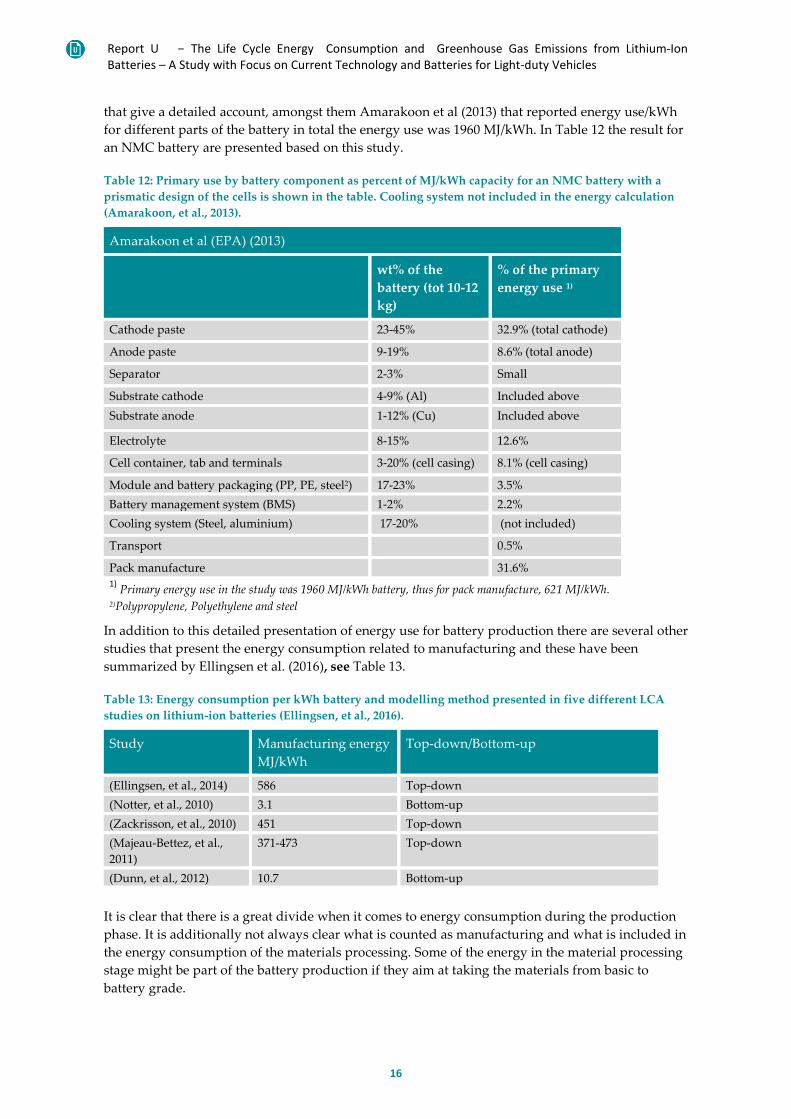
that give a detailed account, amongst them Amarakoon et al (2013) that reported energy use/kWh for different parts of the battery in total the energy use was 1960 MJ/kWh. In Table 12 the result for an NMC battery are presented based on this study.
Table 12: Primary use by battery component as percent of MJ/kWh capacity for an NMC battery with a prismatic design of the cells is shown in the table. Cooling system not included in the energy calculation (Amarakoon, et al., 2013).
Amarakoon et al (EPA) (2013)
wt% of the battery (tot 10-12 kg)
% of the primary energy use 1)
Cathode paste 23-45% 32.9% (total cathode)
Anode paste 9-19% 8.6% (total anode)
Separator 2-3% Small
Substrate cathode 4-9% (Al) Included above Substrate anode 1-12% (Cu) Included above
Electrolyte 8-15% 12.6%
Cell container, tab and terminals 3-20% (cell casing) 8.1% (cell casing)
Module and battery packaging (PP, PE, steel2) 17-23% 3.5% Battery management system (BMS) 1-2% 2.2% Cooling system (Steel, aluminium) 17-20% (not included)
Transport 0.5%
Pack manufacture 31.6% 1) Primary energy use in the study was 1960 MJ/kWh battery, thus for pack manufacture, 621 MJ/kWh. 2)Polypropylene, Polyethylene and steel
In addition to this detailed presentation of energy use for battery production there are several other studies that present the energy consumption related to manufacturing and these have been summarized by Ellingsen et al. (2016), see Table 13.
Table 13: Energy consumption per kWh battery and modelling method presented in five different LCA studies on lithium-ion batteries (Ellingsen, et al., 2016).
Study Manufacturing energy MJ/kWh
Top-down/Bottom-up
(Ellingsen, et al., 2014) 586 Top-down (Notter, et al., 2010) 3.1 Bottom-up (Zackrisson, et al., 2010) 451 Top-down (Majeau-Bettez, et al., 2011)
371-473 Top-down
(Dunn, et al., 2012) 10.7 Bottom-up
It is clear that there is a great divide when it comes to energy consumption during the production phase. It is additionally not always clear what is counted as manufacturing and what is included in the energy consumption of the materials processing. Some of the energy in the material processing stage might be part of the battery production if they aim at taking the materials from basic to battery grade.
Report U The Life Cycle Energy Consumption and Greenhouse Gas Emissions from Lithium-Ion Batteries – A Study with Focus on Current Technology and Batteries for Light-duty Vehicles
17
Some studied have used bottom-up approaches where they estimate the energy consumption of the different stages needed. It is likely that the top-down data is more complete and includes energy use from auxiliary processes connected to the manufacturing.
Ellingsen et al (2014) reported 586 MJ/kWh, mainly electricity, for manufacturing based on primary data from a battery manufacturer. The dry rooms contribute to a large extent to the electricity use. This exact value was taken from several months of measurements for cell manufacturing, and the value chosen was from a high production month as this best represent a future full scale production scenario. Since this value is based on a primary data source it makes the results highly relevant for future assessments.
In addition to the energy use in the manufacturing, mainly electricity, there is of course energy use upstream from the battery manufacturing. This data is not analyzed in itself, but is included when assessing greenhouse gas emissions since it is included in inventory data. This does, however, make assessing the total energy cost of turning the materials into a battery more difficult.
It seems, based on the data found, that the energy use for current battery manufacturing lies between 350 and 650 MJ/kWh.
4.2.2 Total greenhouse gas emissions “How much greenhouse gases are emitted in the production of vehicle batteries”
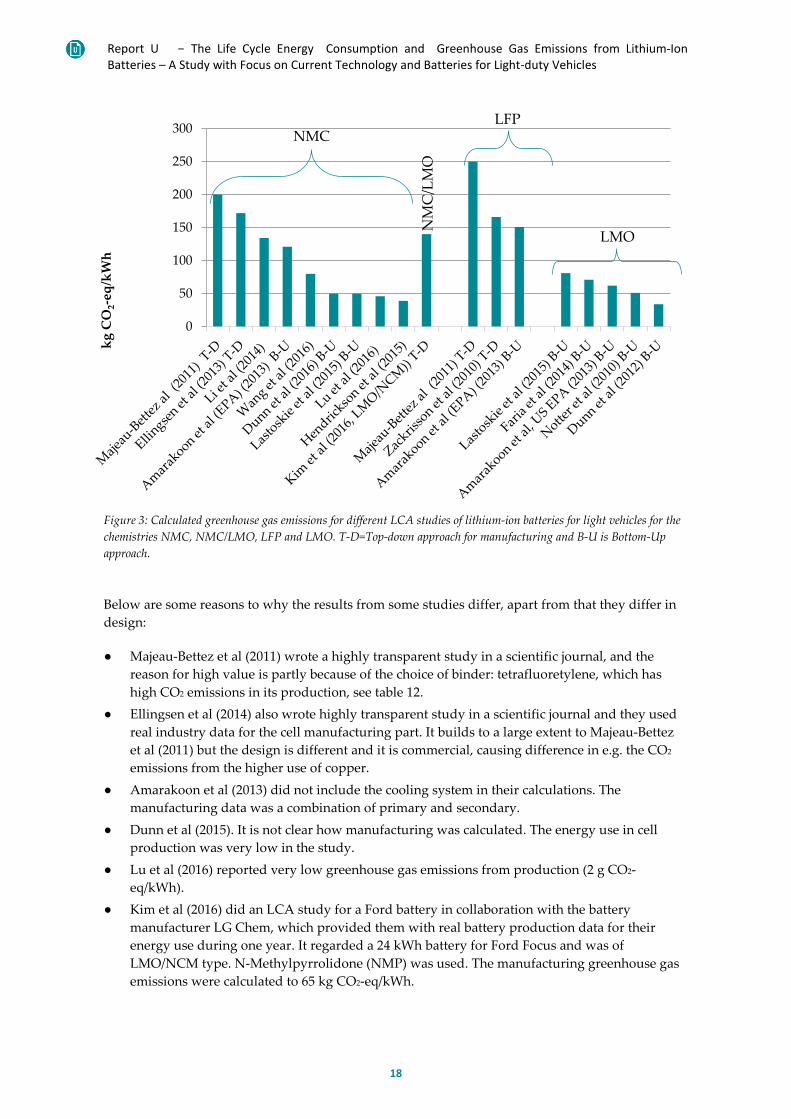
The results from our review on greenhouse gas emissions from battery production are shown in Figure 3. The results differ quite drastically, and this section dissects some of the reasons for the discrepancies. The studies also vary when it comes to transparency and whether they are peer reviewed and published in scientific journals.
Report U The Life Cycle Energy Consumption and Greenhouse Gas Emissions from Lithium-Ion Batteries – A Study with Focus on Current Technology and Batteries for Light-duty Vehicles
18
Figure 3: Calculated greenhouse gas emissions for different LCA studies of lithium-ion batteries for light vehicles for the chemistries NMC, NMC/LMO, LFP and LMO. T-D=Top-down approach for manufacturing and B-U is Bottom-Up approach.
Below are some reasons to why the results from some studies differ, apart from that they differ in design:
● Majeau-Bettez et al (2011) wrote a highly transparent study in a scientific journal, and the reason for high value is partly because of the choice of binder: tetrafluoretylene, which has high CO2 emissions in its production, see table 12.
● Ellingsen et al (2014) also wrote highly transparent study in a scientific journal and they used real industry data for the cell manufacturing part. It builds to a large extent to Majeau-Bettez et al (2011) but the design is different and it is commercial, causing difference in e.g. the CO2 emissions from the higher use of copper.
● Amarakoon et al (2013) did not include the cooling system in their calculations. The manufacturing data was a combination of primary and secondary.
● Dunn et al (2015). It is not clear how manufacturing was calculated. The energy use in cell production was very low in the study.
● Lu et al (2016) reported very low greenhouse gas emissions from production (2 g CO2-eq/kWh).
● Kim et al (2016) did an LCA study for a Ford battery in collaboration with the battery manufacturer LG Chem, which provided them with real battery production data for their energy use during one year. It regarded a 24 kWh battery for Ford Focus and was of LMO/NCM type. N-Methylpyrrolidone (NMP) was used. The manufacturing greenhouse gas emissions were calculated to 65 kg CO2-eq/kWh.
0
50
100
150
200
250
300
kg C
O2-e
q/kW
h
NMC LFP
LMO NM
C/L
MO

Report U The Life Cycle Energy Consumption and Greenhouse Gas Emissions from Lithium-Ion Batteries – A Study with Focus on Current Technology and Batteries for Light-duty Vehicles
19
● Zackrisson et al (2010) had water instead of NMP in their hypothetical manufacturing. Anode weight low (4.8% of battery while Ellingsen et al (2014) calculated with 22%)
● Notter et al (2010) used expert estimations for cell manufacturing, which contributed with only 0.9 kg CO2-eq/kWh.
There may be more explanations for the differences, but given that the studies report in different ways, are more or less transparent, and the design of the batteries differ, a very deep level analysis is required to further answer for the differences.
In general, as Nordelöf et al (2014) also conclude, most articles are non-transparent and there are usually information gaps in the goal and scope reporting.
4.2.3 Greenhouse gas emissions per production stage It is not always easy to determine which emissions occur from what stage in the production. Most common is that the emissions from the battery components are presented (anode, cathode etc) but that it is not divided between material mining and refining and further processing. The manufacturing and assembly is often shown separately, but again the line between material processing and assembly is not clear cut.
In this review we have chosen to attempt to divide the impact between;
1. Mining and refining 2. Material processing (includes step one plus battery grade processing) 3. Manufacturing/assembly (components to full battery) In an attempt to answer the question “What are the greenhouse gas emissions related to different production steps including mining, processing and assembly?” we have assessed firstly the available inventory data for the different materials. This gives an insight into the order of magnitude of the emissions related to mining and refining (stage 1), as well as giving understanding of the uncertainties introduced already in this stage.
In the reviewed life cycle assessments, the mining and refining is incorporated in the presented material processing data of stage 2. It is often hard to know the exact choice of background data in each study (although some are more transparent than others). Despite that there thus is no direct link between the presented results for stage 1 and 2, a look at the available background data for mining and refining can help us understand the order of magnitude this stage contributes.
The data for the different stages are presented in three sub-sections below, one covering each stage. Stage 1 is collected from available databases, stage 2 and 3 are collected from the reviewed LCAs. In the end of this section, in 4.4, an overview of all the stages can be found.
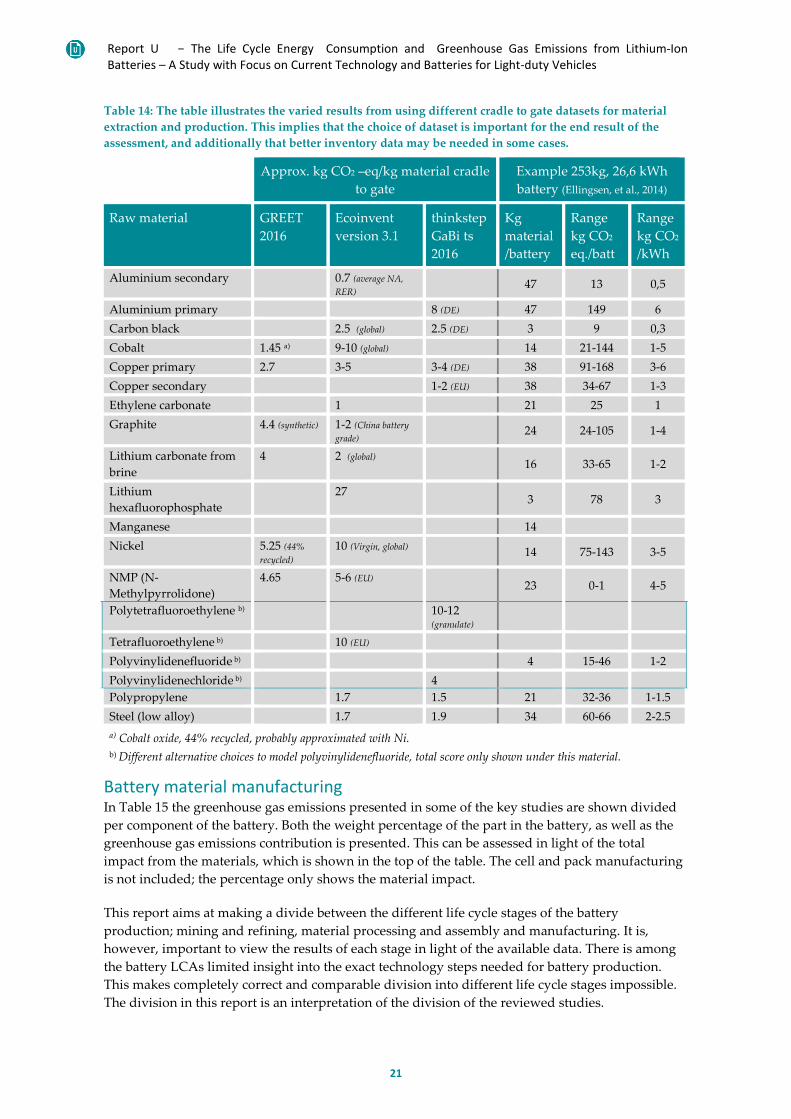
Material mining and refining When it comes to material mining and refining data differ between databases, as exemplified in Table 14. In addition to this difference between sources, the data chosen in the studied LCAs differ also because they vary between secondary and primary metal. It is clear that this impacts the result, but it is not always clear from the study the share of each type used in the calculated. In addition to this, the battery designs differ.

Report U The Life Cycle Energy Consumption and Greenhouse Gas Emissions from Lithium-Ion Batteries – A Study with Focus on Current Technology and Batteries for Light-duty Vehicles
20
An additional problem encountered when reviewing LCA studies is that even if the dataset has a reference, the data may have changed since the study was done, since the databases are updated and improved.
If GaBi (PE International, 2012) or Ecoinvent (Althaus, et al., 2007) data were used, one needs to have the purchased database which can make the data less accessible. GREET (ANL, 2014) is for free, which is an advantage. It is to more or less extent difficult to trace back to where, when and how data were retrieved and the LCI data may also have changed after the study. One example where data have changed was found in the project report for Lithorec (Buchert, et al., 2011b). The greenhouse gas emissions varied between 90 (GaBi) and 8.8 (Ecoinvent) kg CO2-eq/kg for primary cobalt and 19.1 (GaBi) and 11.2 (Ecoinvent) kg CO2-eq/kg for primary nickel.
Report U The Life Cycle Energy Consumption and Greenhouse Gas Emissions from Lithium-Ion Batteries – A Study with Focus on Current Technology and Batteries for Light-duty Vehicles
21
Table 14: The table illustrates the varied results from using different cradle to gate datasets for material extraction and production. This implies that the choice of dataset is important for the end result of the assessment, and additionally that better inventory data may be needed in some cases.
Approx. kg CO2 –eq/kg material cradle to gate
Example 253kg, 26,6 kWh battery (Ellingsen, et al., 2014)
Raw material GREET 2016
Ecoinvent version 3.1
thinkstep GaBi ts 2016
Kg material/battery
Range kg CO2 eq./batt
Range kg CO2 /kWh
Aluminium secondary 0.7 (average NA, RER)
47 13 0,5
Aluminium primary 8 (DE) 47 149 6 Carbon black 2.5 (global) 2.5 (DE) 3 9 0,3 Cobalt 1.45 a) 9-10 (global) 14 21-144 1-5 Copper primary 2.7 3-5 3-4 (DE) 38 91-168 3-6 Copper secondary 1-2 (EU) 38 34-67 1-3 Ethylene carbonate 1 21 25 1 Graphite 4.4 (synthetic) 1-2 (China battery
grade) 24 24-105 1-4
Lithium carbonate from brine
4 2 (global) 16 33-65 1-2
Lithium hexafluorophosphate
27 3 78 3
Manganese 14 Nickel 5.25 (44%
recycled) 10 (Virgin, global) 14 75-143 3-5
NMP (N-Methylpyrrolidone)
4.65 5-6 (EU) 23 0-1 4-5
Polytetrafluoroethylene b) 10-12 (granulate)
Tetrafluoroethylene b) 10 (EU)
Polyvinylidenefluoride b) 4 15-46 1-2 Polyvinylidenechloride b) 4
Polypropylene 1.7 1.5 21 32-36 1-1.5 Steel (low alloy) 1.7 1.9 34 60-66 2-2.5 a) Cobalt oxide, 44% recycled, probably approximated with Ni. b) Different alternative choices to model polyvinylidenefluoride, total score only shown under this material.
Battery material manufacturing In Table 15 the greenhouse gas emissions presented in some of the key studies are shown divided per component of the battery. Both the weight percentage of the part in the battery, as well as the greenhouse gas emissions contribution is presented. This can be assessed in light of the total impact from the materials, which is shown in the top of the table. The cell and pack manufacturing is not included; the percentage only shows the material impact.
This report aims at making a divide between the different life cycle stages of the battery production; mining and refining, material processing and assembly and manufacturing. It is, however, important to view the results of each stage in light of the available data. There is among the battery LCAs limited insight into the exact technology steps needed for battery production. This makes completely correct and comparable division into different life cycle stages impossible. The division in this report is an interpretation of the division of the reviewed studies.
Report U The Life Cycle Energy Consumption and Greenhouse Gas Emissions from Lithium-Ion Batteries – A Study with Focus on Current Technology and Batteries for Light-duty Vehicles
22
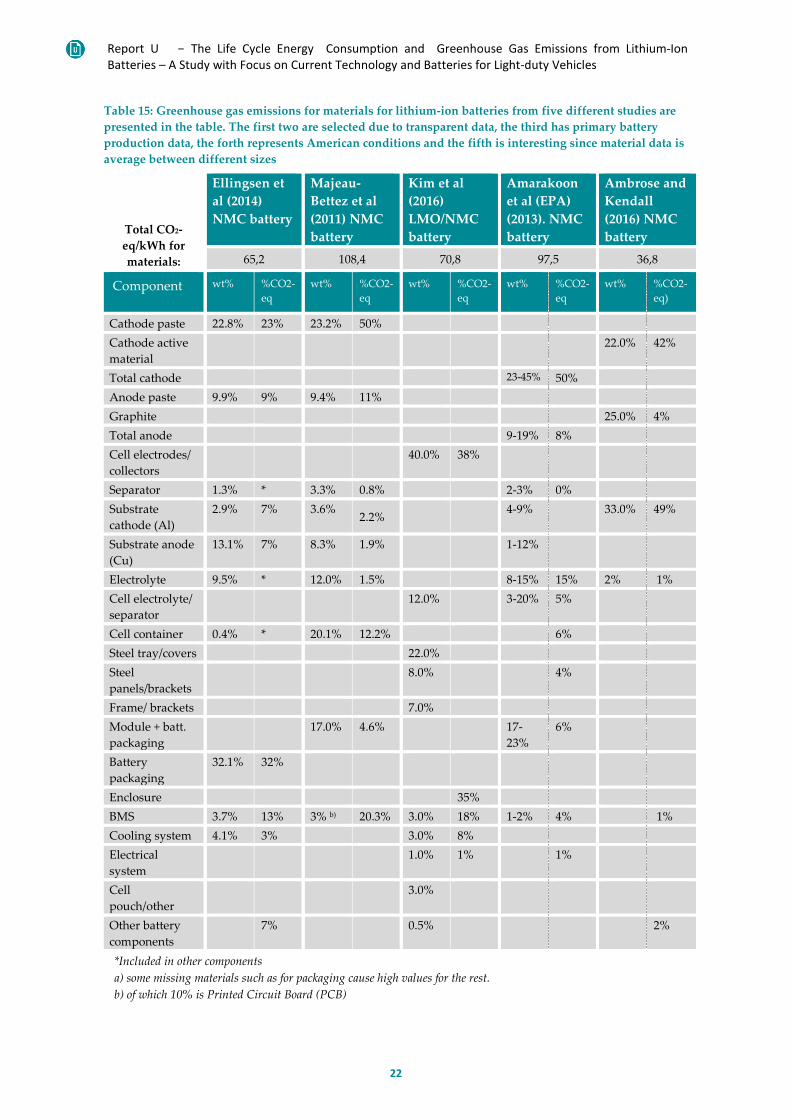
Table 15: Greenhouse gas emissions for materials for lithium-ion batteries from five different studies are presented in the table. The first two are selected due to transparent data, the third has primary battery production data, the forth represents American conditions and the fifth is interesting since material data is average between different sizes
Total CO2-eq/kWh for materials:
Ellingsen et al (2014) NMC battery
Majeau-Bettez et al (2011) NMC battery
Kim et al (2016) LMO/NMC battery
Amarakoon et al (EPA) (2013). NMC battery
Ambrose and Kendall (2016) NMC battery
65,2 108,4 70,8 97,5 36,8
Component wt% %CO2-eq
wt% %CO2-eq
wt% %CO2-eq
wt% %CO2-eq
wt% %CO2-eq)
Cathode paste 22.8% 23% 23.2% 50% Cathode active material
22.0% 42%
Total cathode 23-45% 50% Anode paste 9.9% 9% 9.4% 11% Graphite 25.0% 4% Total anode 9-19% 8% Cell electrodes/ collectors
40.0% 38%
Separator 1.3% * 3.3% 0.8% 2-3% 0% Substrate cathode (Al)
2.9% 7% 3.6% 2.2% 4-9% 33.0% 49%
Substrate anode (Cu)
13.1% 7% 8.3% 1.9% 1-12%
Electrolyte 9.5% * 12.0% 1.5% 8-15% 15% 2% 1% Cell electrolyte/ separator
12.0% 3-20% 5%
Cell container 0.4% * 20.1% 12.2% 6% Steel tray/covers 22.0% Steel panels/brackets
8.0% 4%
Frame/ brackets 7.0% Module + batt. packaging
17.0% 4.6% 17-23%
6%
Battery packaging
32.1% 32%
Enclosure 35% BMS 3.7% 13% 3% b) 20.3% 3.0% 18% 1-2% 4% 1% Cooling system 4.1% 3% 3.0% 8% Electrical system
1.0% 1% 1%
Cell pouch/other
3.0%
Other battery components
7% 0.5% 2%
*Included in other components a) some missing materials such as for packaging cause high values for the rest. b) of which 10% is Printed Circuit Board (PCB)
Report U The Life Cycle Energy Consumption and Greenhouse Gas Emissions from Lithium-Ion Batteries – A Study with Focus on Current Technology and Batteries for Light-duty Vehicles
23
What becomes clear in Table 15 is that the nomenclature differs and adds difficulty to compare studies. Regardless, the production of the cathode materials is highly greenhouse gas emitting followed by anode and electrolyte. The metal collectors and the packaging may also cause large emissions, but it depends on amounts, and material choice. The GHG emissions value for the aluminium reported by Ambrose and Kendall (2016) is exceptionally high. Regarding electronics (battery management system) and battery packaging, data differ depending on composition and LCI data.
Materials for the packaging vary and consequently the greenhouse gas emissions from their production. In Ellingsen et al (2014) packaging includes module packaging, battery retention and battery tray. Materials are aluminum (approx. 30 kg modelled with 68% virgin), 30 kg steel (approx. 30 kg, modelled with 51% primary), nylon (approx. 20 kg) and copper (approx. 1 kg, modelled with 85% primary). In Majeau-Bettez (2011) the module and battery packaging consists of polyethylene terephthalate (PET) and in Amarakoon et al (2013) it consists of polyethylene, PET and steel. In Kim et al (2016) enclosure consists of mainly steel but also plastics and composites.
Aluminium has high greenhouse gas emissions from primary production, but much lower for secondary. Steel and plastic have relatively low emissions, compared to primary aluminium. Considering the variation between different types of material, as well as the variations between primary and secondary we get a better understanding of why the impact from packaging may vary so much.
This assessment of the variations is to a large extent in line with Ellingsen et al (2016), see section 4.1.2, but they saw a large variation also for the separator. They also found that the anode causes higher greenhouse gas emissions than the electrolyte.
Cell and pack manufacturing Acknowledging that Ellingsen et al (2014) and Kim et al (2016) used real cell manufacturer data, and a top-down approach, we can see that the greenhouse gas emissions vary for their studies between 45% with Korean electricity (Kim, et al., 2016) and 62% with East Asian electricity (Ellingsen, et al., 2014) of the total for the battery production for a cell producer.
In addition to these primary data, Majeau-Bettez et al. (2011) and Amarakoon et al. (2013) include manufacturing data, but it is based on literature and calculation. Dunn et al (2015) concluded from their own LCA study that the assembly stage is of major concern only for “pioneer plants”, but for at-capacity plants the battery materials dominate with cathode materials representing 10-50% of energy input depending on cathode type, based on data for US.
Table 16 shows an overview of the studies and their reported relation between the impact from the materials production and the manufacturing. The electricity consumption in the manufacturing stage is of great importance to the results. As discussed previously, the division between material processing and manufacturing is not clear, nor even fully technically defined. It is possible that some of the electricity use could in the future be found to correspond to material processing, while it is current viewed and manufacturing. The most important factor for division may be what processes that must be performed in the same location and the electricity mix used there.
Report U The Life Cycle Energy Consumption and Greenhouse Gas Emissions from Lithium-Ion Batteries – A Study with Focus on Current Technology and Batteries for Light-duty Vehicles
24
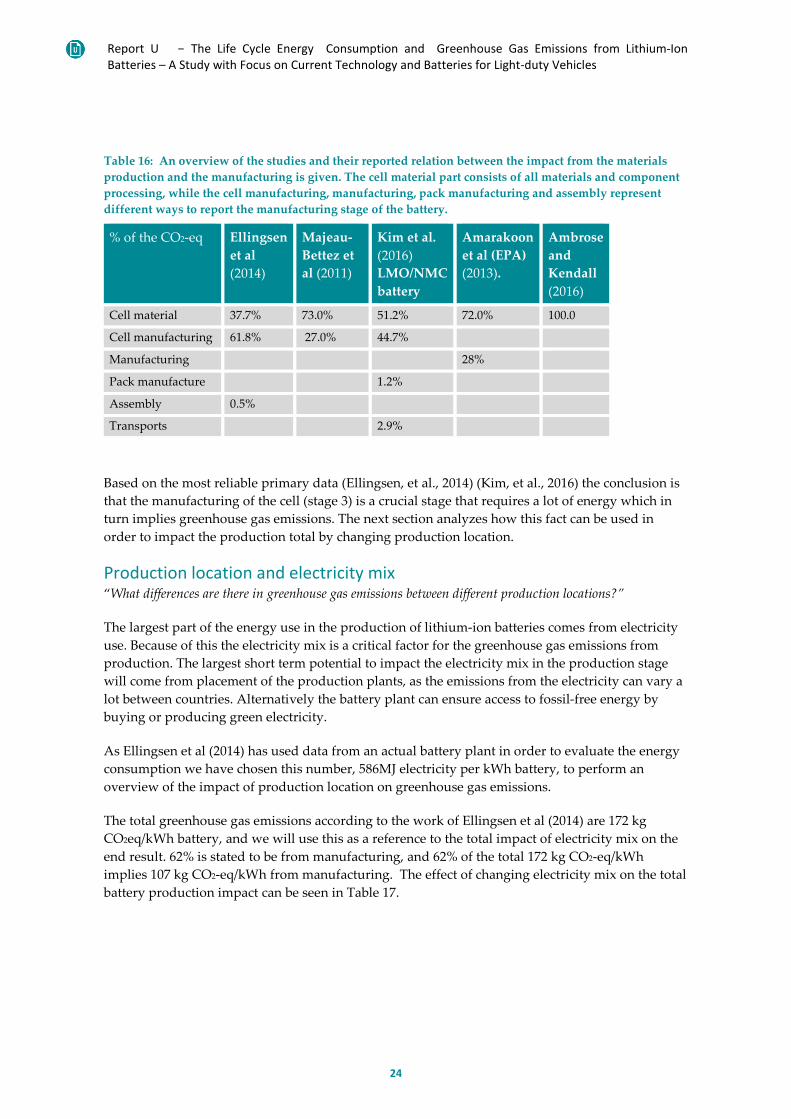
Table 16: An overview of the studies and their reported relation between the impact from the materials production and the manufacturing is given. The cell material part consists of all materials and component processing, while the cell manufacturing, manufacturing, pack manufacturing and assembly represent different ways to report the manufacturing stage of the battery.
% of the CO2-eq Ellingsen et al (2014)
Majeau-Bettez et al (2011)
Kim et al. (2016) LMO/NMC battery
Amarakoon et al (EPA) (2013).
Ambrose and Kendall (2016)
Cell material 37.7% 73.0% 51.2% 72.0% 100.0
Cell manufacturing 61.8% 27.0% 44.7%
Manufacturing 28%
Pack manufacture 1.2%
Assembly 0.5%
Transports 2.9%
Based on the most reliable primary data (Ellingsen, et al., 2014) (Kim, et al., 2016) the conclusion is that the manufacturing of the cell (stage 3) is a crucial stage that requires a lot of energy which in turn implies greenhouse gas emissions. The next section analyzes how this fact can be used in order to impact the production total by changing production location.
Production location and electricity mix “What differences are there in greenhouse gas emissions between different production locations?”
The largest part of the energy use in the production of lithium-ion batteries comes from electricity use. Because of this the electricity mix is a critical factor for the greenhouse gas emissions from production. The largest short term potential to impact the electricity mix in the production stage will come from placement of the production plants, as the emissions from the electricity can vary a lot between countries. Alternatively the battery plant can ensure access to fossil-free energy by buying or producing green electricity.
As Ellingsen et al (2014) has used data from an actual battery plant in order to evaluate the energy consumption we have chosen this number, 586MJ electricity per kWh battery, to perform an overview of the impact of production location on greenhouse gas emissions.
The total greenhouse gas emissions according to the work of Ellingsen et al (2014) are 172 kg CO2eq/kWh battery, and we will use this as a reference to the total impact of electricity mix on the end result. 62% is stated to be from manufacturing, and 62% of the total 172 kg CO2-eq/kWh implies 107 kg CO2-eq/kWh from manufacturing. The effect of changing electricity mix on the total battery production impact can be seen in Table 17.
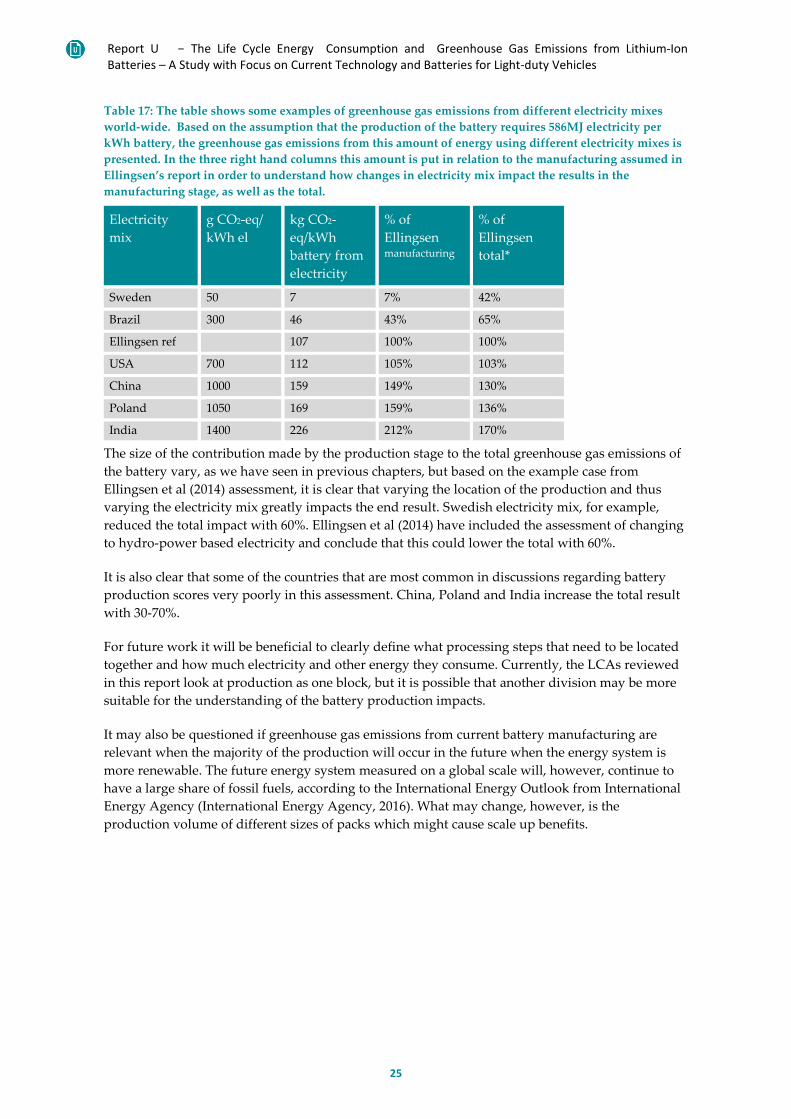
Report U The Life Cycle Energy Consumption and Greenhouse Gas Emissions from Lithium-Ion Batteries – A Study with Focus on Current Technology and Batteries for Light-duty Vehicles
25
Table 17: The table shows some examples of greenhouse gas emissions from different electricity mixes world-wide. Based on the assumption that the production of the battery requires 586MJ electricity per kWh battery, the greenhouse gas emissions from this amount of energy using different electricity mixes is presented. In the three right hand columns this amount is put in relation to the manufacturing assumed in Ellingsen’s report in order to understand how changes in electricity mix impact the results in the manufacturing stage, as well as the total.
Electricity mix
g CO2-eq/ kWh el
kg CO2-eq/kWh battery from electricity
% of Ellingsen manufacturing
% of Ellingsen total*
Sweden 50 7 7% 42%
Brazil 300 46 43% 65%
Ellingsen ref 107 100% 100%
USA 700 112 105% 103%
China 1000 159 149% 130%
Poland 1050 169 159% 136%
India 1400 226 212% 170%
The size of the contribution made by the production stage to the total greenhouse gas emissions of the battery vary, as we have seen in previous chapters, but based on the example case from Ellingsen et al (2014) assessment, it is clear that varying the location of the production and thus varying the electricity mix greatly impacts the end result. Swedish electricity mix, for example, reduced the total impact with 60%. Ellingsen et al (2014) have included the assessment of changing to hydro-power based electricity and conclude that this could lower the total with 60%.
It is also clear that some of the countries that are most common in discussions regarding battery production scores very poorly in this assessment. China, Poland and India increase the total result with 30-70%.
For future work it will be beneficial to clearly define what processing steps that need to be located together and how much electricity and other energy they consume. Currently, the LCAs reviewed in this report look at production as one block, but it is possible that another division may be more suitable for the understanding of the battery production impacts.
It may also be questioned if greenhouse gas emissions from current battery manufacturing are relevant when the majority of the production will occur in the future when the energy system is more renewable. The future energy system measured on a global scale will, however, continue to have a large share of fossil fuels, according to the International Energy Outlook from International Energy Agency (International Energy Agency, 2016). What may change, however, is the production volume of different sizes of packs which might cause scale up benefits.
Report U The Life Cycle Energy Consumption and Greenhouse Gas Emissions from Lithium-Ion Batteries – A Study with Focus on Current Technology and Batteries for Light-duty Vehicles
26
4.3 Trends concerning greenhouse gas emissions
There are of course a huge number of trends that can and will influence the energy use and greenhouse gas emissions related to battery production. Based on the review of production emissions presented in the previous chapter we will discuss how a few of the largest trend might impact the results.
4.3.1 Larger batteries One clear trend in the vehicle battery development is the move towards larger batteries. This leads us to the question; ”Do emissions scale with the battery weight and kWh in a linear or non-linear fashion?”
The demand for extended electric drive range in both BEVs and PHEVs is creating a demand for larger packs, as discussed in section 3.3. As long as the chemistry stays unchanged this will with all certainly imply more active material in the cells. This can be done either by increasing the number of cells, or by redesigning them to contain more active material.
Whether or not the increase storage capacity changes the total dimension of the pack depends on how large the change is and if it is coupled with a corresponding development in cell management and performance. If there is a need for a larger pack, the supporting and structural materials like aluminium and steel will increase in weight, leading to higher emissions in production as well as when driving. If the added cell material instead can be incorporated into a design of the same dimensions this implies an improvement in the production CO2 per kWh stored energy performance.
Due to the impact from the passive and supporting material (i.e. casing and electronics) it is unlikely that scaling up the packs will lead to a totally linear scaling of the energy consumption and emissions during its production. Examples of factors that point towards this conclusion are;
● The need for managing electronics is similar between packs of different sizes (Nelson, et al., 2011).
● Over-head emissions like heating, ventilation and standby costs are unlikely to increase. ● Larger packs imply larger production volumes which could hold potential for reducing
production impacts per kg product. In additions to these factors one should also have in mind when looking at this question that it is only one small part of the overlying question of how an increased electric range impacts the emissions. In this question the size of the pack is one part, but also how it impacts the driveline, the driving, the production techniques and production volumes.
Regardless of how the energy storage increase is realized the increased need for active material will influence the emission from battery pack production since the anode and cathode contribute a large part of the impact. The percent increase of greenhouse gas emissions when going towards larger packs is presented in Table 18, based on a statistic assessment of production data from LCAs performed by Ambrose & Kendall (2016). The values presented are the most probable greenhouse gas emissions per kWh. In general the probability of different greenhouse gas emissions per kWh is more evenly distributed for low energy packs, implying that it is more uncertain how much these
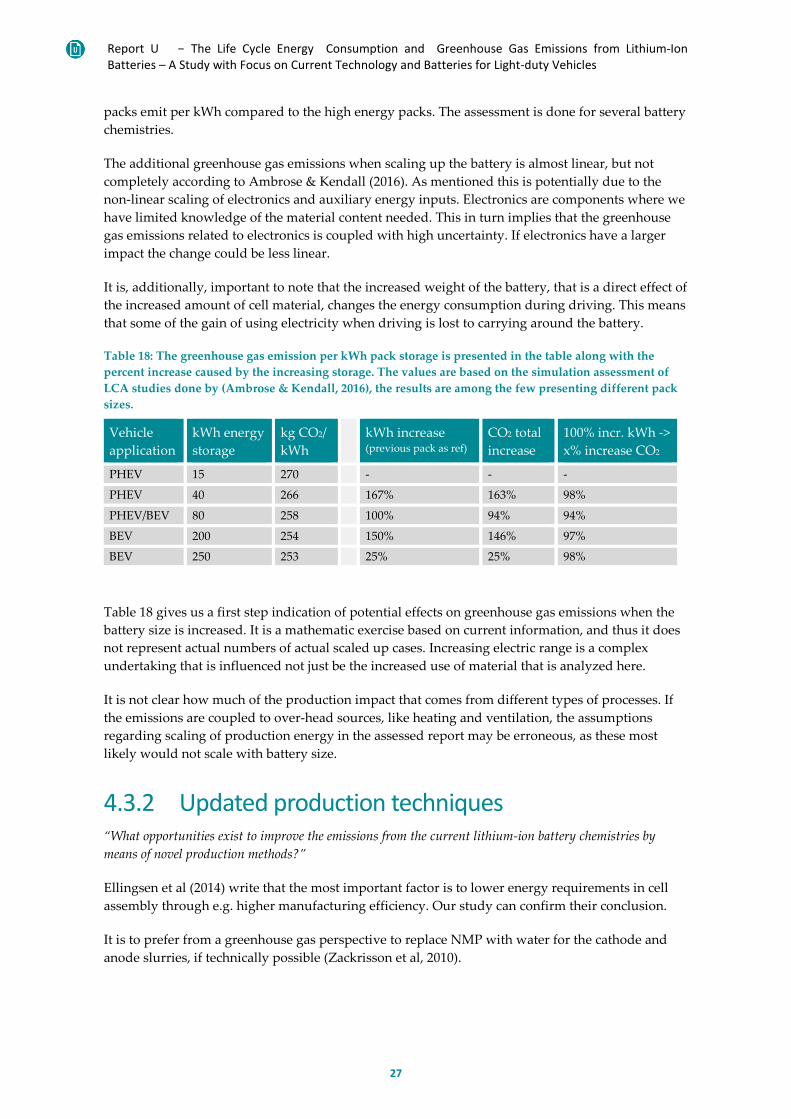
Report U The Life Cycle Energy Consumption and Greenhouse Gas Emissions from Lithium-Ion Batteries – A Study with Focus on Current Technology and Batteries for Light-duty Vehicles
27
packs emit per kWh compared to the high energy packs. The assessment is done for several battery chemistries.
The additional greenhouse gas emissions when scaling up the battery is almost linear, but not completely according to Ambrose & Kendall (2016). As mentioned this is potentially due to the non-linear scaling of electronics and auxiliary energy inputs. Electronics are components where we have limited knowledge of the material content needed. This in turn implies that the greenhouse gas emissions related to electronics is coupled with high uncertainty. If electronics have a larger impact the change could be less linear.
It is, additionally, important to note that the increased weight of the battery, that is a direct effect of the increased amount of cell material, changes the energy consumption during driving. This means that some of the gain of using electricity when driving is lost to carrying around the battery.
Table 18: The greenhouse gas emission per kWh pack storage is presented in the table along with the percent increase caused by the increasing storage. The values are based on the simulation assessment of LCA studies done by (Ambrose & Kendall, 2016), the results are among the few presenting different pack sizes.
Vehicle application
kWh energy storage
kg CO2/ kWh
kWh increase (previous pack as ref)
CO2 total increase
100% incr. kWh -> x% increase CO2
PHEV 15 270 - - -
PHEV 40 266 167% 163% 98%
PHEV/BEV 80 258 100% 94% 94%
BEV 200 254 150% 146% 97%
BEV 250 253 25% 25% 98%
Table 18 gives us a first step indication of potential effects on greenhouse gas emissions when the battery size is increased. It is a mathematic exercise based on current information, and thus it does not represent actual numbers of actual scaled up cases. Increasing electric range is a complex undertaking that is influenced not just be the increased use of material that is analyzed here.
It is not clear how much of the production impact that comes from different types of processes. If the emissions are coupled to over-head sources, like heating and ventilation, the assumptions regarding scaling of production energy in the assessed report may be erroneous, as these most likely would not scale with battery size.
4.3.2 Updated production techniques “What opportunities exist to improve the emissions from the current lithium-ion battery chemistries by means of novel production methods?”
Ellingsen et al (2014) write that the most important factor is to lower energy requirements in cell assembly through e.g. higher manufacturing efficiency. Our study can confirm their conclusion.
It is to prefer from a greenhouse gas perspective to replace NMP with water for the cathode and anode slurries, if technically possible (Zackrisson et al, 2010).
Report U The Life Cycle Energy Consumption and Greenhouse Gas Emissions from Lithium-Ion Batteries – A Study with Focus on Current Technology and Batteries for Light-duty Vehicles
28
It seems that the current choice of production location for the battery production is based in labor costs more than other factors (Berg 2017). Increased automation of the production and manufacturing might make the placement of the factories more flexible, in turn allowing the producers to choose location based on more environment-oriented parameters like a fossil free electricity mix.
The fact that the production location is chosen based on labor cost also indicates that environmental demands on the batteries should be placed on component level so that the effect of these productions sites is included. Making sure that the production is included is one way to ensure that there is incentive to choose environmentally beneficial production locations or to make efforts to use low carbon electricity when producing in countries with bad electricity mixes.
4.3.3 Novel cell materials The trend of moving towards cells with more nickel and less cobalt, discussed in section 3.3.1, is near-future development of the current NMC chemistry. As we have seen in this chapter, this will most likely not impact the greenhouse gas emissions greatly, as the cathode material choice has a relatively small impact of the total result. Nickel and cobalt have similar impacts from the material stage.
The future lithium-ion battery technologies that are most discussed at the moment, see section 3.3, are interesting from an environmental perspective as they do not contain a metal cathode. Instead of cobalt, nickel, manganese and aluminium the cells are based on lithium metal and sulfur or air. Lithium itself will thus still remain as a bottle neck, but the contributions to greenhouse gas emissions from cobalt and nickel can be removed. As we will see in the coming chapter on recycling, however, this also implies that the economic incentive to recycle the cells will be removed, making the risk of lithium shortage even larger.
What will be the main question for the emissions is, however, if these new materials will impact the production stage. If lower energy consumption can be achieved this will benefit the production, since manufacturing contributes such a large amount.
4.4 Conclusions regarding greenhouse gas emissions and energy use
Based on the information presented in this chapter this review draws the following conclusions;
4. There is no consensus on nomenclature or component division between the LCAs, making comparison difficult
5. There is (in general) a lack of transparency in the studies 6. The studies indicate greenhouse gas emissions of 120-250 kg CO2-eq/kWh. Based on the
assessment of transparency and scientific method this report views a range of 150-200 kg CO2-eq/kWh as the most likely impact.
7. The greenhouse gas emissions of the production stage vary in the studies, mainly due to; a. Uncertain production data due to estimates, poor data and pilot scale methods b. Differences in material data modeling and approximation of materials to similar ones
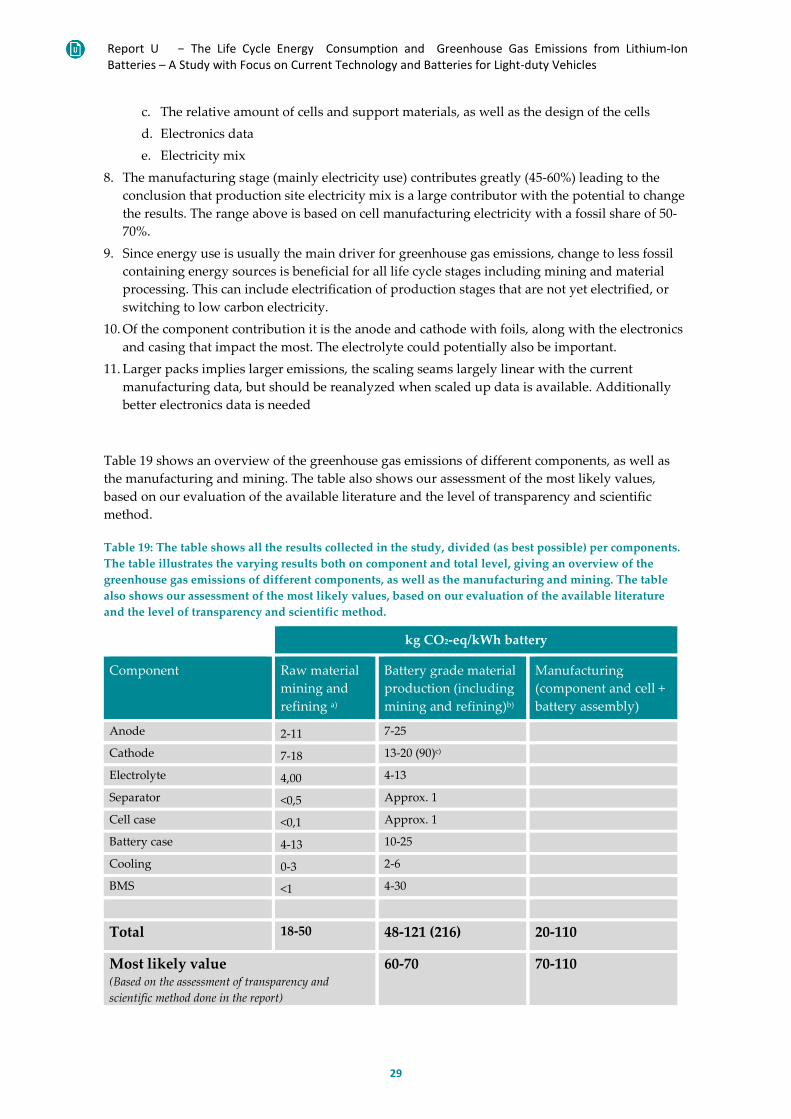
Report U The Life Cycle Energy Consumption and Greenhouse Gas Emissions from Lithium-Ion Batteries – A Study with Focus on Current Technology and Batteries for Light-duty Vehicles
29
c. The relative amount of cells and support materials, as well as the design of the cells d. Electronics data e. Electricity mix
8. The manufacturing stage (mainly electricity use) contributes greatly (45-60%) leading to the conclusion that production site electricity mix is a large contributor with the potential to change the results. The range above is based on cell manufacturing electricity with a fossil share of 50-70%.
9. Since energy use is usually the main driver for greenhouse gas emissions, change to less fossil containing energy sources is beneficial for all life cycle stages including mining and material processing. This can include electrification of production stages that are not yet electrified, or switching to low carbon electricity.
10. Of the component contribution it is the anode and cathode with foils, along with the electronics and casing that impact the most. The electrolyte could potentially also be important.
11. Larger packs implies larger emissions, the scaling seams largely linear with the current manufacturing data, but should be reanalyzed when scaled up data is available. Additionally better electronics data is needed
Table 19 shows an overview of the greenhouse gas emissions of different components, as well as the manufacturing and mining. The table also shows our assessment of the most likely values, based on our evaluation of the available literature and the level of transparency and scientific method.
Table 19: The table shows all the results collected in the study, divided (as best possible) per components. The table illustrates the varying results both on component and total level, giving an overview of the greenhouse gas emissions of different components, as well as the manufacturing and mining. The table also shows our assessment of the most likely values, based on our evaluation of the available literature and the level of transparency and scientific method.
kg CO2-eq/kWh battery
Component Raw material mining and refining a)
Battery grade material production (including mining and refining)b)
Manufacturing (component and cell + battery assembly)
Anode 2-11 7-25
Cathode 7-18 13-20 (90)c)
Electrolyte 4,00 4-13
Separator <0,5 Approx. 1
Cell case <0,1 Approx. 1
Battery case 4-13 10-25
Cooling 0-3 2-6
BMS <1 4-30
Total 18-50 48-121 (216) 20-110
Most likely value (Based on the assessment of transparency and scientific method done in the report)
60-70 70-110
Report U The Life Cycle Energy Consumption and Greenhouse Gas Emissions from Lithium-Ion Batteries – A Study with Focus on Current Technology and Batteries for Light-duty Vehicles
30
a) Example based on material needed for a 253 kg battery, ref Ellingsen et al (2014), and data from Table 14. b) Ranges based on review of battery LCAs, as presented in Table 15
c) Values in (brackets) are based on a report with approximate assumptions regarding processing materials (Majeau-Bettez, et al., 2011).
Looking at the results from all the life cycle stages, the main indication is that assembly and manufacturing of the battery stands for about half of the greenhouse gas impact. The materials together, including all their life cycle stages from mining to refining and battery grad processing contributes the other half. There are great uncertainties in the data, but the results of this study indicate that the processing of the material has slightly higher impact than the mining and refining.
It is interesting to note the uncertainty in the data can change what component that is most impactful, which of course has implications on where in the production chain changes of location and techniques have the most benefits.
As previously discussed, it is clear that the data differ, especially for assembly. For the cathode, the highest value was removed from the range, as the approximation of using polytetrachoroethylene as done by Majeau-Bettez et al (2011) was deemed too extreme.
5 Lithium-ion battery recycling - energy use and greenhouse gas emissions
Recycling is often thought of as a material question. It is in most cases clear cut that recycling saves materials, which is absolutely necessary for the long term sustainability of lithium-ion batteries. Depending on chemistry, the economic incentive for material recycling however varies, with cobalt and nickel being the primary driving factors.
This aspect is important to consider as the economic value of the material not always aligns with the greenhouse gas emissions and energy consumption related to the materials, and the potential savings in these areas. As an example of this, LFP batteries contain no economically valuable metals and thus have very low incentive for recycling. Regardless of this the cells still contains aluminium, which has a high greenhouse gas emissions from production and a well-developed recycling chain that is not utilized. Lithium is another material that is not salvaged.
Looking further the aspect of material shortage should not be ignored, regardless if it is long term scarcity or short term supply bottle necks. Current recycling is highly focused on the current economic value and does little to ensure that the development of electric vehicles is not hindered by supply problems.

Report U The Life Cycle Energy Consumption and Greenhouse Gas Emissions from Lithium-Ion Batteries – A Study with Focus on Current Technology and Batteries for Light-duty Vehicles
31
5.1 Current demands on lithium-ion battery recycling
An important starting place for the discussion about recycling of lithium-ion batteries is the questions of what demands, policies and legislation that are necessary to ensure the recycling needed for a large scale implementation. A first step is to understand the question “what demands are placed on vehicle recycling today”. This section aims to give an answer to that question.
Directives The European Directive of End-of Life Vehicle (ELV, 2000/53/EC) is an extended producers responsibility directive and it regards vehicles that have a weight below 3500 kg. It stipulates that 85% of the vehicles shall be reused or material recycled. The so called battery directive 2006/66/EG instructs on how different batteries should be recycled. Additionally, there is the EU commission regulation 493/2012 that defines how the recyclability rate should be calculated (Hall, et al., 2014).
The battery directive includes a producer responsibility, stating that the actor putting the battery on the market is responsible for its collection and recycling
The obligations are the following:
1. Collect 95% of the total number of batteries that have been put on the market
2. Recycle 50% of the total weight of the collected batteries
3. Report on collected and recycled batteries to authority.
The batteries shall be marked with a picture of a crossed over bin for separate collection. The battery directive is currently under revision.
5.2 Recycling today “How many of the lithium-ion batteries are recycled today and in what way?”
Recycling of lithium-ion batteries is currently low at best. This cannot be ascribed only to the lack of economic incentive inherent in the battery chemistries, it also has to do with very small battery volumes reaching end of life, poor knowledge of battery content and design, and lack of proper marking of the packs and cells.
Sales of electrified vehicles for road transport has only being going on in any larger scale for the past 5-10 years, implying that very few vehicles with batteries have reached the recycling stage. Only a small flow, probably corresponding to test vehicles can be seen in Sweden.
According to Swedish Environmental Protection Agency’s (Naturvårdsverkets) battery statistics as presented in a report on recycling methods for lithium-ion batteries by Stena (Hall, et al., 2014), only one ton of lithium-ion batteries from vehicles enter the waste stream each year (up to 2012).
Report U The Life Cycle Energy Consumption and Greenhouse Gas Emissions from Lithium-Ion Batteries – A Study with Focus on Current Technology and Batteries for Light-duty Vehicles
32
The placing of batteries on the market grows with increasing electric vehicle sales, but most of them have not yet reached end of life.
How the batteries are handled may of course vary, but Stena dismantle batteries in Sweden and send the battery cells either to destruction or recycling. In general the cells are removed from the rest of the pack, and the structural material and electronics in the packs are sent to separate recycling. If the cells contain cobalt and/or nickel they are sent to recycling facilities in Europe. If the cells are LFP, however, they have no material value and are sent to be burned for energy recovery3.
Today, what little recycling is done is driven mainly by legal and safety demands on how to handle the batteries, and economics when it comes to what materials that are recovered. It is thus clear that policy and legislation are needed in this area to ensure sustainability – and additionally to build a self-sustaining, economically viable recycling chain.
As an example, it is in most cases the safety aspect in the dismantling stage that ensures that the batteries are dismantled at all and not just sent to the shredder. The dismantling in turn allows for the extraction of electronics, cells and supporting materials which allows for better recycling of the battery. This example shows how necessary legal demand are in order to create a recycling chain, but that care should be taken so future development (like safer batteries) does not kill the existing incentive.
5.2.1 Currently used recycling technologies When talking about recycling technologies for batteries it is relevant to divide the battery into parts. There are the cells, with a complicated mix of active materials, electrolyte, conductors and casing. The cells are encased in modules, which in turn are placed within a pack case. Additionally there is a cooling system, electronics and structural materials. The crucial question is “What materials are economically and technically recoverable from the batteries today?”.
It is probable that the packs first will be disassembled, due to safety reasons, and this facilitates recycling of steel, aluminium, plastics and electronics in the packs and possibly also in the modules. After this step the cells need to be handled. Although there are several technologies that could be used to recycling lithium-ion battery cells, there is only one that is used at near commercial scale; pyro-metallurgical recycling. Hydrometallurgical methods are at prototype scale in Europe, but one plant exists in North America that takes larger volumes (Kushnir, 2015).
Table 20 shows a rough presentation of the pyro- and hydrometallurgical recycling processes and what materials are reasonable to assume as recyclable from each. There is potential to combine the methods to achieve other combinations of recycled output. What methods that are being tried or used in Europe can be found in Table 21.
3 Personal communication with Christer Forsgren, Stena.
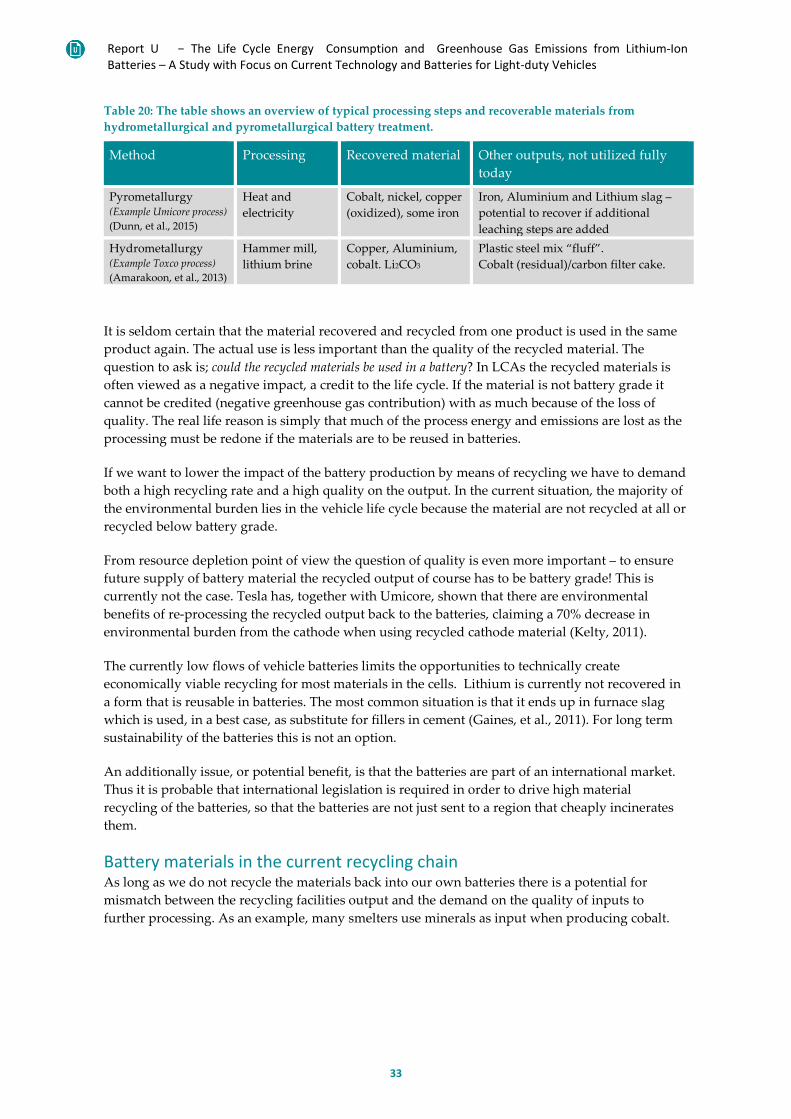
Report U The Life Cycle Energy Consumption and Greenhouse Gas Emissions from Lithium-Ion Batteries – A Study with Focus on Current Technology and Batteries for Light-duty Vehicles
33
Table 20: The table shows an overview of typical processing steps and recoverable materials from hydrometallurgical and pyrometallurgical battery treatment.
Method Processing Recovered material Other outputs, not utilized fully today
Pyrometallurgy (Example Umicore process) (Dunn, et al., 2015)
Heat and electricity
Cobalt, nickel, copper (oxidized), some iron
Iron, Aluminium and Lithium slag – potential to recover if additional leaching steps are added
Hydrometallurgy (Example Toxco process) (Amarakoon, et al., 2013)
Hammer mill, lithium brine
Copper, Aluminium, cobalt. Li2CO3
Plastic steel mix “fluff”. Cobalt (residual)/carbon filter cake.
It is seldom certain that the material recovered and recycled from one product is used in the same product again. The actual use is less important than the quality of the recycled material. The question to ask is; could the recycled materials be used in a battery? In LCAs the recycled materials is often viewed as a negative impact, a credit to the life cycle. If the material is not battery grade it cannot be credited (negative greenhouse gas contribution) with as much because of the loss of quality. The real life reason is simply that much of the process energy and emissions are lost as the processing must be redone if the materials are to be reused in batteries.
If we want to lower the impact of the battery production by means of recycling we have to demand both a high recycling rate and a high quality on the output. In the current situation, the majority of the environmental burden lies in the vehicle life cycle because the material are not recycled at all or recycled below battery grade.
From resource depletion point of view the question of quality is even more important – to ensure future supply of battery material the recycled output of course has to be battery grade! This is currently not the case. Tesla has, together with Umicore, shown that there are environmental benefits of re-processing the recycled output back to the batteries, claiming a 70% decrease in environmental burden from the cathode when using recycled cathode material (Kelty, 2011).
The currently low flows of vehicle batteries limits the opportunities to technically create economically viable recycling for most materials in the cells. Lithium is currently not recovered in a form that is reusable in batteries. The most common situation is that it ends up in furnace slag which is used, in a best case, as substitute for fillers in cement (Gaines, et al., 2011). For long term sustainability of the batteries this is not an option.
An additionally issue, or potential benefit, is that the batteries are part of an international market. Thus it is probable that international legislation is required in order to drive high material recycling of the batteries, so that the batteries are not just sent to a region that cheaply incinerates them.
Battery materials in the current recycling chain As long as we do not recycle the materials back into our own batteries there is a potential for mismatch between the recycling facilities output and the demand on the quality of inputs to further processing. As an example, many smelters use minerals as input when producing cobalt.
Report U The Life Cycle Energy Consumption and Greenhouse Gas Emissions from Lithium-Ion Batteries – A Study with Focus on Current Technology and Batteries for Light-duty Vehicles
34
The output from some recycling process may, however, contain organic material that has to be removed before the material can be refined. This implies a less effective refining process4.
An important question to assess when it comes to the material quality is based on this issue – which contaminations are manageable in the pre- and post-processing facilities and which are not? What are the conditions in each country based on the industries present? The fluorides in the cells are problematic and may cause fires at dismantling and crushing, leading to a need for separation in low temperature or inert gas conditions. These issues are seldom targeted in battery design, and what is worse – it may vary between countries.
In addition, what materials constitute contaminants and not can depend on the final destination for the recycled material. Copper is for example an issue in steel smelters, but aluminium is not. Aluminium is, however, a problem in copper while copper is not an issue if found in an aluminium stream. UNEP has created what they call a “Metal Wheel” which highlights what material are issues or extractable from different streams. The figure is presented in the UNEP report Metal Recycling - Opportunities, Limits, Infrastructure (Reuter, et al., 2013).
In addition to these aspects, small flows of materials that are lost in the streams of other materials is a problem for the lost material. Even if copper is not a problem for the smelters if found in the aluminium stream, it implies a large downcycling as the properties of copper are not recycled.
5.2.2 Potential future recycling technologies “What recycling techniques are being developed today and what potential do they have to reduce greenhouse gas emissions?”
Moving forward it is crucial that we find technologies that allow us to recover the materials, for example anode and cathode materials, in a form more of less ready to be used to a new battery. This is contrast to today’s situation where a few elements are recovered, but in a state prior to the processing stages needed for battery production. This development will make a huge difference for the lithium-ion batteries total life cycle greenhouse gas emissions.
In order to ensure that the materials can be recovered without breaking them down into elements it is important to better our understanding of why batteries become waste. As an example, a common issue for lithium-ion batteries is that the active material slowly gets covered with a passive coating; in this case it is important to know what reactions have occurred and how the materials can be salvages despite this change.
In the long run these aspects are a question of cell design, the cells need to be designed in a way so that the material can be recovered in their processed form. It is also a question of marking; if we are to extract the right materials, in the right form, in the right way we need to know what materials we are dealing with. Placing demands on the design regarding this aspect is one way to steer towards easier recycling with higher material recovery at higher quality.
If we want to retrieve the materials used in the current lithium-ion battery types we need to move from pyrometallurgy towards hydrometallurgy in some form4. Using different a specifically selected additives bound to a water repellent, it is possible to extract any desired metals from
4 Personal communication with Christer Forsgren, Stena
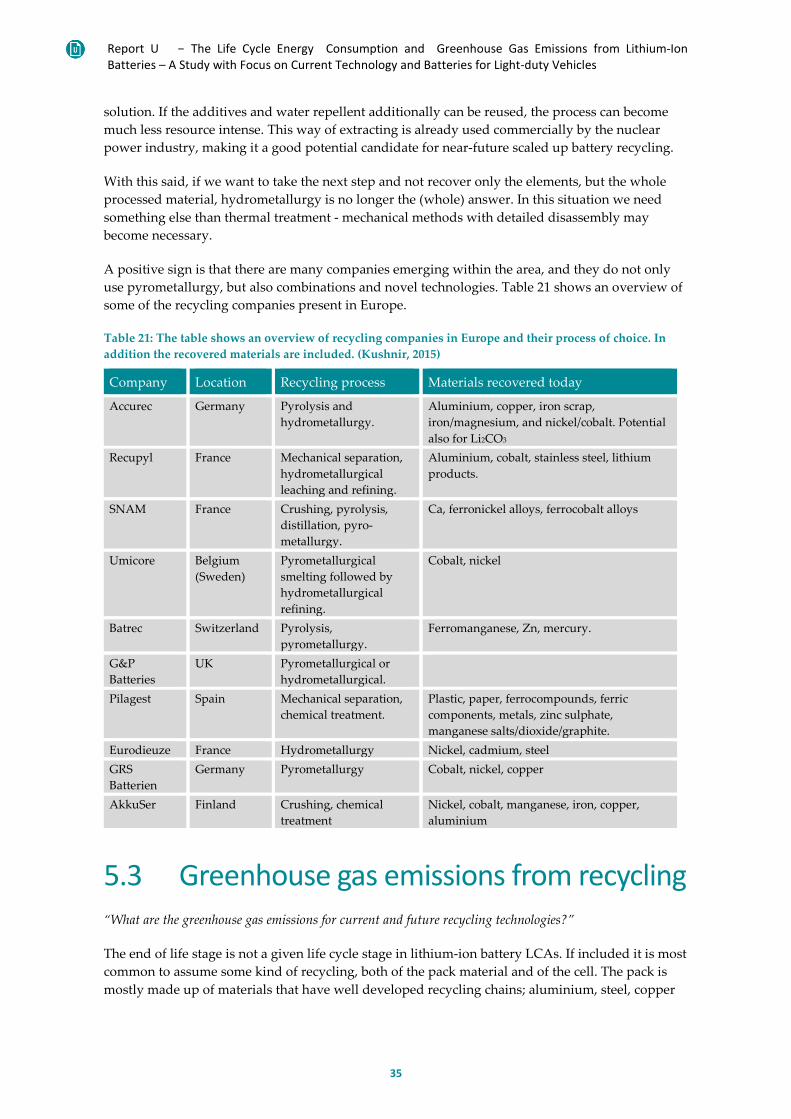
Report U The Life Cycle Energy Consumption and Greenhouse Gas Emissions from Lithium-Ion Batteries – A Study with Focus on Current Technology and Batteries for Light-duty Vehicles
35
solution. If the additives and water repellent additionally can be reused, the process can become much less resource intense. This way of extracting is already used commercially by the nuclear power industry, making it a good potential candidate for near-future scaled up battery recycling.
With this said, if we want to take the next step and not recover only the elements, but the whole processed material, hydrometallurgy is no longer the (whole) answer. In this situation we need something else than thermal treatment - mechanical methods with detailed disassembly may become necessary.
A positive sign is that there are many companies emerging within the area, and they do not only use pyrometallurgy, but also combinations and novel technologies. Table 21 shows an overview of some of the recycling companies present in Europe.
Table 21: The table shows an overview of recycling companies in Europe and their process of choice. In addition the recovered materials are included. (Kushnir, 2015)
Company Location Recycling process Materials recovered today
Accurec Germany Pyrolysis and hydrometallurgy.
Aluminium, copper, iron scrap, iron/magnesium, and nickel/cobalt. Potential also for Li2CO3
Recupyl France Mechanical separation, hydrometallurgical leaching and refining.
Aluminium, cobalt, stainless steel, lithium products.
SNAM France Crushing, pyrolysis, distillation, pyro-metallurgy.
Ca, ferronickel alloys, ferrocobalt alloys
Umicore Belgium (Sweden)
Pyrometallurgical smelting followed by hydrometallurgical refining.
Cobalt, nickel
Batrec Switzerland Pyrolysis, pyrometallurgy.
Ferromanganese, Zn, mercury.
G&P Batteries
UK Pyrometallurgical or hydrometallurgical.
Pilagest Spain Mechanical separation, chemical treatment.
Plastic, paper, ferrocompounds, ferric components, metals, zinc sulphate, manganese salts/dioxide/graphite.
Eurodieuze France Hydrometallurgy Nickel, cadmium, steel GRS Batterien
Germany Pyrometallurgy Cobalt, nickel, copper
AkkuSer Finland Crushing, chemical treatment
Nickel, cobalt, manganese, iron, copper, aluminium
5.3 Greenhouse gas emissions from recycling “What are the greenhouse gas emissions for current and future recycling technologies?”
The end of life stage is not a given life cycle stage in lithium-ion battery LCAs. If included it is most common to assume some kind of recycling, both of the pack material and of the cell. The pack is mostly made up of materials that have well developed recycling chains; aluminium, steel, copper
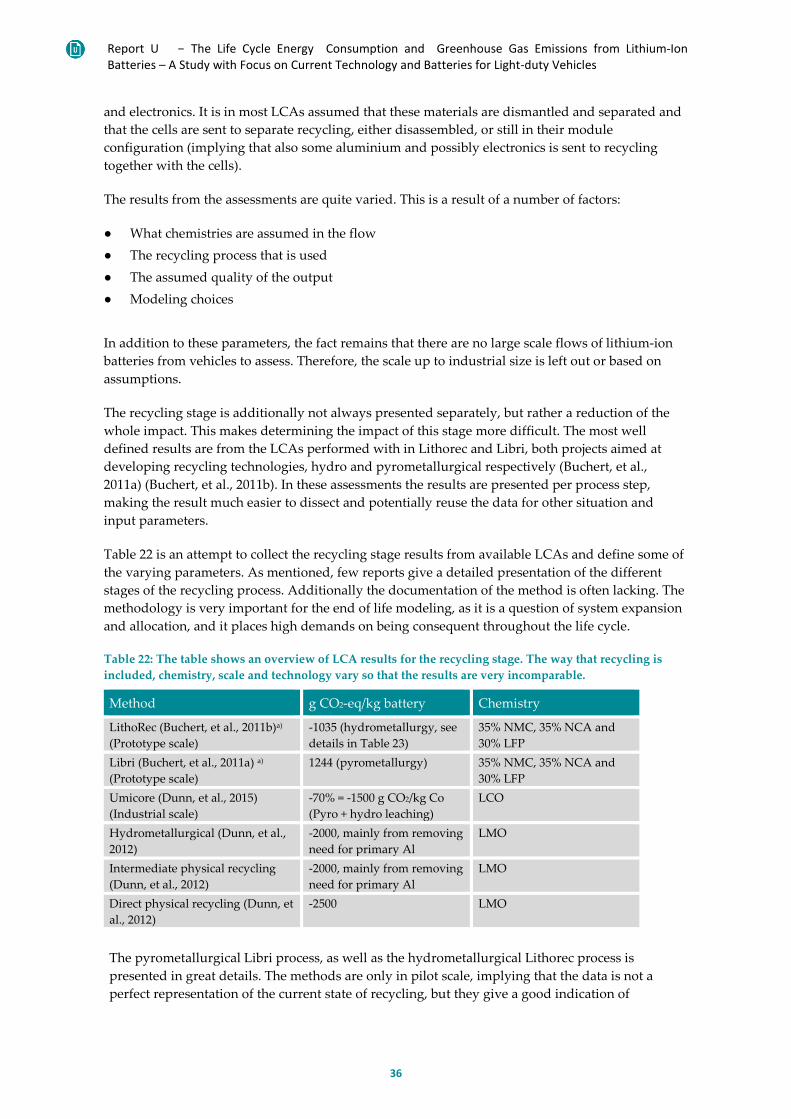
Report U The Life Cycle Energy Consumption and Greenhouse Gas Emissions from Lithium-Ion Batteries – A Study with Focus on Current Technology and Batteries for Light-duty Vehicles
36
and electronics. It is in most LCAs assumed that these materials are dismantled and separated and that the cells are sent to separate recycling, either disassembled, or still in their module configuration (implying that also some aluminium and possibly electronics is sent to recycling together with the cells).
The results from the assessments are quite varied. This is a result of a number of factors:
● What chemistries are assumed in the flow ● The recycling process that is used ● The assumed quality of the output ● Modeling choices In addition to these parameters, the fact remains that there are no large scale flows of lithium-ion batteries from vehicles to assess. Therefore, the scale up to industrial size is left out or based on assumptions.
The recycling stage is additionally not always presented separately, but rather a reduction of the whole impact. This makes determining the impact of this stage more difficult. The most well defined results are from the LCAs performed with in Lithorec and Libri, both projects aimed at developing recycling technologies, hydro and pyrometallurgical respectively (Buchert, et al., 2011a) (Buchert, et al., 2011b). In these assessments the results are presented per process step, making the result much easier to dissect and potentially reuse the data for other situation and input parameters.
Table 22 is an attempt to collect the recycling stage results from available LCAs and define some of the varying parameters. As mentioned, few reports give a detailed presentation of the different stages of the recycling process. Additionally the documentation of the method is often lacking. The methodology is very important for the end of life modeling, as it is a question of system expansion and allocation, and it places high demands on being consequent throughout the life cycle.
Table 22: The table shows an overview of LCA results for the recycling stage. The way that recycling is included, chemistry, scale and technology vary so that the results are very incomparable.
Method g CO2-eq/kg battery Chemistry
LithoRec (Buchert, et al., 2011b)a) (Prototype scale)
-1035 (hydrometallurgy, see details in Table 23)
35% NMC, 35% NCA and 30% LFP
Libri (Buchert, et al., 2011a) a) (Prototype scale)
1244 (pyrometallurgy) 35% NMC, 35% NCA and 30% LFP
Umicore (Dunn, et al., 2015) (Industrial scale)
-70% = -1500 g CO2/kg Co (Pyro + hydro leaching)
LCO
Hydrometallurgical (Dunn, et al., 2012)
-2000, mainly from removing need for primary Al
LMO
Intermediate physical recycling (Dunn, et al., 2012)
-2000, mainly from removing need for primary Al
LMO
Direct physical recycling (Dunn, et al., 2012)
-2500 LMO
The pyrometallurgical Libri process, as well as the hydrometallurgical Lithorec process is presented in great details. The methods are only in pilot scale, implying that the data is not a perfect representation of the current state of recycling, but they give a good indication of
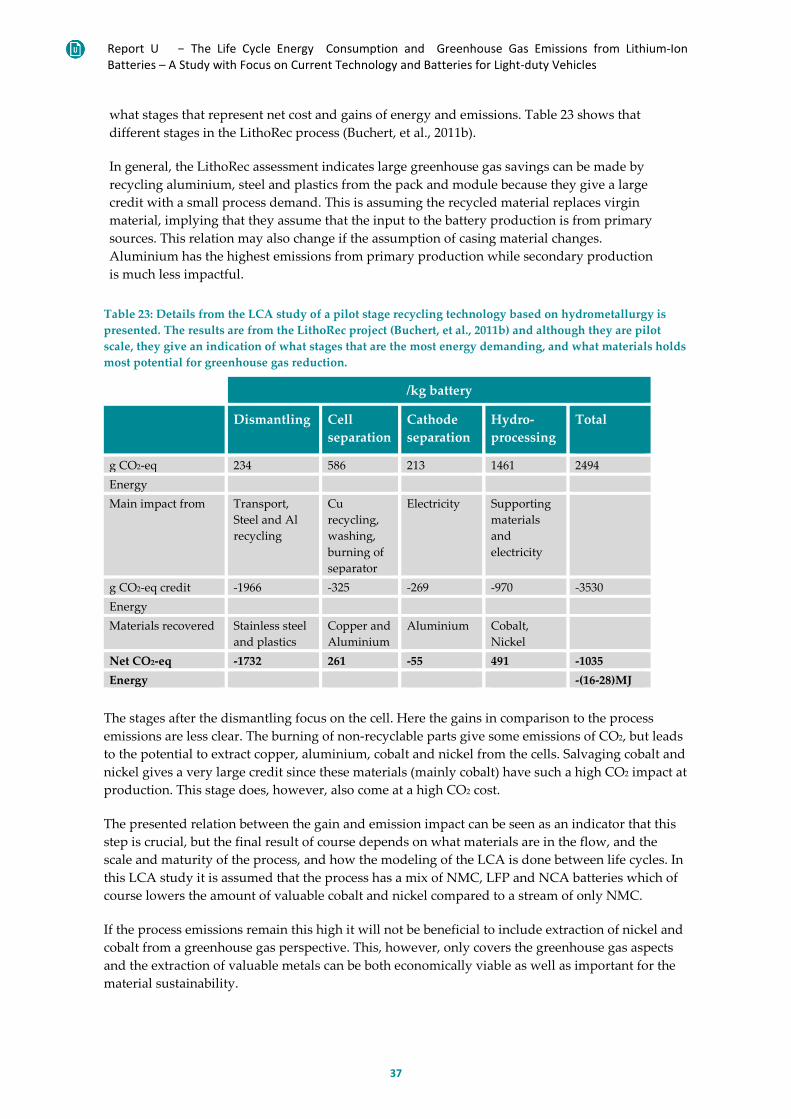
Report U The Life Cycle Energy Consumption and Greenhouse Gas Emissions from Lithium-Ion Batteries – A Study with Focus on Current Technology and Batteries for Light-duty Vehicles
37
what stages that represent net cost and gains of energy and emissions. Table 23 shows that different stages in the LithoRec process (Buchert, et al., 2011b).
In general, the LithoRec assessment indicates large greenhouse gas savings can be made by recycling aluminium, steel and plastics from the pack and module because they give a large credit with a small process demand. This is assuming the recycled material replaces virgin material, implying that they assume that the input to the battery production is from primary sources. This relation may also change if the assumption of casing material changes. Aluminium has the highest emissions from primary production while secondary production is much less impactful.
Table 23: Details from the LCA study of a pilot stage recycling technology based on hydrometallurgy is presented. The results are from the LithoRec project (Buchert, et al., 2011b) and although they are pilot scale, they give an indication of what stages that are the most energy demanding, and what materials holds most potential for greenhouse gas reduction.
/kg battery
Dismantling Cell separation
Cathode separation
Hydro-processing
Total
g CO2-eq 234 586 213 1461 2494 Energy Main impact from Transport,
Steel and Al recycling
Cu recycling, washing, burning of separator
Electricity Supporting materials and electricity
g CO2-eq credit -1966 -325 -269 -970 -3530 Energy Materials recovered Stainless steel
and plastics Copper and Aluminium
Aluminium Cobalt, Nickel
Net CO2-eq -1732 261 -55 491 -1035 Energy -(16-28)MJ
The stages after the dismantling focus on the cell. Here the gains in comparison to the process emissions are less clear. The burning of non-recyclable parts give some emissions of CO2, but leads to the potential to extract copper, aluminium, cobalt and nickel from the cells. Salvaging cobalt and nickel gives a very large credit since these materials (mainly cobalt) have such a high CO2 impact at production. This stage does, however, also come at a high CO2 cost.
The presented relation between the gain and emission impact can be seen as an indicator that this step is crucial, but the final result of course depends on what materials are in the flow, and the scale and maturity of the process, and how the modeling of the LCA is done between life cycles. In this LCA study it is assumed that the process has a mix of NMC, LFP and NCA batteries which of course lowers the amount of valuable cobalt and nickel compared to a stream of only NMC.
If the process emissions remain this high it will not be beneficial to include extraction of nickel and cobalt from a greenhouse gas perspective. This, however, only covers the greenhouse gas aspects and the extraction of valuable metals can be both economically viable as well as important for the material sustainability.

Report U The Life Cycle Energy Consumption and Greenhouse Gas Emissions from Lithium-Ion Batteries – A Study with Focus on Current Technology and Batteries for Light-duty Vehicles
38
Note that the recycling of lithium and iron does not show up as a crucial factor for the greenhouse gas emissions, this is an indicator that a total focus only on greenhouse gas emissions might lead to a situation where critical materials for the technology are ignored in the recycling stage, leading to long term or short term supply shortage.
5.4 Second life Electric vehicles place high demands on their batteries. When 80% of the initial capacity remains the batteries are no longer good enough to be used in vehicles. This gives an opportunity for prolonging the life of the batteries by reusing them in a less demanding application – giving them a second life.
This question is relevant for the topic of this report, because a prolonged life will imply less production impact per use. This leads us to the question “How much of the production emissions can be allocated to the vehicle?”. Today the answer is simple; there is no reuse or second life market for lithium-ion batteries. The whole production impact falls on the vehicle.
With the current situation assessed we can consider the potential for reuse, and what this would mean for the vehicle life cycle. As mentioned a large part of the battery capacity remains after use in the vehicles and this can and should be utilized in order to sustainably have a large electric vehicle fleet. Many applications could use batteries with this level of capacity. Examples of second life application can be renewable energy grid storage, backup systems, small scale electricity production storage and probably many other applications.
The current issues are quite many; one is the problem of diagnosing the batteries when they are removed from the car. What is their condition? How much of the initial capacity is left, are the batteries still safe or are they damaged or worn? It may not be the easiest task to answer these questions, but clear regulation on how it should be assessed and documented is one step.
In addition, it is not always easy to quality assure old batteries, making the business of second life batteries more complex and uncertain – leading to a situation where most customers prefer the safety and stability of new batteries. Also here it is important that the market is steered towards making reuse of batteries into a secure business.
6 Total life cycle greenhouse gas emissions from battery production and recycling
We have in chapter 4 seen the greenhouse gas emissions related to the battery production and assessed the causes and potential development of these. In chapter 5 the aspect of end of life handling was added, especially focusing on recycling potential.
In this section the results from both these assessments are shown together to form a picture of the total greenhouse gas emissions from the battery in its current situation. The production is based on
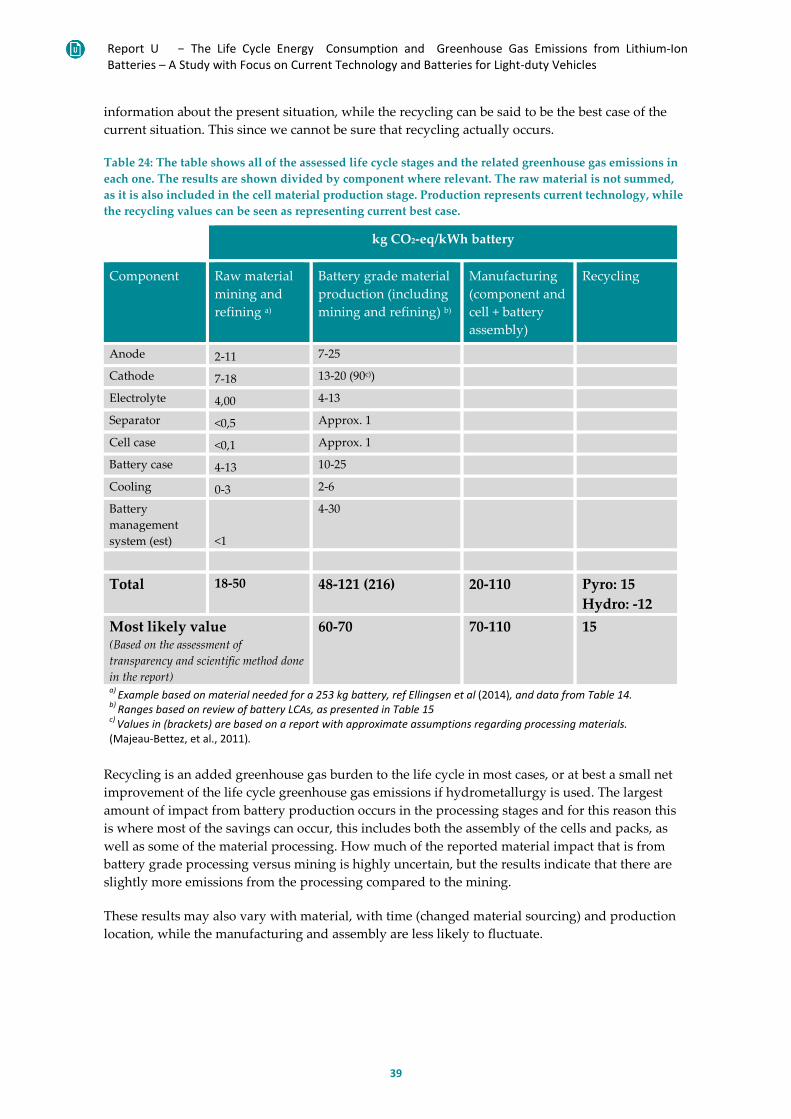
Report U The Life Cycle Energy Consumption and Greenhouse Gas Emissions from Lithium-Ion Batteries – A Study with Focus on Current Technology and Batteries for Light-duty Vehicles
39
information about the present situation, while the recycling can be said to be the best case of the current situation. This since we cannot be sure that recycling actually occurs.
Table 24: The table shows all of the assessed life cycle stages and the related greenhouse gas emissions in each one. The results are shown divided by component where relevant. The raw material is not summed, as it is also included in the cell material production stage. Production represents current technology, while the recycling values can be seen as representing current best case.
kg CO2-eq/kWh battery
Component Raw material mining and refining a)
Battery grade material production (including mining and refining) b)
Manufacturing (component and cell + battery assembly)
Recycling
Anode 2-11 7-25
Cathode 7-18 13-20 (90c))
Electrolyte 4,00 4-13
Separator <0,5 Approx. 1
Cell case <0,1 Approx. 1
Battery case 4-13 10-25
Cooling 0-3 2-6
Battery management system (est) <1
4-30
Total 18-50 48-121 (216) 20-110 Pyro: 15 Hydro: -12
Most likely value (Based on the assessment of transparency and scientific method done in the report)
60-70 70-110 15
a) Example based on material needed for a 253 kg battery, ref Ellingsen et al (2014), and data from Table 14. b) Ranges based on review of battery LCAs, as presented in Table 15
c) Values in (brackets) are based on a report with approximate assumptions regarding processing materials. (Majeau-Bettez, et al., 2011).
Recycling is an added greenhouse gas burden to the life cycle in most cases, or at best a small net improvement of the life cycle greenhouse gas emissions if hydrometallurgy is used. The largest amount of impact from battery production occurs in the processing stages and for this reason this is where most of the savings can occur, this includes both the assembly of the cells and packs, as well as some of the material processing. How much of the reported material impact that is from battery grade processing versus mining is highly uncertain, but the results indicate that there are slightly more emissions from the processing compared to the mining.
These results may also vary with material, with time (changed material sourcing) and production location, while the manufacturing and assembly are less likely to fluctuate.
Report U The Life Cycle Energy Consumption and Greenhouse Gas Emissions from Lithium-Ion Batteries – A Study with Focus on Current Technology and Batteries for Light-duty Vehicles
40
7 Discussion Focusing on the production of lithium-ion batteries for vehicles gives an added insight into the complete life cycle of these components. This understanding is crucial in order to allow for a sustainable introduction of an increasing amount of electrified vehicles. The information in this report is one piece of the puzzle for a complete LCA study of electrified vehicles.
What is important to know is how large of an additional burden we are introducing when adding a battery to the vehicle, and additionally how much of this current burden that we can hope to reduce in the future. There is a lot of potential to reduce the impact with the help of novel production methods, as well as improved end of life handling. It is a question of technology development, but also very much one of legislative action. Product Category Rules (PCRs) could be one example that can help in comparing different studies.
Before any assessment of environmental impact can be done, we first must understand our current situation. Sweden has a relatively small electric vehicle fleet, but it was still clear that there existed a dominating type of lithium-ion battery, namely a battery using the NMC chemistry. This chemistry, or a shift towards this chemistry, also seems to be the global trend. Nickel, and even more so cobalt, are materials where the abundance is relatively low in the crust. Due to this, the fact that NMC (containing both nickel and cobalt) dominates the battery fleet is a very important to take note of.
When it comes to greenhouse gas emissions from the battery production our first conclusion is that there is a lack of transparency in the studied reports. Additionally the results are limited by the availability of LCI data. Both of these issues can be resolved in future studies by increasing the amount of available primary LCI data, especially for the important manufacturing stage, and at the same time clearly reporting this new data. This requires efforts to partner the most large scale producers of batteries with life cycle assessment projects.
In answer to the short-term questions about battery production, this review has shown is that there is no clear consensus on the environmental burden of the current battery production, but that there are indications that manufacturing stands for a large part of the production impact, and that the majority of the additional impact is from component processing. This implies that production location and/or electricity mix has great potential to impact the results, not forgetting that less fossil based energy in general would reduce greenhouse gas emissions, also for the other life cycle stages like material production. Manufacturing may be the single stage that contributes most, but the total material processing emissions as a whole cannot be ignored.
Other changes that also reduce greenhouse gas emissions include using recycled material as input. If manufacturing becomes more efficient, and emits less greenhouse gases, the materials will come into even higher focus. Based on the available inventory data for the mining stage, it is especially aluminium that stands out with a large difference between primary and secondary material.
In general, using recycled input is especially important for materials where the difference between virgin/secondary materials is large or for materials where there is a need to drive up demand of recycled material to close the material loop. There are many examples of these latter materials in the battery, including lithium. Using recycled material as input is most often not a question of technology, but rather a question of creating a value chain that ensures quality by having a robust framework to evaluate secondary material. Economic incentives to use recycled input can also be a factor.
Report U The Life Cycle Energy Consumption and Greenhouse Gas Emissions from Lithium-Ion Batteries – A Study with Focus on Current Technology and Batteries for Light-duty Vehicles
41
The currently available work does most often not cover the question of production impact and pack size, but the work available points towards a nearly linear increasing in greenhouse gas emissions from production when scaling up the battery. As long as the largest part of the battery impact comes from the cells, this result will hold true, as the amount of cells always scale with size. The lack of real life production data, especially data from sites producing different battery sizes, is the greatest hindrance in order to make this the assessment of size and production correlation more robust. Additionally, poor inventory data for supporting components like electronics is an issue.
Although recycling currently does not much change the results for the greenhouse gas emissions of the battery, it is a crucial question when it comes to preserving resources and making electric vehicle long term sustainable. Prolonging battery life by reuse, and closing the material loop with recycling, is absolutely necessary, but it is not done today with exception of a small and low quality recycling. If we start by looking at reuse there is great opportunity to improve the life cycle impact by aiding the second life business. Examples of this may include clear guides on how to measure quality and performance of used batteries, as well as a framework that gives security to both the seller and second user.
Looking at the last stage of the batteries’ life cycle, it is clear that the final point for the batteries should not be incineration (pyrometallurgy) as is currently the case for large parts of the pack, as this might even be a greenhouse gas emission cost for the life cycle. As the review studies show, the greatest issue currently is not the lack of technology that recovers materials better than the pyrometallurgy used today, rather it is the lack of economic incentives that causes most of the cell materials (except nickel and cobalt) to be burned. The environmental benefits of hydrometallurgical or other recycling cannot be realized without proper legislative steering.
The recycling industry states clear marking of cells, modules and packs as a key driving factor in order to tailor the recycling process to the metals and materials included in the packs. In this way more material can be recovered.
This does, however, not cover the issue that there is little to no economic value in battery materials that are necessary to recycle to achieve sustainable battery use. Examples include aluminium and lithium in the cells, but also the electrolyte and electronics that have a large material impact. It is not a question of technological development, because that are techniques to retrieve these materials, it is again a question of low flows that cause a bad economic situation.
Regardless of this we must prepare ourselves for the larger future flows by creating a recycling chain that can handle these materials. Leaving it to pricing may risk a complete showstopper for the battery electric vehicles if we cannot ensure availability at a reasonable price. We cannot assume that there will be inherent economic incentives in battery recycling, but with appropriate demands we can ensure that incentives are developed in the future.
This is the current situation and its dilemma, but going forwards the industry needs more in order to substantially lower the environmental burden of the battery. They need to be able to recover the materials at battery grade, not at element-level as is done today (in the cases any recycling is done). Currently there is no demand for this level of recycled materials, and thus no work is done. Here we need both technology developments along with legislative action.
Recycling and reuse is in a state where a method of handling that will actually save some of the production emissions will not emerge by itself from current technology. The recycling that is done today is driven by demands on safety leading to a need for dismantling the batteries, not by the material values themselves. This sends a clear signal that legislation can make a great difference for the environmental performance of battery production.
Report U The Life Cycle Energy Consumption and Greenhouse Gas Emissions from Lithium-Ion Batteries – A Study with Focus on Current Technology and Batteries for Light-duty Vehicles
42
The answers to the more long term questions posed in this project highlight that the environmental performance of batteries (based on their production) is not fixed as good or bad, but very much dependent on legislative actions. This realization should help us move forward side by side with promotion of technology development in the production and recycling areas.
8 Conclusions The conclusions in this section are based on the questions posed in the scope and discussions in section 7.
Part 1 – Review the iteratively specified chemistries and answer the following short-term questions related to the battery production
a) How large are the energy use and greenhouse emissions related to the production of lithium-ion batteries?
The results from different assessments vary due to a number of factors including battery design, inventory data, modelling and manufacturing. Based on our review greenhouse gas emissions of 150-200 kg CO2-eq/kWh battery looks to correspond to the greenhouse gas burden of current battery production. Energy use for battery manufacturing with current technology is about 350 – 650 MJ/kWh battery.
b) How large are the greenhouse gas emissions related to different production steps including mining, processing and assembly/manufacturing?
Mining and refining seem to contribute a relatively small amount to the current life cycle of the battery. It is nearly independent of the cell chemistry NMC, LFP or LMO calculated per kWh capacity. The largest part of the emissions, around 50%, is currently from battery (including cell) manufacturing, but if the material processing to battery grade is viewed as one total it is in the same order of magnitude. The reviewed studies vary when it comes to the line between these areas and transparency is lacking. When it comes to battery components, the electrodes look to be the dominating contributors. Most of the other components vary in impact between studies, but electronics seem to have a high impact as well.
c) What differences are there in greenhouse gas emissions between different production locations?
This review shows that assuming the current level of emissions from manufacturing, the electricity mix of the production location greatly impacts the total result. This is due to the fact that the manufacturing is a large part of the life cycle, and that most of the production energy is electricity. Since production location currently is based on labor cost it can be important to promote a choice based on environmental factors as well. Legislation can be one way to ensure this by giving incentive to choose production location or electricity type based on environmental factors.
d) Do emissions scale with the battery weight and kWh in a linear or non-linear fashion? Very little data are available on this subject, but what data there are points to a near-linear scale up of greenhouse gas emissions when the battery size increases. Uncertainty factors include the impact from the passive components like electronics, as well as the scaling of the production energy with pack size in future large scale production. Additionally, the pack size is only one factor that varies when the electric range is increased. Effects on driveline, production and production volumes must also be assessed.
Report U The Life Cycle Energy Consumption and Greenhouse Gas Emissions from Lithium-Ion Batteries – A Study with Focus on Current Technology and Batteries for Light-duty Vehicles
43
Part 2 – To answer more long-term questions related to opportunities to reduce the energy use and greenhouse gas emissions from battery production.
a) What opportunities exist to improve the emissions from the current lithium-ion battery chemistries by means of novel production methods?
The main improvement short term is likely to come from more efficient production and from using electricity with low CO2 emissions. In the longer term, exchanging chemicals for water in production is a step towards lower greenhouse gas emissions.
b) What demands are placed on vehicle recycling today? There are demands on end of life vehicle recycling as well as on battery recycling. The current legislation does not ensure closed loop recycling of the crucial materials and only demand 50% recycling. The battery directive is being revised.
c) How many of the lithium-ion batteries are recycled today and in what way? There is currently a very low flow of lithium-ion batteries from vehicles, and the recycling that exist is focused on incineration with pyrometallurgy.
d) What materials are economically and technically recoverable from the batteries today? With pyrometallurgy only cobalt, nickel and copper can be extracted from the battery, and only in their elemental form (not processed for batteries).
e) What recycling techniques are being developed today and what potential do they have to reduce greenhouse gas emissions?
There are a number of technologies and combinations of technologies being developed. Hydrometallurgy is close at hand, and can potentially extract more materials than pyrometallurgy, although this is currently only done at small scale. Long term it will be necessary to extract the materials in a more processed form in order to reduce the total impact of the battery.
f) How much of the production emissions can be allocated to the vehicle? In the current situation the use in the vehicle is the only use, implying that all of the impact is related to the vehicle life cycle. There is no second life market for batteries at present, and this looks to be the case for the foreseeable future if there are not great efforts made to change the situation.
Based on the assessment of the posed questions, our conclusions are that the currently available data are usually not transparent enough to draw detailed conclusions about the battery’s production emissions. There is, regardless, a good indication of the total emissions from the production, but this should be viewed in light of there being a small number of electric vehicles being produced compared to the total number of vehicles. The potential effects of scale up are not included in the assessments. Primary data for production, especially production of different pack sizes, is therefore interesting for future work.
This report also concludes that there is no fixed answer to the question of the battery’s environmental impact. There is great potential to influence the future impact by legislative actions, especially in the area of recycling. Today there is no economic incentive for recycling of lithium-ion batteries, but by placing the correct requirements on the end of life handling we can create this incentive. Coupling this type of actions with support for technology development both in battery production processes and battery recycling can ensure a sustainable electric vehicle fleet.
The review of the available life cycle assessments also highlighted that there is a need for improving the primary data used in the studies, as there is little new data being presented.
Report U The Life Cycle Energy Consumption and Greenhouse Gas Emissions from Lithium-Ion Batteries – A Study with Focus on Current Technology and Batteries for Light-duty Vehicles
44
Additionally, the studies are often not transparent in their data choices and modelling assumptions, leading to a situation where comparing results becomes very difficult.
Regardless of this, the review found a number of critical factors for determining differences in the results. The assumptions regarding manufacturing were shown to have the greatest variation and impact on the total result. In order to improve our understanding of the environmental impact of the battery production we need more than LCA results. We need more clear technical descriptions of each production step and where they are performed so that the emissions found in the reviewed life cycles assessments can be defined into different stages. Not until we have a clear definition of stages can we assess where the energy consumption and emissions are largest, or what actions that can help lower the impact.
9 Proposals for further studies It would be of great interest to study a large BEV battery used in a car model in collaboration with a battery and cell manufacturer, and to analyze the electronics in a better way. Report transparency should be very high. Also the environmental effects of the battery on the total impact from a vehicle would be interesting to study, focusing on the performance per km.
Standardized designs of the batteries would be preferable to use for comparison LCAs. It is also crucial to clearly define each manufacturing stage, how the stages are linked and where and how they can be defined. This improved technical description is best made by a person focused on the technical side of battery manufacturing, rather than by LCA experts. In this way we would start future assessments with a good understanding of the steps we are collecting data for.
LCI data in general can be improved especially for cobalt and nickel production. It can also be improved for electronics such as printed circuit boards. If polytetrafluoroethylene is present in the design of the battery, check the LCI data or make a new inventory, since the greenhouse gas emissions are very high according to current LCI data.
Use of primary or secondary aluminium is important to distinguish between especially if one does not calculate recycling of this metal, which is unfortunately the case for pyrometallurgical recycling.
Resource use, social effects and ecotoxicity are impact categories to study as well, in order to get a more complete picture of the environmental impact of lithium-ion batteries. These questions can be important for long term sustainability. Also safety aspects should be taken into consideration.
In general there is a lack of primary data regarding the production of batteries, something that could be improved upon by partnerships between LCA practitioners and the battery supply chain. More comparisons between different types of vehicles would be interesting. There have been comparisons made for cars, but there are much less public studies (if any) for buses and trucks.
10 Acknowledgements We would like to thank the Swedish Energy Agency and the Swedish Transport Administration for the commissioning of this study to IVL, the Swedish Environmental Research Institute. The study

Report U The Life Cycle Energy Consumption and Greenhouse Gas Emissions from Lithium-Ion Batteries – A Study with Focus on Current Technology and Batteries for Light-duty Vehicles
45
presents not only a solid review of the current information available in the area of lithium-ion batteries and LCA, but also gave an opportunity to gather and build competence within this field.
We would also like to acknowledge the contribution to this work by Anders Nordelöf at Chalmers University of Technology who shared his deep knowledge and experience of vehicle battery LCA and gave us valuable references and information to use as a starting point. Additionally he provided appreciated supporting information and feedback during the working process.
Many thanks also to Duncan Kushnir at Chalmers University of Technology for sharing his insight in to the recycling of lithium-ion batteries and the life cycle thinking coupled to it. Duncan has helped us test our assumptions and conclusions on a knowledgeable peer.
Regarding our study on recycling we also want to thank Christer Forsgren at Stena Metall for agreeing to sit down with us and discuss the many different aspects that the recycling industry has to take into consideration when it comes to lithium-ion batteries. In addition he shared his views on the future of lithium-ion battery recycling.
11 Bibliography Air Resources Board, 2017. California's Advanced Clean Cars Midterm review, Appendix C: Zero Emission Vehicle and Plug-in Hybrid Electric Vehicle Technology Assessment. s.l.:California Environmental Protection Agency.
Althaus, H.-J.et al., 2007. Overview and methodology In: Frischknecht R, Jungbluth N.(eds.), Sachbilanzen von Energiesystemen: Grundlagen für den ökologischen Vergleich von Energiesystemen und den Einbezug von Energiesystemen in Ökobilanzen für die Schweiz., Dübendorf: Swiss Centre for Life Cycle Inventories.
Amarakoon, S., Smith, J. & Segal, B., 2013. Application of life-cycle assessment to nanoscale technology: Lithium-ion batteries for electric vehicles, s.l.: US-EPA.
Ambrose, H. & Kendall, A., 2016. Effects of battery chemistry and performance on the life cycle. Transportation Research, pp. 182-194.
ANL, 2014. GREET Life-cycle model, Argonne, US: Argonne National Laboratories, Energy Systems.
Battery University, 2017. Battery University. [Online] Available at: http://batteryuniversity.com/learn/article/types_of_battery_cells [Accessed 21 April 2017].
Berg, H., 2017. OmEv: Batterifabriker i Europa - del II, s.l.: Swedish Electromobility Centre.
Blomgren, G. E., 2017. The Development and Future of Lithium Ion Batteries. Journal of The Electrochemical Society, 164(1), pp. A5019-A5025.
Buchert, M., Jenseit, W., Merz, C. & Schüler, D., 2011a. Verbundprojekt: Entwicklung eines realisierbaren Recycling-konzepts für die Hochleistungsbatterien zukünftiger Elektrofahrzeuge--LiBRi Teilprojekt: LCA der Recyclingverfahren, Freiburg: Öko-Institut eV.
Report U The Life Cycle Energy Consumption and Greenhouse Gas Emissions from Lithium-Ion Batteries – A Study with Focus on Current Technology and Batteries for Light-duty Vehicles
46
Buchert, M., Jenseit, W., Merz, C. & Schüler, D., 2011b. Ökobilanz zum „Recycling von Lithium-Ionen-Batterien “(LithoRec, Freiburg: Ökoinstitut eV.
Burnham, A., Wang, M. & Wu, Y., 2006. Development and Applications of GREET2.7 – The transportation vehicle-cycle model. , Argonne, US: Argonne National Laboratories, Energy Systems Division.
Dr. Anderman, M., 2015. Assessing the Future of Hybrid and Electric Vehicles: The xEV Industry Insider Report, s.l.: Advanced Automotive Batteries.
Dunn, J. B., Gaines, L., Sullivan , J. & Wang, M. Q., 2012. Impact of recycling on cradle-to-gate energy consumption and greenhouse gas emissions of automotive lithium-ion batteries. Environmental science \& technology, pp. 12704-12710.
Dunn, J. et al., 2015. Material and Energy Flows in the Production of Cathode and Anode Materials for Lithium Ion Batteries, Argonne, IL (United States): Argonne National Lab.(ANL).
Elbilen i Sverige, 2017. Elbilen i Sverige. [Online] Available at: http://elbilsstatistik.se/startsida/se-statistik/ [Accessed 21 April 2017].
Ellingsen, L. A.-W., Hung, C. R. & Strömman, A. H., 2016. Lifecycle impacts of lithium-ion batteries: a review. Quebec, Canada, s.n., p. 9.
Ellingsen, L. A.-W.et al., 2014. Life cycle assessment of a lithium-ion battery vehicle pack. Journal of Industrial Ecology, pp. 113--124.
European Commission, 2014. Report on Critical Raw Materials for the EU: Report of the Ad hoc Working Group on Defining Critical Raw Materials, Brussels: European Commission.
EVvolumes.com , 2017. EVvolumes.com. [Online] Available at: http://www.ev-volumes.com/ [Accessed 21 April 2017].
Faria, R. et al., 2014. Primary and secondary use of electric mobility batteries from a life cycle perspective. Journal of Power Sources, pp. 169-177.
Gaines, L., Sullivan, J., Burnham, A. & Belharouak, I., 2011. Life-cycle analysis of production and recycling of lithium ion batteries. Journal of the Transportation Research Board, pp. 57-65.
Hall, B., Pettersson, C. & Flink, T., 2014. Förstudie kring återvinningsmetoder för litiumjonbatterier och celler för fordonsapplikationer, Göteborg: Energimyndigheten.
Hendrickson, T. P. et al., 2015. Life-cycle implications and supply chain logistics of electric vehicle battery recycling in California. Environmental Research Letters, p. 014011.
Hischier, R., Classen, M., Lehman, M. & Scharnhorst, W., 2007. Life cycle inventories of electric and electronic equipment: production, use and disposal, S:t Gallen, Dübendorf: Swiss Center for Life Cycle Inventories.
International Energy Agency, 2016. International energy outlook 2016. US Energy Information Administration (EIA).
Report U The Life Cycle Energy Consumption and Greenhouse Gas Emissions from Lithium-Ion Batteries – A Study with Focus on Current Technology and Batteries for Light-duty Vehicles
47
Karlström, M., 2017. OmEV: International Battery Seminar & Exhibition del 1 - fordonstillverkarna och batterier. Göteborg: OmEV.
Kelty, K., 2011. Tesla. [Online] Available at: https://www.tesla.com/sv_SE/blog/teslas-closed-loop-battery-recycling-program?redirect=no [Accessed 21 April 2017].
Kim, H. C. et al., 2016. Cradle-to-Gate Emissions from a Commercial Electric Vehicle Li-Ion Battery: A Comparative Analysis. Environmental Science \& Technology, pp. 7715--7722.
Kushnir, D., 2015. Lithium Ion Battery Recycling Technology 2015: Current State and Future Prospects.. Göteborg: Chalmers University, Environmental Systems Analysis.
Lastoskie, C. M. & Dai, Q., 2015. Comparative life cycle assessment of laminated and vacuum vapor-deposited thin film solid-state batteries. Journal of Cleaner Production, pp. 158-169.
Li, B., Gao, X., Li, J. & Yuan, C., 2014. Life cycle environmental impact of high-capacity lithium ion battery with silicon nanowires anode for electric vehicles. Environmental science \& technology, pp. 3047-3055.
Lima, P., 2015. Push EVs. [Online] Available at: http://pushevs.com/2015/09/28/new-30-kwh-nissan-leaf-battery/ [Accessed 12 April 2017].
Lu, Q. et al., 2016. Life Cycle Assessment of Electric Vehicle Power Battery. In: Materials Science Forum. s.l.:s.n., pp. 403-410.
Majeau-Bettez, G., Hawkins, T. R. & Strömman, A. H., 2011. Life cycle environmental assessment of lithium-ion and nickel metal hydride batteries for plug-in hybrid and battery electric vehicles. Environmental science \& technology, pp. 4548--4554.
Nelson, P., Bloom, K. & Dees, D., 2011. Modeling the performance and cost of lithium-ion batteries for electric-drive vehicles, Argonne, IL (United States): Argonne National Laboratory (ANL).
Nordelöf, A. et al., 2014. Environmental impacts of hybrid, plug-in hybrid, and battery electric vehicles—what can we learn from life cycle assessment?. The International Journal of Life Cycle Assessment, pp. 1866-1890.
Notter, D. A. et al., 2010. Contribution of Li-ion batteries to the environmental impact of electric vehicles. Environ. Sci. Technol, p. 6550–6556.
Oxis Energy, 2017. Oxis Energy. [Online] Available at: https://oxisenergy.com/ [Accessed 11 April 2017].
PE International, 2012. GaBi database. Leinfelden-Echterdingen, Germany: s.n.
Peters, J. F. et al., 2017. The environmental impact of Li-Ion batteries and the role of key parameters--A review. Renewable and Sustainable Energy Reviews, pp. 491-506.
Report U The Life Cycle Energy Consumption and Greenhouse Gas Emissions from Lithium-Ion Batteries – A Study with Focus on Current Technology and Batteries for Light-duty Vehicles
48
Reuter, M. et al., 2013. Metal Recycling: Opportunities, Limits, Infrastructure, A Report of the Working Group on the Global Metal Flows to the International Resource Panel, Milan: UNEP.
Ruoff, C., 2015. Charged Electrical vehicles magazine. [Online] Available at: https://chargedevs.com/features/tesla-tweaks-its-battery-chemistry-a-closer-look-at-silicon-anode-development/ [Accessed 11 April 2017].
Sullivan, J., Burnham, A. & Wang, M., 2010. Energy-consumption and carbon emission analysis of vehicle and component manufacturing., Argonne, US: Argonne National Laboratories, Energy Systems Division. ANL/ESD/10-6;.
Wang, Y. et al., 2016. Quantifying the environmental impact of a Li-rich high-capacity cathode material in electric vehicles via life cycle assessment. Environmental Science and Pollution Research, pp. 1-10.
Zackrisson, M., Avellán, L. & Orlenius, J., 2010. Life cycle assessment of lithium-ion batteries for plug-in hybrid electric vehicles--Critical issues. Journal of Cleaner Production, pp. 1519--1529.

IVL Swedish Environmental Research Institute Ltd. P.O. Box 210 60 // S-100 31 Stockholm // Sweden Phone +46-(0)10-7886500 // Fax +46-(0)10-7886590 // www.ivl.se


![Energy Consumption and Greenhouse Gas Emissions 1998_ifa_marrakech_kongshaug[1]](https://static.fdocuments.in/doc/165x107/577d1e951a28ab4e1e8ecdc9/energy-consumption-and-greenhouse-gas-emissions-1998ifamarrakechkongshaug1.jpg)