the - Li-Ning
45
Transcript of the - Li-Ning


This presentation incorporates information contained in the annual results announcement (the “Results Announcement”) for
the year ended 31 December 2019 of Li Ning Company Limited (the “Company”). This presentation should be read in
conjunction with the Results Announcement and is qualified in its entirety by the more detailed information and financial
information contained in the Results Announcement.
Other than the information contained in the Results Announcement, you shall not reproduce or distribute this presentation, in
whole or in part, and you shall not disclose any of the contents of this presentation or use any information herein for any
purpose without the Company’s prior written consent. You hereby agree to the foregoing by accepting delivery of this
presentation.
The contents of this presentation have not been reviewed or approved by any regulatory authority in Hong Kong or elsewhere.
The contents of this presentation are not investment, legal or tax advice. You are advised to exercise caution in perusing the
contents of this presentation. If you are in any doubt about any of the contents of this presentation, you should obtain
independent professional advice.
2

Results Highlights
Financial Review
Business Review
Strategic Planning
3
Appendix


Financial Highlights :
• Reported net profit* of RMB1,266 million, margin raised from 6.8% to 9.1%
Revenue up 32% to RMB 13,870 million
Gross profit margin expanded 1 percentage point
Enhanced operating leverage notwithstanding investment in new initiatives and organization costs
• Operating cash flow increased by 110% to RMB3,503 million
• Significant improvement in working capital continued
Gross average working capital improved (reduced) by 16% while revenue increased by 32%
Cash conversion cycle further improved (shortened) by 14 days (2018: 40 days / 2019: 26 days)
Operational Highlights:
• High-twenties growth for total platform retail sales, including online and offline channels
• Channel inventory turnover improvement continued
• Overall Same-Store-Sales growth in 2019 accelerated to high-teens
• Offline channel new product sell-through increase accelerated to low-twenties
Average selling price (ASP) increased high-single-digit
New product gross margin improved over 1 percentage point
Sell-out rate: 6-month improved over 4 percentage points, 3-month improved over 2 percentage points
*Exclude one-off profit and loss not related to operation of RMB234 m.5


7,089
3,975 4,159 4,601 6,085
3,548 4,192
5,316
7,110
492 523
594
675
2015 2016 2017 2018 2019
-RMB million-
Footwear Apparel Equipment&AccessoriesYoY growthGroup: Growth, YoY
Group: 32%
8,8748,015
13,870
Driven by balanced product initiative
10,511
7

9%15% 19% 22% 24%
35%33%
32% 31% 27%
56% 52% 49% 47% 49%
2015 2016 2017 2018 2019
E-commerce Retail Wholesale
100%100%
Sell-Through Mix
(Incl. Retail, Wholesale and E-commerce)Company Revenue Mix
31%24% 22% 20% 22%
69%76% 78% 80% 78%
2015 2016 2017 2018 2019
New Product (Current and Last Season) Old Product
Enhanced profitability driven by well balanced business model and consistent new product mix
8

Q12019
Q22019
Q32019
Q42019
Mid-thirties
Q12019
Q22019
Q32019
Q42019
Q12019
Q22019
Q32019
Q42019
Low-teens
Q12019
Q22019
Q32019
Q42019
Overall
Offline
Mid-teens
Low-teens
Low-teens
Mid-teensMid-teens
Overall Platform Wholesale
Mid-teens
E-commerce
High-Single
Digit
Low-teens
High-teens
Low-teens
Low-teens
0%
0%
0%
High-thirties
0%
Retail
SSSG (2019 vs 2018)
Overall High-teens
Retail Low-teens
Wholesale Low-teens
E-commerce Low-forties
Low-teens
High-teens
Mid-fifties
Low-forties
Low-twenties
Low-teens
9

7% 8%
5%
11%
26%
11%13%
9%
15%
28%
2015 2016 2017 2018 2019
Offline Channel Online and Offline Channels
6,1336,440 6,262 6,344 6,449
173
7931,101
6,133
6,440 6,435
7,137
7,550
2015 2016 2017 2018 2019
LN Brand LN YOUNG
Sell-through growth, YoY %POS number (Period end)Excl. LN YOUNG
Improved productive platform with integrated online and offline growth10

^ Wholesale business: Including sale of badminton and football categories products to specialty-store channel wholesaler
Business Performance
Controlled business growth led by sell-through focus
Revenues positively impacted by strong SSSG and expanded platform
3,864 4,0634,216
4,679
6,498
4,618 4,829 4,721 4,838 5,157
2015 2016 2017 2018 2019
Revenue(RMB million)
No. of POS (Period End)
39%, YoY
High-thirtiesMid-thirties
Low-thirties
Wholesale
Revenue
Revenue excl.
Sell-in to
Specialty Stores
Sell-through
(Exclude
Specialty Stores)
Sell-through and Revenue Growth, % YoY
11

2018 & 2019
^ Retail business: Refers to direct retail operation
Excluded LN YOUNG stores
Business Performance Revenue Growth Analysis
2,357 2,525
2,699
3,105
3,580
1,515 1,611 1,541 1,5061,292
2015 2016 2017 2018 2019
Revenue(RMB million)
No. of POS (Period End)
15%, YoY
2018 2019Same
Store
Special
Clearance
Sales
New Stores Closed Stores
Solid growth driven by healthy SSSG and improved new store productivity
Store
transferred
3,105
3,580+294
+536 -260
-127 +32
12

48.1%
49.1%
2018
Reported
GP Margin
Channel
&New BU
Revenue Mix
2019
Reported
GP Margin
Wholesale
Gross
Margin
EC
Gross
Margin
Direct Retail
Gross
Margin
+1.0p.p.
-0.7p.p.
-0.2p.p.+0.3p.p.
Inventory
Provision
& R&D cost
+0.6p.p.
13

※ Other income and profits include (i) miscellaneous income and gains, (ii) share profit from associate
Exclude one-off profit and loss related to operation of RMB 234m
1,266
2018
Reported
Net Profit
Gross
Profit
2019
Reported
Net Profit
Platform Operation
CostsTax
Sales Related
Variable Costs
Other income
and Profits ※Interest
+1,753
-317
-236
+79
-174
715-332
-222
-RMB Million-
Breakeven
Retail & EC
Business
Logistics
& New
business
Advertising
& Promotion
Other
Expenses
Enhanced operating leverage through disciplined cost management to fund investment in new initiative
14

100%
61% 64%72% 71% 76%
15% 14%
13% 17%15%
24% 22%15% 12% 9%
Dec2015
Dec2016
Dec2017
Dec2018
Dec2019
6 months or less(New Product)
7 - 12 months Over 12 Months
7.16.5
6.0
4.94.2
5.34.5 4.5 4.2
3.4
Dec2015
Dec2016
Dec2017
Dec2018
Dec2019
Inventory Level (Tag Price) Turnover Months (Store + Warehouse Inventory)
Turnover Months (Store Inventory Only)
Successful inventory management initiative achieved target turnover and structure
15

At cost, before provision
(RMB Million)
55% 56%
75%67% 71%
17% 18%
11%20% 14%
28% 26%14% 13% 15%
Dec2015
Dec2016
Dec2017
Dec2018
Dec2019
6 months or less 7 - 12 months over 12 months100%
1,1291,109
1,233
1,364
1,540
Dec2015
Dec2016
Dec2017
Dec2018
Dec2019
21%, YoY 13%, YoY
Further optimized inventory level and structure provided healthy foundation for growth
16

54%61%
70% 74% 73%
27% 18%8%
7%4%
19% 21% 22% 19% 23%
Dec2015*
Dec2016
Dec2017
Dec2018
Dec2019
Below 90 days 91 - 180 days over 180 days
1,915
1,784
1,540
1,213
945
Dec2015*
Dec2016
Dec2017
Dec2018
Dec2019
At gross amount, before provision
(RMB Million)
100%
Receivable Days Sales Outstanding (DSO) improved significantly
17*Exclude Double Happiness

2,2151,947
1,7371,536
1,290
31% 24%20% 15%
9%
-2000
-1000
0
1000
2000
3000
4000
# Simple average between period opening and ending^ Gross Amounts of inventory, trade receivables and payables, without netting off provisions
Inventory^ Trade Receivables^ Payables^
Working Capital# Working Capital# as % of Revenue
-RMB Million-
2016 2017 2018 20192015
Achieved working capital efficiency ahead of plan
18

Operating Cash Flow*
Cash Conversion Cycle (Days)
1,2471,754
2,529
3,672
5,963
Dec2015
Dec2016
Dec2017
Dec2018
Dec2019
835 1,159
4959
1,672
40
3,503
26
-RMB Million-
Net Cash Position^
^Net Cash = Cash and Cash Equivalents (including restricted bank deposits) - Borrowings
*Exclude Double Happiness
**Upon shareholders approval
Dividends** 00 0 215
76
380
549
19

Offline Channel Sales Performance
Sell-through: Mid-twenties growth
Sales volume: Mid-teens growth
Operating Cash Flow (YoY)
Cash flow from operating activities:
RMB 3.50 billion net inflow
Net Cash: increased by RMB 2.3 billion
Trade receivables before provisions:
Amount decreased (improved) by 22%
Cash conversion cycle:
decreased(improved) by 14 days
Over 12 months Inventory mix
Channel: declined (improved) 3 p.p.
Company: increase (declined) 2 p.p.
Offline Channel Sales Efficiency
SSSG: Low-teens growth
New product gross profit margin: up
over 1.0 p.p.
New Product Sell-out Rate
6 months:improved over 4.0p.p.
3 months:improved over 2.5p.p.
New Product Performance
Contribution to total sales:
down 2 p.p.
Sell-through: up low-twenties
growth
Retail Operation
“Closed Loop”
1) Product
Planning
2) Product
Development
3) Product
Sales Mix 4) In-store
Retail
5) Store
Clearance
6) Cash Recovery
20


22
运动体验
购买体验
李宁式体验价值
产品体验
Sports
Experience
Shopping
Experience
LI-NING’s
Experience
Value
Product
Experience
Rising Public Awareness of Health and Physical Fitness Boosted Sports Product Sales
In 2019, 72% of urban consumers increased their expenditure on healthy lifestyle, including sports
footwear and apparel.
With increasing sports participants and steadily expanding sports consumption market, total size of the
sports consumption market in China is expected to reach RMB1.5 trillion in 2020.
National Policies in Favor and Support of Industry Development
Issuance of the “Guiding Opinions on Accelerating High-Quality Development of Sports
Industry Through Promoting National Fitness and Sports Consumption” to stimulate sports
consumption as well as to promote sports industry as a pillar industry of the national
economy.
Implementing the “Outline for Building a Leading Sports Nation” with an expectation that
more than 630 million citizens will frequently participate in sports and exercise by 2035,
propelling the value added of the sports industry to RMB11.3 trillion.
E-commerce Remains as the Key New Consumption Trend
In 2019, China’s retail e-commerce sales value was expected to grow by 27.3% year-on-year to
USD1.935 trillion, accounting for approximately 36.6% of total retail sales. It is expected that China's
retail e-commerce sales will continue to increase its share of total retail sales until 2023.
Source: State Council of the People’s Republic of China, Ministry of Commerce of the People's Republic of China, National Bureau of Statistics of China, National Development
and Reform Commission of the People's Republic of China, General Administration of Sport of China, eMarketer. (Unit: RMB)

Multi-
Categories
Diversified
Channels
23
SportsFashion

2019
Total Value 28%
Running 1%
Training 15%
Basketball 45%
Sports Casual 52%
Non-core 20%
*Sales of badminton and football products are shown with sell-in data for reference as they are mainly distributed via specialty-stores.
Retail Sell-through – YoY Change
Badminton + Football* 24%
Sell-in – YoY Change
24
Retail Sell-through – Mix
19%
28%
32%
2%
19%Sports Casual(Including China LI-NING)
Basketball
Running
Training
Non-core
25
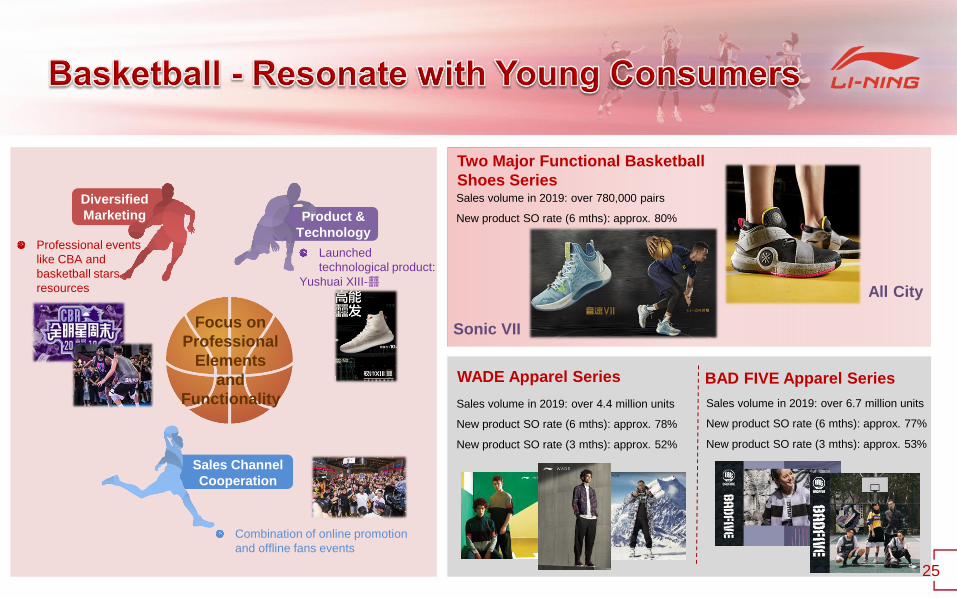
Combination of online promotion
and offline fans events
WADE Apparel Series BAD FIVE Apparel Series
Sales volume in 2019: over 4.4 million units
New product SO rate (6 mths): approx. 78%
New product SO rate (3 mths): approx. 52%
Sales volume in 2019: over 6.7 million units
New product SO rate (6 mths): approx. 77%
New product SO rate (3 mths): approx. 53%
Two Major Functional Basketball
Shoes Series
Sonic VII
All City
Sales volume in 2019: over 780,000 pairs
New product SO rate (6 mths): approx. 80%
Diversified
Marketing Product &
Technology
Sales Channel
Cooperation
Professional events
like CBA and
basketball stars
resources
Focus on
Professional
Elements
and
Functionality
Launched
technological product:
Yushuai XIII-䨻

Amateur RunnersMulti-Product Lines
Create Diversified Lifestyles
Classic Continuity
(i.e. Super Light 16 Series)
Fashionable Jogging Product -
Arashi, Arashi Plus
26
Professional RunnersIncrease Professional Attributes
With Top Technological R&D
Racing Category Sports Protection CategoryTag Price
(RMB)
Boom
Pegasus
Wind
Chaser
Pro
fessio
nal
Even
ts
Yunma
Rough Rabbit
4th Generation
Race
Tra
inin
g
Battle Axe
Furious Rider
4th Generation
Leading
Professional
Technology
Solidifies
Mass Market
Share
2,099
1,299
1,299
1,099
699
399
699
1000+
800
300
• SO rate (6 mths): approx. 75%
• Sales volume: over 280,000
pairs
• SO rate (6 mths): approx. 80%
• Sales volume: approx. 700,000
pairs

27
Essentials
Active Training
GYM
Support of Technological Innovation
Refined women fitness training needs
“No Boundaries Fitness Challenge” competitions (無界健身挑戰賽) in 5
major cities to create professional reputation of the products
Apparel Series - Top 20% SKUs sales performance (New
products in 2019)
Sales volume: approx. 14 million units
New Product SO Rate (6mths): approx. 79%
New Product SO Rate (3mths): approx. 52%
Account for approx. 86% of training apparel sales

28
Apparel Series
Footwear Series – Two
representative product series
Digital
Marketing Entertainment
Marketing
Brand
Crossover
Sales volume in 2019: over 12 million units
New Product SO rate (6mths): over 70%
New Product SO rate (3mths): approx. 50%
Sales volume in 2019:
over 410,000 pairs
New product SO rate (6mths):
approx. 85%
New product SO rate (3mths):
approx. 53%

29
COUNTERFLOW By
LI-NING
Tmall
Anniversary
Sale
3-Day sales
exceeded
50 million2019 New York and Paris
Fashion Week
+
COUNTERFLOW By
LI-NING x CHENPENG
WADE WOW7
“One Last
Dance”
5,000 Pairs sold
out in 1 second
2019 Tmall
Double 11
No.4 in terms of
sales in sports
industry
Total store traffic on the
launch day: 1.5 million
Big Data
Launch of Key Product “䨻”

30
Full-Category
Model Store
CHINA LI-NING &
Fashion StoreOutlets
Optimize structure and
enhance coverage Focus on shopping malls Improve the quality of
market coverage

31
Opened in early 2019Q4
Store size: approx. 600 sq.mt
Average monthly sales
over 4 million in 2019Q4
Full-
Category
Store
Tianjin Binjiang Road
Modern City Store
Beijing Oriental Plaza Store
Opened in early December 2018
Store size: over 800 sq.mt
Average monthly sales
over 1.55 million in 2019
西安小寨赛格
Opened in late 2018Q2
Store size: approx. 360 sq.mt
Average monthly sales
approx. 1.3 million in 2019
Opened in late 2019Q3
Store size: approx. 360 sq.mt
Average monthly sales
over 700,000 in 2019
Flagship
Store
Guangzhou Grandview Mall
Flagship Store
Chongqing Raffles Store

32
• Total number of stores by the end of 2019: 120 (Channel mainly focuses on key cities in second-tier or above)
• Target to expand the number of stores to 170-200 by the end of 2020
The Venetian Macao Store
成都IFS店 上海来福士店
Taikoo Li Chengdu Store Guangzhou Taikoo Hui Store
Opened in December 2019
Store size: 202 sq.mt
Sales for the first three weeks since
opening in 2019 over RMB2.8 million
Opened in October 2019
Store size: 200 sq.mt
2019 average monthly sales
over RMB3.2 million
Opened in October 2019
Store size: 382 sq.mt
2019 average monthly sales
over RMB3.0 million

33
Basketball
Badminton
Running

34
LI-NING x
DISNEY
Cheer for Chinese players
Assist the battle of Glory
Vibrant and FunFrom “Zero” to
“Clothes”
Raise Awareness of
Environmental
Protection
LI-NING x
“Upanda”
LI-NING x XLARGE/X-girlTrendy and Stylish
“RNG/NEWBEE”
Explore the charm of Chinese culture
Connect the history with the future

35
• #China LI-NING# Weibo topic discussion and reading volume reached 260 million;
• Multi-platform + In-depth content + Numerous forms. The Brand celebrated its 30th
Anniversary by creating hot topics with both highlights and selling points;
• Streetwear matches e-commerce products. See-now-buy-now can effectively
increase the traffic to boost sales
Celebrating 30th Anniversary with Uniqueness and Popularization


Effective Inventory Management
Strategic
Direction
Fitness & Efficiency-driven
Corporate Culture
Discipline Cost Control
Enhance Omni-channel
Organization Efficiency
Optimize Merchandising Capabilities
Store Operation Efficiency
Consumers Focus
37

38
Product planning
and development
Rationalize product
structureOptimize pricing
strategy
Effective
go-to-market
merchandising
planning
Manage
and
control
inventory
Optimize pricing
and discounts

39
Strengthen flagship store
Upgrade visual
merchandisingRefine big store
operating model
Channel
development
plan
Channel upgrade and
optimization

Online Offline2
Continue to develop e-commerce channels to fully integrate online and offline platform
Seamless connection of online and offline systems will complement each other
40
Se
rvic
e
Me
mb
ers
hip
Ch
an
ne
l
Pro
du
ct
Pric
e
Ma
rke
ting

41
Business model of
single store
operation
Standardization of
store operation
Transform the
scope of store
manager
Improve store
efficiency
Team building
and development

42
Integrate
supply chain
resources
Optimized
supply
chain
efficiency
Strengthen
planning and
collaboration
Enhance
research and
development
capabilities
Optimize
supplier matrix
Achieving the transition from passive to proactive production


44*Net Cash = Cash and Cash Equivalents (including restricted bank deposits) – Borrowings
(RMB million)
2019 2018Better/
(Worse)Period ended
31 December
Revenue 13,870 10,511 32.0%
Gross Profit 6,805 5,053 34.7%
Distribution costs -4,445 -3,708 (19.9%)
Administrative expenses -968 -680 (42.4%)
Other income and other gains – net 139 95 46.8%
Operating Profit 1,543 777 98.6%
EBITDA 2,708 1,252 116.2%
Profit Attributable to Equity Holders 1,499 715 109.6%
Basic Earnings per share (RMB cents) 61.94 29.63 109.0%
(RMB million)31 Dec
2019
31 Dec
2018
Better/
(Worse)
Cash and Cash Equivalents 5,961 3,672 62.4%
Borrowings 0 0 N/A
Net Cash* 5,963 3,672 62.4%
Current Liabilities 4,717 2,777 69.8%
Current Ratio (times) 1.8 2.3 (0.5)
Total Liabilities to
Total Assets Ratio43% 33% (10p.p.)

45
2019 2018Better/
(Worse)Period ended
31 December
Gross Profit Margin 49.1% 48.1% 1.0p.p.
Operating Profit Margin 11.1% 7.4% 3.7p.p.
EBITDA Margin 19.5% 11.9% 7.6p.p.
Margin of Profit
Attributable to Equity Holders10.8% 6.8% 4.0p.p.
R&D Expenses (as % of revenue) 2.6% 2.2% (0.4p.p.)
A&P Expenses (as % of revenue) 9.6% 10.4% 0.8p.p.
Staff Costs (as % of revenue) 10.9% 10.8% (0.1p.p.)
2019 2018Better/
(Worse)Period ended
31 December
Inventory Turnover (Days) 68 78 10
Trade Receivables Turnover (Days) 21 36 15
Trade Payables Turnover (Days) 63 74 (11)
Cash Conversion Cycle (Days) 26 40 14
Return on Equity (ROE) 23.2% 13.1% 10.1p.p.
Return on Asset (ROA) 14.1% 8.9% 5.2 p.p.
CAPEX (RMB million) 682 597 14.2%