THE LATEST FIGURES ON THE SWISS LIFE SCIENCES ... · THE LATEST FIGURES ON THE SWISS LIFE SCIENCES...
11
THE LATEST FIGURES ON THE SWISS LIFE SCIENCES & BIOTECHNOLOGY INDUSTRY BROUGHT TO YOU BY C5 COMMUNICATIONS AND BIOTECHGATE
Transcript of THE LATEST FIGURES ON THE SWISS LIFE SCIENCES ... · THE LATEST FIGURES ON THE SWISS LIFE SCIENCES...

THE LATEST FIGURES ON THE SWISS LIFE SCIENCES & BIOTECHNOLOGY INDUSTRY
BROUGHT TO YOU BY C5 COMMUNICATIONS AND BIOTECHGATE

SOURCE: biotechgate.com
The “Swiss Life Sciences Trend Analysis” is based ondata entered in the Biotechgate Databaseavailable at www.biotechgate.com.
The statistics and graphs in this presentation arebased on figures and information entered in thisdatabase and we do not guarantee anyaccuracy hereof.
Switzerland holds only 0.1% of the world’s population, but it remains a leader in wealth,
exports and life sciences.
As a smaller country, Switzerland frequently looks beyond its borders, building strong
international relationships and focusing heavily on exports.
Currently its largest export sector is chemical, pharmaceuticals and biotech, accounting for
41% of total Swiss exports.
Switzerland also houses several large multinational corporations, such as Nestle, Novartis
and Sygenta, who use the region as a hub for their global networks of R&D collaborations
and manufacturing.
The Swiss growth strategy is largely underpinned by an emphasis on constant innovation
and internationalism. A key focus is given to collaboration with foreign researchers and
also to facilitating growth in developing and transitioning countries.

Content
Overview of the Swiss Industry 4
Life Sciences & Biotechnology Industry - Overview 5
Life Sciences & Biotechnology Industry - Number of Employees 6
Life Sciences & Biotechnology Industry - Company Ownership 7
Biotech Companies - Foundation Timeline 8
Biotechnology Companies -Key Activities 9
Biotech products - Breakdown by Indication 10
Biotech products - Pipeline 11
Biotechnology Financing in Switzerland – 5 year report 12
Major Biotech Venture Financing Rounds in 2016 13

2017 Statistics
Total Biotech companies 430
Biotech – Therapeutics and Diagnostics 144
Biotech – R&D Services 208
Biotech - Other 78
Percentage of SMEs 78%
Percentage of publicly owned companies 2%
Biotech venture financing 2015/2016USD 409m /
USD 370m
Licensing opportunities 79
Life Science Industry Biotechnology Industry
April 2017 StatisticsTotal Biotech Companies 430
Medtech companies 232
Pharma companies 70
Investor companies 44
Public / Non-Profit Organizations / Medical Facilities 211
Other life science related companies 1060
Percentage of Publicly Owned Companies 1.8%
Biotech Venture financing 2015 / 2016USD 409m / USD
370m
Life Sciences Venture Financing 2015 / 2016USD 782m / USD
458m
Number of Technologies 201
Licensing Opportunities 92

11-50
28.0%
51-200
22.0%
1-10
33.3%
>200
16.7%
LIFE SCIENCES11-50
30.3%
51-200
23.6%
1-10
34.8%
>200
11.2%
BIOTECH
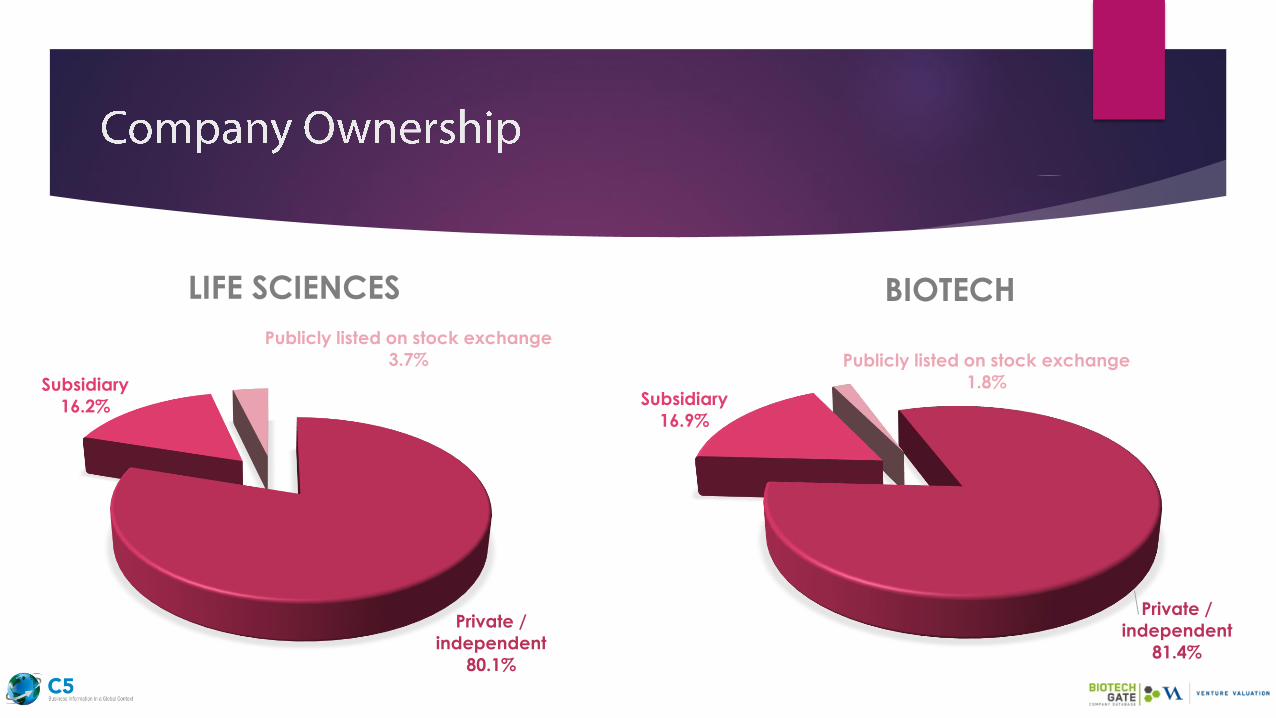
Private /
independent
80.1%
Subsidiary
16.2%
Publicly listed on stock exchange
3.7%
Private /
independent
81.4%
Subsidiary
16.9%
Publicly listed on stock exchange
1.8%
LIFE SCIENCES BIOTECH
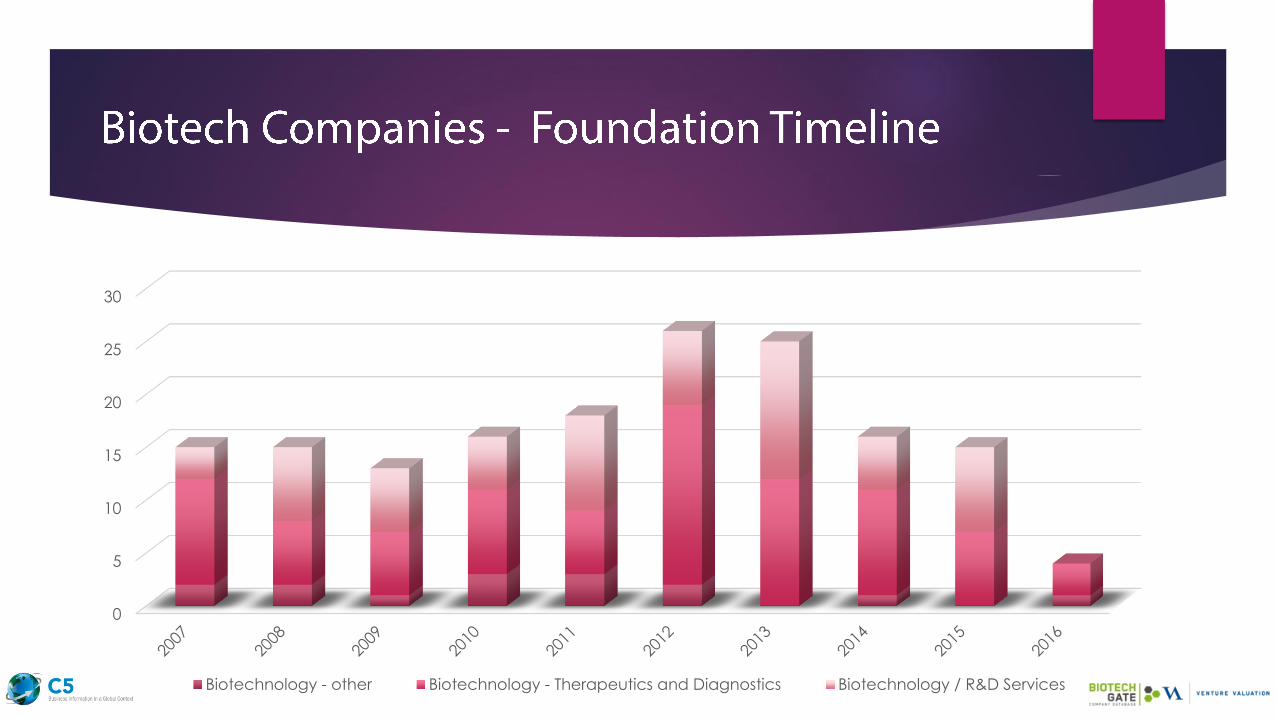
0
5
10
15
20
25
30
Biotechnology - other Biotechnology - Therapeutics and Diagnostics Biotechnology / R&D Services

Biotechnology Companies - Key Activities
AgroBio
1.8%
Bioinformatics and
Bioelectronics
5.8% Contract Research and
Manufacturing
11.1%
Cosmetics
4.5%
Diagnostics and
Analytical Services
17.8%
Drug Delivery
2.7%
Environment
0.7%Food and Nutraceuticals
4.2%
Genomics and Proteomics
5.5%
Industrial Biotechnology
0.9%
Other Services and
Suppliers
22.2%
Therapeutics
20.7%
Veterinary
1.9%

Biotech products - Pipeline
0 20 40 60 80 100 120 140
Phase III
Phase II
Phase I
Preclinical
22
63
55
138
NUMBER OF BIOTECH PRODUCTS IN DEVELOPMENT

Biotechnology Financing – 5 year report
2012 H1 2012 H2 2013 H1 2013 H2 2014 H1 2014 H2 2015 H1 2015 H2 2016 H1 2016 H2
Financing Value 62.1 55.9 115.0 154.8 266.8 93.8 136.6 272.6 225.9 143.9
Count of Rounds 4 5 11 14 16 7 12 14 16 6
0
2
4
6
8
10
12
14
16
18
0.0
50.0
100.0
150.0
200.0
250.0
300.0
Fin
an
cin
g V
alu
e (
Mill
ion
USD
)
Financing Value
Count of Rounds

Download the DRAFT AGENDA by clicking here!
Book your place TODAY at the cheapest price!