THE KWA ZULU-NATAL PROVINCIAL GROWTH AND DEVELOPMENT ... · • Basic Services • More equitable...
46
THE KWA ZULU-NATAL PROVINCIAL GROWTH AND DEVELOPMENT STRATEGY AND PLAN (PGS/P) PROJECT MANAGING THE ROAD TO A REALISTIC YET EXCITING FUTURE 16 September 2013
Transcript of THE KWA ZULU-NATAL PROVINCIAL GROWTH AND DEVELOPMENT ... · • Basic Services • More equitable...

THE KWA ZULU-NATAL PROVINCIAL GROWTH AND DEVELOPMENT STRATEGY AND PLAN
(PGS/P)PROJECT MANAGING THE ROAD TO A REALISTIC YET EXCITING FUTURE
16 September 2013

2
GROWINGOUR ECONOMY
IMPROVEMENT OF THE QUALITY OF LIFEOF ALL PEOPLE LIVING IN
THE PROVINCE OF KWAZULU-NATAL
DEFINING “GROWTH & DEVELOPMENT” IN THE CONTEXT OF THE PGDS
FOR THE

PGDS/P Underlying Principles
3
• Alignment & Integration• One Plan for All “Ownership”
(Government/Labour/Business/Civil Society)• Structured Consultation with Institutional Framework• Clear Roles and Responsibility• Resource Commitments and Budget Alignment
National Provincial Local
Area of Impact

4
Provincial Cabinet
Provincial Planning
Commission (PPC)
Secretariat
Professional Resource Team (PRT)
COHOD Clusters
Organised
Business
Organised
Labour
Community
Sector
National
Depts
Provincial
Depts
Public
Entities
Non Government Consultative Forum(KZN ECONOMIC COUNCIL)
Government Technical Committee
Municipali
ties
Cabinet Planning Committee
Institutional Framework for PGDS/P Review and Implementation

National to Local Alignment
5
IDPs5 Year Term

Aug 2011 PGDS
adopted Aug 2012 PGDP
adopted
The KZN PGDS/P Roadmap
6
Aug 2013 Refined PGDP
adopted
DeptsStrategic Plans &
Budgets and IDPs aligned
to PGDP
Focus now on Implementation and Monitoring :Strategic Objectives Indicators & Targets InterventionsCatalytic ProjectsBudget alignment
1stR
ep
ort
2n
dR
ep
ort

7
KWAZULU-NATAL 2030 Vision
KwaZulu-Natal will bea prosperous Province with a
healthy, secure and skilled population,
acting as a gateway toAfrica and the World

8
KwaZulu-Natal in Global and African Context

307Vision2030
Aspire to …
STRATEGIC GOALS
STRATEGIC OBJECTIVES
KZN PGDS
STRATEGIC FRAMEWORK
• Gateway• Human & Natural Resources• Safe, Healthy & Sustainable
Living Environments• Healthy Educated
Communities• employable people are
employed• Equitable society• Basic Services• More equitable Society• World Class Infrastructure• Investors Confidence • Skilled Labour Force• Focus on People centred-
ness.• Strong & Decisive Leadership• Foster Social Compacts
JOB CREATION1
GOVERNANCE AND POLICY
6
ENVIRONMENTAL SUSTAINABILITY
5
STRATEGIC INFRASTRUCTURE
4
HUMAN RESOURCE DEVELOPMENT
2
SPATIAL EQUITY7
HUMAN &COMMUNITY DEVELOPMENT
3
1. Unleashing the Agricultural Sector 2. Enhance Industrial Development through Trade, Investment
& Exports3. Expansion of Government-led job creation programmes 4. Promoting SMME, Entrepreneurial and Youth Development5. Enhance the Knowledge Economy
6. Early Childhood Development, Primary and Secondary Education
7. Skills alignment to Economic Growth8. Youth Skills Development & Life-Long Learning
9. Poverty Alleviation & Social Welfare10. Enhancing Health of Communities and Citizens11. Enhance Sustainable Household Food Security 12. Promote Sustainable Human Settlements13. Enhance Safety & Security14. Advance Social Capital
15. Development of Harbours 16. Development of Ports17. Development of Road & Rail Networks18. Development of ICT Infrastructure19. Improve Water Resource Management & Supply20. Develop Energy Production and Supply
21. Increase Productive Use of Land 22. Advance Alternative Energy Generation23. Manage pressures on Biodiversity24. Adaptation to Climate Change
25. Strengthen Policy and Strategy Co-ordination & IGR26. Building Government Capacity 27. Eradicating Fraud & Corruption28. Promote Participative, Facilitative & Accountable
Governance
29. Actively Promoting Spatial Concentration 30. Facilitate Integrated Land Management & Spatial
Planning
9
9

Provincial Spatial Development Framework
COMPOSITE
SOCIAL NEEDS
COMPOSITE
ENVRONMENTAL
SENSITIVITY
COMPOSITE
ECONOMIC POTENTIAL
COMPOSITE
ACCESSIBILITY
RANKING TO INFORM INTERVENTION CATEGORIES
10

11
Provincial Spatial Interventions Map
This is where a
Capable,
Responsive,
Caring and
Cooperative
Government
should be at
work

12
Providing a basis for District Alignment
Umkhanyakude District Municipality (DC27)

13
Driving Implementation towards Vision
18 Action Work Groups
30 Objectives
1 Vision
1 KZN Economic Council
Govt Labour BusinessCivil
Society
7 Goals
4 Cabinet Clusters
Sector Specific Councils• Council for
Climate Change and Sustainable Development
• HIV /AIDS Council • HRD Council

14
The KZN PGDP
2030 DESIRED
OUTCOME
2010
BASELINE

Progressive increase in access to basic services
15

KZN GDP and Economic Growth Rate (Quarter on Quarter)
16

KZN Building Plans Approved (m2)
17
0
10,000
20,000
30,000
40,000
50,000
60,000
Poly. (Office and banking space)
Poly. (Shopping space)
Poly. (Industrial and warehouse space)
Poly. (Other)
Square metres

18
KZN Building Plans Approved(R value)
0
20,000
40,000
60,000
80,000
100,000
120,000
140,000
160,000
Average1993
Average1994
Average1995
Average1996
Average1997
Average1998
Average1999
Average2000
Average2001
Average2002
Average2003
Average2004
Average2005
Average2006
Average2007
Average2008
Average2009
Average2010
Average2011
Average2012
Average2013
Poly. (Office and banking space)
Poly. (Shopping space)
Poly. (Industrial and warehouse space)
Poly. (Other)
R'000

Reporting on Indicators and 2015 Targets
Strategic Goal 1: Job Creation
Primary Indicators BaselineTarget
Current2015
Total value of output of all
sectors within the provincial
economy
R 267 billion R 347 billion R 321 billion
Total employment within the
provincial economy of KZN2,400,000 2,548,000 2,520,000
KZN GDP per Capita R28,110 R33,400 R31,284
19

20
SO 2.1 Primary Indicators
Improve early childhood development, primary and secondary education
Primary Indicators BaselineTargets
2015 2020 2025 2030
2.1.1% of 5 year old children in educational institutions
93% 95% 97% 99% 100%
2.1.2% of 4 year old children in educational
institutions
TBD(DOE)
TBD(DOE)
TBD (DOE)
TBD (DOE)
TBD (DOE)
2.1.3 Retention rate grades R to 10 98% 100% 100% 100% 100%
2.1.4 Dropout rate Grades 11 to 12 48% 40% 30% 20% 10%
2.1.5 % of learners in grade 3 achieve 50% in ANA 41% 60% 70% 75% 80%
2.1.6 % of learners in grade 6 achieve 50% in ANA 35% 60% 70% 75% 80%
2.1.7 % of learners in grade 9achieve 50% in ANA TBD
(DOE)60% 70% 75% 80%
2.1.8Number of learners passing NSC with university
entrance47,800 51,600 56,800 61,000 64,000
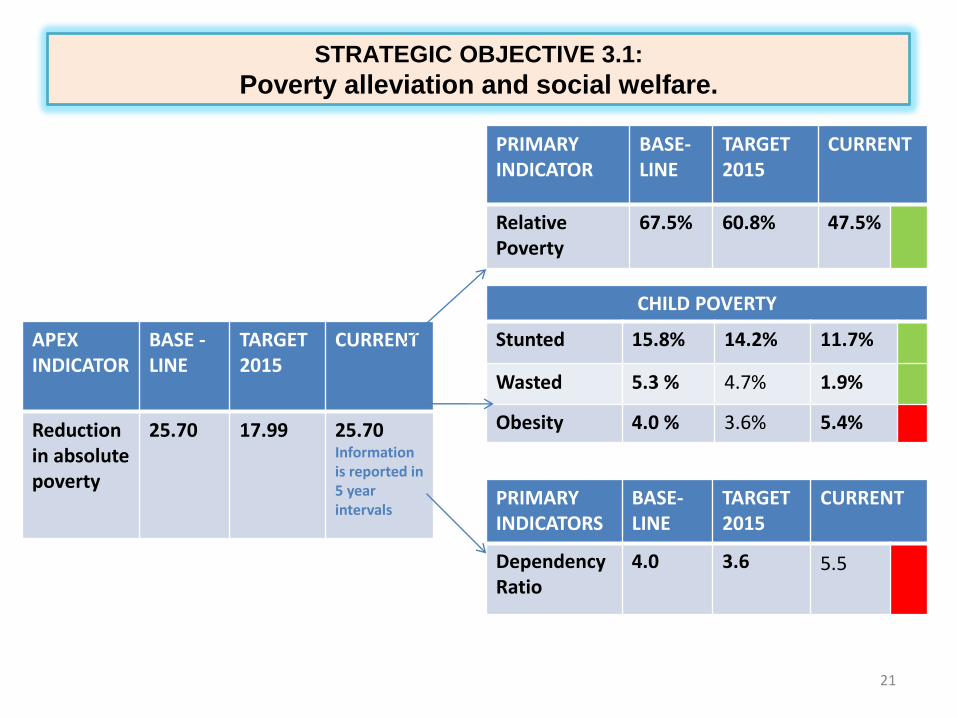
PRIMARY INDICATOR
BASE-LINE
TARGET2015
CURRENT
RelativePoverty
67.5% 60.8% 47.5%
CHILD POVERTY
Stunted 15.8% 14.2% 11.7%
Wasted 5.3 % 4.7% 1.9%
Obesity 4.0 % 3.6% 5.4%
PRIMARY INDICATORS
BASE-LINE
TARGET2015
CURRENT
Dependency Ratio
4.0 3.6 5.5
APEX INDICATOR
BASE -LINE
TARGET2015
CURRENT
Reductionin absolute poverty
25.70 17.99 25.70Informationis reported in 5 year intervals
21
STRATEGIC OBJECTIVE 3.1:
Poverty alleviation and social welfare.

SO 3.2 Primary Indicators
Enhancing health of communities and citizens
Primary Indicators BaselineTargets
2015 2020 2025 2030
3.2.1
Prevalence of
preventable infant,
child and maternal
mortality (/1000, IMR & U5MR; /100 000 MMR)
60 (IMR)
95 (U5MR)
500 (MMR)
54 (IMR)
86 (U5MR)
425 (MMR)
43.2 (IMR)
68 (U5MR)
298 (MMR)
32.4 (IMR)
48 (U5MR)
179 (MMR)
19.5 (IMR)
31 (U5MR)
100 (MMR)
3.2.2Prevalence of
preventable chronic illness
0.59 (HT)
0.16 (diabetes)
8.9 (m obesity)
24.5 (f obesity)
0.53 (HT)
0.14 (diabetes)
8,0 (m obesity)
22.1 (f obesity)
0.48 (HT)
0.13 (diabetes)
6.8 (m obesity)
18.9 (f obesity)
0.43 (HT)
0.12 (diabetes)
5.5 (m obesity)
15.0 (f obesity)
0.39 (HT)
0.10 (diabetes)
4.4 (m obesity)
12.0 (f obesity)
3.2.3
Prevalence and
incidence of
communicable diseases
1.7 (HIV)
295 (TB)
0.66 (malaria)
1.6 (HIV)
266 (TB)
0.58 (malaria)
1.4 (HIV)
239 (TB)
0.52 (malaria)
1.2 HIV)
191 (TB)
0.47 (malaria)
0.8 (HIV)
153 (TB)
0.39 (malaria)
3.2.4 Health adjusted life
expectancy35 37 40 44 47
3.2.5Number of medical
general practitioners
per 100 000 population26.18 27 29 31 33
3.2.6Number of
professional nurses
per 100 000 population137 142 147 152 155
22

23
HIV / AIDS Baseline2015
TargetCurrent
HIV new infections 1.01% <1% 1.01%
Patients on Anti-retorviralTreatment [ART]
319
0151,172,397 727 987
Transmission of HIV from mother to child 10.3% <2% 2.2%
MOTHER & CHILD Baseline2015
TargetCurrent
Facility Maternal Mortality per 100 000
169 135 165.5
Facility infant Mortality Rate [MR]
7.3% 6.9% 4.8%
Facility Under 5 Mortality 6.3% 5.4% 4.1%
Severe Malnutrition9.5/1000 6/1000 6.7/1000
Strategic Objective 3.2
Enhanced health of communities and citizens
TB & MALARIA Baseline2015
TargetCurrent
Tuberculosis [TB] cure rate 65.2% 85% 73.5%
TB Incidence per 100 000 1161 716 899
TB Defaulter Rate 8.1% <5% 4.9%
Malaria Incidence per 1000 1.03% <1 2.2%
LIFESTYLE Baseline2015
TargetCurrent
Diabetes – new cases 74 671 58 947 55 041
Hypertension - new 32 345 24 155 23 856
Obesity - Male 8.9 % 8.0 % 9.0 %
Obesity - Female 24.5 % 22.1 % 24.8 %
Trauma and Injury [emergency cases treated as a result of assault / gun shot, motors vehicle accidents ]
164 231
[2012/13]
Life Expectancy
BaselineTarget for
2015Current
50 [M] 52 53.4
55.2 [F] 57.2 58.7

PRESIDENTIAL INFRASTRUCTURE
CO-ORDINATING COMMISSION
No 18 STRATEGIC INTEGRATED PROJECTS1 Unlocking the Northern Mineral Belt with Waterberg as a Catalyst
2 Durban -Free State - Gauteng Logistics and Industrial Corridor
3 South Eastern Node and Corridor Development
4 Unlock the Economic Opportunities in the North West Province
5 Saldanha - Northern Cape Development Corridor
6 Integrated Municipal Infrastructure Project
7 Integrated Urban Space and Public Transport Programme
8 Green Economy in support of the South African Economy
9 Electricity Generation to support Socio-Economic Development
10 Electricity Transmission and Distribution for all
11 Agri-logistics and Rural Infrastructure
12 Revitalisation of Public Hospitals and other Health Facilities
13 National School Build Programme
14 Higher Education Infrastructure
15 Expanding access to communication technology
16 SKA and Meerkat
17 Regional Integration for African Co-operation and Development
18 Water and Sanitation24

The 2050 Vision Poster
25

Rail Flows Per Direction
0
10
20
30
40
50
60
70
2010201220142016201820202022202420262028203020322034203620382040
Mill
ion
s
Other
Manganese Export
Food&Proc.Food
Maize
Iron&Steel+
Coal Export
Agriculture+
Iron Ore Dom
Coal Power
Coal Domestic
0
10
20
30
40
50
60
70
Millio
ns
Other
Paper+
Petrol
Wheat
Jet Fuel
Agriculture+
Beverages
Coal Domestic
Other Chemicals
Food&Proc.Food
Containers-TN
2012 2019 2041
Containers-TN 1.5 3.3 24.7
Food&Proc.Food 0.3 0.8 8.1
Other Chemicals 0.0 0.2 3.8
Coal Domestic 0.9 3.5 3.6
Beverages 0.0 0.0 3.1
Agriculture+ 0.0 0.0 2.8
Jet Fuel 0.4 0.8 2.0
Wheat 0.3 0.5 1.7
Petrol 0.8 1.4 1.5
Paper+ 0.0 0.1 1.5
Gauteng -> Durban
Durban -> Gauteng
2012 2019 2041
Containers-TN 3.4 6.1 13.8
Coal Domestic 0.8 4.6 11.2
Coal Power 8.3 10.5 11.0
Iron Ore Dom 2.6 3.5 4.7
Agriculture+ 0.0 0.1 3.0
Coal Export 1.4 2.7 2.7
Iron&Steel+ 1.0 1.3 2.3
Maize 0.4 0.7 2.1
Food&Proc.Food 0.0 0.1 1.5
Manganese Export 1.5 1.2 1.2
transportDepartment: TransportPROVINCE OF KWAZULU-NATAL

Road Flows Per Direction
0
10
20
30
40
50
60
70
80
90
Millio
ns
Seasonal Factor (15% of Total)
Safety Margin (30% of Rail)
Other
Non Fe Met Industries
Vegetables
Wood+
Manganese Export
Beverages
Coal Power
Iron Ore Dom
2012 2019 2041
Containers-TN 7.7 9.3 6.7
Food&Proc.Food 6.3 6.9 3.5
Cement 0.7 0.8 2.5
Non Fe Met Industries 0.6 0.7 2.0
Other Chemicals 2.3 2.4 1.6
Wood+ 0.6 0.8 1.6
Petroleum Products 1.0 1.0 1.6
Lime+ 0.6 0.7 1.4
Pharma+ 0.1 0.2 1.3
Coal Domestic 0.7 0.0 1.2
0
10
20
30
40
50
60
70
80
Millio
ns
Seasonal Factor (15% of Total)
Safety Margin (30% of Rail)
Other
Coal Domestic
Pharma+
Lime+
Petroleum Products
Wood+
Other Chemicals
Non Fe Met Industries
Cement
Gauteng -> Durban
Durban -> Gauteng
2012 2019 2041
Containers-TN 6.0 6.0 12.7
Food&Proc.Food 3.4 3.8 4.6
Agriculture+ 3.1 3.7 4.0
Iron Ore Dom 0.0 0.0 2.6
Coal Power 0.0 0.0 1.9
Beverages 1.2 1.4 1.7
Manganese Export 0.2 1.3 1.6
Wood+ 1.2 1.3 1.1
Vegetables 0.6 0.7 1.0
Non Fe Met Industries 0.3 0.4 1.0
transportDepartment: TransportPROVINCE OF KWAZULU-NATAL
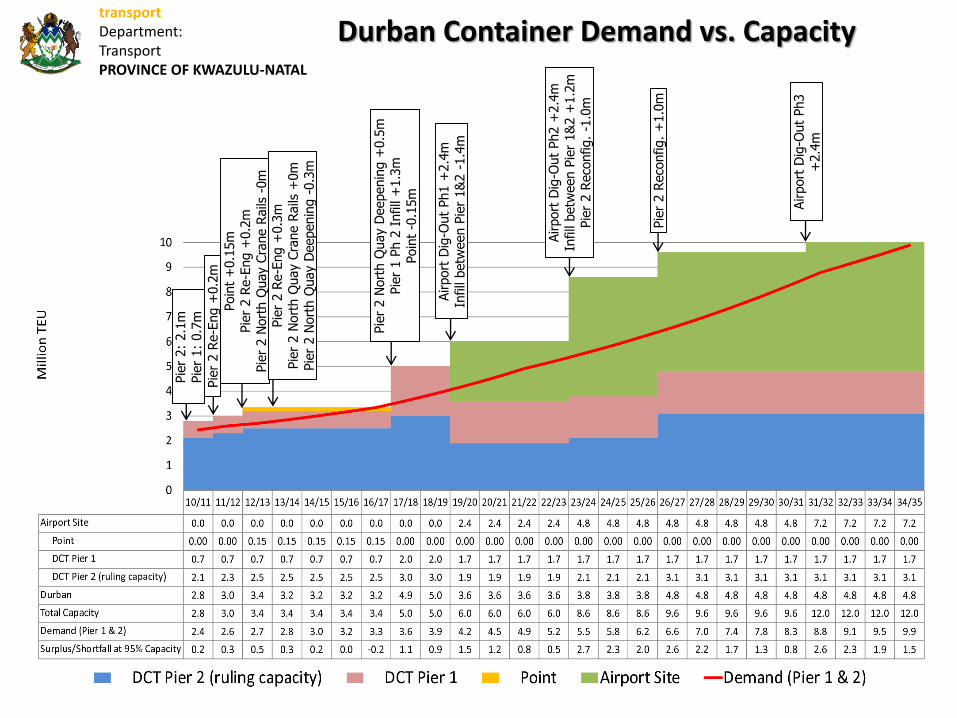
Durban Container Demand vs. Capacity
Airport
Dig
-Out
Ph1 +
2.4
mIn
fill
betw
een P
ier
1&
2 -
1.4
m
Pie
r 2 N
ort
h Q
uay D
eepenin
g +
0.5
mPie
r 1 P
h 2
Infill
+1.3
mPoin
t -0
.15m
Airport
Dig
-Out
Ph2 +
2.4
mIn
fill
betw
een P
ier
1&
2 +
1.2
mPie
r 2 R
eco
nfig.
-1.0
m
Pie
r 2 R
eco
nfig.
+1.0
m
Airport
Dig
-Out
Ph3
+2.4
m
Pie
r 2:
2.1
mPie
r 1:
0.7
m
Pie
r 2 R
e-E
ng +
0.2
m
Poin
t +
0.1
5m
Pie
r 2 R
e-E
ng +
0.2
mPie
r 2 N
ort
h Q
uay C
rane R
ails
-0m
Pie
r 2 R
e-E
ng +
0.3
mPie
r 2 N
ort
h Q
uay C
rane R
ails
+0m
Pie
r 2 N
ort
h Q
uay D
eepenin
g -
0.3
m
transportDepartment: TransportPROVINCE OF KWAZULU-NATAL

Durban Container Terminal: Current View
29

Reconfiguration Phase 1: Pier 1 Phase 2 and North Quay Deepening
30

Reconfiguration Phase 2: Infill between Pier 1 and Pier 2
31

Reconfiguration Phase 3
32

PROPOSED AIRPORT SITE DIG-OUT PORT
33

34
Port of Durban & Airport Site Context
Airport Site Dig-Out Port
Port of Durban

Project Name Stage DurationEstimated Project
Cost
Approved
Funding
Shortfall in
Funding
Funding
Status
Pier 2 DCT Re-
engineering
(R693 Million)
Construction 2012 - 2013
Pier 2 North Quay
Cranes
(R150 Million)
Construction 2011 - 2013
Pier 2 North Quay
Deepening
(R 6 Billion)
Design /
Contracting2012 - 2017
Project Name:
Project Owner:
Project Manager: Project Name Temporary Indirect Spent to date %
Pier 2 DCT Re-
engineering
(R693 Million)
0 63700
Pier 2 North Quay
Cranes
(R150 Million)
0 0
Pier 2 North Quay
Deepening
(R 6 Billion)
0 0
Risks
Challenges
Description
Durban port Container Terminal Re-
engineering and upgrading targeted at
improving the efficiency and capacity of
Pier2 by installing new cranes and
deepening and lengthening the berths
to accommodate larger vessels.
Skills
Developmental
Needs
Number
Container berth outages during delivery and commissioning of
new cranes
Inadequate capacity and skills for the new cranes
Inadequate critical spares for the new cranes
Environmental issues concerning the loss of 4% of the existing sandbank
Unconditional Environmental Aurthorization a serious challenge due to the
impact on the
existing sandbank within the Port
0
Project Dashboard
Type (specify)
0
241
Economic study to determine
R150 million on set back
crane rails, 600million
DCT Re-
Engineering,R28 Million
on Berth Deepening
SIP2 Durban - Free State - Gauteng Logistics and Industrial CorridorKZN - Southern Cluster Projects
Permanent
Socio economic Impact ~ Job Creation Project ProgressTransnet
Port of Durban - PIER 2
R 843 000 000 R 843 000 000
R 6 Billion
Pier 2 for
North Quay
Deepening
Ivan Moonsamy

Project Name Stage DurationEstimated Project
CostApproved Funding Shortfall in Funding
Funding
Status
Dia Dig Out Port
Phase 1
Pre-
feasibility2013 - 2019 R 4 909 000 000 R 3 982 000 000 R 927 000 000
Dia Dig Out Port
Phase 2
Pre-
feasibility2024 - 2026 R 14 757 000 000 R 0 R 14 757 000 000
Dia Dig Out Port
Phase 3
Pre-
feasibility2030 - 2032 R 11 954 000 000 R 0 R 11 954 000 000
Project Name:Dia Dig Out Port
Phase 4
Pre-
feasibility2035 - 2037 R 11 195 000 000 R 0 R 11 195 000 000
Project Owner:
Project Manager: Project Name Temporary Indirect Spent to date %
Dia Dig Out Port
Phase 10 0 R 1 202 700 000 24.5%
Dia Dig Out Port
Phase 20 0 R 0 0.0%
Dia Dig Out Port
Phase 30 0 R 0 0.0%
Dia Dig Out Port
Phase 40 0 R 0 0.0%
Challenges
Number
Description
The phased development of the old
Durban international airport (DIA) site
to a deep-water mega container port,
9.6 m TEUs by 2037.
• Concept, pre-feasibility and feasibility
studies
•Purchase of land from ACSA and 31
other properties
•Promulgation of the port
•Appointment of a port developer
and/or operators
•Sustainable development strategy
•Environmental impact assessments
and EA
SIP2 Durban - Free State - Gauteng Logistics and Industrial CorridorKZN - Southern Cluster Projects
Project Dashboard
DIA Dig Out Port
Socio economic Impact ~ Job Creation
Permanent
0
0
Major mobilisation of Durban South Basin communities and
activities against the project
Environmental and Stakeholder
Funding
Transnet
Marc Descoins
Project Progress
Resolution of DPW land acquisition strategy and relocation of
SAAF and SAPS Airwing
Relocation of single-buoy mooring for oil tankers
Promulgation of Port i.t.o current legislation
0
0
Risks
Skills
Developmental
Needs
0Type
(specify)


Project Name Stage DurationEstimated Project
Cost
Approved
Funding Shortfall in Funding
Funding
Status
Interchange between the
Watson Highway and the
DTP link road
Concept 2018 - 2020 R 120 000 000 R 0 R 120 000 000
Interchange on airport link
road, at the entrance to the
passenger terminal
Concept 2015 - 2017 R 120 000 000 R 0 R 120 000 000
Watson Highway upgrade Concept R 87 920 000 R 0 R 87 920 000
Project Name:Dube West / R102
realignmentConcept R 1 202 000 000 R 0 R 1 202 000 000
Project Owner:
Project Manager: Project Name Temporary Indirect Spent to date %
Interchange between the
Watson Highway and the
DTP link road
0 0 R 0 0.0%
Interchange on airport link
road, at the entrance to the
passenger terminal
0 0 R 0 0.0%
Watson Highway upgrade 0 0 R 0 0.0%
Dube West / R102
realignment0 0 R 0 0.0%
SIP2 Durban - Free State - Gauteng Logistics and Industrial CorridorKZN - Southern Cluster Projects
Project Dashboard
Dube Tradeport (2)
Dube Tradeport Socio economic Impact ~ Job Creation Project Progress
Permanent
Description
* Interchange between the Watson
Highway and the DTP link road.
* Watson Highway upgrade
0
0
0
0
Skills Developmental
NeedsNumber 0
Type (specify)
Challenges
Environmental issues relating to an alleged non-compliance with the
original ROD for the first phase of the airporttradeport has led to
delays
Risks

Catalytic Projects
Proposed Public Sector Catalytic Projects
PROJECT PROJECT DETAIL VALUE MUNICIPALITY
1 Airport Rapid Rail Transit Develop fast-rail from Kwadukuza through Dube
Tradeport/Airport, Gateway/Umhlanga, to Durban
R5 Billion + eThekwini
2 Cornubia 50 000 units (inc. 20 000 subsidised housing) +
90ha industrial platform + 1m bulk m2 commercial
floor
R24 Billion eThekwini
3 Dube Trade Aerotropolis 250ha industrial/logistics park + 1 400 000m2
business park/logistics/offices + 240000m2
commercial floor area + 10 000 units
R34.5 Billion eThekwini
4 Durban Dig-out Port Green-field Port Development on DIA site Phase 1:
R105 Billion
eThekwini
5 Durban Port Expansion Dealt with under SIP2 TBD eThekwini
6 Inland Port/Hub/Terminals Logistics R2.5 Billion+ eThekwini
7 iSimangaliso Wetland Park Support for greater infrastructure development in
and around the Park
TBD uMkhanyakude
8 KZN Broadband To roll out backbone and access networks
broadband infrastructure to all 51 municipalities of
the province so that broadband services are
available to all parts of the province
R2.8 billion KZN Municipalities
39

Catalytic Projects
Proposed Public Sector Catalytic Projects
40
PROJECT PROJECT DETAIL VALUE MUNICIPALITY
9 Makathini Flats Agriculture Intensive development of high-value agriculture
and processing thereof at Makhatini.
TBD uMkhanyakude
10 Nonoti Beach Tourism
Resort
IDC Project - 272 hotel rooms and self-catering
units of 3* and 4*. Also a 5* tented camp of 18
suites.
This is to be built on community-owned land
and they will become partners in the business
R 400
Million
Ilembe
11 Passenger Cruise Terminal Development of world-class cruise ship
passenger handling facilities to attract more
cruise tours.
TBD eThekwini
12 Regional Airports Development of regional airports as catalyst for
new investments and development in small
towns.
TBD KZN Municipalities
13 Richards Bay IDZ 216ha Purpose built industrial estate R1.5 Billion uThungulu
14 Richards Bay Port
Development
Development of extensive container handling
capacity at port of Richards Bay
TBD uThungulu

Catalytic Projects
Proposed Public Sector Catalytic Projects
PROJECT PROJECT DETAIL VALUE MUNICIPALITY
15 Thukela Agricultural Hub Proposed development of a high-value
intensive farming zone for local and export
markets.
TBD uThukela
16 Thukela Estate Agricultural
Project
Private sector partnership with the Thukela
Estate Committee
( 500ha Crop production, 50ha Vegetable
production & 1000ha grazing land)
R500 Million uThukela
17 Thukela Health and
Wellness centre
Private hospital, Rehabilitation centre, Step-
down facility, Residential development, Medical
treatment
R1,2 Billion Mandeni
18 Tugela Dam Development of a new dam on the Thukela
River with extensive capacity for hydro-energy
generation.
TBD Msunduzi
19 Vulindlela 292 ha site, 2458 affordable housing
opportunities, 62ha of Light Industrial,
Commercial and Retail
R410 Million Msunduzi
20 Vulindlela (Msunduzi)
Housing Project
Development of extensive housing and a “new
town” in the Vulindlela area of Msunduzi.
TBD Msunduzi
41

Catalytic Projects
Proposed Private Sector Catalytic Projects
PROJECT PROJECT DETAIL VALUE MUNICIPALITY
1 Ballito ICC 4000 delegate convention centre with 198
room 3* or 4* hotel, office park and a 640
parking bays
R1 Billion Ilembe
2 Ballito Industrial Park 62ha Industrial site R560 Million Ilembe
3 Bluff Headlands Property maximisation & redevelopment on
old military land
R13 Billion + eThekwini
4 Blythedale Coastal Resort,
Blythedale Beach
5123 Residential opportunities, with 1095
affordable housing opportunities, 40 000
m2 commercial & retail space, 1200 sleeper
hotel & resort, water theme park, school of
golf, sporting school of excellence
R3 Billion
land sale
R12 Billion
plus top
structure
Ilembe
5 Clairwood Racecourse Property maximisation & redevelopment on
old course
TBD eThekwini
6 Compensation Flats
industrial & business park
development: Ballito
100ha industrial/logistics
140ha business park offices
R9 Billion Ilembe
7 Durban Film Studio Development of a Hollywood style,
beachfront film studio
R700 Million eThekwini
42

Catalytic Projects
Proposed Private Sector Catalytic Projects
43
PROJECT PROJECT DETAIL VALUE MUNICIPALITY
8 Durban Logistics (Automotive)
Park
Logistics & Automotive sector R8 Billion+ eThekwini
9 Hilton – Mondi Project 100ha Total: 50ha Business Park; 12ha
Office; 11ha Retail; 6ha Residential R3 Billion
Msunduzi
10 Shoprite Checkers
Distribution Centre
Retail/Wholesale sector R1.2 Billion eThekwini
11 Sibaya Phases 1 & 5 - 100 000 m2 commercial floor
area + 2300 units + 500 hotel rooms
R3.4 Billion eThekwini
12 Wewe Driefontein
Mixed Use Development
620ha Driefontein-Wewe Flats Estate
(Industrial, Agric & Housing)
Multi Billions iLembe
13 Zimbali Lakes 1150 units + Hotel resort + golf course and
commercial
R3,0 Billion iLembe
14 Thukela Health and Wellness
centre
Private hospital, Rehabilitation centre, Step-
down facility, Residential development,
Medical treatment
R1,2 Billion Mandeni
15 Dube Trade Port mega
industrial park
This entails further expansion to the Dube
Trade Port
R2 Billion eThekwini

Catalytic Projects
Proposed Private Sector Catalytic Projects
44
PROJECT PROJECT DETAIL VALUE MUNICIPALITY
16 Ngagane Steel Smelter Proximity to Newcastle, this smelter will
enhance the competitiveness of the regions’
production.
R10 Billion Amajuba
17 iLembe Techno Park Electrical and components manufacturing R2 Billion iLembe
18 Mt Edgecombe Light Industrial
Park
A new light industrial park with space for
new medium and micro enterprises.
R 48 Million eThekwini
19 KZN Technology /Science Park
project
Establish Technology parks at the primary
industrial nodes of the province(eThekwini,
PMB, Richards Bay, Newcastle and Port
Shepstone) - in prioritised Techno-Economic
science growth focus areas with R & D &
Innovation being a compulsory theme.
R12 billion Various
200 Kwa Zulu Natal RED HUB
development
250 MW of renewable energy generation;
excess of 4000 jobs from 2020
R5 Billion eThekwini &
iLembe
21 Sugar Association Renewable
Energy Generation plan
Creation of 900MW of renewable energy
generation creating 34 406 jobs
TBD Various

Is the KwaZulu-Natal Business Community keen and gearedto maximise opportunities in areas such as:• Transport, Freight and Logistics;
• Manufacturing (Automotive, Rail and Maritime);
• Retail, Finance and Commerce;
• Higher Education, Knowledge Economy and Skills Development;
• Agriculture and Processing
• Infrastructure Development and Construction;
• Tourism;
• Green Economy
45
The Big Question?