The Gender Jobs Split How young men and women experience the labour market

The jobs impact of COVID19: Rapid labour force survey (RLFS/E) First wave, August 2020supported by the ‘Project on Addressing the Root Causes of Migration in Ethiopia’

Copyright © International Labour Organization 2020 First published 2020
Publications of the International Labour Office enjoy copyright under Protocol 2 of the Universal Copyright Convention. Nevertheless, short excerpts from them may be reproduced without authorization, on condition that the source is indicated. For rights of reproduction or translation, application should be made to ILO Publishing (Rights and Licensing), International Labour Office, CH-1211 Geneva 22, Switzerland, or by email: [email protected]. The International Labour Office welcomes such applications.
Libraries, institutions and other users registered with a reproduction rights organization may make copies in accordance with the licences issued to them for this purpose. Visit www.ifrro.org to find the reproduction rights organization in your country.
ISBN: 9789220334003 (Web PDF)
This document was produced with the financial assistance of the European Union. The views expressed herein can in no way be taken to reflect the official opinion of the European Union.
The designations employed in ILO publications, which are in conformity with United Nations practice, and the presentation of material therein do not imply the expression of any opinion whatsoever on the part of the International Labour Office concerning the legal status of any country, area or territory or of its authorities, or concerning the delimitation of its frontiers.
The responsibility for opinions expressed in signed articles, studies and other contributions rests solely with their authors, and publication does not constitute an endorsement by the International Labour Office of the opinions expressed in them.
Reference to names of firms and commercial products and processes does not imply their endorsement by the International Labour Office, and any failure to mention a particular firm, commercial product or process is not a sign of disapproval.
Information on ILO publications and digital products can be found at: www.ilo.org/publns.
Design and layout by the International Training Centre of the ILO, Turin – Italy

The jobs impact of COVID19: Rapid labour force survey (RLFS/E), First wave, August 2020 III
ForewordThis note presents the findings of a rapid phone survey of the labour market, conducted in Ethiopia in August 20201. The data was collected by calling mobile phone owners using Random Digit Dialling (RDD) methods. In total, 2,500 persons aged 18 to 64 residing in urban areas2 completed the survey. Questions covered the situation of respondents before the pandemic (in February) and at the time of the survey (during the previous week or month, depending on the variable) 3. Some 35,000 mobile-phone users were called to reach the sample target. The survey was designed in line with the ILO Statistical Department’s guidance for rapid surveys on the impact of COVID19 on the labour market4. This note presents the findings for the first wave of the survey. A series of rapid surveys will be carried out in 2020 and 2021, to monitor the evolving impact of the COVID19 pandemic.
Key findings X Unemployment is up and inactivity is decreasing, as households need additional members to start
earning an income. Precarious work is growing as formal employment shrinks and informal work progresses;
X The crisis is hitting the weaker much harder. Rising unemployment and loss of income have been much more marked for the least educated, who are also those for whom earning an income is a matter of survival in the very short term. While incomes from employment have remained stable in the formal sector, they have dropped significantly in the informal economy (-30%);
X 80 per cent of businesses are reporting weaker demand, but two-thirds also report supply-side challenges. Only 7 per cent of businesses in the sample report were unaffected. As might be expected, the hardest hit sector is hospitality, bars and restaurants, with income losses of 50 per cent since February.
X Online or home-based work is not an option for most employees and business owners (72 and 78 per cent).
X The outlook in August was gloomy; 60 per cent of workers were afraid of losing their jobs in the coming weeks, and two out of three businesses expect sales in 2020 to be “much worse” than in 2019.
1 This note was prepared by Luca Fedi and Chema Triki, with help from Elisa Benes, Sevane Ananian, Niall O’Higgins, Mauricio Dierckxsens and Ruchika Bahl. The data was collected by Ethiopoll.
2 Urban centres have been defined here as settlements of 50,000 persons or more; a question on residency before the COVID19 crisis was included at the beginning of the questionnaire.
3 Within the sample, a module for enterprise owners who hire at least one employee was administered to 178 respondents. 4 ILO: COVID-19: Guidance for labour statistics data collection. Capturing impacts on employment and unpaid work using Rapid
Surveys. May 2020

The jobs impact of COVID19: Rapid labour force survey (RLFS/E), First wave, August 2020IV
Sampled population, coverage and bias
Where the validity of this survey and any potential bias is concerned, the sample is comparable with the population of the Urban Employment and Unemployment Survey (UEUS), last conducted in 2018 by the Central Statistics Agency on a large, nationally representative sample. The regional distribution of our RLFS/E sample aligns well with the regional distribution of the Ethiopian population in the UEUS (see Annex for more details). Activity rates and the occupational structure of the employed also closely mirror each other. The RLFS/E sample is slightly younger and more educated than the UEUS 2018 population. The one significant difference between the two populations is in the gender distribution: the RLFS/E sample includes significantly more males (66% v. 37 per cent) while the UEUS 2018 population is more balanced. These differences are consistent with the differences to be expected between the population5 owning mobile phones and the general population. Differences in the way the questionnaires are structured preclude direct comparisons between survey findings on a range of indicators.
The COVID19 epidemic in Ethiopia and Government responses
5. See inter alia: Mobile Gender Gap Report 2018, GSMA
2/26
/20
3/3/
20
3/9/
20
3/15
/20
3/21
/20
3/27
/20
4/2/
20
4/8/
20
4/14
/20
4/20
/20
4/26
/20
5/2/
20
5/8/
20
5/14
/20
5/20
/20
5/26
/20
6/1/
20
20001800
160014001200
1000
800600400200
0
X30 April: Economic package announced. Tax forgiveness and suspension, liquidity injections.
X8 April: State of emergency declared. Ban on lay-offs. Transportation of persons reduced to 50% capacity. Hotels, cafes, and restaurants remain open with social distancing measures. Public communication campaigns
X30 January: WHO declares novel coronavirus outbreak a public health emergency of international concern (PHEIC). Passenger screening at Addis international airport.
X11 March: WHO declares COVID19 outbreak a pandemic. Disruptions to international travel and trade.
X13 March: First COVID19 case detected in Ethiopia. 16 March: schools, sporting events and public gatherings suspended.international travel and trade.
X20 March: suspension of some international flights. 23 March: closure of land borders. 31 March: General elections postponed.
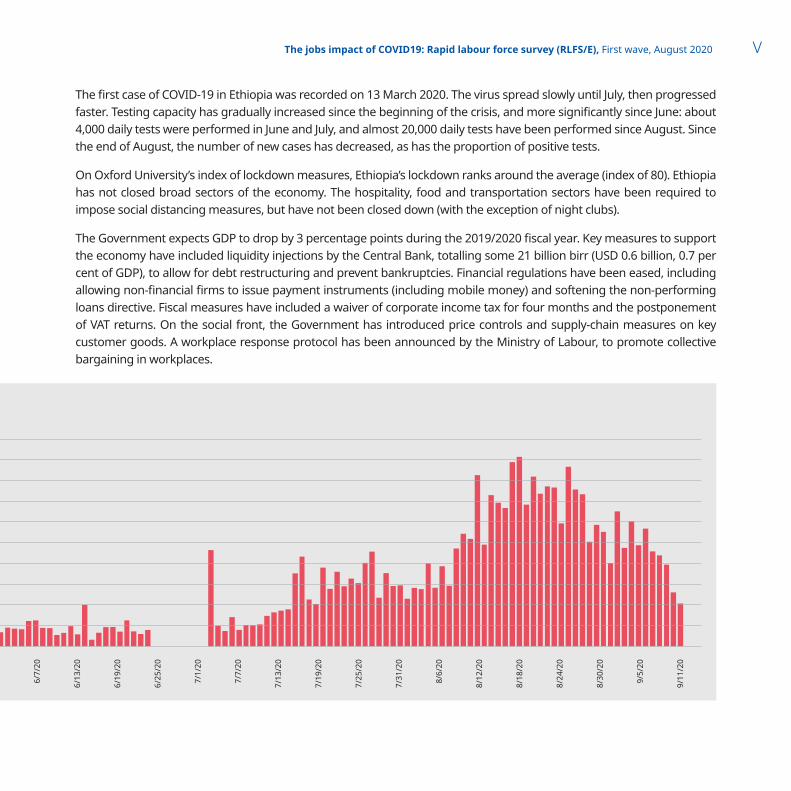
Figure 1. Number of daily new cases
The jobs impact of COVID19: Rapid labour force survey (RLFS/E), First wave, August 2020 V
The first case of COVID-19 in Ethiopia was recorded on 13 March 2020. The virus spread slowly until July, then progressed faster. Testing capacity has gradually increased since the beginning of the crisis, and more significantly since June: about 4,000 daily tests were performed in June and July, and almost 20,000 daily tests have been performed since August. Since the end of August, the number of new cases has decreased, as has the proportion of positive tests.
On Oxford University’s index of lockdown measures, Ethiopia’s lockdown ranks around the average (index of 80). Ethiopia has not closed broad sectors of the economy. The hospitality, food and transportation sectors have been required to impose social distancing measures, but have not been closed down (with the exception of night clubs).
The Government expects GDP to drop by 3 percentage points during the 2019/2020 fiscal year. Key measures to support the economy have included liquidity injections by the Central Bank, totalling some 21 billion birr (USD 0.6 billion, 0.7 per cent of GDP), to allow for debt restructuring and prevent bankruptcies. Financial regulations have been eased, including allowing non-financial firms to issue payment instruments (including mobile money) and softening the non-performing loans directive. Fiscal measures have included a waiver of corporate income tax for four months and the postponement of VAT returns. On the social front, the Government has introduced price controls and supply-chain measures on key customer goods. A workplace response protocol has been announced by the Ministry of Labour, to promote collective bargaining in workplaces.
6/7/
20
6/13
/20
6/19
/20
6/25
/20
7/1/
20
7/7/
20
7/13
/20
7/19
/20
7/25
/20
7/31
/20
8/6/
20
8/12
/20
8/18
/20
8/24
/20
8/30
/20
9/5/
20
9/11
/20

The jobs impact of COVID19: Rapid labour force survey (RLFS/E), First wave, August 2020VI
Contents
1. Employment and unemployment . . . . . . . . . . . . . . . . . . . . . . . . . . . . . . . . . . . . . . . . . . . 1
2. Wages and incomes . . . . . . . . . . . . . . . . . . . . . . . . . . . . . . . . . . . . . . . . . . . . . . . . . . . 4
3. Entrepreneurs and small businesses . . . . . . . . . . . . . . . . . . . . . . . . . . . . . . . . . . . . . . . . . 7
4. Have you had to…? Household coping strategies . . . . . . . . . . . . . . . . . . . . . . . . . . . . . . . . 10
5. Shift to online and home-based work . . . . . . . . . . . . . . . . . . . . . . . . . . . . . . . . . . . . . . . 12
6. The outlook . . . . . . . . . . . . . . . . . . . . . . . . . . . . . . . . . . . . . . . . . . . . . . . . . . . . . . . . 13
ANNEX . . . . . . . . . . . . . . . . . . . . . . . . . . . . . . . . . . . . . . . . . . . . . . . . . . . . . . . . . . . . . 14

The jobs impact of COVID19: Rapid labour force survey (RLFS/E), First wave, August 2020 1
This and subsequent surveys are designed to measure unemployment over the week preceding each survey, to allow for comparisons across the successive waves. A baseline estimate for the pre-COVID-19 situation has been produced for this first wave, and is presented here6. Unemployment has increased significantly between the pre-COVID estimate and the August measure. It is worth noting that not all of these additional job-seekers have lost their jobs in the interval; as further illustrated below, a large share of formerly inactive persons have started seeking employment
COVID-19 has also limited opportunities to look for jobs: among those in the potential labour force, 73 per cent were not searching for a job “because of COVID-19”. It is therefore useful to consider additional measures of labour underutilization. When those who are not actively searching for a job7, are added to the number of unemployed, both the extent of unemployment and disparities by age and gender are magnified. When focusing on labour underutilisation (LU3), both the impact and disparities by age and gender are magnified.
6 In our questionnaire, the procedure adopted for establishing February’s “baseline” estimate is not the same as the procedure used for estimating unemployment in August. There is greater precision in the August figure, and some memory effects can also not be discounted for the earlier figure.
7 This is referred to in labour statistics as “the combined rate of unemployment and potential labour force”, or LU3. See for reference: 19th ICLS, para. 73(c ): http://www.ilo.ch/wcmsp5/groups/public/---dgreports/---stat/documents/normativeinstrument/wcms_230304.pdf and https://www.ilo.org/wcmsp5/groups/public/---dgreports/---stat/documents/publication/wcms_644467.pdff
Figure 2. Unemployment rates,
February and August, %
12
7
Pre-Covid August
1. Employment and unemployment

The jobs impact of COVID19: Rapid labour force survey (RLFS/E), First wave, August 20202
Figure 3. Unemployment rates: standard definition (left) and
including those not actively searching (right), %, August
Total Youth Females
12
2617
3422
46
Formal employment is contracting. Inactivity (the number of persons who do not want to work) is also decreasing, as households require a second or third member to start earning an income.
Figure 4. Changes in the working age population
-16%
Pre-Covid August
Formally Employed
Unformally Employed
Inactive
Unemployed+1%
+80%
-9%

The jobs impact of COVID19: Rapid labour force survey (RLFS/E), First wave, August 2020 3
Prior to the COVID-19 epidemic, as in other African countries8, those with a higher level of educational attainment were more likely to be unemployed. Such people are more likely to have the means to look for a job and wait for a suitable one to come along, rather than take up the first income-generating opportunity that presents itself. Since March, rising unemployment has had the most significant effect on those with lower educational attainment, in other words those for whom earning an income is a matter of survival in the very short term.
8 See for instance the ILO Report on employment in Africa, 2020. https://www.ilo.org/wcmsp5/groups/public/---africa/---ro-abidjan/documents/publication/wcms_753300.pdf
Figure 5. Unemployment by educational attainment, %
Not finished Primary Education
1213 13
14
11
3
67
9
6
Primary Education
Secondary Education
Tertiary Education
No formal Education
Pre-Covid August
The jobs impact of COVID19: Rapid labour force survey (RLFS/E), First wave, August 20204
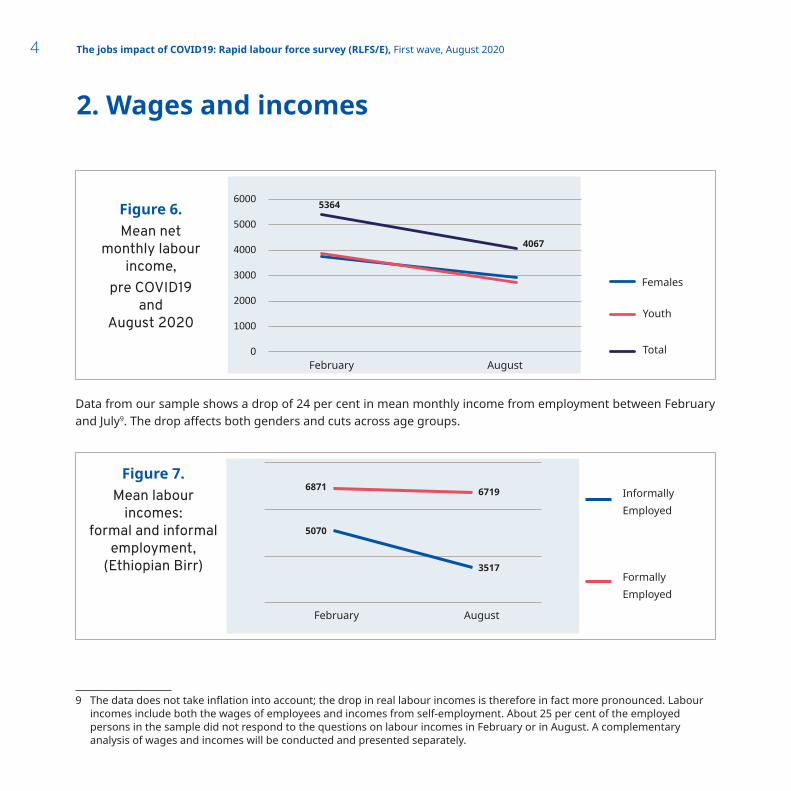
Data from our sample shows a drop of 24 per cent in mean monthly income from employment between February and July9. The drop affects both genders and cuts across age groups.
9 The data does not take inflation into account; the drop in real labour incomes is therefore in fact more pronounced. Labour incomes include both the wages of employees and incomes from self-employment. About 25 per cent of the employed persons in the sample did not respond to the questions on labour incomes in February or in August. A complementary analysis of wages and incomes will be conducted and presented separately.
2. Wages and incomes
0
1000
2000
3000
4000
5000
6000 5364
February August
Females
4067
Youth
Total
Figure 6. Mean net
monthly labour income,
pre COVID19 and
August 2020
Figure 7. Mean labour
incomes: formal and informal
employment, (Ethiopian Birr)
February August
6871 6719
5070
3517
Informally Employed
Formally Employed
The jobs impact of COVID19: Rapid labour force survey (RLFS/E), First wave, August 2020 5
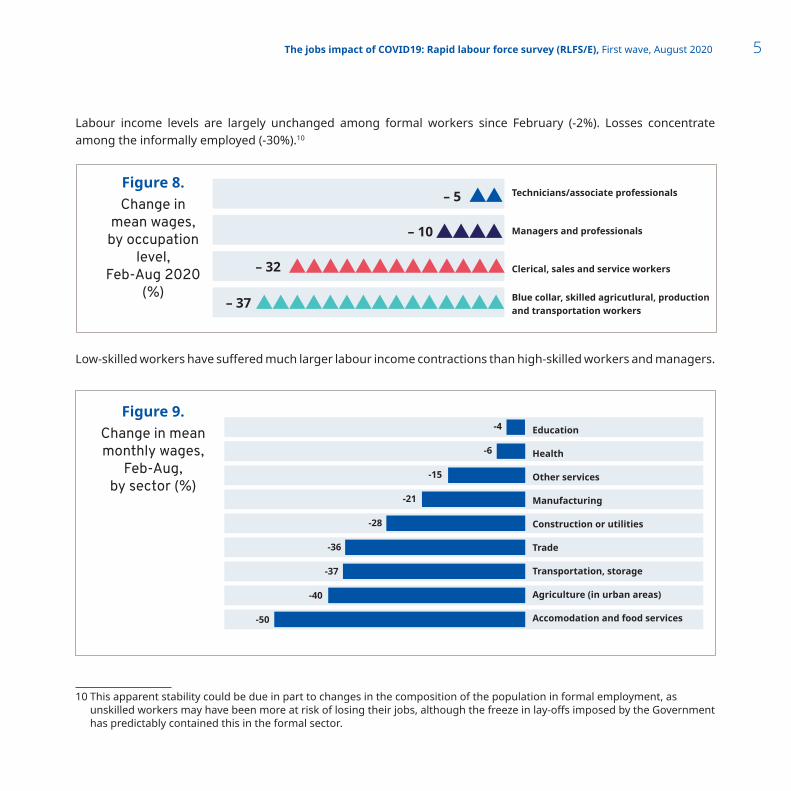
Labour income levels are largely unchanged among formal workers since February (-2%). Losses concentrate among the informally employed (-30%).10
Low-skilled workers have suffered much larger labour income contractions than high-skilled workers and managers.
10 This apparent stability could be due in part to changes in the composition of the population in formal employment, as unskilled workers may have been more at risk of losing their jobs, although the freeze in lay-offs imposed by the Government has predictably contained this in the formal sector.
Education
Health
Other services
Manufacturing
Construction or utilities
Trade
Transportation, storage
Agriculture (in urban areas)
Accomodation and food services
Figure 9. Change in mean monthly wages,
Feb-Aug, by sector (%)
Figure 8. Change in
mean wages, by occupation
level, Feb-Aug 2020
(%) Blue collar, skilled agricutlural, production and transportation workers
X – 5
– 10
X – 37
Technicians/associate professionals
Managers and professionals
Clerical, sales and service workers
-4
-6
-15
-21
-28
-36
-37
-40
-50
X –32
– 5
– 37
– 32

The jobs impact of COVID19: Rapid labour force survey (RLFS/E), First wave, August 20206
As might be expected, labour income losses vary largely between sectors. Hospitality, bars and restaurants are the hardest hit, with a mean labour income loss of 50 per cent. Urban agriculture11, logistics and trade are also heavily affected.
63% of respondents indicate their incomes have dropped since February.
11 Urban agriculture is only a small fraction of the overall agricultural sector.
Figure 10. How has your
household income changed since
February Much worse
Somewhat worse
About the same
Somewhat better
Much better
28,6%
1.1 %
35,9 %
6,7 %
27,7 %

The jobs impact of COVID19: Rapid labour force survey (RLFS/E), First wave, August 2020 7
3. Entrepreneurs and small businesses
Figure 11. How do your sales
compare to last year’s?
Much worse
Somewhat worse
About the same
Somewhat better
Much better
Figure 12. Sales compared
to last year: share of “much
worse” answers by economic sector
(%)
Education
Other services
Accomodation and food services
Trade
Construction or utilities
Urban agriculture
Manufacturing
Health
Transportation, storage
Total
100 %
86 %
79 %
76 %
71 %
60 %
57 %
50 %
40 %
73 %
73,3 %
16,2 %
6,7%
1.0 %2,9 %

The jobs impact of COVID19: Rapid labour force survey (RLFS/E), First wave, August 20208
Eighty per cent of businesses are reporting weaker demand and two-thirds report supply-side challenges. Only 7 per cent report being unaffected. The impact on business revenue is severe across sectors; business owners in education (locked-down sector), hospitality, food and trade are more numerous in reporting that sales will be “much worse” this year compared to the last.
Figure 13. Business
challenges
Figure 14. Business
status
Loss in client demand
Difficulties in accessing supplies, price increases
Difficulties with worker absenteism, sickness
Difficulties reconciling business and family (care taking responsabilities)
No particular challenge, things have proceeded as normal
80 %
68 %
37%
7 %
32 %
Temporarily closed due to public measures taken for the COVID-19 outbreak (lockdown)
Temporarily closed not directly due to lockdown measures
Permanently closed due to factors unreleated to the COVID-19 outbreak
Permanently closed due to challenges releated to the COVID-19 outbreak
Business remain open
13 %
13 %
66 %
2 %
4 %

The jobs impact of COVID19: Rapid labour force survey (RLFS/E), First wave, August 2020 9
Only 5 per cent of businesses indicate that they have accessed government support, though it is worth noting that the financial liquidity and regulatory measures taken by the central bank would probably not be identifiable by enterprises as government support.
Figure 15. Access to public
support for enterprises
95% 5%
Yes
No

The jobs impact of COVID19: Rapid labour force survey (RLFS/E), First wave, August 202010
4. Have you had to…? Household coping strategies
Figure 16. Since the end of February 2020, have you or any member of your
household had to...?
Sell assets to purchase food, medicine or essentials
Going back to your village or family
Borrowing from a bank, employer, or private lender to purchase food, medicine or other essentials
Ask for money from family, relatives, or friends living abroad
Ask for money from family, relatives, or friends
Take money out of savings
Start growing your own food
None
Don't know
Others
18 %
14 %
0 %
2 %
18 %
14 %
13 %
15 %
7 %
71 %

The jobs impact of COVID19: Rapid labour force survey (RLFS/E), First wave, August 2020 11
A third of households had had to reduce their food consumption in the week immediately preceding the interview.
Only 3 per cent had received social assistance in the form of cash or food in addition to pre-existing government programmes. Among those who said they had had to reduce their food intake, the share of those receiving food or cash was only slightly higher, at 4 per cent.
Figure 17.
Last week, have you or any household member experienced...
Reduced food consumption
Unable to buy the amount of food we usually buy because our household income has dropped
Unable to buy the amount of food we usually buy because the price of food increased
Unable to buy the amount of food we usually buy because of shortages of food in markets
Difficulties in going to food markets due to mobility restrictions imposed by government/closures
Figure 18.
In the past month, did you receive any food, cash or other support from the government that you do NOT usually receive?
34 %
43.3 %
68,9 %
26,1 %
44.2 %
Figure 19.
Additional public support within those who had to reduce their food intake
No, none
PPEs such as gloves, masks, soap, sanitizer
Food
Cash
83,4%
14,4%0,7%
2,5%
No, none
PPEs such as gloves, masks, soap, sanitizer
Food
Cash
88%
8%1%3.2%

The jobs impact of COVID19: Rapid labour force survey (RLFS/E), First wave, August 202012
5. Shift to online and home-based work
Sixteen per cent of employees and 13 per cent of business owners have been able to shift some of their work online or to their home. Another 5 and 7 per cent respectively have not been able to do so for lack of IT equipment and connectivity. For most (72 and 78 per cent), home-based or online work is not an option.
Figure 20.
Employees Since February, have you been able to do more work from home or online?
Figure 21.
Business owners Since February, have you been able to do more work from home or online?
No, lacking internet connection or IT equipment
Yes
No Other
No, the work cannot be done online or at home
72 %
5 %
16 %
6 %
No, lacking internet connection or IT equipment
Yes
No Other
No, the work cannot be done online or at home
7 %
13 %
77 %
2 %

The jobs impact of COVID19: Rapid labour force survey (RLFS/E), First wave, August 2020 13
6. The outlook
In August, the outlook for workers and businesses was quite gloomy. Sixty per cent of workers were afraid of losing their jobs, and two thirds of businesses expected sales in 2020 to be “much worse” than in 2019. The informally employed and those in low-skilled jobs were much more likely to be “very worried”.
Figure 22.
I'm very worried about losing my job
Blue collar, skilled agricutlural, production and transportation workers
Clerical, sales and service workers
Technicians/associate professionals
Managers and professionals
41 %
43.3 %
21 %
16%
33 %
Figure 23.
I'm very worried about losing my job
Formally employed
Unformally employed
17%
32 %
Figure 24.
Businesses: outlook for sales in 2020 compared to 2019
Much worse
62,6 %

The jobs impact of COVID19: Rapid labour force survey (RLFS/E), First wave, August 202014
Annex
Survey methods and implementationA frame of 40,000 random presumed mobile numbers was generated, based on an estimated ratio of completed interviews on lines to be called. 35,642 mobile phone users were actually contacted before the set target of 2,500 completed interviews (7 per cent) was reached. The distribution of phone call outcomes is shown in the table below. 60 per cent of valid calls12 resulted in a completed interview, 18 per cent refused the interview or did not complete it, and 22 per cent did not speak one of the four languages of the survey (Amharic, Affan Oromo, Tigrigna and Somali).
When a respondent did not speak the language of a given enumerator, a second call by another enumerator speaking the language was arranged. Phone calls were conducted from Monday to Saturday between 8.30 a.m. and 6.00 p.m., and on Sundays between 10.00 a.m. and 6.00 p.m. Requests to reschedule calls were accepted and some call-backs were made outside these hours. Active lines that were not answered were tried three times at least at three hours intervals.
Phone call outcomes
Inactive 15,741
No answer after 3 attempts 13,798
Not eligible 1,877
Not completed, refused 784
Did not speak one of the 4 languages of the survey 950
Completed questionnaires 2,533
Total 35,642
12 Not counting inactive lines, lines not answered after three attempts, and non-eligible respondents (age and residence

The jobs impact of COVID19: Rapid labour force survey (RLFS/E), First wave, August 2020 15
Benchmarking this survey with the UEUS 2018It is useful to compare the socio-demographic characteristics of our sample with large-sample surveys conducted by the Central Statistics Agency of Ethiopia. The Urban Employment and Unemployment Survey of 2018, conducted by Ethiopia’s Central Statistics Agency, is both the most recent and the most relevant wide-sample survey for a socio-demographic comparison of the characteristics of our sample with the general population of urban Ethiopia.
X Our sample includes a significantly higher share of males than females (67-33%), while the UEUS 2018 sample
finds a higher presence of females in urban areas; this probably reflects a significant gender gap in mobile phone ownership in Ethiopia, as is the case in other African countries and world regions.
X Our sample includes fewer persons in the older age groups (35-54 and 55-64) and more in younger age groups.
X Our sample includes fewer persons with “primary attainment or less” and “secondary attainment”, and a higher presence of tertiary graduates. As well as an increase in the share of tertiary attainment since 2018 and the gender bias in mobile phone ownership, this may be related to the broader definition of urban areas in the UEUS (i.e. settlements of more than 1,000 persons), as compared to the definition used here (settlements of more than 50,000 inhabitants). Tertiary graduates are less likely to be found in a sample including smaller towns.
X The distribution of occupations in our sample closely mirrors the UEUS 2018 distribution. The UEUS sample includes more top-level occupations – managers and professionals – than technicians and associate professionals, probably on account of issues with the definition and coding of “managers”. The expected hierarchy between occupational levels is found on our sample.
X The overall economic participation rate of our sample is close to the rate measured by the UEUS 2018 survey: for those aged 18-64, the rate measured by the UEUS in 2018 was 79 per cent; in our survey (pre-Covid), it is 77 per cent.

The jobs impact of COVID19: Rapid labour force survey (RLFS/E), First wave, August 202016
Figure 24.
Regional Distribution of the Sample
Addis-Ababa
33,22% 33,66%
Mekele Adama (Nazret) Awasa (Hawassa) Bahir Dar
3,61% 3,51% 3,73% 3,48% 3,33% 3,29% 4,71% 3,08%
Completed interviews (%) Expected Sample (%)

The jobs impact of COVID19: Rapid labour force survey (RLFS/E), First wave, August 2020 17
Tertiary education
Figure 25.Sample population by age group
Figure 26.Sample population by educational attainment
Figure 27.Sample population by occupation
Figure 28.Gender distribution
This sample
33%
67%
53%
47%
UEUS
7%55 - 64 4%
35 - 54 30%27%
18 - 2430%
28%
25 - 3439%
36%
This SampleUEUS 2018 This SampleUEUS 2018
33%27%
This SampleUEUS 2018
8%13%
42%42%
Blue collar, skilled agricoltural production and transoprtation workers
Managers an professionals
Technicians/associate professionals
Clerical sales and service workers
36%35%
8%15%
Male
Female
Secondary education
Primary education or less
36%39%
31%34%

ISBN: 978-92-2-033400-3