The Japanese Employment System after the Bubble Burst: New ...
66
The Japanese Employment System after the Bubble Burst: New Evidence* Ryo Kambayashi and Takao Kato** March 2009 Prepared for Japan’s Bubble, Deflation and Long-term Stagnation, Federal Reserve Board San Abstract Taking advantage of our first access to micro data from the 2002 Employment Status Survey (ESS) as well as previous years of the ESS, we provide new evidence on changes in the “lifetime employment” practice which serves as a foundation for the Japanese employment system. Overall, we find evidence for the resilience of the Japanese employment system. Job stability of regular employees did not fall much during the first five years of Japan’s Great Recession following the bubble. Our cohort analysis of narrowly-defined “lifetime employment” workers (new school graduate hires) also points to the stability of the size of the “lifetime employment” pool over time. To be consistent with the enduring nature of the ‘lifetime employment” system, we also find some evidence for the buoyancy of other complementary elements of the Japanese employment system. This, however, does not mean the complete rigidity of the Japanese employment system. Apparently the Japanese employment system has evolved in response to Japan’s prolonged stagnation. First, job stability of regular employees eventually fell during the final years of the Great Recession. It took years yet the magnitude of the fall turned out to be notable and for some groups of workers it was large. Second, the burden of downsizing during Japan’s prolonged stagnation fell disproportionately on women as opposed to men and on high- school graduates as opposed to college graduates. The largest fall in job stability was found for female regular employees who were mid-career hires and working for large firms. We interpret our findings as a largely rational response of Japanese firms that were in dire need for downward employment adjustment yet were concerned about the cost of reneging on their implicit long- term employment contracts. *We benefitted greatly from comments from the Editorial Committee, Joe Altonji, Till von Wachter, and other participants at the ESRI Workshop on Japan’s Bubble, Deflation and Long- term Stagnation, March 21 - 22, 2008, Columbia University. **Kato is W.S. Schupf Professor of Economics and Far Eastern Studies, Colgate University; Research Fellow, IZA Bonn; and Research Associate, Center on Japanese Economy and Business (Columbia Business School), Tokyo Center for Economic Research (University of Tokyo), and Center for Corporate Performance (Aarhus School of Business). Ryo Kambayashi is Associate Professor, Institute of Economic Research, Hitotsubashi University. Kato is the corresponding author: Email; [email protected] . Address: Department of Economics (Persson 222),Colgate University, 13 Oak Drive, Hamilton, NY 13346. Phone: 315-228-7562 Fax: 315- 228-7033
Transcript of The Japanese Employment System after the Bubble Burst: New ...
The Japanese Employment System after the Bubble Burst: New Evidence*
Ryo Kambayashi and Takao Kato**
March 2009
Prepared for Japan’s Bubble, Deflation and Long-term Stagnation, Federal Reserve Board San
Abstract Taking advantage of our first access to micro data from the 2002 Employment Status Survey (ESS) as well as previous years of the ESS, we provide new evidence on changes in the “lifetime employment” practice which serves as a foundation for the Japanese employment system. Overall, we find evidence for the resilience of the Japanese employment system. Job stability of regular employees did not fall much during the first five years of Japan’s Great Recession following the bubble. Our cohort analysis of narrowly-defined “lifetime employment” workers (new school graduate hires) also points to the stability of the size of the “lifetime employment” pool over time. To be consistent with the enduring nature of the ‘lifetime employment” system, we also find some evidence for the buoyancy of other complementary elements of the Japanese employment system. This, however, does not mean the complete rigidity of the Japanese employment system. Apparently the Japanese employment system has evolved in response to Japan’s prolonged stagnation. First, job stability of regular employees eventually fell during the final years of the Great Recession. It took years yet the magnitude of the fall turned out to be notable and for some groups of workers it was large. Second, the burden of downsizing during Japan’s prolonged stagnation fell disproportionately on women as opposed to men and on high-school graduates as opposed to college graduates. The largest fall in job stability was found for female regular employees who were mid-career hires and working for large firms. We interpret our findings as a largely rational response of Japanese firms that were in dire need for downward employment adjustment yet were concerned about the cost of reneging on their implicit long-term employment contracts.
*We benefitted greatly from comments from the Editorial Committee, Joe Altonji, Till von Wachter, and other participants at the ESRI Workshop on Japan’s Bubble, Deflation and Long-term Stagnation, March 21 - 22, 2008, Columbia University.
**Kato is W.S. Schupf Professor of Economics and Far Eastern Studies, Colgate University; Research Fellow, IZA Bonn; and Research Associate, Center on Japanese Economy and Business (Columbia Business School), Tokyo Center for Economic Research (University of Tokyo), and Center for Corporate Performance (Aarhus School of Business). Ryo Kambayashi is Associate Professor, Institute of Economic Research, Hitotsubashi University. Kato is the corresponding author: Email; [email protected]. Address: Department of Economics (Persson 222),Colgate University, 13 Oak Drive, Hamilton, NY 13346. Phone: 315-228-7562 Fax: 315-228-7033
1
The Japanese Employment System after the Bubble Burst: New Evidence
I. Introduction
In the 1980s, the Japanese employment system became a source of wonder for many
corporations around the world and a popular subject of research for scholars in industrial
relations, human resource management, and labor economics. There is indeed some evidence that
the aforementioned Japanese employment system helped Japanese firms enhance their
productivity.1 However, during Japan’s prolonged stagnation following the bubble, the popular
rhetoric shifted and became less positive about the Japanese employment system. In particular,
the practice of “lifetime employment” (or implicit long-term employment guarantees for the
regular workforce), which is often considered a foundation for the Japanese employment system,
has been criticized as an important example of “rigidity” of the Japanese labor market and hence
a structural impediment to the swift and robust recovery of the Japanese economy (Ono and
Rebick, 2003).2
In addition, there is currently a lively debate among scholars and policy makers
surrounding the viability of the practice of “lifetime employment” and the role of public policy
in influencing such a practice. For instance, Chuma (1998) and Ono and Rebick (2003) argue a
change in the legal environment in Japan following the first oil crisis in the mid-1970s made it
even more difficult for Japanese employers to lay off their employees, resulting in increased
1 See, for instance, Jones and Kato (1995), Ohkusa and Ohtake (1997), and Kato and Morishima
(2002). 2 The term “lifetime” is somewhat of a misnomer since except for executives, Japanese workers
have been typically subject to mandatory retirement that occurs around age 60. A precise definition of the practice of lifetime employment is therefore implicit long-term employment contract that ends at mandatory retirement for the regular workforce. In addition, the practice of “lifetime employment” does not necessarily mean that layoffs never happen in large Japanese firms. It has been documented that Japanese firms, even large ones, did lay off some of their regular employees, following the first oil crisis (see, for example, Koike, 2005, Suruga, 1998, Nakata, 2003, Chuma, 2002).
2
rigidity of the Japanese labor market and heightened barriers to the development of effective
external labor markets. Such absence of effective external labor markets allegedly fosters
inefficient allocation of labor and hence lower productivity (see Ariga and Okazawa, 2007 for
such labor market mismatch during the Great Recession). However, recent work on employment
protection laws in Japan points to long-term stability of the legal environment surrounding
employment protection in Japan at least up until 1997 (see, for instance, Kambayashi and
Kawaguchi, 2008). Furthermore, theorists stressing the positive incentive effects of job security
in formation of firm-specific human capital and knowledge and the importance of institutional
complementarity predict the resilience of “lifetime employment” as an equilibrium (Aoki, 2000
and Moriguchi and Ono, 2004).
In spite of such a lively debate, we are struck by the surprising paucity of rigorous and
useful evidence on changes in the practice of “lifetime employment” or lack thereof during
Japan’s long-term stagnation.3 Specifically we desperately need reliable evidence on: (i) whether
the “lifetime employment” system evolved in response to real adverse shocks following the
bubble burst and if so: (ii) in what way and (iii) how quickly. Only after obtaining satisfactory
answers to such key questions, we can begin to understand the precise role that the employment
system played in Japan’s prolonged stagnation.4
This paper fills this important gap in the literature by providing much-needed rigorous
evidence on changes in the practice of “lifetime employment” after the bubble burst (or lack
thereof). Overall, we find evidence for the resilience of the Japanese employment system. Job
stability of regular employees did not fall much during the first five years of Japan’s Great
Recession following the bubble. Our cohort analysis of narrowly-defined “lifetime employment”
3 We are not the first to recognize an urgent need for such evidence (Dore, 1996) 4 A few earlier attempts include Genda and Rebick (2000), Kato (2001, 2003), and Ono and
Rebick (2003).
3
workers (new school graduate hires) also points to the stability of the size of the “lifetime
employment” pool over time. This, however, does not mean the complete rigidity of the Japanese
employment system. First, job stability of regular employees eventually fell during the final
years of the Great Recession. It took years yet the magnitude of the fall turned out to be notable
and for some groups of workers it was large. Second, the burden of downsizing during Japan’s
prolonged stagnation fell disproportionately on women as opposed to men and on high-school
graduates as opposed to college graduates. The largest fall in job stability was found for female
regular employees who were mid-career hires and working for large firms. We interpret the
findings as a rational response of Japanese firms that were in dire need for downward
employment adjustment yet were concerned about the cost of reneging on their implicit long-
term employment contracts.
In the next section, we set out our empirical strategy while reviewing prior studies briefly.
The subsequent four sections present our key findings, followed by the concluding section in
which we highlight and interpret our key findings.
2. Prior Studies and Data
Ono (2007) provides a comprehensive and up-to-date review of the literature and
concludes that the existing evidence on changes in the “lifetime employment” system during
Japan’s prolonged stagnation is mixed and that different groups of workers (such as women vs.
men; young vs. old; high tenure vs. low tenure; large vs. small firms) tend to be exposed to
different kinds of changes, pointing to the importance of disaggregated analysis. In this section,
instead of repeating a full literature review, we demonstrate that data limitations (especially the
lack of access to up-to-date micro data from the Employment Status Survey) have been a major
4
culprit for prior studies’ inability to provide conclusive evidence, and that our paper overcomes
the data challenge and produces much needed reliable and updated evidence on changes in
Japan’s “lifetime employment” system during Japan’s prolonged stagnation.
Hashimoto and Rasian (1985) provide the first rigorous evidence on the practice of
“lifetime employment” during Japan’s high growth period (1962-77) by applying the procedures
developed by Hall (1982) to aggregate data from the Employment Status Survey (the Japanese
counterpart of CPS tenure supplements of the U.S.).5 To study the possible transformation of
Japan’s “lifetime employment” system, Kato (2001) used published and unpublished tables from
various years of the Employment Status Survey (ESS)6 and estimated the ten-year job retention
rates of Japanese employees (probability of a Japanese employee to work for the same employer
for the next ten years) for the two time periods (ten years before and after the bubble burst. Kato
(2001) finds no evidence that the ten-year job retention rates of Japanese employees fell from the
period prior to the bubble burst to the post-bubble stagnation period.
As Kato (2001) acknowledges, however, the latest data available to calculate the job
retention rates at the time of his research were from the 1997 ESS, and Japan’s stagnation turned
out to have continued for five more years. It is quite plausible that those additional five years of
stagnation might have finally caused Japanese firms to start weakening the practice of “lifetime
employment.”
Considering the final years of the Great Recession is particularly important for two
5 Interest in studies of the importance of long-term employment in the U.S. was rekindled in late
1990s in light of the rising popular perception of disappearing long-term jobs in the U.S. In response, a number of researchers in the U.S. have been using CPS tenure supplements to address this popular perception (see, for example, Farber, 1998, and Neumark, et. al., 2000).
6 There is, however, an alternative dataset available for Japan, i.e., the Basic Survey of Wage Structure (often called the Wage Census data). Though the Wage Census data are obtained from an establishment-level survey and hence not comparable to CPS tenure supplements, they provide information necessary to calculate job retention rates. The use of this alternative data source turned out to produce similar results, i.e., no evidence for the weakening lifetime employment (Chuma, 1998).
5
reasons. First, prior to its 1998 revision, Japan’s Labor Standards Law prohibited Japanese firms
from offering multi-year fixed-term contracts. As a result, Japanese firms were in essence forced
to choose between indefinite contracts (or open-ended contracts) and fixed-term contracts of one
year or less when contemplating to offer jobs to prospective employees. As such, Japan’s Labor
Standards Law may have given Japanese firms incentives to hire more workers under indefinite
contracts. The 1998 revision relaxed the prohibition of multi-year contracts, and hence made it
easier for Japanese firms to hire fixed-term contract workers. Apparently the relaxation of the
Labor Standards Law with regard to multi-year fixed contracts was consequential. For example,
according to the Yuki-Keiyaku-Rodo ni Kansuru Jittai-Chosa (Survey on Fixed-term Labor
Contracts) conducted by the Japanese government in 2005, nearly one in four fixed-term contract
workers were under multi-year contracts. Since being on indefinite contracts is often a
prerequisite for “lifetime employment”, the 1998 revision of the Labor Standards Law is
potentially a cause for the weakening of the “lifetime employment” system (Ono and Rebick,
2003).
Second, recent macroeconomic studies of employment adjustment in Japan tend to
suggest that the speed of adjustment of labor input to output at the macro level rose as Japan’s
stagnation continued (Higuchi, 2001 and Miyanaga, 2002).7
The unavailability of data covering the final years of the Great Recession is not the only
data limitation that plagued prior studies. The practice of “lifetime employment” was never
applied equally to all employees in Japan.8 Therefore, more serious data limitation of prior
empirical studies of Japan’s “lifetime employment” is the lack of access to individual worker-
7 We are, however, aware that microeconomic studies of employment adjustment using firm-level
micro data often fail to find such evidence (Kambayashi and Kawaguchi, 2008). This paper is the first to address this issue, using individual worker-level micro data.
8 Ono (2007) summarizes differing views on the scope of “lifetime employment” (Table 1).
6
level micro dataset which provides information on tenure (number of years with the firm).
Indeed, Moriguchi and Ono (2004) argue that the scope of “lifetime employment” has been
evolving over time and speculate that the significant expansion of the scope of “lifetime
employment” occurred during the bubble period in large part as a response to the economy-wide
severe labor shortage.9 It is perfectly plausible that the scope of the “lifetime employment”
practice might have been receded during Japan’s prolonged stagnation and that implicit “lifetime
employment” contracts were withdrawn from the segment of the Japanese labor force that were
added to the pool of “lifetime employees” during the bubble period. As such, the lifetime
employment system may prove to be resilient, maintaining the core segment while not covering
other segments of the Japanese labor force (e.g., female regular workers, regular employees who
were hired in mid-career). Publicly available aggregate data from the ESS do not allow for
detailed disaggregate analysis necessary for addressing such important questions.
We were extremely fortunate to be able to persuade the Japanese government to grant us
full access to individual-level micro data from the Employment Status Survey (ESS) for 2002,
1997, 1992, and 1987.10 The ESS provides rich information on individual employees (not only
job tenure but also various other individual characteristics including gender, age, education,
employment status (regular vs. non-regular), and firm size. In short, we take advantage of our
first access to micro data from the ESS including the most recent 2002 data and overcome the
aforementioned two key data challenges of prior studies.
9 Chuma (1998) provides evidence for such an expansion of the scope of the lifetime employment
practice. 10 Though we are the first to use the 2002 ESS to study job retention, aggregate data from the
2002 ESS data are being analyzed by several researchers. For instance, a recent working paper by Farber (2007) uses the 2002 ESS as well as the ESS from previous years and CPS Tenure Supplements and conducts an intriguing cross-national comparison of the evolution of long-term employment between Japan and the U.S. with particular focus on the role of unique institutions in labor adjustments to globalization in recent years.
7
3. Changes in Ten-year Job Retention Rates before and after the Bubble Burst
Follow the standard job retention formula used by prior studies (Hall, 1982, Hashimoto
and Raisian, 1985, and Kato, 2001), we calculate the ten-year job retention rates of all regular
employees for the three time periods, 1982-1992, 1987-1997 and 1992-2002. Specifically,
1. we first use the base year ESS (1982, 1987, and 1992) and calculate the proportion of
civilian noninstitutional population who are regular employees in each age-tenure
category, say ages 25-29 with 0-4 years of tenure (or the total number of regular
employees ages 25-29 with 0-4 years of tenure, divided by the civilian noninstitutional
population in the corresponding age category or ages 25-29);
2. we then use the ESS ten years later (1992, 1997, and 2002) and calculate the proportion
of civilian noninstitutional population who are regular employees in ages 35-39 with 10-
14 years of tenure (or the total number of regular employees ages 35-39 with 10-14 years
of tenure, divided by the civilian noninstitutional population in the corresponding age
category or ages 35-39); and
3. we finally divide the proportion regular employees ages 25-29 with 0-4 years of tenure as
obtained in the first step by the proportion regular employees ages 35-39 with 10-14
years of tenure as derived in the second step.
The resulting ratio is the ten-year job retention rate of regular employees ages 25-29 with 0-4
years of tenure.11 We focus on regular employees as opposed to non-standard employment
workers (such as fixed-term contract workers, subcontract temporary workers, part-timers and
11 Using the number of employees in each age-tenure category itself instead of using its ratio to
the relevant civilian noninstitutional population will change the ten-year job retention rates very little, as expected for Japan since immigration and incarceration are far less important in Japan than in other major industrialized economies, such as the U.S. and Germany.
8
other contingent workers) in our study of changing “lifetime employment”, for the literature
almost unanimously considers non-standard employment workers outside of the “lifetime
employment” system (see, for instance, Koike, 1977 and Ono, 2007).12
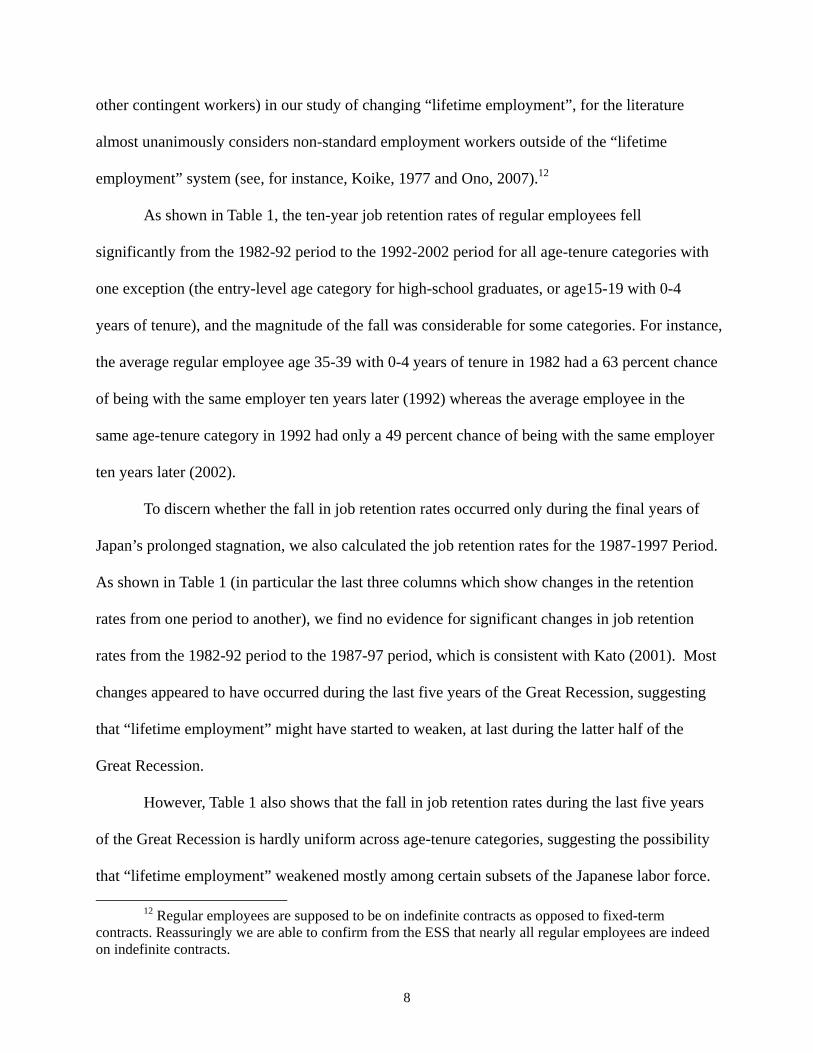
As shown in Table 1, the ten-year job retention rates of regular employees fell
significantly from the 1982-92 period to the 1992-2002 period for all age-tenure categories with
one exception (the entry-level age category for high-school graduates, or age15-19 with 0-4
years of tenure), and the magnitude of the fall was considerable for some categories. For instance,
the average regular employee age 35-39 with 0-4 years of tenure in 1982 had a 63 percent chance
of being with the same employer ten years later (1992) whereas the average employee in the
same age-tenure category in 1992 had only a 49 percent chance of being with the same employer
ten years later (2002).
To discern whether the fall in job retention rates occurred only during the final years of
Japan’s prolonged stagnation, we also calculated the job retention rates for the 1987-1997 Period.
As shown in Table 1 (in particular the last three columns which show changes in the retention
rates from one period to another), we find no evidence for significant changes in job retention
rates from the 1982-92 period to the 1987-97 period, which is consistent with Kato (2001). Most
changes appeared to have occurred during the last five years of the Great Recession, suggesting
that “lifetime employment” might have started to weaken, at last during the latter half of the
Great Recession.
However, Table 1 also shows that the fall in job retention rates during the last five years
of the Great Recession is hardly uniform across age-tenure categories, suggesting the possibility
that “lifetime employment” weakened mostly among certain subsets of the Japanese labor force.
12 Regular employees are supposed to be on indefinite contracts as opposed to fixed-term contracts. Reassuringly we are able to confirm from the ESS that nearly all regular employees are indeed on indefinite contracts.
9
To explore such a possibility further, we repeat the same analysis for men and women separately.
Likewise, we study college graduates and non-college graduates as well as employees of firms
with different firm sizes separately.
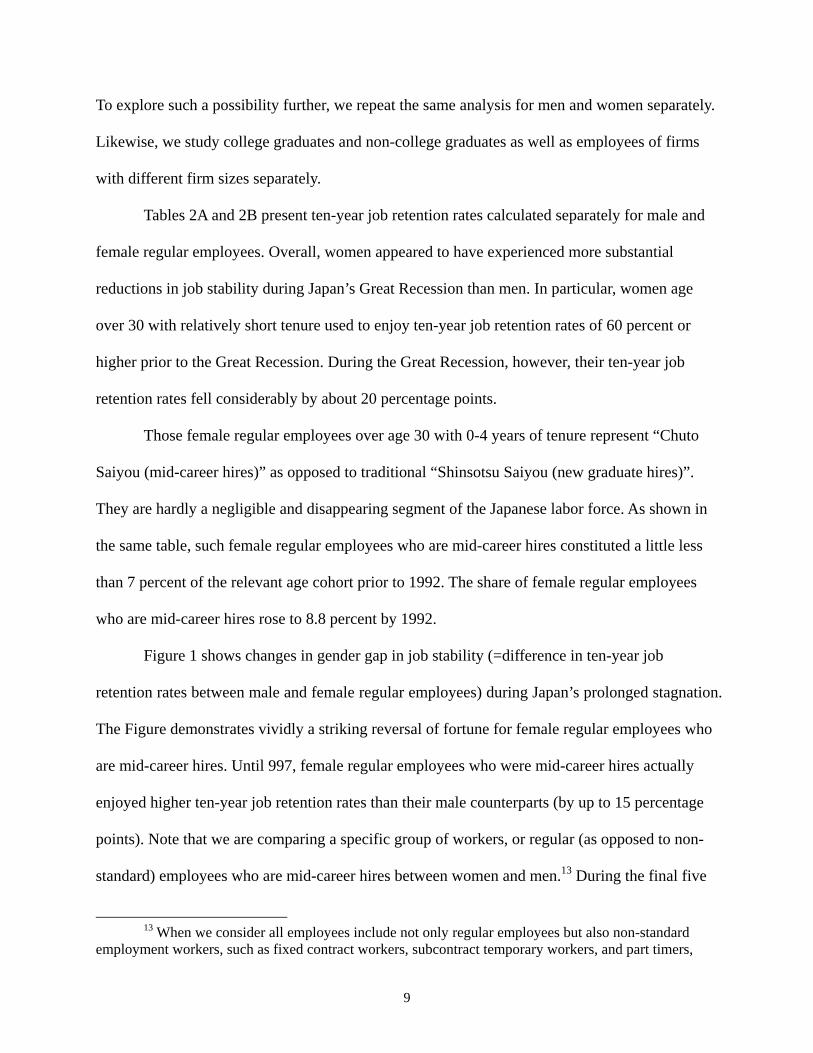
Tables 2A and 2B present ten-year job retention rates calculated separately for male and
female regular employees. Overall, women appeared to have experienced more substantial
reductions in job stability during Japan’s Great Recession than men. In particular, women age
over 30 with relatively short tenure used to enjoy ten-year job retention rates of 60 percent or
higher prior to the Great Recession. During the Great Recession, however, their ten-year job
retention rates fell considerably by about 20 percentage points.
Those female regular employees over age 30 with 0-4 years of tenure represent “Chuto
Saiyou (mid-career hires)” as opposed to traditional “Shinsotsu Saiyou (new graduate hires)”.
They are hardly a negligible and disappearing segment of the Japanese labor force. As shown in
the same table, such female regular employees who are mid-career hires constituted a little less
than 7 percent of the relevant age cohort prior to 1992. The share of female regular employees
who are mid-career hires rose to 8.8 percent by 1992.
Figure 1 shows changes in gender gap in job stability (=difference in ten-year job
retention rates between male and female regular employees) during Japan’s prolonged stagnation.
The Figure demonstrates vividly a striking reversal of fortune for female regular employees who
are mid-career hires. Until 997, female regular employees who were mid-career hires actually
enjoyed higher ten-year job retention rates than their male counterparts (by up to 15 percentage
points). Note that we are comparing a specific group of workers, or regular (as opposed to non-
standard) employees who are mid-career hires between women and men.13 During the final five
13 When we consider all employees include not only regular employees but also non-standard
employment workers, such as fixed contract workers, subcontract temporary workers, and part timers,

10
years of the Great Recession, however, such advantages disappeared and for regular employees
age 30-34 with 0-4 years of tenure, the fortune was completely reversed with women now facing
a much lower ten-year job retention rate than men.
The literature suggests that college graduates are more likely to enjoy “lifetime
employment” than high school graduates (see for instance Tachibanaki, 1984 and Ono, 2007).
We repeat the same analysis for college graduates and high school graduates separately. Tables
3A and 3B report ten-year job retention rates of male regular employees with and without college
degrees. Figure 2 shows the differences in ten-year job retention rates between college graduates
and high school graduates for the three time periods. As confirmed by the tables and
demonstrated vividly by Figure 2, ten-year job retention rates were overall higher for college
graduates than for high school graduates, as prior studies suggest. Perhaps more importantly, the
gap in job stability by educational level appeared to have widened during the Great Recession.
The only exception was male regular, college-educated employees age 20-24 with 0-4 years of
tenure (entry level for new college graduates) who experienced a substantial reduction in job
stability during the last five years of the Great Recession. Except for this entry level, the erosion
of “lifetime employment” during the Great Recession was greater for high school graduates than
for college graduates. Tables 4A and 4B repeat the same analysis for female regular employees.
In essence, we observe a similar widening of education gap in job stability between college
graduates and high-school graduates for female regular employees as well.
Finally, we study changes in job retention rates of regular employees of firms with
varying size. The literature often argues that the “lifetime employment” practice applies mostly
even before 1997, ten-year job retention rates of female employees were actually lower than male employees. As such, the lack or even reverse of gender gap in job stability was specific to regular employees who are mid-career hires.
11
to workers in large firms (typically those with 500 or more employees), and that workers in small
to medium firms were traditionally excluded from the “lifetime employment” system (see for
example Koike, 2005, and Ono, 2007). We calculated ten-year job retention rates of male and
female regular employees working in firms with three different sizes (large with 500 and more
employees; medium with 30-499 employees; and small with fewer than 30 employees).
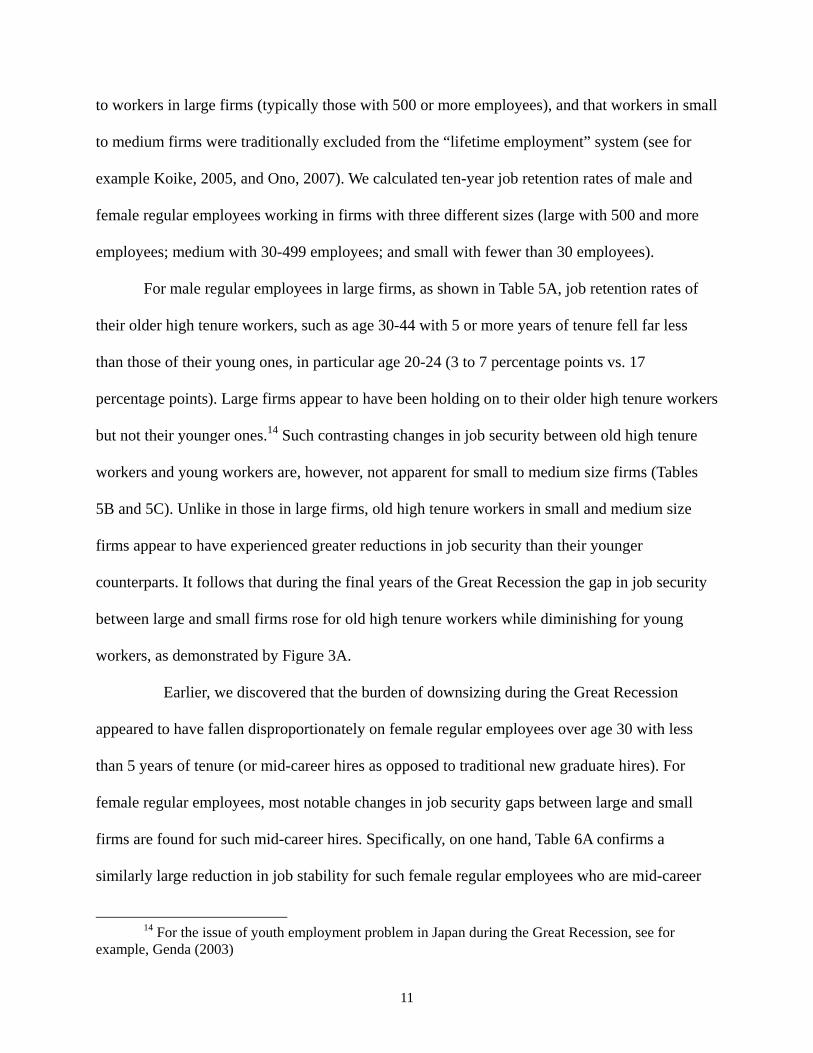
For male regular employees in large firms, as shown in Table 5A, job retention rates of
their older high tenure workers, such as age 30-44 with 5 or more years of tenure fell far less
than those of their young ones, in particular age 20-24 (3 to 7 percentage points vs. 17
percentage points). Large firms appear to have been holding on to their older high tenure workers
but not their younger ones.14 Such contrasting changes in job security between old high tenure
workers and young workers are, however, not apparent for small to medium size firms (Tables
5B and 5C). Unlike in those in large firms, old high tenure workers in small and medium size
firms appear to have experienced greater reductions in job security than their younger
counterparts. It follows that during the final years of the Great Recession the gap in job security
between large and small firms rose for old high tenure workers while diminishing for young
workers, as demonstrated by Figure 3A.
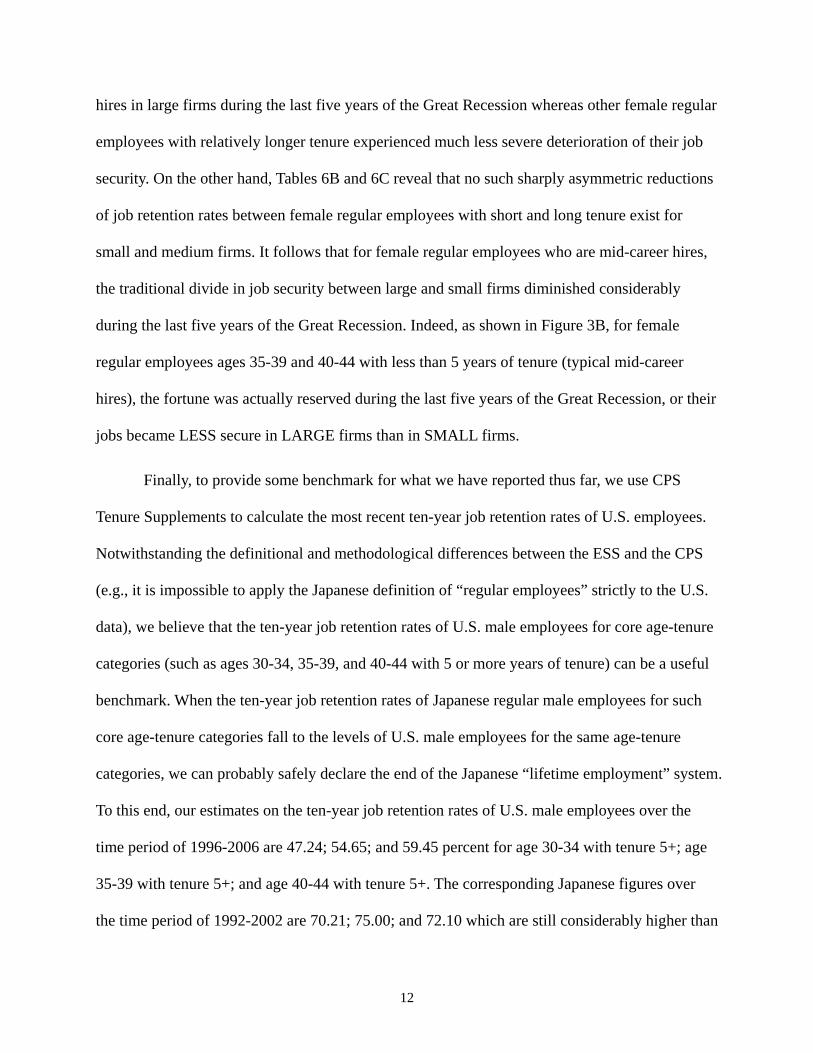
Earlier, we discovered that the burden of downsizing during the Great Recession
appeared to have fallen disproportionately on female regular employees over age 30 with less
than 5 years of tenure (or mid-career hires as opposed to traditional new graduate hires). For
female regular employees, most notable changes in job security gaps between large and small
firms are found for such mid-career hires. Specifically, on one hand, Table 6A confirms a
similarly large reduction in job stability for such female regular employees who are mid-career
14 For the issue of youth employment problem in Japan during the Great Recession, see for
example, Genda (2003)
12
hires in large firms during the last five years of the Great Recession whereas other female regular
employees with relatively longer tenure experienced much less severe deterioration of their job
security. On the other hand, Tables 6B and 6C reveal that no such sharply asymmetric reductions
of job retention rates between female regular employees with short and long tenure exist for
small and medium firms. It follows that for female regular employees who are mid-career hires,
the traditional divide in job security between large and small firms diminished considerably
during the last five years of the Great Recession. Indeed, as shown in Figure 3B, for female
regular employees ages 35-39 and 40-44 with less than 5 years of tenure (typical mid-career
hires), the fortune was actually reserved during the last five years of the Great Recession, or their
jobs became LESS secure in LARGE firms than in SMALL firms.
Finally, to provide some benchmark for what we have reported thus far, we use CPS
Tenure Supplements to calculate the most recent ten-year job retention rates of U.S. employees.
Notwithstanding the definitional and methodological differences between the ESS and the CPS
(e.g., it is impossible to apply the Japanese definition of “regular employees” strictly to the U.S.
data), we believe that the ten-year job retention rates of U.S. male employees for core age-tenure
categories (such as ages 30-34, 35-39, and 40-44 with 5 or more years of tenure) can be a useful
benchmark. When the ten-year job retention rates of Japanese regular male employees for such
core age-tenure categories fall to the levels of U.S. male employees for the same age-tenure
categories, we can probably safely declare the end of the Japanese “lifetime employment” system.
To this end, our estimates on the ten-year job retention rates of U.S. male employees over the
time period of 1996-2006 are 47.24; 54.65; and 59.45 percent for age 30-34 with tenure 5+; age
35-39 with tenure 5+; and age 40-44 with tenure 5+. The corresponding Japanese figures over
the time period of 1992-2002 are 70.21; 75.00; and 72.10 which are still considerably higher than
13
the U.S. levels.
4. Cohort Analysis of New Graduate Hires
In the previous section we provide evidence on changes in job stability after the bubble
burst (in particular during the last five years of the Great Recession) for a group of Japanese
workers, regular employees. As discussed before, to be hired as a regular employee is often a
necessary condition for “lifetime employment” although it is not a sufficient one. The literature
on “lifetime employment” sometimes add explicitly the second condition, employment
immediately following school graduation (Ono, 2007). In this section, we focus on such a
narrowly-defined pool of “lifetime employment” workers who were employed as regular
employees right after school graduation, and hence satisfy the above two conditions for “lifetime
employment.” Two specific groups of employees can be identified in the ESS as those
constituting the pool of narrowly-defined “lifetime employment” workers: (i) new college
graduate hires (regular employees age 20-24 with tenure 0-4); and (ii) new high-school graduate
hires (regular employees age 15-19 with tenure 0-4).
The main objective of this section is to discern any changes in the size of the narrowly-
defined “lifetime employment” pool over time (especially during Japan’s prolonged stagnation),
and hence provide some evidence on the decline in the overall prevalence of the “lifetime
employment” practice in the Japanese economy. Unfortunately, there is no well-established
methodology to measure the overall prevalence of the “lifetime employment” practice in the
economy (see Ono, 2007 for more on such methodological challenges). To this end, we devised
our own cohort analysis method (Figures 4-17 summarize the results from the cohort analysis)
which we hope will be instrumental in the development of a more general and complete
14
approach in the future.
As shown in Figures 4 and 6, the ESS for 1982, 1987, 1992, 1997, and 2002 provide data
on seven cohorts of new college graduate hires for male and female college graduates: Cohort X
(those college graduates who were 20-24 years old with 0-4 tenure in Year X for X=1967, 1972,
1977, 1982, 1987, 1992, and 1997.) For example, Cohort 1967 shows up in our first ESS (1982)
as regular college graduate employees age 35-39 with tenure 15-19. From the second ESS (1987)
we can discern how many of Cohort 1967 remained in the same firm for five more years by
counting the number of regular college graduate employees age 40-44 with 20-24 years of tenure.
Likewise, the 1992 ESS allows us to estimate how many of Cohort 1967 remained in the
“lifetime employment” pool for the next five years. To highlight the importance of such evolving
“lifetime employment” pool over time, we express the “lifetime employment” cohort size as a
percentage of total employment (including both regular and non-standard employment) in the
corresponding age cohort. We repeat the same analysis for the remaining six cohorts.
As shown in Figure 4, the 1987 cohort of male new college graduate hires constituted 23
percent of total employment in the corresponding age cohort in 1987 when they were hired as
regular employees upon college graduation. Since the 1987 was among the final years of Japan’s
Bubble Period, we can consider the 1987 cohort the last cohort before the Bubble Burst. As the
job retention rate estimates for male college-educated regular employees suggest, not all new
college graduate hires remained in the “lifetime employment” pool as they age. Thus, in 1992
(five years later), the 1987 cohort who remained in the same firm fell to 16 percent (30 percent
drop from the 1987 level).15 In 1997 (ten years later), the surviving 1987 cohort constituted a
little over 13 percent. By 1997 (fifteen years later), the 1987 cohort who was still in the
15 For the relatively high turnover of new graduate hires in their first five to ten years in Japan, see for instance Koike (2005).
15
narrowly-defined “lifetime employment” pool was down to 9 percent of all workers in the cohort.
Before comparing the 1987 cohort to the post-bubble cohorts, let us note that the time
profiles of all cohorts prior to the 1987 cohort were also downward-sloping and roughly in
parallel to the time profile of the 1987 cohort while the figure shows a steady upward shifting of
the time profiles from the 1967 cohort to the 1977 cohort, suggesting the strengthening of the
“lifetime employment” system during the high growth era.
The 1992 cohort began at a higher level (26 percent as opposed to 23 percent for earlier
cohorts) when they were hired as regular employees upon college graduation in 1992. The size of
the 1992 cohort remaining in the same firm dropped by about 30 percent in the next five years,
which is comparable to the drop in the size of the 1987 cohort for the first five years. However,
the next five years (1997-2002) proven to be a trying time for them with the size of the surviving
cohort falling at a faster rate than at the historical rate, ending up being close to the historical
level for most prior male new college graduate hires at the same stage of their careers (age 30-34
with 10-14 years of tenure). In other words, in 1992, the initial size of the “lifetime employment”
cohort for college graduates was significantly larger than in prior years. However, in the
following ten years, in particular the last five years (1997-2002), the initially inflated size of the
“lifetime employment” pool was quickly adjusted to return to its historical level.
The 1997 cohort (those hired as regular employees immediately following college
graduation in the midst of the Great Recession) also started at a level higher than the historical
level (actually even higher than the 1992 cohort).Again, in the next five years (1997-2002), the
initially inflated size of the “lifetime employment” pool was quickly adjusted downward
(amounting to a 46-percent drop in its size) to return to the same level as those cohorts prior to
the Bubble Burst.
16
In short, overall, the male cohorts of new college graduate hires (those hired as regular
employees immediately following college graduation) show relative stability over time in terms
of their sizes and time profiles whereas the 1992 and 1997 cohorts experienced an unusually
sharp drop in its size for their first five to ten years, suggesting more vigorous and selective on-
the-job screening of new college graduate hires in early years of their careers during the Great
Recession. The finding is largely consistent with our earlier analysis of the ten-year job retention
rate documenting the significant drop in the ten-year job retention rates for male regular
employees with college degrees during the Great Recession (Table 3A).
Figure 5 shows the results from a similar cohort analysis of the new high-school graduate
hires for male. The time profiles of all cohorts are downward-sloping with the very large drop for
the first five years, which is mostly due to a sharp increase in total employment in the cohort at
age 20-24 as a result of inflow of college graduates into the labor market. The figure shows a
downward shift of the time profiles of the new high school graduate hires over time, which is
consistent with Ariga (2005) who documents the deteriorating job market for high school
graduates over time in Japan.
Figures 6 and 7 repeat the same analysis for female regular employees. The results are by
and large similar to those for male regular employees with one important exception that the
relative cohort size of new graduate hires remaining in the same firm falls more precipitously for
their first five to ten years than their male counterparts.16 For example, the 1987 cohort of female
new college graduate hires constituted 35 percent of total female employment in the cohort in
1987, a much higher level than the male counterpart (23 percent). However, the size of the
16 Such sharp drops are consistent with prior studies reporting a significant break in career for
women due to marriage and childrearing (see, for example, Rebick, 2005).
17
narrowly-defined “lifetime employment” pool of female new college graduate hires dropped
more rapidly than the male counterpart as they age for the first five to ten years and ultimately
reached the same level as the male counterpart. Thus, in 1992 (five years later), the 1987 cohort
of female new college graduate hires who were still with the original firms dropped to 21 percent
(67 percent drop from the 1987 level). In 1997 (ten years later), the surviving 1987 cohort
constituted 15 percent. By 1997 (fifteen years later), the surviving 1987 cohort was down to 9
percent of all workers in the cohort, which is the same level as the 1987 cohort of male new
college graduate hires reached in 1997.
As in the case of male regular employees, the 1992 and 1997 cohorts of new college
graduate hires for female regular employees did start with higher levels than their predecessors
and then fell sharply toward the historical levels (Figure 6).
Figure 7 shows that the time profiles of all cohorts of new high-school graduate hires are
downward-sloping with the very large drop for the first five years, as in the case of their male
counterparts. However, again the drop in the size of the “lifetime employment” pool for the first
five to ten years was sharper than the male counterparts.17
5. Non-standard Employment
The rising share of non-standard employment (such as fixed-term contract workers,
subcontract temporary workers, part-timers and other contingent workers) in Japan in recent
17 As Edwards and Pasquale (2003) point out, the proportion of young women in Japan going
beyond high schools and enrolling in four-year universities has been rising remarkably since mid-1980s. The observed sharper fall in the size of the female high-school graduate cohort as a percentage of total employment in the cohort for the first five years is consistent with this supply-side change (the rising size of inflow of college graduates into the labor market makes the rapid growth of the denominator for the first five years even more pronounced)
18
years has been reported as evidence for the declining influence of the “lifetime employment”
practice in Japan (Rebick, 2005, and Ono, 2007). Our ESS data also confirm the increasing share
of non-standard employment in Japan as shown in Figure 8. More importantly we show that the
rising share of non-standard employment is particularly pronounced among women, and that the
significant increase in the share of non-standard employment among women began well before
the bubble burst, and hence Japan’s prolonged stagnation following the bubble burst would not
be the underlying cause for the rising share of non-standard employment. However, the share of
non-standard employment for men did begin to rise noticeably in 1997. This finding suggests
that the prolonged stagnation might have finally prompted Japanese firms to extend the use of
non-standard employment to men.
Figures 9 and 10 are created to uncover any possible interplay between the share of non-
standard employment and education/firm size. Figure 9 reveals that for women non-standard
employment is more prevalent among high-school graduates than among college graduates.
However, there is no such difference by education level for men except for the last five years of
the Great Recession during which the share of non-standard employment rose more rapidly for
high-school graduates than for college graduates.
Figure 10 presents intriguing interplay between gender and firm size in shaping up the
share of non-standard employment. Specifically, for both men and women, there has been a
negative correlation between firm size and the share of non-standard employment. However, for
women, the size differential in the share of non-standard employment has been diminishing most
rapidly during the Great Recession as large firms have been quickly catching up with small and
medium firms in terms of the use of non-standard employment. For men, nonetheless, there is no
such narrowing of gap by firm size in the share of non-standard employment.
19
6. Changes in Other Elements of the Japanese Employment System
This section provides relatively brief discussions on changes (or lack thereof) in some of
the other important elements of the Japanese employment system during the Great Recession.18
We believe such discussions are necessary in order to better understand the evolution of the
“lifetime employment” system, for the “lifetime employment” system is believed to be strongly
complementary to all other elements of the Japanese employment system.19
First, the seniority wage system (in which wage is not attached to specific jobs and
seniority plays a significant role in wage determination) provides workers with incentive to stay
in the firm and hence is complementary to the “lifetime employment” practice. Using published
tables from the General Survey on Working Conditions (Former "the General Survey on Wages
and Working Hours System") conducted in 1996, 1999, 2004 and 2007 by the Ministry of Health,
Labor and Welfare, we created Table 7. The sample universe of the Survey is all firms in Japan
that employ 30 or more employees and the Survey enjoys an unusually high response rate of
close to 80 percent in 2007.
First, the proportion of firms which abolished automatic annual pay raise during the last
three years was less than 4 percent in 1996 and it rose to over 10 percent in 1999; and it fell
somewhat to 7 percent in 2007 although it is still considerably higher than the 1996 level. The
tendency to move away from seniority-based pay by abolishing automatic annual pay raise
accelerated in late 1990s and in 2007 the proportion of such firms is still higher than at the 1996
level.
18 For the other important elements of the Japanese employment system, see, for example, Koike,
2005, Aoki, 2000, Itoh, 1994, Morita, 2001; 2005, Moriguchi and Ono, 2004 and Rebick, 2005. 19 For the importance of job security in the participatory employment system such as the Japanese
system, see for example Levine (1995) and Carmichael and MacLeod (1993).
20
In parallel to the tendency to abolish automatic annual pay raise, a growing number of
firms have been making their pay systems more sensitive to each worker’s ability; performance;
and job. Specifically, the proportion of firms that made their pay systems more reflective of each
worker’s job and task during the previous three years rose from 12 percent in 1996 to 23 percent
in 2007. Likewise, the proportion of firms that made their pay systems more sensitive to each
worker’s ability during the previous three years increased from 16 percent in 1996 to 22 percent
in 2007. Finally, the proportion of firms that moved further toward pay for performance also rose
from 15 percent in 2003 to 24 percent in 2007.
In short, we have some evidence suggesting that Japanese firms have been
deemphasizing the importance of seniority and stressing the importance of merit and
performance in their wage policies.20
Second, extensive information sharing mechanism (often called Joint Labor-Management
Committees, JLMCs), which is designed to minimize information asymmetry and facilitate the
alignment of interest between labor and management, is often considered a key element of the
Japanese employment system.21
Figure 11 was created, using published tables from the Labor-Management
Communication Survey (LMCS) in 1989, 1994, 1999, and 2004. The LMCS has been conducted
by the Ministry of Health, Labor and Welfare every five years and the most recent Survey was
conducted in 2004. The sample universe of the LMCS is establishments of firms with more than
30 workers (50 workers prior to the 1999 LMCS). The LMCS has been enjoying an unusually
high response rate (around 70 percent).
20 Tsuru, Abe and Kubo (2005) conduct an excellent “insider econometric study” of pay system
changes in Japan. 21 For Japanese JLMCs and other participatory practices, see Kato (2003) for example.
21
Since the sample universe expanded in 1999 and started including establishments of
smaller firms, we report all of the results disaggregated by firm size. As shown in Figure 11, for
establishments of large firms with 5,000 or more employees, the incidence of JLMCs (percent
establishments with JLMCs) has continued to increase from 1989 to 2004. For establishments of
firms with 1,000-4,999 employees, the incidence remained around 65 percent during Japan’s
prolonged stagnation.
Figure 11, however, reveals the falling incidence of JLMCs among establishments of
smaller firms. For instance, for establishments of medium-size firms with 300-999, 67 percent of
establishments had standing JLMCs at the beginning of Japan’s long stagnation and by the end of
her great recession, only 43 percent of establishments had JLMCs.
In short, we find evidence pointing to a deeper divide between workers in large firms and
the rest of the labor force. Employees working for larger firms in Japan are more likely to be
provided with JLMCs than those working for smaller firms. This participation gap appears to
have widened during Japan’s prolonged stagnation.22 Though not reported here, we also found
similar evidence for SFCs (Shopfloor Committees), which is an important example of employee
involvement and problem solving activities at the grass roots level aimed at providing workers
with opportunities to exert discretionary effort, acquire useful local knowledge, and share it with
their co-workers, and higher-level engineers and managers.
22 It is beyond the scope of this paper to pin down precisely what has been causing the deepening
divide of the Japanese labor market during the Great Recession. Unfortunately, in the absence of panel data on the use of JLMCs by Japanese firms, it is at the moment impossible to know to what extent the declining incidence of such an institution among establishments of small to medium size firms has been caused by the dismantling of existing JLMCs or by exiting of firms with JLMCs and entries of new firms without JLMCs. We suspect that the dismantling of JLMCs will be more difficult in unionized firms due to their resistance and that the termination of JLMCs would be easier in small to medium size firms that are mostly without union. It is assuring that the incidence of JLMCs, as shown in Figure 1, has remained quite high at around 80 percent for establishments of unionized firms.
22
A key financial incentive mechanism to promote the Japanese employment system has
been ESOPs (Employee Stock Ownership Plans) used by the large majority of Japanese firms.
Japanese ESOPs are perhaps best understood by comparing their main features with the better
known U.S. ESOPs. Unlike U.S. ESOPs, Japanese corporations establishing an ESOP (called
mochikabukai) do not receive any tax incentive to do so. To induce individual employees to
participate in the ESOP, Japanese companies offer subsidies (typically with the firm matching
each employee's contribution by giving 5 to 10% of the contribution as well as bearing ad-
ministrative costs). While ESOPs elsewhere frequently are structured so as to encourage strong
participation by top management, in Japan, executives, as well as part time and temporary
employees, are normally ineligible for membership. As is the norm elsewhere, individual
participants' shares and dividends in the ESOP are held in a trust. Unusually, however, each par-
ticipant has the right to withdraw his or her shares, and withdrawn shares are privately owned.
Withdrawals are only permitted in 1,000 share, round lots. While members may freely exit com-
pletely from the ESOP, re-entry is restricted. Exiting employees will receive their shares in
1,000 share increments, and must sell the remaining shares to the trust at the prevailing market
price. Upon retirement, model rules adopted by most ESOPs require retiring workers to exit
completely from the ESOP. In principle, Japanese ESOPs can function as a group incentive pay
which aligns the interest between the firm and workers and prior studies find some econometric
evidence for the positive productive effects of ESOPs when their free-rider problem is eased (see,
for instance, Jones and Kato, 1995 and Kato and Morishima, 2002).
Since 1989, the Tokyo Stock Exchange (TSE) has been collecting data from all firms
listed in TSE on their use of ESOPs. All TSE-listed firms (over 2,000 firms as of 2006)
including almost all major corporations in Japan, have been supplying such data to the TSE
23
every year. As such, the TSE data provide the most accurate and reliable picture of the use of
ESOPs by TSE-listed firms in Japan. Most importantly, to the best of our knowledge, this is the
only source of data on Japanese ESOPs available for recent years.
Using the TSE data from 1989 through 2006, the most recent year available, we produced
Figure 12. The figure confirms the rapid asset price deflation following the violent burst of the
financial bubble in the late 1980s and the subsequent prolonged recession that lasted until 2003.
Thus, the real market value of outstanding shares owned by ESOPs, and the real value of the
average stake fell sharply in the early 1990s, and recovery from this sharp drop was at best
anemic till 2003.
A natural question concerning the responses of ESOPs to this seemingly powerful
adverse financial shock is whether or not it discouraged employees from participating in ESOPs.
The figure shows a surprisingly calm response by the labor force in firms with ESOPs to the
burst of the financial bubble in the late 1980s and the subsequent long stagnation. Thus, the
ESOP participation rate has been remarkably stable.
Consistent with the relatively calm response of employees, very few employers
terminated their ESOPs in response to the adverse financial shock. Thus, as shown in Figure 12,
the proportion of firms with ESOPs did not decline during Japan’s Great Recession. Overall, it
appears that neither employees nor employers have panicked in the face of the negative financial
shock and the subsequent long recession. It appears as if such a calm response is paying off at
last. For instance, in 2005 the average stake of ESOP participants finally recovered to the level of
1989, exceeding two million yen. In 2006, the average stake fell slightly yet still exceeded two
million yen.
In short, neither hasty exit of employees from ESOPs nor the dismantling of ESOPs by
24
employers took place during Japan’s Great Recession. It is, however, still possible that a more
subtle fine-tuning of the existing ESOP institutions might have occurred. To see if this is indeed
the case, we were fortunate that a large Japanese firm (JFIRM) continued to provide us with
detailed internal data on their ESOP operation.23 JFIRM is a well-known manufacturing firm
with sales of a few trillion yen, about one third of which is export sales, and employment of close
to 40,000 workers. It is listed in the first section of Tokyo Stock Exchange.
JFIRM introduced its ESOP in 1971. The original objective of the ESOP was threefold: (i)
enhancing the sense of participation and motivating employees; (ii) providing a source of
retirement income; and (iii) acquiring a stable shareholder group. By the end of 1980, the ESOP
participation rate reached one in four employees and their average monthly contribution reached
13,000 in 1995 yen. According to the Human Resources manager, there have been very few
frenzied voluntary exits of employees from the trust and the ESOP is proving to be a stable
shareholder.
However, there were a few subtle changes in the commitment of employees to the ESOP.
First, as shown in Figure 13, in 1990, more than 1,000 continuing participants increased their
monthly contributions whereas only 100 continuing participants reduced their monthly
contributions. The ratio of the former to the latter number, called the “Commitment Ratio” was
over 1000%. During Japan’s Great Recession, the number of ESOP participants who increased
their monthly contributions has continued to decline, except for a brief recovery of 1996, and in
2000 reached all-time low of a little over 100. There was no sign of turn-around in 2001.
In contrast, the number of ESOP participants who decreased their monthly contributions
23 Since we reported our earlier case study of this firm (Kato, 2003), JFIRM has continued to
invite us to conduct field research at the firm and provide us with further data. As a result, we have been able to extend our database on JFIRM beyond 1998 to include the final years of Japan’s Great Recession, 1998-2001.
25
grew in the early 1990s and has been fluctuating rather mildly ever since. Most importantly there
is no comparable downward trend in the number of ESOP participants decreasing their
contributions. As a result, the Commitment Ratio continued to fall, except for the brief recovery
of 1996-1997, and in 2000 reached all time low of almost 70%. In other words, at the beginning
of Japan’s Great Recession, there were ten times more employees increasing their monthly
contributions to the ESOP than decreasing their contributions. After ten years of prolonged
recession, there were actually fewer employees increasing their monthly contributions than
decreasing their contributions. There was no sign of clear turn-around in 2001.
Second, as shown in Figure 14, over 70% of new recruits of 1990 decided to participate
in the ESOP. As Japan’s Great Recession progressed, the figure continued to decline, again with
a brief exception of 1996, and reached all time low of 11% in 2000, followed by evidence of a
turn-around in 2001. It appears as if new recruits have became more careful about making
commitments to the ESOP and hence JFIRM.
In short, it is fair to say that Japanese ESOPs clearly survived the unprecedented adverse
financial shock of the bubble burst and the subsequent prolonged stagnation although Japanese
workers appeared to have fine-tuned their level of commitment to ESOPs during those turbulent
years.
7. Conclusions
This paper has provided new evidence on changes in the Japanese employment system
(or lack thereof) with particular focus on the “lifetime employment” system after the bubble
burst. The bulk of the paper has been devoted to taking advantage of our first access to micro
data from the most recent Employment Status Survey (2002) as well as prior years of the ESS
26
and providing new evidence on changes in the “lifetime employment” practice which is believed
to serves as a foundation for many complementary elements of the Japanese employment system.
Overall, we have found evidence of the resilience of the Japanese employment system.
Job stability of regular employees did not fall much during the first five years of Japan’s Great
Recession. Our cohort analysis of narrowly-defined “lifetime employment” workers (new school
graduate hires) has also pointed to the relative stability of the size of the “lifetime employment”
cohort. To be consistent with the enduring nature of the ‘lifetime employment” system, we have
also found some evidence for the buoyancy of other complementary elements of the Japanese
employment system.
This, however, does not mean the complete rigidity of the Japanese employment system.
Apparently the Japanese employment system has evolved in response to Japan’s prolonged
stagnation. First, job stability of regular employees eventually fell during the final years of the
Great Recession. It took years yet the magnitude of the fall turned out to be considerable and for
some groups of workers it was large (the ten-year job retention rate of female regular employees
age 30-35 with 0-5 years of tenure fell from 68 percent in the 1982-1992 period to 43 percent in
the 1992-2002 period). Second, the burden of downsizing during Japan’s prolonged stagnation
fell disproportionately on women as opposed to men and on high-school graduates as opposed to
college graduates. The biggest “losers” appear to be female regular employees over age 30 with
relatively short tenure working in large firms.
What do all these things mean to the Japanese economy? We believe that the Japanese
employment system developed over time during the postwar era and was well-established and
deep-rooted in the Japanese society as a coherent cluster of complementary employment
practices by the end of the high growth period. It probably contributed significantly to the rise of
27
the Japanese economy (Aoki, 1990, Koike, 2005, Morita, 2005).
Such institutional complementarity tends to cause the Japanese employment system not
to respond immediately to external shocks (Aoki, 2000). Instinctive and hasty changes even in
one element of the Japanese employment system may cause the whole system to halt due to the
intricate complementary interplay between the changing element and the remaining elements of
the system. As such, deliberate and prudent responses are more reflective of the nature of the
Japanese system. That job stability started to change only after years of prolonged stagnation
appears to be consistent with the view that the Japanese employment system is a coherent cluster
of practices with strong institutional complementarity. For instance, a rushed decision to break
implicit long-term employment contracts and terminate some of their “lifetime employment”
workers will undermine incentive for the remaining “lifetime employment” workers to continue
to invest in firm-specific human capital, and produce and share with their supervisors valuable
firm-specific local knowledge. Furthermore, such a rushed decision may have a lasting negative
reputational effect on prospective employees in the future.
One of the key challenges to this type of system is how to make necessary downward
employment adjustments in a downturn without jeopardizing the aforementioned incentive for
the remaining “lifetime employment workers” and amplifying the negative reputational effect.
In our view, a response to this challenge by the Japanese employment system has been to
maintain the two-tier structure of “lifetime employment” workers consisting of (i) the original
members of the “lifetime employment” system; and (ii) the expansion members. The original
members are typically male regular employees who are new graduate hires. They have been the
heart and soul of the Japanese employment system and the crucial depository of firm-specific
human capital and local knowledge. On one hand, our retention rate estimates and cohort
28
analysis confirm that this group of workers was effectively insulated from Japan’s prolonged
stagnation.
On the other hand, as some scholars suggest, during the high growth and bubble periods,
the Japanese employment system was extended to cover groups of workers that had been
excluded from the system in the past, such as female regular employees and mid-career hires
(Moriguchi and Ono, 2004 and Ariga, Ohkusa and Brunello, 1999). In this paper we have
provided corroborating evidence that job security of female regular employees and mid-career
hires did not deteriorate immediately following the bubble burst and that in fact it was after five
years of prolonged stagnation that such expansion members finally started experiencing the
weakening of their job securities. This suggests that these workers were indeed admitted to the
“lifetime employment” club before the burst of the bubble.
Such expansion members of the “lifetime employment” system probably started to invest
in firm-specific human capital and produce firm-specific local knowledge and share it with the
firm as a result of newly granted admissions to the “lifetime employment” system. The cost of
reneging on implicit long-term contracts with such expansion members is, however, still
substantially lower than the cost of doing so with the original members since the amount of firm-
specific human capital investment and firm-specific local knowledge production are still smaller
for the expansion members than for the original members. Moreover, the breach of the implicit
long-term contracts has both immediate adverse incentive effect on the remaining members and
lasting negative reputational effect on prospective members in the future. Such adverse effects of
contract breach are also likely to be smaller when the victims of such contract breach are the
expansion members rather than the original members.
In light of the aforementioned difference in the cost of contract breach, it appears to be
29
rational for Japanese firms in dire need for employment adjustment to withdraw their promise of
job security from the expansion members of the “lifetime employment” system while continuing
to honor their promise of job security to the original members. In other words, the expansion
members appeared to have served as an elaborate shock absorber and helped Japanese firms
honor their promise of job security to the original members of the “lifetime employment” system,
which in turn contributes to the stability of the Japanese employment system.
The 1998 revision of the Labor Standards Law could be viewed as the government
facilitating Japanese firms’ attempts to nullify the “lifetime employment” membership of their
expansion members by offering their employees multi-year fixed contracts rather than traditional
indefinite contracts. We conjecture that both Japanese employers and unions wanted the 1998
revision, for both of them were interested in preserving the lifetime employment system for its
core members (we call them the “original” members), and that the 1998 revision was considered
a useful tool for Japanese firms to nullify the membership of the “expansion” members (women
and mid-career hires) since the 1998 revision allows for multi-year fixed contracts as an
alternative to traditional indefinite contracts. While we have no conclusive evidence to prove our
conjecture, according to Japanese experts on the labor law system in Japan, the 1998 revision
was initiated originally in 1993 by the Study Group on the Labor Standards Law that was created
to advise informally the Minister of Labor. The Study Group indeed cited rising needs for such
multi-year fixed contract workers expressed by Japanese employers and unions. The original
proposal was modified several times and finally passed by the Japanese Diet in 1998 as part of
the overall deregulation efforts by the Japanese governments (Karatsu, 2004).
Finally, while providing rigorous evidence on the impact of Japanese labor market
institutions such as the “lifetime employment” system on unemployment and/or growth is
30
beyond the scope of the paper, we conduct two preliminary analyses to shed some light on this
challenging yet important issue.
First, we apply the methodology developed by Gordon (1982) to up-to-date monthly
time-series data covering August 1984 - December 2002, and examine whether wage bill
fluctuations are now more correlated with employment changes than they were historically. Table
8 summarizes the results. Since OECD data on employment and hours worked are readily
available only annually, we use the original monthly data from Maikin (Monthly Survey on
Labor). Unfortunately industry classification changed in August of 1984, and data on
manufacturing wage, hours and employment prior to August 1984 are not comparable to those
after August 1984. Based on our analysis of the ESS data, we calculate standard deviations of
rates of change of monthly manufacturing wage rates, monthly hours worked, and monthly
employment for the four time periods: (i) August 1984 - December 1987; (ii) January 1988 –
December 1992; (iii) January 1993 – December 1997; and (iv) January 1997 – December 2002.24
Row (8) of the table shows standard deviation of the rate of change of wage bill divided by
standard deviation of the rate of change of employment for each of the four time periods, which
measures the relative importance of wage bill fluctuations to employment fluctuations. There
appears to be no clear evidence for the diminishing importance of wage bill fluctuations to
employment fluctuations (or the rising importance of employment fluctuations to wage bill
fluctuations). The lack of evidence on the rising importance of employment fluctuations relative
to wage bill fluctuations appears to be consistent with the notion of institutional complementarity
and the resulting relative resilience of the Japanese employment system.
Second, to study some possible correlation between growth and the “lifetime
24 The size of standard deviation is not comparable to Gordon’s original results, for we use monthly data while Gordon used quarterly data.
31
employment” system, we obtain annual TFP growth rate series from JIP database (the annual
TFP growth data series are available consistently for 1983 – 2005 yet unfortunately only for two
industry categories, manufacturing and restaurants). We also acquire the corresponding annual
series on average tenure for the same time period from the Basic Survey on Wage Structure. In
Figure 15, we plot all annual observations (X, Y) where X=annual growth rate of TFP and
Y=annual change in average tenure. The figure does not show any significant correlation
between X and Y, pointing to strong needs for a deeper understanding of possible interplay
between the “lifetime employment” system and growth and a more rigorous empirical analysis.
32
References
Aoki, Masahiko. Information, Corporate Governance, and Institutional Diversity:
Competitiveness in Japan, the USA, and the Transitional Economies. Oxford and New York: Oxford University Press, 2000.
____. "Toward an Economic Model of the Japanese Firm." Journal of Economic Literature, 1990, 28(1), pp. 1-27.
Ariga, Kenn. "From Golden Eggs to Rotten Apples: Changing Landscape of the Market for New High School Graduates in Japan," Kyoto University, 2005.
Ariga, Kenn; Ohkusa, Yasushi and Brunello, Giorgio. "Fast Track: Is It in the Genes? The Promotion Policy of a Large Japanese Firm." Journal of Economic Behavior and Organization, 1999, 38(4), pp. 385-402.
Ariga, Kenn and Okazawa, Ryousuke. "Labor Immobility in Japan: Its Causes and Consequences," the ESRI Conference on Japan’s Bubble, Deflation and Long-term Stagnation. Federal Reserve Board San Francisco, 2007.
Carmichael, H. Lorne and MacLeod, W. Bentley. "Multiskilling, Technical Change and the Japanese Firm." Economic Journal, 1993, 103(416), pp. 142-60.
Chuma, Hiroyuki. "Employment Adjustments in Japanese Firms During the Current Crisis." Industrial Relations, 2002, 41(4), pp. 653-82.
____. "Is Japan's Long-Term Employment System Changing?," T. Tachibanaki and I. Ohashi, Internal Labour Markets, Incentives and Employment. New York, London: St. Martin's Press/Macmillan Press, 1998, 225-68.
Dore, Ronald. "The End of Jobs for Life? Corporate Employment Systems: Japan and Elsewhere," London School of Economics, Centre for Economic Performance Occasional Paper: 11, 1996.
Edwards, Linda N. and Pasquale, Margaret K. "Women's Higher Education in Japan: Family Background, Economic Factors, and the Equal Employment Opportunity Law." Journal of the Japanese and International Economies, 2003, 17(1), pp. 1-32.
Farber, Henry S. "Are Lifetime Jobs Disappearing? Job Duration in the United States, 1973-1993," Labor statistics measurement issues. Chicago and London: University of Chicago Press, 1998, 157-203.
____. "Labor Market Adjustment to Globalization: Long-Term Employment in the United States and Japan," Paper presented by the Trans Pacific Labor Seminar (organized by Takao Kato and Peter Kuhn). Santa Barbara, CA, 2007.
Genda, Yuji. "Who Really Lost Jobs in Japan? Youth Employment in an Aging Japanese Society," S. Ogura, T. Tachibanaki and D. A. Wise, Labor Markets and Firm Benefit Policies in Japan and the United States. Chicago and London: University of Chicago Press, 2003, 103-33.
Genda, Yuji and Rebick, Marcus E. "Japanese Labour in the 1990s: Stability and Stagnation." Oxford Review of Economic Policy, 2000, 16(2), pp. 85-102.
Gordon, Robert J. "Why U.S. Wage and Employment Behavior Differs from That in Britain and Japan." Economic Journal, 1982, 92(365), pp. 13-44.
Hall, Robert E. "The Importance of Lifetime Jobs in the U.S. Economy." American Economic Review, 1982, 72(4), pp. 716-24.
33
Hashimoto, Masanori and Raisian, John. "Employment Tenure and Earnings Profiles in Japan and the United States." American Economic Review, 1985, 75(4), pp. 721-35.
Higuchi, Yoshio. Koyo to Shitsugyo No Keizaigaku (Economics of Employment and Unemployment). Tokyo: Nihon Keizai Shinbunsha, 2001.
Itoh, Hideshi. "Japanese Human Resource Management from the Viewpoint of Incentive Theory," M. Aoki and R. Dore, The Japanese Firm: The Sources of Competitive Strength. Oxford and New York: Oxford University Press, 1994, 233-64.
Jones, Derek C. and Kato, Takao. "The Productivity Effects of Employee Stock-Ownership Plans and Bonuses: Evidence from Japanese Panel Data." American Economic Review, 1995, 85(3), pp. 391-414.
Kambayashi, Ryo and Kawaguchi, Daiji. "Yon-Youken Handan No Toukeiteki Bunseki: 1975-1994 (Statistical Analysis Of "Four Main Standards": 1975-1994)," R. Kambayashi, Kaiko Kisei No Hou to Keizai (Law and Economics of Employment Protection). Tokyo: Nihon Hyoron Sha, 2008, 157-74.
Karatsu, Hiroshi "New Developments in Legal Regulations Pertaining to Dismissal & Fixed-Term Employment Contracts in the Labour Standards (Amendment) Law 2003." The Japanese Journal of Labour Studies, 2004, No. 523.
Kato, Takao. "The End of Lifetime Employment in Japan? Evidence from National Surveys and Field Research." Journal of the Japanese and International Economies, 2001, 15(4), pp. 489-514.
____. "The Recent Transformation of Participatory Employment Practices," S. Ogura, T. Tachibanaki and D. Wise, NBER Conference Report Labor Markets and Firm Benefit Policies in Japan and the United States. Chicago: University of Chicago Press, 2003, 39-80.
Kato, Takao and Morishima, Motohiro. "The Productivity Effects of Participatory Employment Practices: Evidence from New Japanese Panel Data." Industrial Relations, 2002, 41(4), pp. 487-520.
Koike, Kazuo. Shigoto No Keizaigaku (Economics of Work). Tokyo: Toyo Keizai, 2005. ____. Shokuba No Rodokumiai to Sanka (Unions at Workplace and Participation). Tokyo: Toyo
Keizai (Oriental Economist), 1977. Levine, David I. Reinventing the Workplace: How Business and Employees Can Both Win.
Washington, D.C.: Brookings Institution, 1995. Miyanaga, Wataru. "Labor's Share and Adjustment of Wages and Employment," Development
Bank of Japan Research Report No. 27, 2002. Moriguchi, Chiaki and Ono, Hiroshi. "Japanese Lifetime Employment: A Century's
Perspective," EIJS Working Paper Series No. 205, 2004. Morita, Hodaka. "Choice of Technology and Labour Market Consequences: An Explanation of
U.S.-Japanese Differences." Economic Journal, 2001, 111(468), pp. 29-50. ____. "Multi-Skilling, Delegation and Continuous Process Improvement: A Comparative
Analysis of Us-Japanese Work Organizations." Economica, 2005, 72(285), pp. 69-93. Nakata, Yoshifumi and Takehiro, Ryoji. "Total Labor Costs and the Employment Adjustment
Behavior of Large Japanese Firms," S. Ogura, T. Tachibanaki and D. A. Wise, Labor Markets and Firm Benefit Policies in Japan and the United States. Chicago and London: NBER Conference Report series; University of Chicago Press, 2003, 135.
Neumark, David, ed. On the Job: Is Long-Term Employment a Thing of the Past? New York: Russell Sage Foundation, 2000.

34
Ohkusa, Yasushi and Ohtake, Fumio. "The Productivity Effects of Information Sharing, Profit
Sharing, and ESOPs." Journal of the Japanese and International Economies, 1997, 11(3), pp. 385-402.
Ono, Hiroshi. "Lifetime Employment in Japan: Concepts and Measurements," SSE/EFI Working Paper Series in Economics and Finance No. 624, 2007.
Ono, Hiroshi and Rebick, Marcus E. "Constraints on the Level and Efficient Use of Labor in Japan," National Bureau of Economic Research, Inc, NBER Working Papers: 9484, 2003.
Rebick, Marcus. The Japanese Employment System: Adapting to a New Economic Environment. Oxford and New York: Oxford University Press, 2005.
Suruga, Terukazu. "Employment Adjustment in Japanese Firms: Negative Profits and Dismissals," O. Isao and T. Tachibanaki, Internal Labour Markets, Incentives and Employment, New York: St. Martin's Press, 1998, 196-221.
Tachibanaki, Toshiaki. "Labor Mobility and Job Tenure," M. Aoki, the Economic Analysis of the Japanese Firm. Contributions to Economic Analysis series, no. 151. New York; Amsterdam and Oxford: North Holland; distributed in the U.S. and Canada by Elsevier Science, New York, 1984, 77-102.
Tsuru, Tsuyoshi; Abe, Masahiro and Kubo, Katsuyuki. Nihon Kigyo No Jinji Kaikaku (Personnel Reform in Japanese Firms). Tokyo: Oriental Economist, 2005.
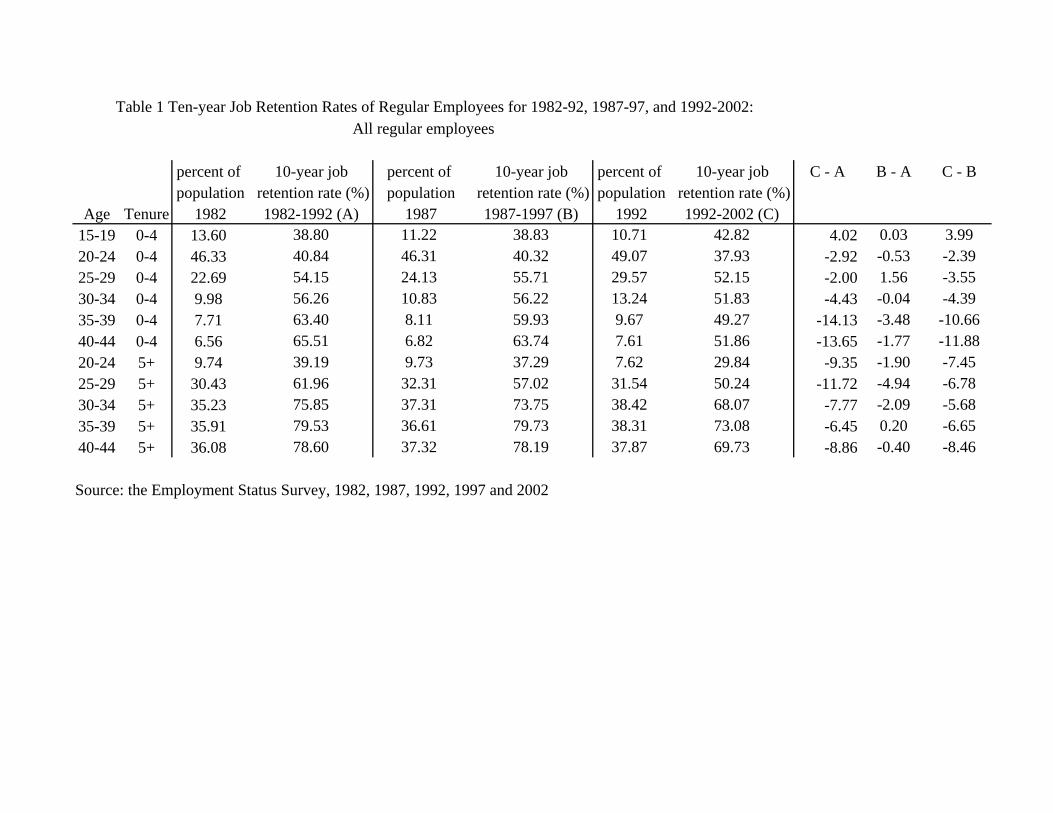
All regular employees
percent of 10-year job percent of 10-year job percent of 10-year job C - A B - A C - Bpopulation retention rate (%) population retention rate (%) population retention rate (%)
Age Tenure 1982 1982-1992 (A) 1987 1987-1997 (B) 1992 1992-2002 (C)15-19 0-4 13.60 38.80 11.22 38.83 10.71 42.82 4.02 0.03 3.9920-24 0-4 46.33 40.84 46.31 40.32 49.07 37.93 -2.92 -0.53 -2.3925-29 0-4 22.69 54.15 24.13 55.71 29.57 52.15 -2.00 1.56 -3.5530-34 0-4 9.98 56.26 10.83 56.22 13.24 51.83 -4.43 -0.04 -4.3935-39 0-4 7.71 63.40 8.11 59.93 9.67 49.27 -14.13 -3.48 -10.6640-44 0-4 6.56 65.51 6.82 63.74 7.61 51.86 -13.65 -1.77 -11.8820-24 5+ 9.74 39.19 9.73 37.29 7.62 29.84 -9.35 -1.90 -7.4525-29 5+ 30.43 61.96 32.31 57.02 31.54 50.24 -11.72 -4.94 -6.7830-34 5+ 35.23 75.85 37.31 73.75 38.42 68.07 -7.77 -2.09 -5.6835-39 5+ 35.91 79.53 36.61 79.73 38.31 73.08 -6.45 0.20 -6.6540-44 5+ 36.08 78.60 37.32 78.19 37.87 69.73 -8.86 -0.40 -8.46
Source: the Employment Status Survey, 1982, 1987, 1992, 1997 and 2002
Table 1 Ten-year Job Retention Rates of Regular Employees for 1982-92, 1987-97, and 1992-2002:
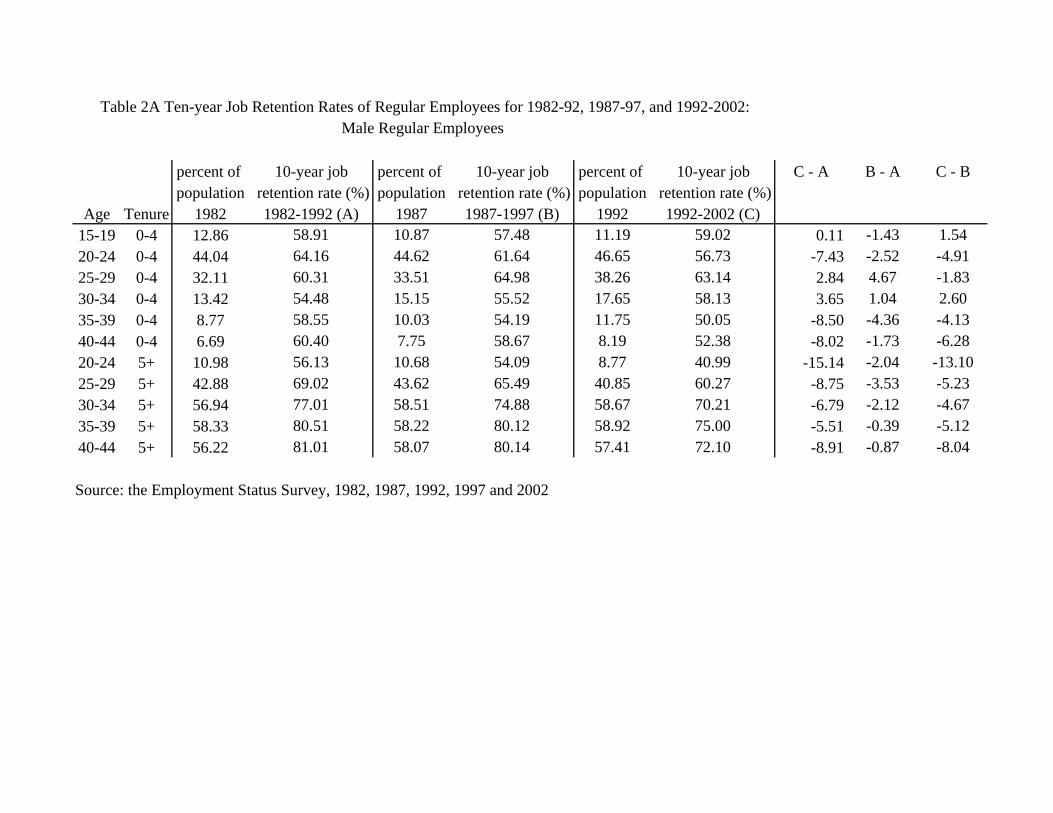
percent of 10-year job percent of 10-year job percent of 10-year job C - A B - A C - Bpopulation retention rate (%) population retention rate (%) population retention rate (%)
Age Tenure 1982 1982-1992 (A) 1987 1987-1997 (B) 1992 1992-2002 (C)15-19 0-4 12.86 58.91 10.87 57.48 11.19 59.02 0.11 -1.43 1.5420-24 0-4 44.04 64.16 44.62 61.64 46.65 56.73 -7.43 -2.52 -4.9125-29 0-4 32.11 60.31 33.51 64.98 38.26 63.14 2.84 4.67 -1.8330-34 0-4 13.42 54.48 15.15 55.52 17.65 58.13 3.65 1.04 2.6035-39 0-4 8.77 58.55 10.03 54.19 11.75 50.05 -8.50 -4.36 -4.1340-44 0-4 6.69 60.40 7.75 58.67 8.19 52.38 -8.02 -1.73 -6.2820-24 5+ 10.98 56.13 10.68 54.09 8.77 40.99 -15.14 -2.04 -13.1025-29 5+ 42.88 69.02 43.62 65.49 40.85 60.27 -8.75 -3.53 -5.2330-34 5+ 56.94 77.01 58.51 74.88 58.67 70.21 -6.79 -2.12 -4.6735-39 5+ 58.33 80.51 58.22 80.12 58.92 75.00 -5.51 -0.39 -5.1240-44 5+ 56.22 81.01 58.07 80.14 57.41 72.10 -8.91 -0.87 -8.04
Source: the Employment Status Survey, 1982, 1987, 1992, 1997 and 2002
Table 2A Ten-year Job Retention Rates of Regular Employees for 1982-92, 1987-97, and 1992-2002:Male Regular Employees
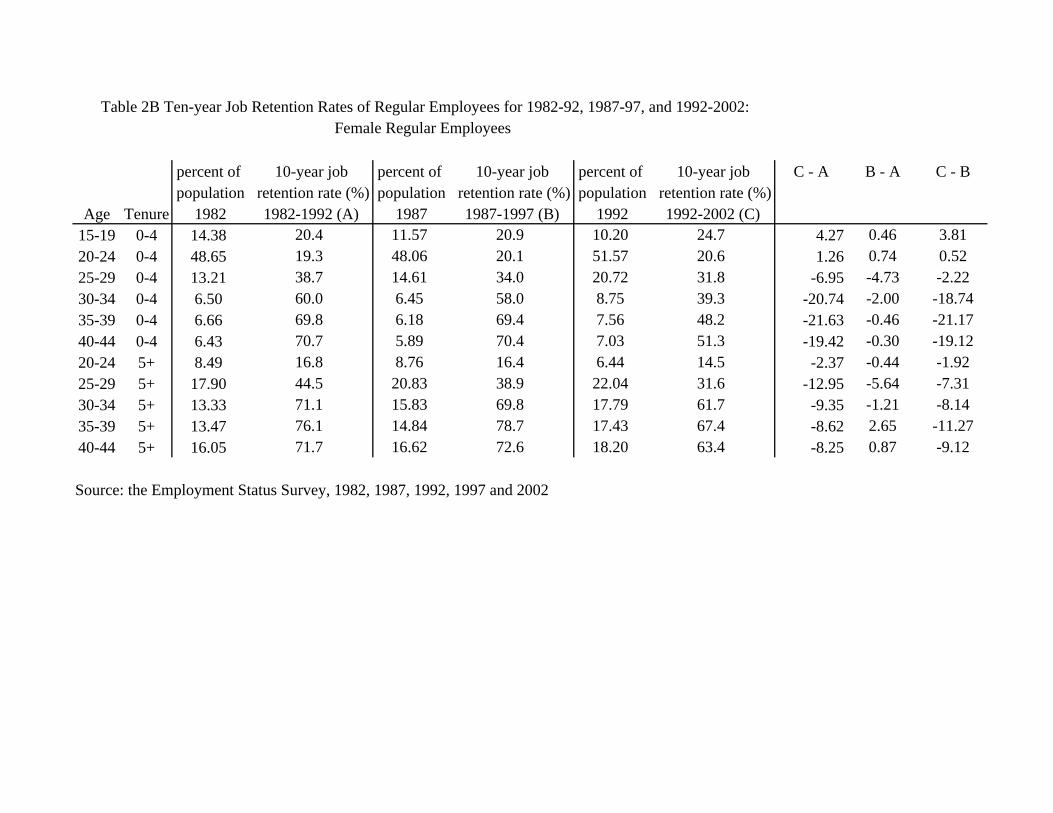
percent of 10-year job percent of 10-year job percent of 10-year job C - A B - A C - Bpopulation retention rate (%) population retention rate (%) population retention rate (%)
Age Tenure 1982 1982-1992 (A) 1987 1987-1997 (B) 1992 1992-2002 (C)15-19 0-4 14.38 20.4 11.57 20.9 10.20 24.7 4.27 0.46 3.8120-24 0-4 48.65 19.3 48.06 20.1 51.57 20.6 1.26 0.74 0.5225-29 0-4 13.21 38.7 14.61 34.0 20.72 31.8 -6.95 -4.73 -2.2230-34 0-4 6.50 60.0 6.45 58.0 8.75 39.3 -20.74 -2.00 -18.7435-39 0-4 6.66 69.8 6.18 69.4 7.56 48.2 -21.63 -0.46 -21.1740-44 0-4 6.43 70.7 5.89 70.4 7.03 51.3 -19.42 -0.30 -19.1220-24 5+ 8.49 16.8 8.76 16.4 6.44 14.5 -2.37 -0.44 -1.9225-29 5+ 17.90 44.5 20.83 38.9 22.04 31.6 -12.95 -5.64 -7.3130-34 5+ 13.33 71.1 15.83 69.8 17.79 61.7 -9.35 -1.21 -8.1435-39 5+ 13.47 76.1 14.84 78.7 17.43 67.4 -8.62 2.65 -11.2740-44 5+ 16.05 71.7 16.62 72.6 18.20 63.4 -8.25 0.87 -9.12
Source: the Employment Status Survey, 1982, 1987, 1992, 1997 and 2002
Table 2B Ten-year Job Retention Rates of Regular Employees for 1982-92, 1987-97, and 1992-2002:Female Regular Employees
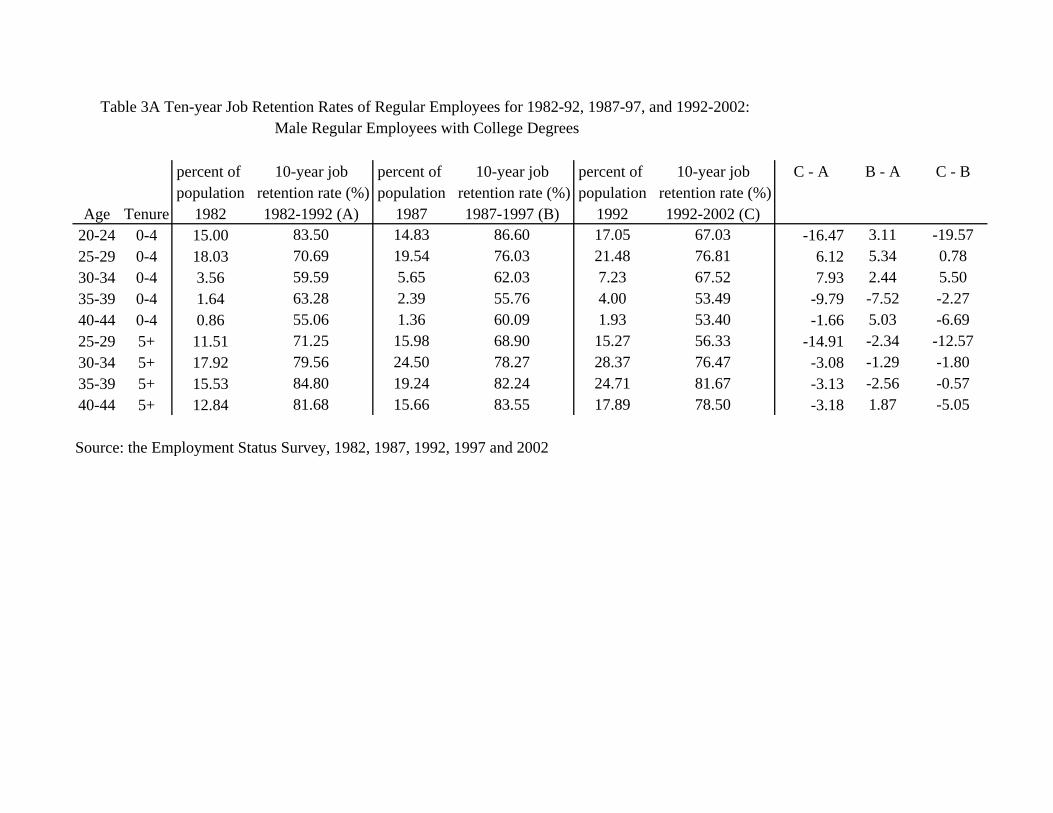
percent of 10-year job percent of 10-year job percent of 10-year job C - A B - A C - Bpopulation retention rate (%) population retention rate (%) population retention rate (%)
Age Tenure 1982 1982-1992 (A) 1987 1987-1997 (B) 1992 1992-2002 (C)20-24 0-4 15.00 83.50 14.83 86.60 17.05 67.03 -16.47 3.11 -19.5725-29 0-4 18.03 70.69 19.54 76.03 21.48 76.81 6.12 5.34 0.7830-34 0-4 3.56 59.59 5.65 62.03 7.23 67.52 7.93 2.44 5.5035-39 0-4 1.64 63.28 2.39 55.76 4.00 53.49 -9.79 -7.52 -2.2740-44 0-4 0.86 55.06 1.36 60.09 1.93 53.40 -1.66 5.03 -6.6925-29 5+ 11.51 71.25 15.98 68.90 15.27 56.33 -14.91 -2.34 -12.5730-34 5+ 17.92 79.56 24.50 78.27 28.37 76.47 -3.08 -1.29 -1.8035-39 5+ 15.53 84.80 19.24 82.24 24.71 81.67 -3.13 -2.56 -0.5740-44 5+ 12.84 81.68 15.66 83.55 17.89 78.50 -3.18 1.87 -5.05
Source: the Employment Status Survey, 1982, 1987, 1992, 1997 and 2002
Table 3A Ten-year Job Retention Rates of Regular Employees for 1982-92, 1987-97, and 1992-2002: Male Regular Employees with College Degrees

percent of 10-year job percent of 10-year job percent of 10-year job C - A B - A C - Bpopulation retention rate (%) population retention rate (%) population retention rate (%)
Age Tenure 1982 1982-1992 (A) 1987 1987-1997 (B) 1992 1992-2002 (C)15-19 0-4 12.73 55.94 10.72 54.53 11.04 55.69 -0.25 -1.41 1.1620-24 0-4 29.02 53.87 29.73 48.99 29.38 51.06 -2.80 -4.88 2.0725-29 0-4 14.07 46.69 13.93 48.90 16.59 45.96 -0.74 2.20 -2.9430-34 0-4 9.85 52.19 9.50 51.26 10.36 51.74 -0.45 -0.93 0.4835-39 0-4 7.11 57.38 7.61 53.35 7.70 48.48 -8.90 -4.02 -4.8740-44 0-4 5.82 60.46 6.38 58.33 6.22 51.94 -8.52 -2.13 -6.3920-24 5+ 10.44 56.02 10.11 53.99 8.23 41.62 -14.40 -2.03 -12.3725-29 5+ 31.35 68.09 27.60 63.25 25.43 62.91 -5.18 -4.84 -0.3530-34 5+ 38.99 75.49 33.94 72.17 30.12 64.55 -10.94 -3.33 -7.6135-39 5+ 42.76 78.56 38.88 78.62 34.07 70.25 -8.31 0.06 -8.3740-44 5+ 43.35 80.28 42.26 78.58 39.29 69.42 -10.86 -1.70 -9.16
Source: the Employment Status Survey, 1982, 1987, 1992, 1997 and 2002
Table 3B Ten-year Job Retention Rates of Regular Employees for 1982-92, 1987-97, and 1992-2002: Male Regular Employees without College Degrees
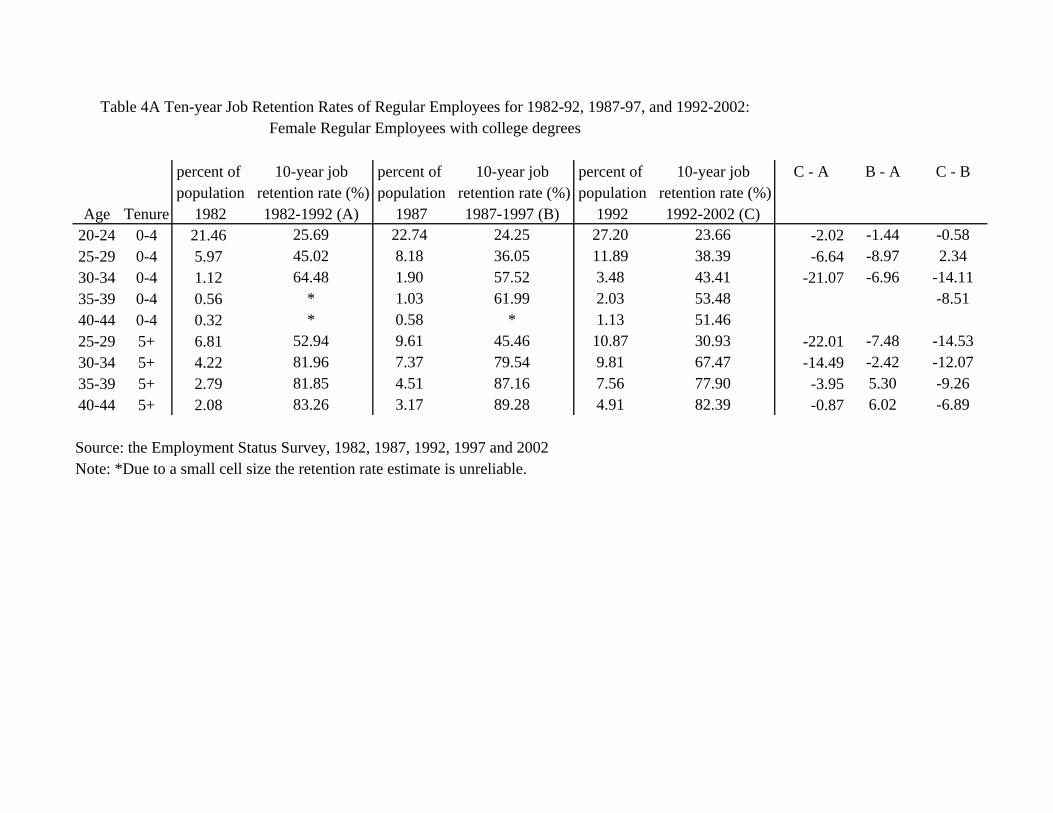
percent of 10-year job percent of 10-year job percent of 10-year job C - A B - A C - Bpopulation retention rate (%) population retention rate (%) population retention rate (%)
Age Tenure 1982 1982-1992 (A) 1987 1987-1997 (B) 1992 1992-2002 (C)20-24 0-4 21.46 25.69 22.74 24.25 27.20 23.66 -2.02 -1.44 -0.5825-29 0-4 5.97 45.02 8.18 36.05 11.89 38.39 -6.64 -8.97 2.3430-34 0-4 1.12 64.48 1.90 57.52 3.48 43.41 -21.07 -6.96 -14.1135-39 0-4 0.56 * 1.03 61.99 2.03 53.48 -8.5140-44 0-4 0.32 * 0.58 * 1.13 51.4625-29 5+ 6.81 52.94 9.61 45.46 10.87 30.93 -22.01 -7.48 -14.5330-34 5+ 4.22 81.96 7.37 79.54 9.81 67.47 -14.49 -2.42 -12.0735-39 5+ 2.79 81.85 4.51 87.16 7.56 77.90 -3.95 5.30 -9.2640-44 5+ 2.08 83.26 3.17 89.28 4.91 82.39 -0.87 6.02 -6.89
Source: the Employment Status Survey, 1982, 1987, 1992, 1997 and 2002 Note: *Due to a small cell size the retention rate estimate is unreliable.
Table 4A Ten-year Job Retention Rates of Regular Employees for 1982-92, 1987-97, and 1992-2002: Female Regular Employees with college degrees
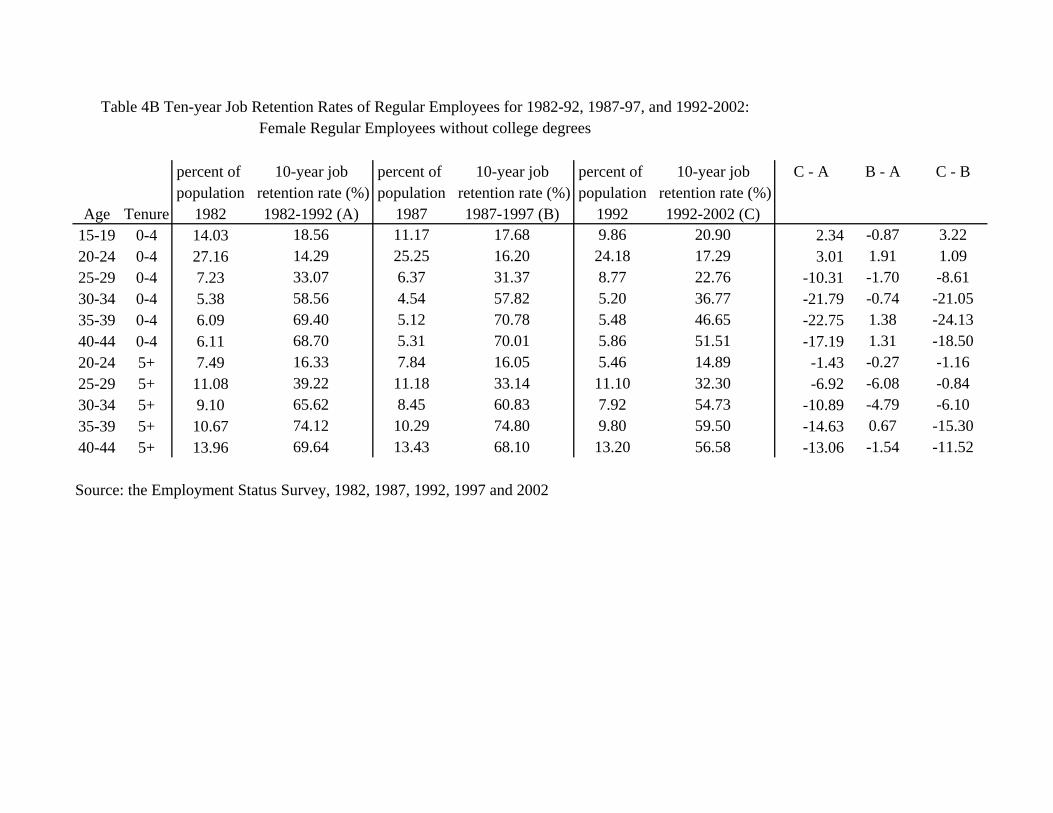
percent of 10-year job percent of 10-year job percent of 10-year job C - A B - A C - Bpopulation retention rate (%) population retention rate (%) population retention rate (%)
Age Tenure 1982 1982-1992 (A) 1987 1987-1997 (B) 1992 1992-2002 (C)15-19 0-4 14.03 18.56 11.17 17.68 9.86 20.90 2.34 -0.87 3.2220-24 0-4 27.16 14.29 25.25 16.20 24.18 17.29 3.01 1.91 1.0925-29 0-4 7.23 33.07 6.37 31.37 8.77 22.76 -10.31 -1.70 -8.6130-34 0-4 5.38 58.56 4.54 57.82 5.20 36.77 -21.79 -0.74 -21.0535-39 0-4 6.09 69.40 5.12 70.78 5.48 46.65 -22.75 1.38 -24.1340-44 0-4 6.11 68.70 5.31 70.01 5.86 51.51 -17.19 1.31 -18.5020-24 5+ 7.49 16.33 7.84 16.05 5.46 14.89 -1.43 -0.27 -1.1625-29 5+ 11.08 39.22 11.18 33.14 11.10 32.30 -6.92 -6.08 -0.8430-34 5+ 9.10 65.62 8.45 60.83 7.92 54.73 -10.89 -4.79 -6.1035-39 5+ 10.67 74.12 10.29 74.80 9.80 59.50 -14.63 0.67 -15.3040-44 5+ 13.96 69.64 13.43 68.10 13.20 56.58 -13.06 -1.54 -11.52
Source: the Employment Status Survey, 1982, 1987, 1992, 1997 and 2002
Table 4B Ten-year Job Retention Rates of Regular Employees for 1982-92, 1987-97, and 1992-2002: Female Regular Employees without college degrees

percent of 10-year job percent of 10-year job percent of 10-year job C - A B - A C - Bpopulation retention rate (%) population retention rate (%) population retention rate (%)
Age Tenure 1982 1982-1992 (A) 1987 1987-1997 (B) 1992 1992-2002 (C)15-19 0-4 4.34 80.93 2.78 84.90 3.87 73.10 -7.84 3.97 -11.8120-24 0-4 15.31 89.52 14.86 89.81 17.20 72.59 -16.92 0.29 -17.2125-29 0-4 10.21 87.90 11.79 95.25 15.65 83.41 -4.49 7.35 -11.8430-34 0-4 2.34 84.17 2.88 84.82 4.64 82.38 -1.79 0.65 -2.4435-39 0-4 1.24 92.77 1.42 86.45 2.37 66.69 -26.08 -6.33 -19.7540-44 0-4 0.77 * 1.08 84.99 1.44 56.84 -28.1520-24 5+ 3.85 69.06 4.50 62.79 2.89 51.91 -17.15 -6.27 -10.8825-29 5+ 18.57 81.94 18.93 77.39 18.30 72.68 -9.26 -4.55 -4.7130-34 5+ 25.57 89.40 25.93 89.83 27.11 86.47 -2.93 0.43 -3.3635-39 5+ 26.87 92.45 25.95 91.92 26.68 90.41 -2.04 -0.54 -1.5040-44 5+ 25.81 89.69 27.13 86.45 26.03 82.74 -6.96 -3.24 -3.71
Source: the Employment Status Survey, 1982, 1987, 1992, 1997 and 2002 Note: *Due to a small cell size the retention rate estimate is unreliable.
Table 5A Ten-year Job Retention Rates of Regular Employees for 1982-92, 1987-97, and 1992-2002:Male Regular Employees working in large firms (500 or more Employees)
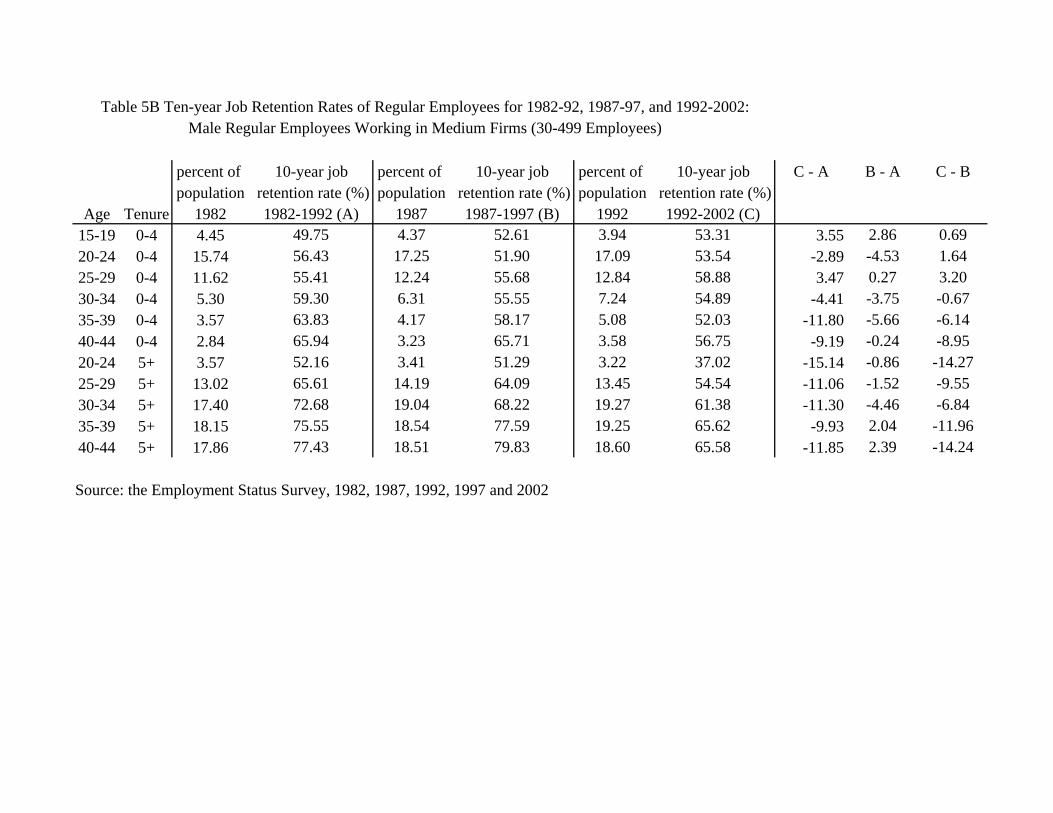
percent of 10-year job percent of 10-year job percent of 10-year job C - A B - A C - Bpopulation retention rate (%) population retention rate (%) population retention rate (%)
Age Tenure 1982 1982-1992 (A) 1987 1987-1997 (B) 1992 1992-2002 (C)15-19 0-4 4.45 49.75 4.37 52.61 3.94 53.31 3.55 2.86 0.6920-24 0-4 15.74 56.43 17.25 51.90 17.09 53.54 -2.89 -4.53 1.6425-29 0-4 11.62 55.41 12.24 55.68 12.84 58.88 3.47 0.27 3.2030-34 0-4 5.30 59.30 6.31 55.55 7.24 54.89 -4.41 -3.75 -0.6735-39 0-4 3.57 63.83 4.17 58.17 5.08 52.03 -11.80 -5.66 -6.1440-44 0-4 2.84 65.94 3.23 65.71 3.58 56.75 -9.19 -0.24 -8.9520-24 5+ 3.57 52.16 3.41 51.29 3.22 37.02 -15.14 -0.86 -14.2725-29 5+ 13.02 65.61 14.19 64.09 13.45 54.54 -11.06 -1.52 -9.5530-34 5+ 17.40 72.68 19.04 68.22 19.27 61.38 -11.30 -4.46 -6.8435-39 5+ 18.15 75.55 18.54 77.59 19.25 65.62 -9.93 2.04 -11.9640-44 5+ 17.86 77.43 18.51 79.83 18.60 65.58 -11.85 2.39 -14.24
Source: the Employment Status Survey, 1982, 1987, 1992, 1997 and 2002
Table 5B Ten-year Job Retention Rates of Regular Employees for 1982-92, 1987-97, and 1992-2002:Male Regular Employees Working in Medium Firms (30-499 Employees)
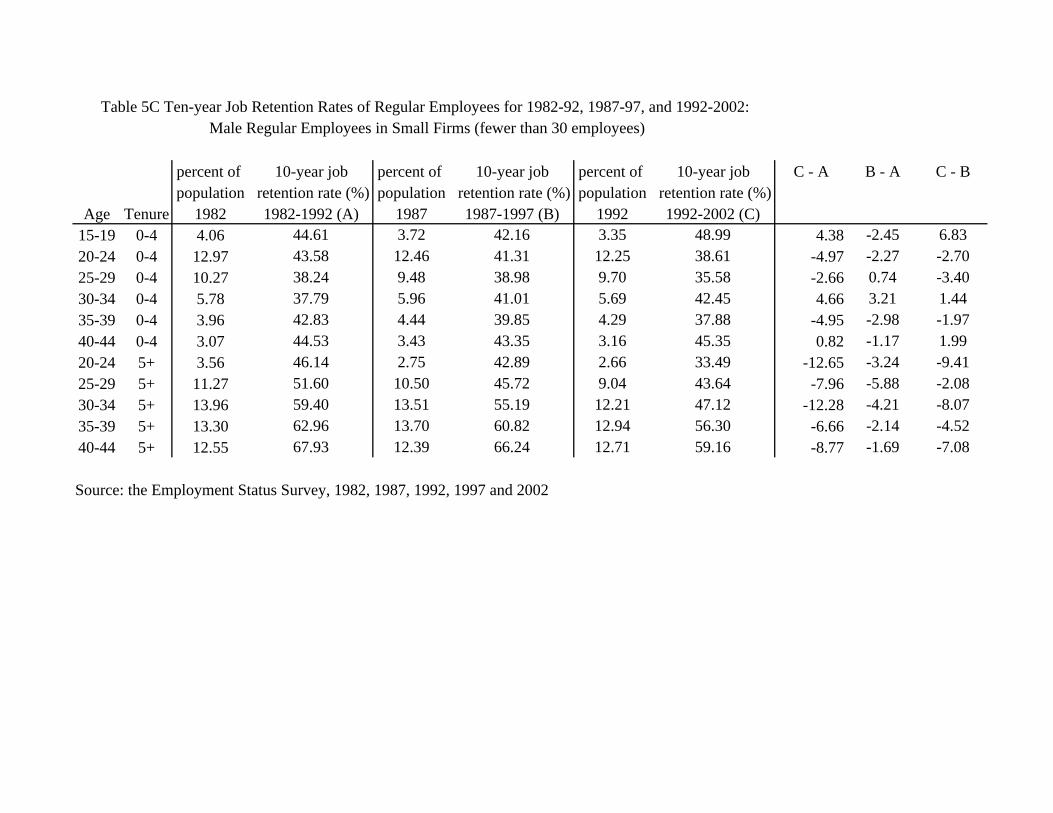
percent of 10-year job percent of 10-year job percent of 10-year job C - A B - A C - Bpopulation retention rate (%) population retention rate (%) population retention rate (%)
Age Tenure 1982 1982-1992 (A) 1987 1987-1997 (B) 1992 1992-2002 (C)15-19 0-4 4.06 44.61 3.72 42.16 3.35 48.99 4.38 -2.45 6.8320-24 0-4 12.97 43.58 12.46 41.31 12.25 38.61 -4.97 -2.27 -2.7025-29 0-4 10.27 38.24 9.48 38.98 9.70 35.58 -2.66 0.74 -3.4030-34 0-4 5.78 37.79 5.96 41.01 5.69 42.45 4.66 3.21 1.4435-39 0-4 3.96 42.83 4.44 39.85 4.29 37.88 -4.95 -2.98 -1.9740-44 0-4 3.07 44.53 3.43 43.35 3.16 45.35 0.82 -1.17 1.9920-24 5+ 3.56 46.14 2.75 42.89 2.66 33.49 -12.65 -3.24 -9.4125-29 5+ 11.27 51.60 10.50 45.72 9.04 43.64 -7.96 -5.88 -2.0830-34 5+ 13.96 59.40 13.51 55.19 12.21 47.12 -12.28 -4.21 -8.0735-39 5+ 13.30 62.96 13.70 60.82 12.94 56.30 -6.66 -2.14 -4.5240-44 5+ 12.55 67.93 12.39 66.24 12.71 59.16 -8.77 -1.69 -7.08
Source: the Employment Status Survey, 1982, 1987, 1992, 1997 and 2002
Table 5C Ten-year Job Retention Rates of Regular Employees for 1982-92, 1987-97, and 1992-2002: Male Regular Employees in Small Firms (fewer than 30 employees)
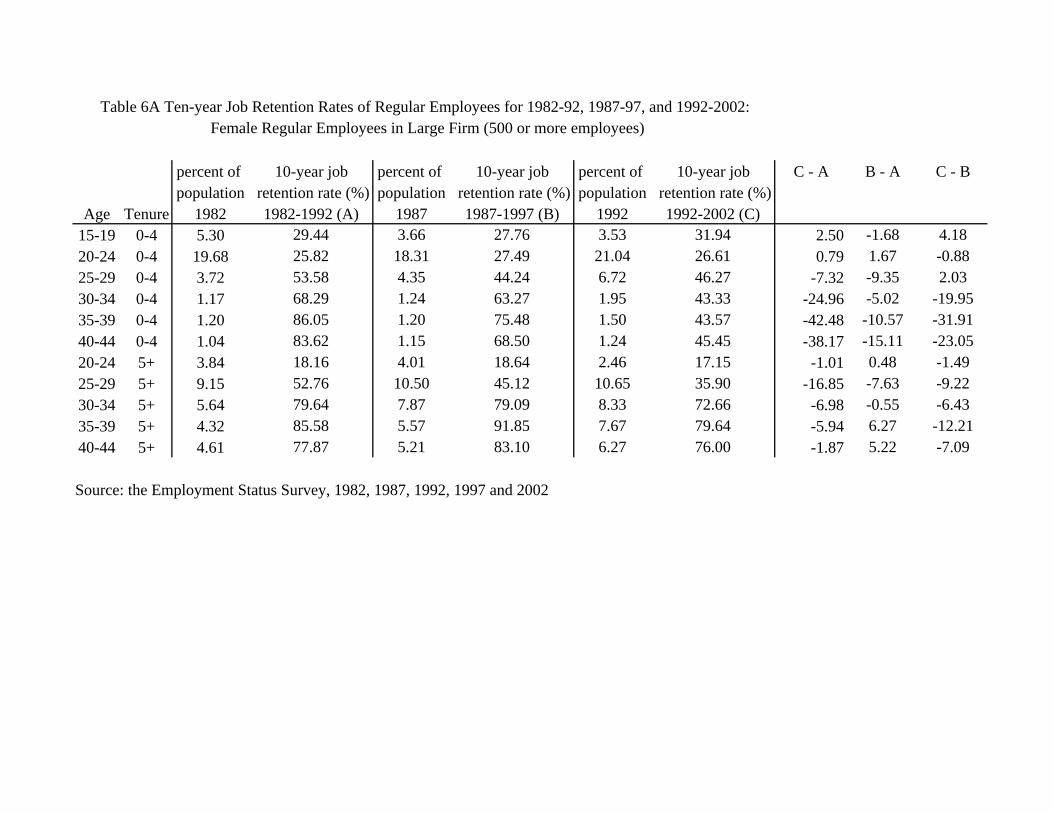
percent of 10-year job percent of 10-year job percent of 10-year job C - A B - A C - Bpopulation retention rate (%) population retention rate (%) population retention rate (%)
Age Tenure 1982 1982-1992 (A) 1987 1987-1997 (B) 1992 1992-2002 (C)15-19 0-4 5.30 29.44 3.66 27.76 3.53 31.94 2.50 -1.68 4.1820-24 0-4 19.68 25.82 18.31 27.49 21.04 26.61 0.79 1.67 -0.8825-29 0-4 3.72 53.58 4.35 44.24 6.72 46.27 -7.32 -9.35 2.0330-34 0-4 1.17 68.29 1.24 63.27 1.95 43.33 -24.96 -5.02 -19.9535-39 0-4 1.20 86.05 1.20 75.48 1.50 43.57 -42.48 -10.57 -31.9140-44 0-4 1.04 83.62 1.15 68.50 1.24 45.45 -38.17 -15.11 -23.0520-24 5+ 3.84 18.16 4.01 18.64 2.46 17.15 -1.01 0.48 -1.4925-29 5+ 9.15 52.76 10.50 45.12 10.65 35.90 -16.85 -7.63 -9.2230-34 5+ 5.64 79.64 7.87 79.09 8.33 72.66 -6.98 -0.55 -6.4335-39 5+ 4.32 85.58 5.57 91.85 7.67 79.64 -5.94 6.27 -12.2140-44 5+ 4.61 77.87 5.21 83.10 6.27 76.00 -1.87 5.22 -7.09
Source: the Employment Status Survey, 1982, 1987, 1992, 1997 and 2002
Table 6A Ten-year Job Retention Rates of Regular Employees for 1982-92, 1987-97, and 1992-2002: Female Regular Employees in Large Firm (500 or more employees)

percent of 10-year job percent of 10-year job percent of 10-year job C - A B - A C - Bpopulation retention rate (%) population retention rate (%) population retention rate (%)
Age Tenure 1982 1982-1992 (A) 1987 1987-1997 (B) 1992 1992-2002 (C)15-19 0-4 5.83 15.91 5.13 18.63 4.48 22.54 6.62 2.71 3.9120-24 0-4 16.88 15.31 17.85 15.62 18.90 18.20 2.89 0.31 2.5825-29 0-4 4.54 29.20 5.19 28.51 7.55 25.26 -3.94 -0.70 -3.2430-34 0-4 2.40 58.61 2.37 58.89 3.18 42.58 -16.04 0.28 -16.3135-39 0-4 2.57 75.95 2.42 73.00 2.85 55.14 -20.81 -2.95 -17.8640-44 0-4 2.72 75.70 2.38 80.10 3.02 56.53 -19.17 4.40 -23.5720-24 5+ 2.86 * 3.31 15.27 2.67 *25-29 5+ 4.93 35.73 6.29 31.07 7.10 26.58 -9.15 -4.66 -4.4930-34 5+ 3.74 63.72 4.20 62.16 5.29 50.10 -13.62 -1.56 -12.0635-39 5+ 3.98 73.50 4.18 76.76 4.81 56.83 -16.67 3.26 -19.9340-44 5+ 5.46 67.41 5.25 73.09 5.79 56.84 -10.57 5.68 -16.25
Source: the Employment Status Survey, 1982, 1987, 1992, 1997 and 2002 Note: *Due to a small cell size the retention rate estimate is unreliable.
Table 6B Ten-year Job Retention Rates of Regular Employees for 1982-92, 1987-97, and 1992-2002: Female Regular Employees in Medium Firms (30-499 employees)
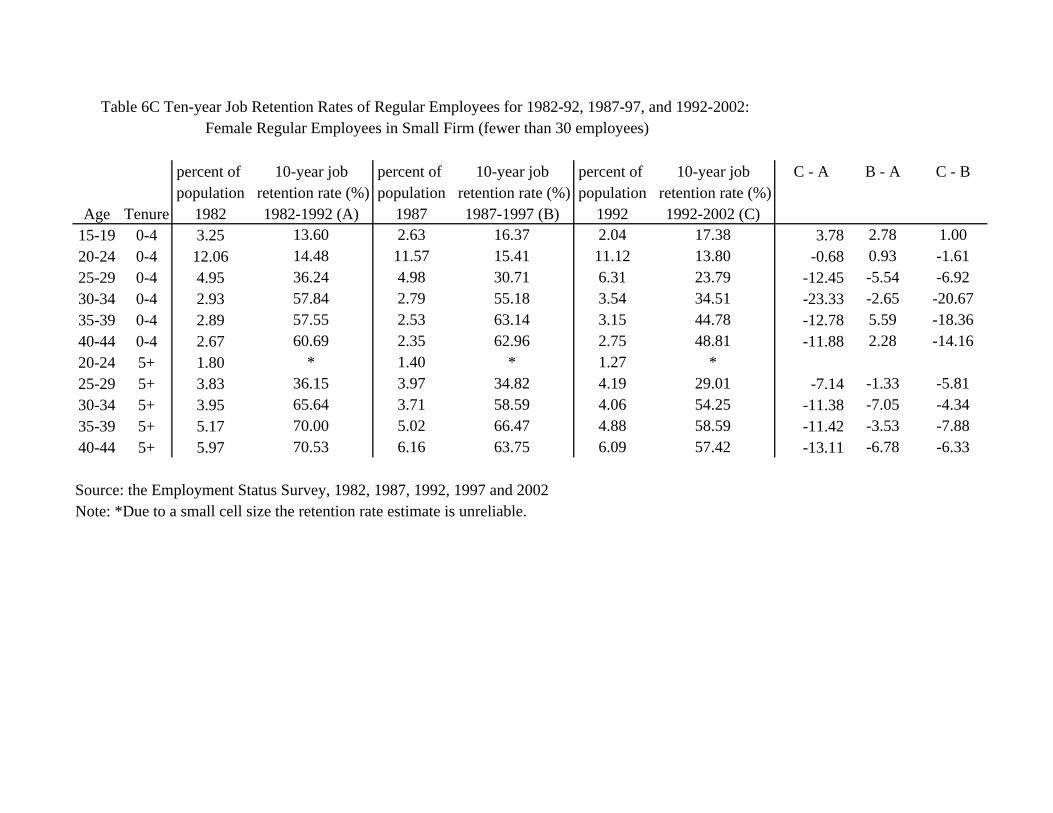
percent of 10-year job percent of 10-year job percent of 10-year job C - A B - A C - Bpopulation retention rate (%) population retention rate (%) population retention rate (%)
Age Tenure 1982 1982-1992 (A) 1987 1987-1997 (B) 1992 1992-2002 (C)15-19 0-4 3.25 13.60 2.63 16.37 2.04 17.38 3.78 2.78 1.0020-24 0-4 12.06 14.48 11.57 15.41 11.12 13.80 -0.68 0.93 -1.6125-29 0-4 4.95 36.24 4.98 30.71 6.31 23.79 -12.45 -5.54 -6.9230-34 0-4 2.93 57.84 2.79 55.18 3.54 34.51 -23.33 -2.65 -20.6735-39 0-4 2.89 57.55 2.53 63.14 3.15 44.78 -12.78 5.59 -18.3640-44 0-4 2.67 60.69 2.35 62.96 2.75 48.81 -11.88 2.28 -14.1620-24 5+ 1.80 * 1.40 * 1.27 *25-29 5+ 3.83 36.15 3.97 34.82 4.19 29.01 -7.14 -1.33 -5.8130-34 5+ 3.95 65.64 3.71 58.59 4.06 54.25 -11.38 -7.05 -4.3435-39 5+ 5.17 70.00 5.02 66.47 4.88 58.59 -11.42 -3.53 -7.8840-44 5+ 5.97 70.53 6.16 63.75 6.09 57.42 -13.11 -6.78 -6.33
Source: the Employment Status Survey, 1982, 1987, 1992, 1997 and 2002 Note: *Due to a small cell size the retention rate estimate is unreliable.
Table 6C Ten-year Job Retention Rates of Regular Employees for 1982-92, 1987-97, and 1992-2002: Female Regular Employees in Small Firm (fewer than 30 employees)
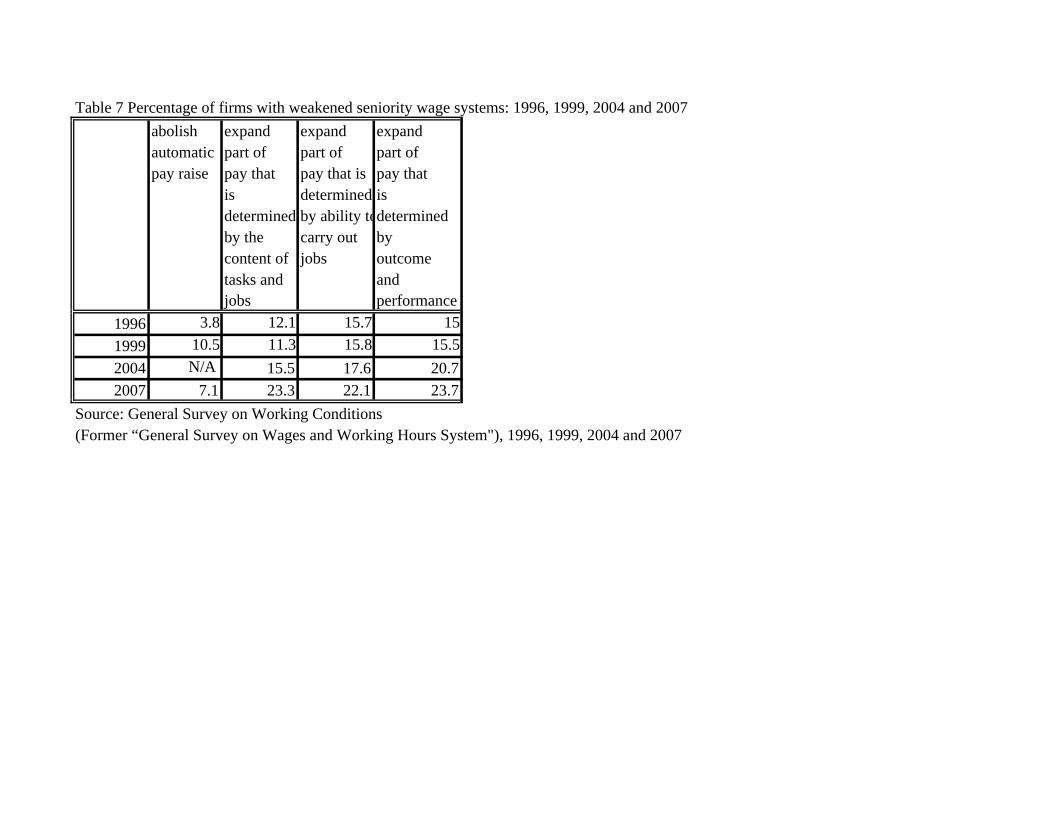
Table 7 Percentage of firms with weakened seniority wage systems: 1996, 1999, 2004 and 2007abolish expand expand expandautomatic part of part of part of pay raise pay that pay that is pay that
is determined is determined by ability todetermined by the carry out by content of jobs outcome tasks and and jobs performance
1996 3.8 12.1 15.7 151999 10.5 11.3 15.8 15.52004 N/A 15.5 17.6 20.72007 7.1 23.3 22.1 23.7
Source: General Survey on Working Conditions(Former “General Survey on Wages and Working Hours System"), 1996, 1999, 2004 and 2007
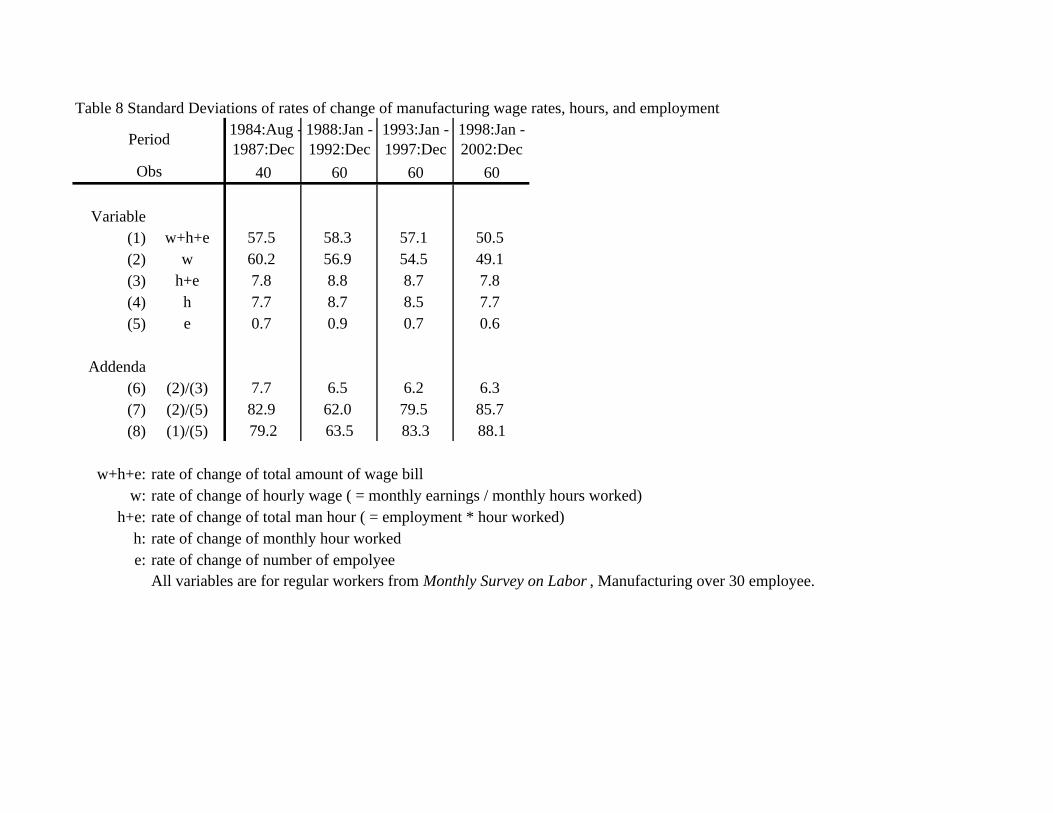
Table 8 Standard Deviations of rates of change of manufacturing wage rates, hours, and employment
40 60 60 60
Variable(1) w+h+e 57.5 58.3 57.1 50.5(2) w 60.2 56.9 54.5 49.1(3) h+e 7.8 8.8 8.7 7.8(4) h 7.7 8.7 8.5 7.7(5) e 0.7 0.9 0.7 0.6
Addenda(6) (2)/(3) 7.7 6.5 6.2 6.3(7) (2)/(5) 82.9 62.0 79.5 85.7(8) (1)/(5) 79.2 63.5 83.3 88.1
w+h+e: rate of change of total amount of wage billw: rate of change of hourly wage ( = monthly earnings / monthly hours worked)
h+e: rate of change of total man hour ( = employment * hour worked)h: rate of change of monthly hour workede: rate of change of number of empolyee
All variables are for regular workers from Monthly Survey on Labor , Manufacturing over 30 employee.
1998:Jan - 2002:Dec
Obs
Period 1984:Aug -1987:Dec
1988:Jan - 1992:Dec
1993:Jan - 1997:Dec

Figure 1 Gender gap in 10-year job retention rates for 1982-92, 1987-97, and 1992-2002: Regular Employees
-20.0
-10.0
0.0
10.0
20.0
30.0
40.0
50.0
0-4 0-4 0-4 0-4 0-4 0-4 5+ 5+ 5+ 5+ 5+
15-19 20-24 25-29 30-34 35-39 40-44 20-24 25-29 30-34 35-39 40-44
Age and Tenure
Gender gap 82-92Gender gap 87-97Gender gap 92-02
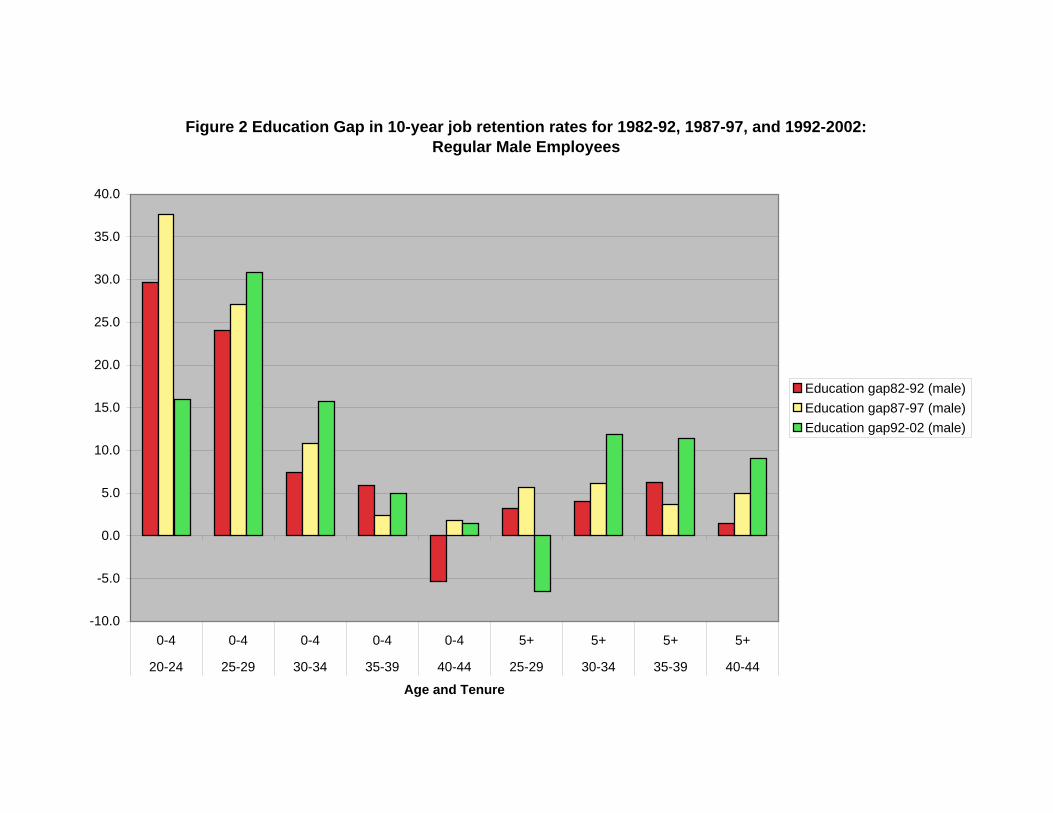
Figure 2 Education Gap in 10-year job retention rates for 1982-92, 1987-97, and 1992-2002: Regular Male Employees
-10.0
-5.0
0.0
5.0
10.0
15.0
20.0
25.0
30.0
35.0
40.0
0-4 0-4 0-4 0-4 0-4 5+ 5+ 5+ 5+
20-24 25-29 30-34 35-39 40-44 25-29 30-34 35-39 40-44
Age and Tenure
Education gap82-92 (male)Education gap87-97 (male)Education gap92-02 (male)
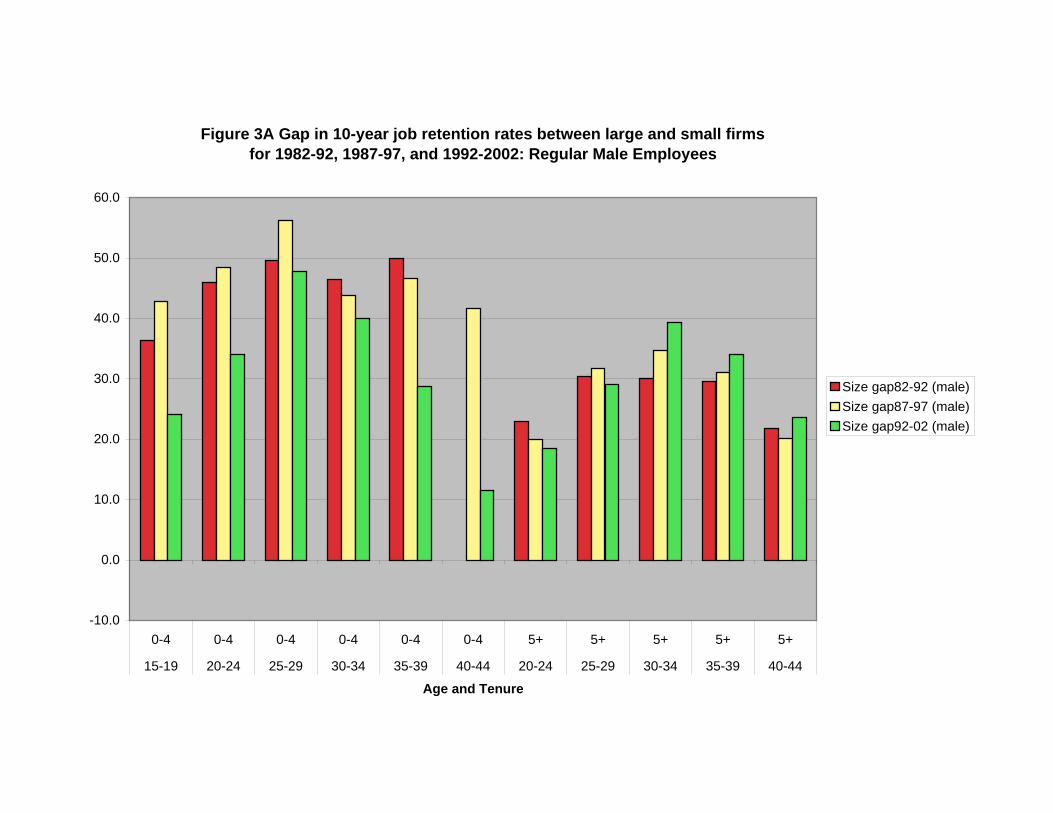
Figure 3A Gap in 10-year job retention rates between large and small firms for 1982-92, 1987-97, and 1992-2002: Regular Male Employees
-10.0
0.0
10.0
20.0
30.0
40.0
50.0
60.0
0-4 0-4 0-4 0-4 0-4 0-4 5+ 5+ 5+ 5+ 5+
15-19 20-24 25-29 30-34 35-39 40-44 20-24 25-29 30-34 35-39 40-44
Age and Tenure
Size gap82-92 (male)Size gap87-97 (male)Size gap92-02 (male)
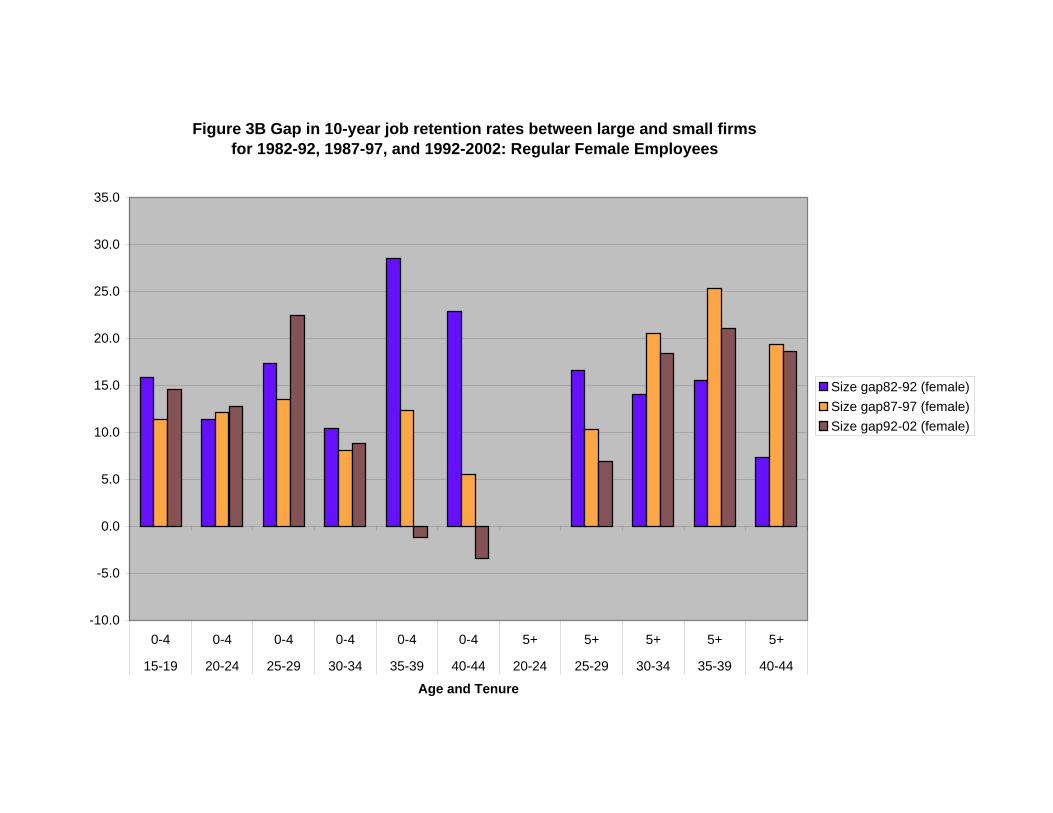
Figure 3B Gap in 10-year job retention rates between large and small firms for 1982-92, 1987-97, and 1992-2002: Regular Female Employees
-10.0
-5.0
0.0
5.0
10.0
15.0
20.0
25.0
30.0
35.0
0-4 0-4 0-4 0-4 0-4 0-4 5+ 5+ 5+ 5+ 5+
15-19 20-24 25-29 30-34 35-39 40-44 20-24 25-29 30-34 35-39 40-44
Age and Tenure
Size gap82-92 (female)Size gap87-97 (female)Size gap92-02 (female)
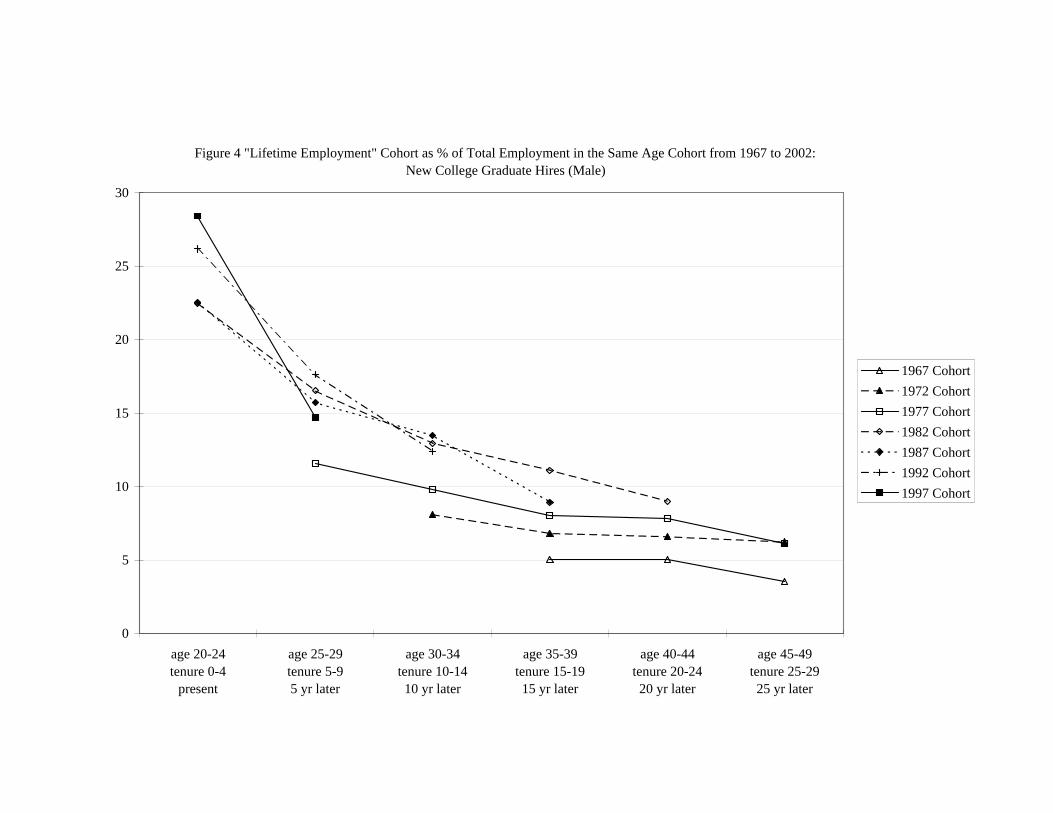
Figure 4 "Lifetime Employment" Cohort as % of Total Employment in the Same Age Cohort from 1967 to 2002: New College Graduate Hires (Male)
0
5
10
15
20
25
30
age 20-24tenure 0-4
present
age 25-29tenure 5-95 yr later
age 30-34tenure 10-1410 yr later
age 35-39tenure 15-1915 yr later
age 40-44tenure 20-2420 yr later
age 45-49tenure 25-2925 yr later
1967 Cohort1972 Cohort1977 Cohort1982 Cohort1987 Cohort1992 Cohort1997 Cohort
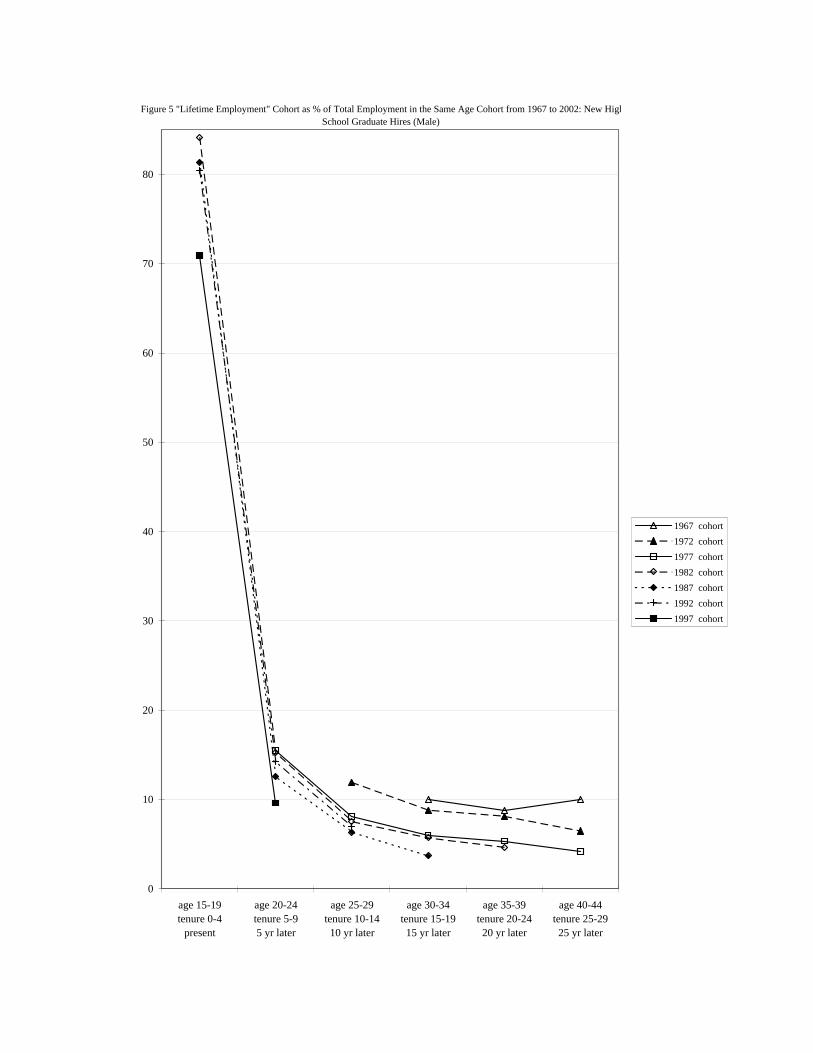
Figure 5 "Lifetime Employment" Cohort as % of Total Employment in the Same Age Cohort from 1967 to 2002: New HighSchool Graduate Hires (Male)
0
10
20
30
40
50
60
70
80
age 15-19tenure 0-4
present
age 20-24tenure 5-95 yr later
age 25-29tenure 10-14
10 yr later
age 30-34tenure 15-1915 yr later
age 35-39tenure 20-2420 yr later
age 40-44tenure 25-2925 yr later
1967 cohort1972 cohort1977 cohort1982 cohort1987 cohort1992 cohort1997 cohort
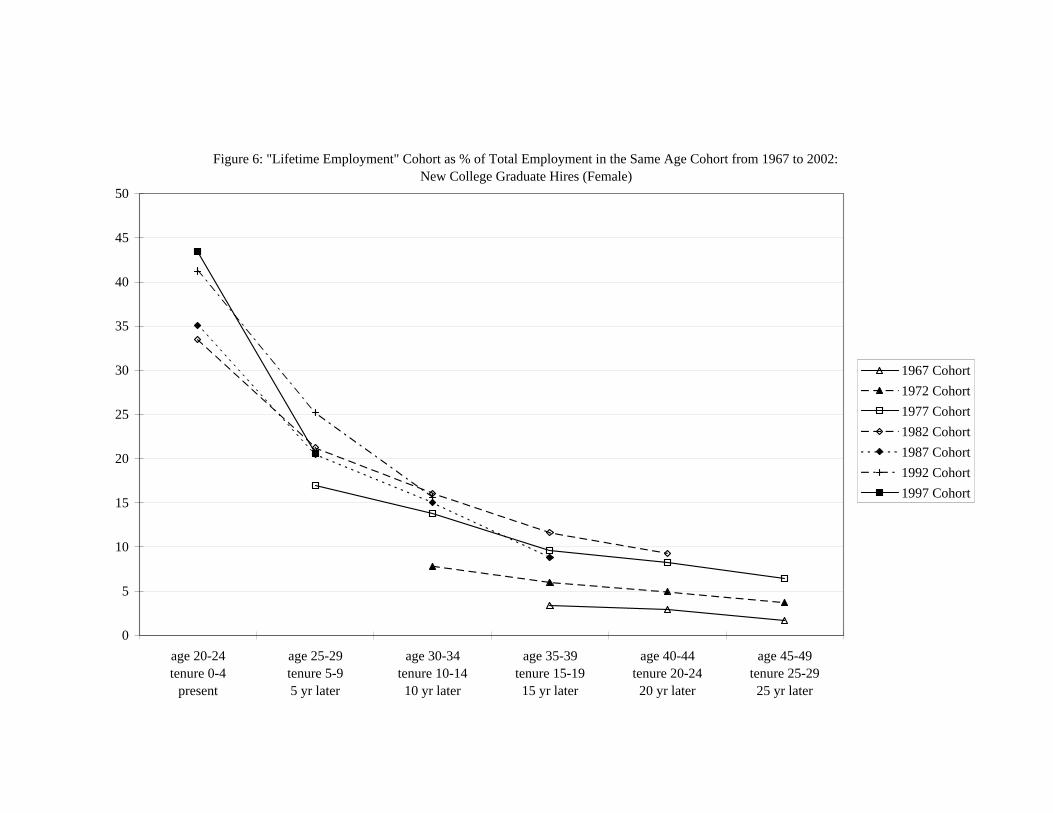
Figure 6: "Lifetime Employment" Cohort as % of Total Employment in the Same Age Cohort from 1967 to 2002: New College Graduate Hires (Female)
0
5
10
15
20
25
30
35
40
45
50
age 20-24tenure 0-4
present
age 25-29tenure 5-95 yr later
age 30-34tenure 10-1410 yr later
age 35-39tenure 15-1915 yr later
age 40-44tenure 20-2420 yr later
age 45-49tenure 25-2925 yr later
1967 Cohort1972 Cohort1977 Cohort1982 Cohort1987 Cohort1992 Cohort1997 Cohort
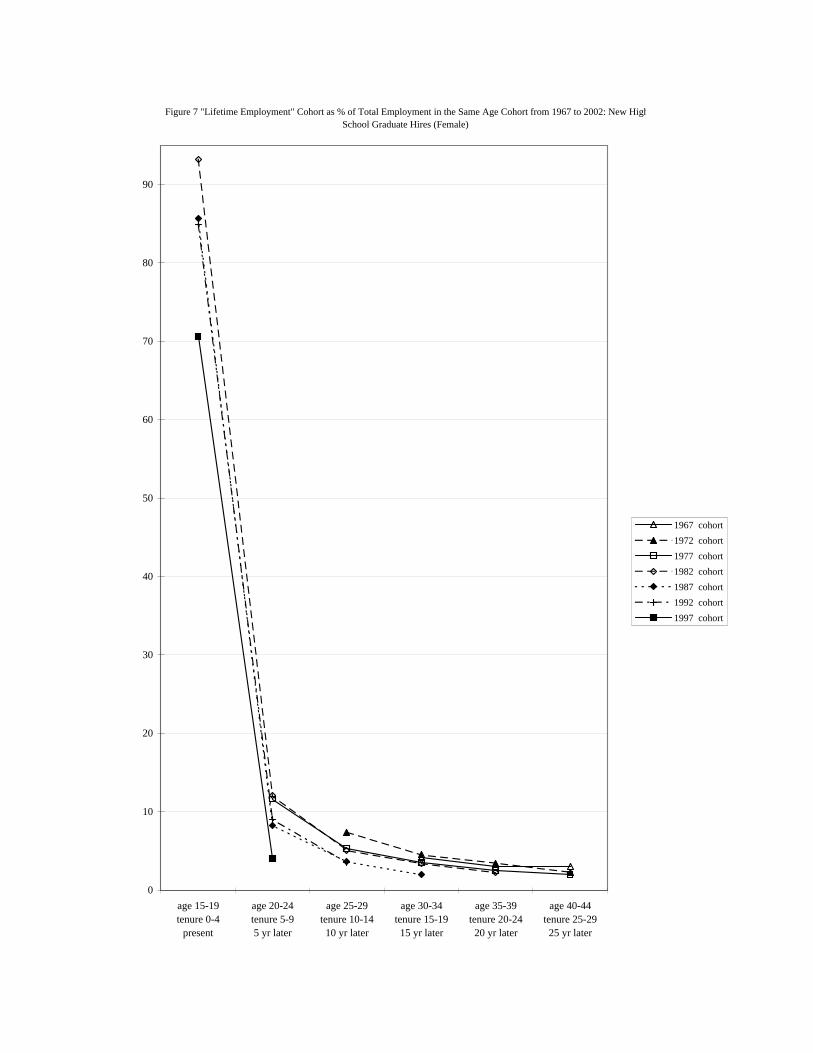
Figure 7 "Lifetime Employment" Cohort as % of Total Employment in the Same Age Cohort from 1967 to 2002: New HighSchool Graduate Hires (Female)
0
10
20
30
40
50
60
70
80
90
age 15-19tenure 0-4
present
age 20-24tenure 5-95 yr later
age 25-29tenure 10-14
10 yr later
age 30-34tenure 15-1915 yr later
age 35-39tenure 20-2420 yr later
age 40-44tenure 25-2925 yr later
1967 cohort1972 cohort1977 cohort1982 cohort1987 cohort1992 cohort1997 cohort
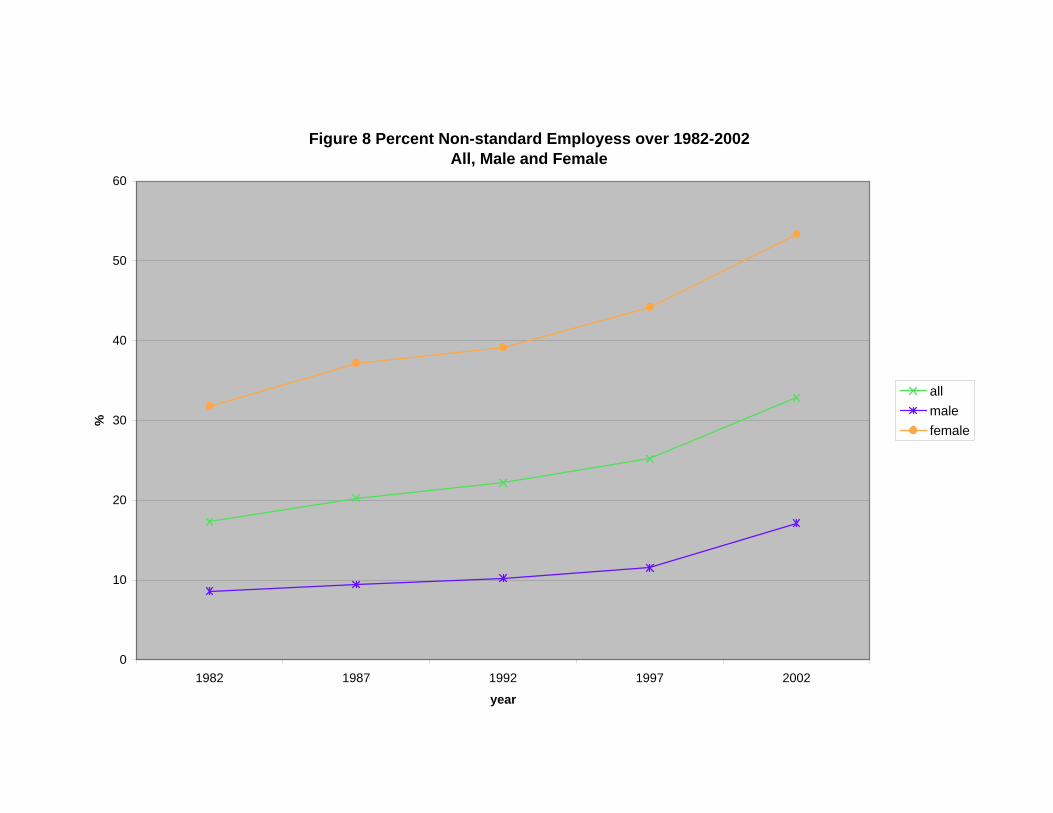
Figure 8 Percent Non-standard Employess over 1982-2002All, Male and Female
0
10
20
30
40
50
60
1982 1987 1992 1997 2002
year
%
allmalefemale

Figure 9 Percent Non-standard Employees over 1982-2002: College Graduates and High School Graduates
0
10
20
30
40
50
60
70
1982 1987 1992 1997 2002
Year
%
male college male high-schoolfemale collegefemale high-school
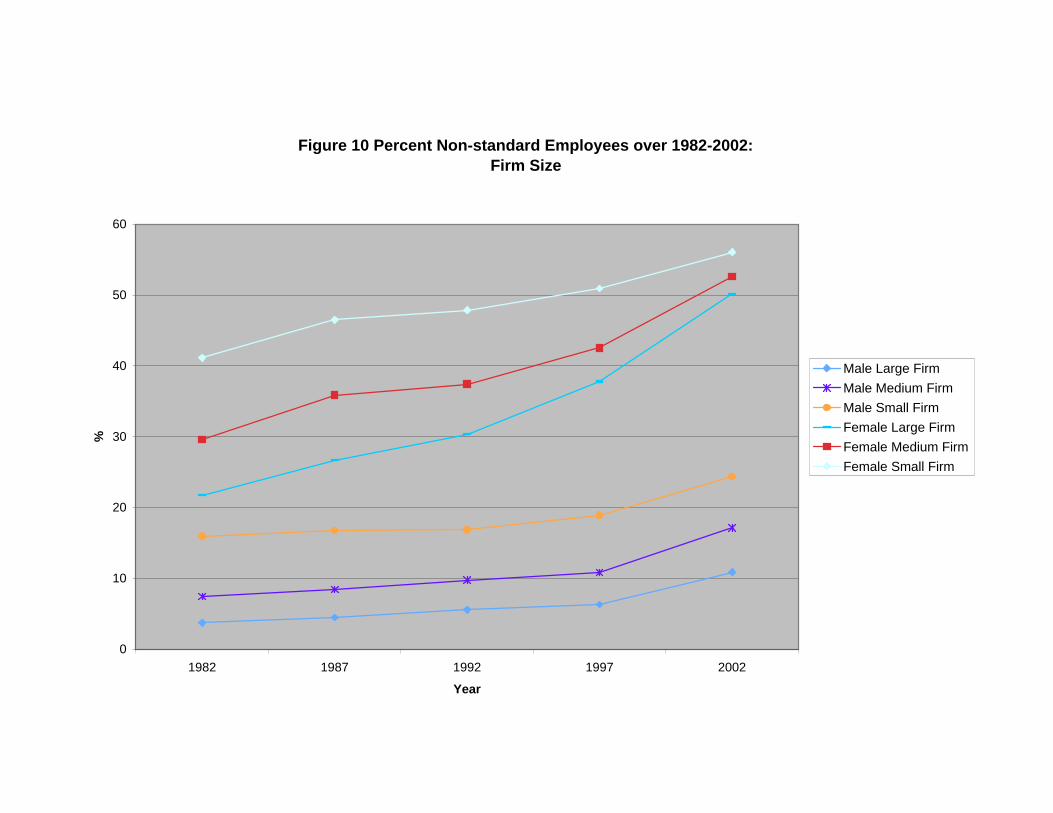
Figure 10 Percent Non-standard Employees over 1982-2002:Firm Size
0
10
20
30
40
50
60
1982 1987 1992 1997 2002
Year
%
Male Large FirmMale Medium FirmMale Small FirmFemale Large FirmFemale Medium FirmFemale Small Firm
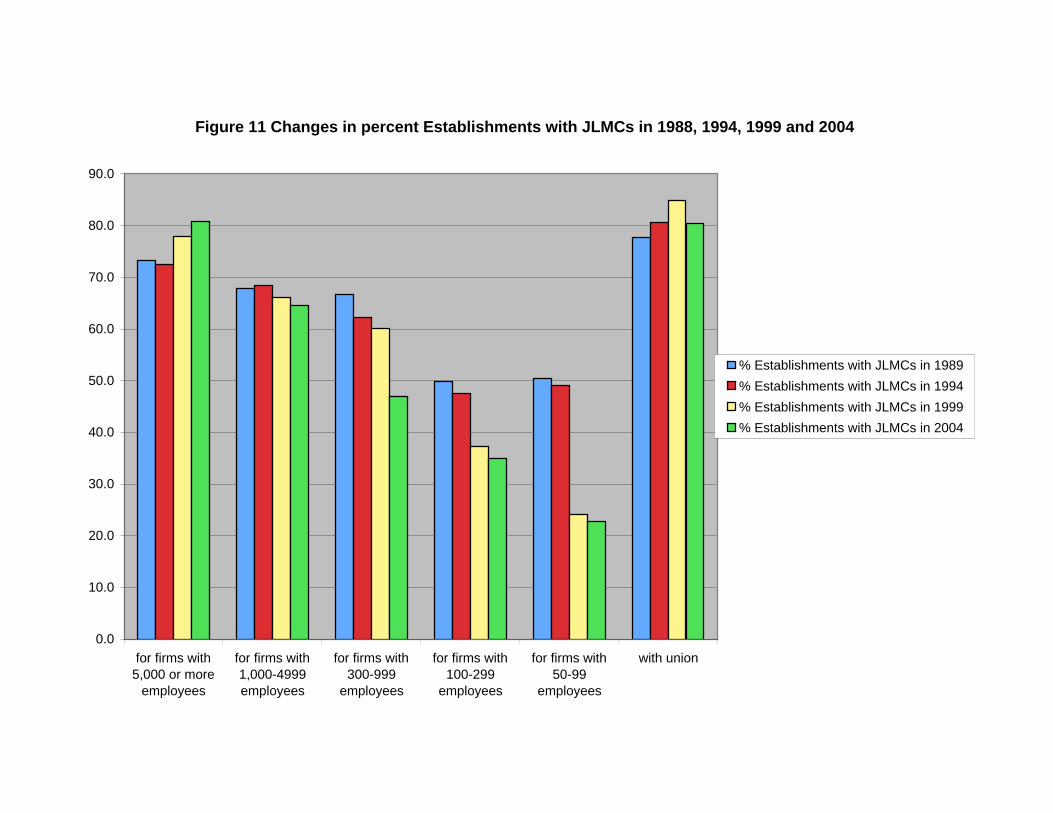
Figure 11 Changes in percent Establishments with JLMCs in 1988, 1994, 1999 and 2004
0.0
10.0
20.0
30.0
40.0
50.0
60.0
70.0
80.0
90.0
for firms with5,000 or more
employees
for firms with1,000-4999employees
for firms with300-999
employees
for firms with100-299
employees
for firms with50-99
employees
with union
% Establishments with JLMCs in 1989% Establishments with JLMCs in 1994% Establishments with JLMCs in 1999% Establishments with JLMCs in 2004
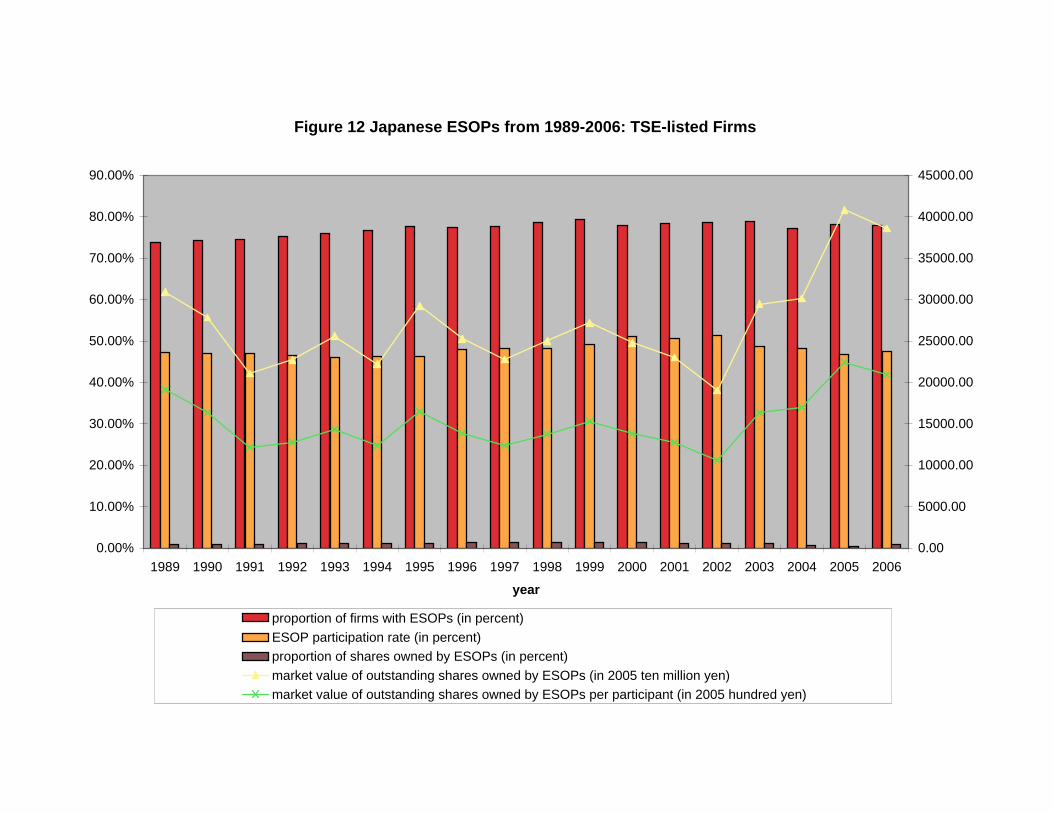
Figure 12 Japanese ESOPs from 1989-2006: TSE-listed Firms
0.00%
10.00%
20.00%
30.00%
40.00%
50.00%
60.00%
70.00%
80.00%
90.00%
1989 1990 1991 1992 1993 1994 1995 1996 1997 1998 1999 2000 2001 2002 2003 2004 2005 2006
year
0.00
5000.00
10000.00
15000.00
20000.00
25000.00
30000.00
35000.00
40000.00
45000.00
proportion of firms with ESOPs (in percent) ESOP participation rate (in percent)proportion of shares owned by ESOPs (in percent)market value of outstanding shares owned by ESOPs (in 2005 ten million yen)market value of outstanding shares owned by ESOPs per participant (in 2005 hundred yen)
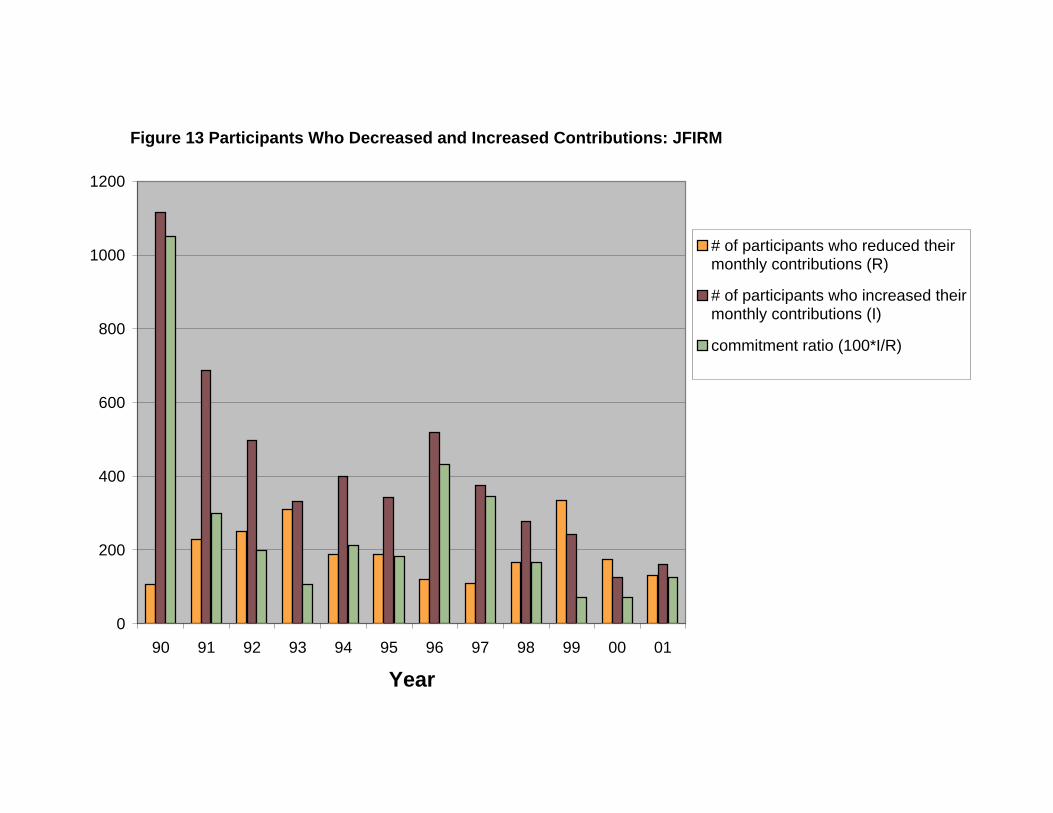
Figure 13 Participants Who Decreased and Increased Contributions: JFIRM
0
200
400
600
800
1000
1200
90 91 92 93 94 95 96 97 98 99 00 01
Year
# of participants who reduced theirmonthly contributions (R)
# of participants who increased theirmonthly contributions (I)
commitment ratio (100*I/R)
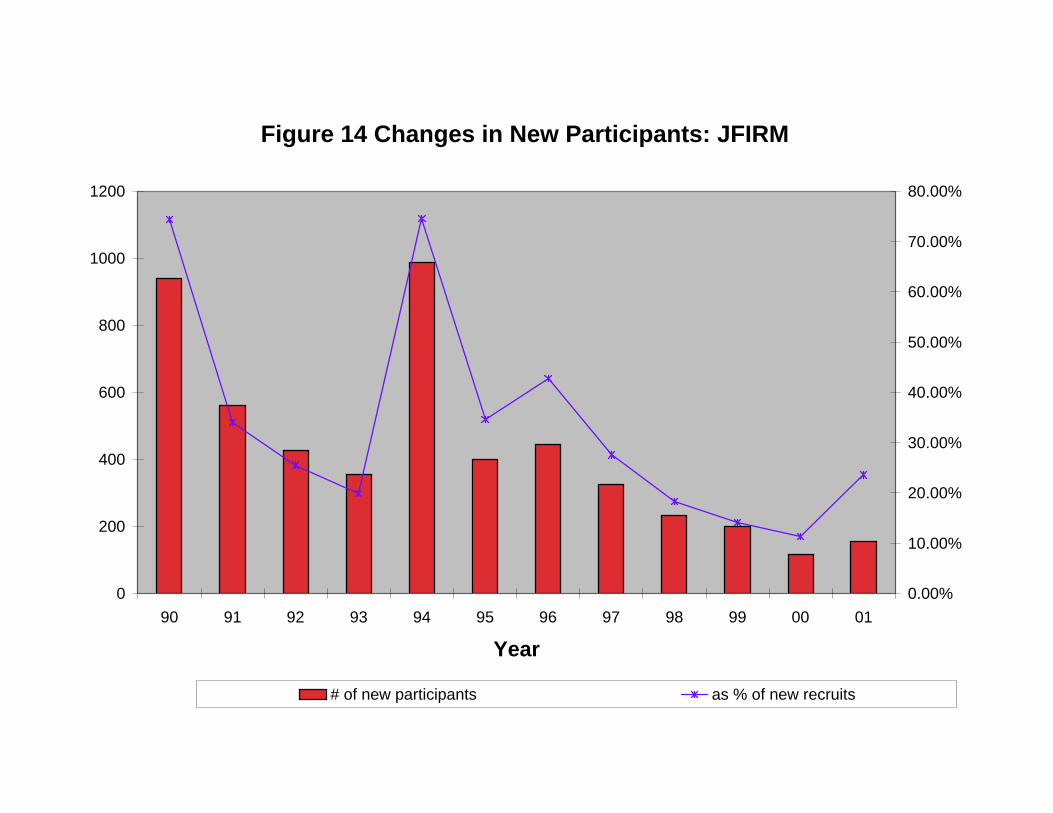
Figure 14 Changes in New Participants: JFIRM
0
200
400
600
800
1000
1200
90 91 92 93 94 95 96 97 98 99 00 01
Year
0.00%
10.00%
20.00%
30.00%
40.00%
50.00%
60.00%
70.00%
80.00%
# of new participants as % of new recruits
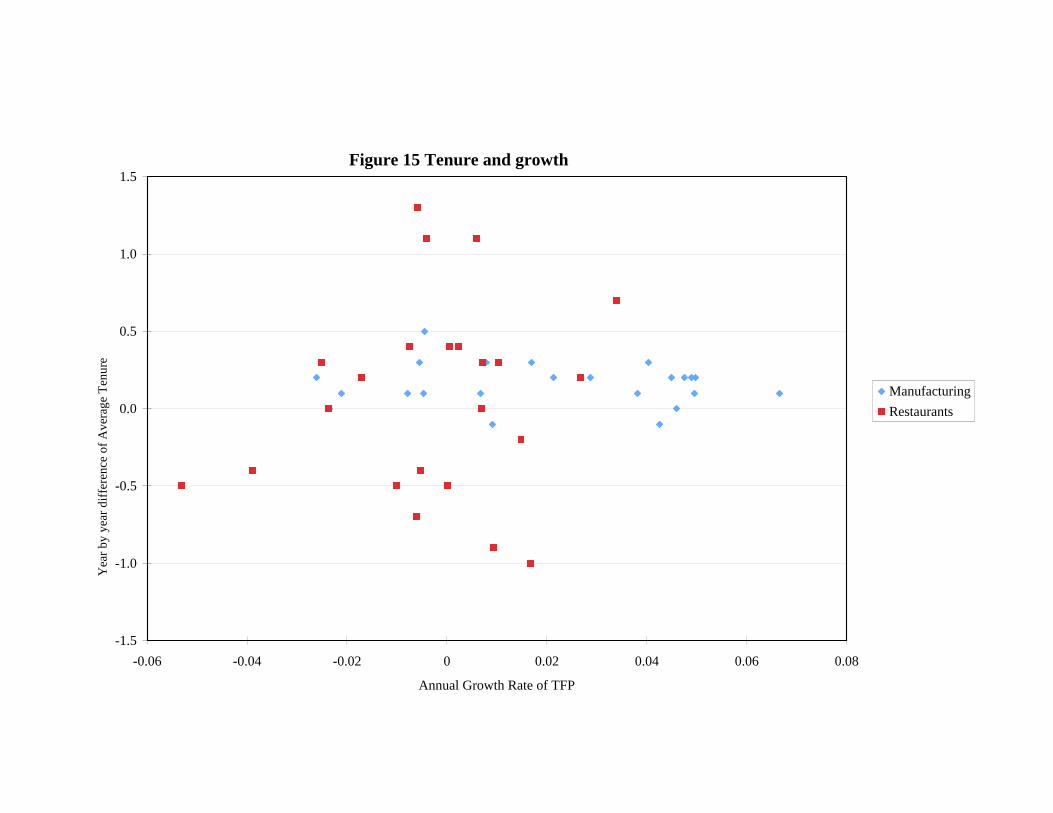
Figure 15 Tenure and growth
-1.5
-1.0
-0.5
0.0
0.5
1.0
1.5
-0.06 -0.04 -0.02 0 0.02 0.04 0.06 0.08
Annual Growth Rate of TFP
Yea
r by
year
diff
eren
ce o
f Ave
rage
Ten
ure
ManufacturingRestaurants