The Intra-Industry Trade between Portugal and Spain in the...
24
The Intra-Industry Trade between Portugal and Spain in the 90s and its Determinants By Horácio C. Faustino, Joaquim R. Silva and Rita Carvalho Paper prepared for the IV International Conference on European Economy,CEDIN, Lisbon, May 25-26, 2001 May 25, 2001
Transcript of The Intra-Industry Trade between Portugal and Spain in the...
The Intra-Industry Trade between Portugal and Spain inthe 90s and its Determinants
By
Horácio C. Faustino, Joaquim R. Silva and Rita Carvalho
Paper prepared for the IV International Conference on EuropeanEconomy,CEDIN, Lisbon, May 25-26, 2001
May 25, 2001

1
ABSTRACT
The Intra-Industry Trade between Portugal and Spain in the 90s and itsDeterminants
Horácio C. Faustino*, Joaquim R. Silva* and Rita Carvalho**
*ISEG/UTL (Technical University of Lisbon)**INP-Instituto Superior de Novas Profissões
In this paper we apply a new methodology in order to select, in terms of intra-industrytrade, the competitive cluster of Portugal in comparison to Spain during the period1990-99.Our methodology combines the Grubel and Lloyd index of the forty main productsand the Brulhart and Brulhart and Elliot marginal intra-industry trade indexes for thesame products. With a few differences, we have already applied this methodology in aworking paper (see Faustino, Silva and Carvalho (2000)).In the remainder of the paper we make a distinction between horizontal intra-industrytrade (HIIT) and vertical intra-industry trade (VIIT) and we use econometric modelsto estimate the main determinants of HIIT and VIIT.
Key words: competitive cluster, intra-industry trade, marginal intra-industry trade,horizontal intra-industry trade, vertical intra-industry trade, comparative advantage.
JEL Subject Code: F1, C2.
Correspondence:
Horácio FaustinoInstituto Superior de Economia e GestãoRua Miguel Lúpi, 201249-078 Lisbon
T: 213925902E-mail: [email protected]://www.iseg.utl.pt/~faustino
2
The Intra-Industry Trade between Portugal and Spain in the 90s andits Determinants*
Horácio C. Faustino, Joaquim R. Silva and Rita V. Carvalho
I.Introduction
Essentially we have two types of trade: inter-industry trade and intra-industry trade (mainly trade of
differentiated products)1. We used to accept that only traditional theories of comparative advantage(Ricardian trade theory and Heckscher-Ohlin trade theory), based on constant returns to scale,homogeneous product and perfect competition could explain inter-industry trade . The intra-industrytrade (IIT) was explained by scale economies , product differentiation and imperfect competition.There was also a wide acceptance of the idea that IIT was a phenomenon more intense betweencountries with similar income levels,a similarity reinforced by the economic integration process.The pioneering work in intra-industry models is due to Krugman (1979,1980), Lancaster (1980),Helpman(1981) and Eaton and Kierzkowski(1984). All these models consider that products arehorizontally differentiated – different varieties of a product are of a similar quality - although thevarieties of the same product my be distinguished in terms of their actual characteristics or perceivedcharacteristics. Neo-Chamberlinian models, such as Krugman models, consider the assumption that allvarieties enter the utility function symmetrically. By contrast, the neo-Hotelling model, for example theLancaster model is, assumes asymmetry. In the former, the consumers are assumed to endeavor toconsume as many different varieties of a given product as possible (“love of variety approach”). In thelatter, different consumers have different preferences for alternative varieties of a given commodity andeach consumer prefers one variety to all others (“favorite variety approach”). But no unique rankingwould be agreed to by all consumers.In these models each variety is produced under decreasing costs and when the countries open to thetrade the similarity of the demands leads to intra-industry trade. So, horizontal IIT is more likelybetween countries with similar factor endowments and can not be explained by traditional tradetheories.
In the vertical differentiation, different varieties are of different qualities and it is assumed thatconsumers rank alternative varieties according to product quality. Falvey (1981), Falvey andKierzkowski (1984), Shaked and Sutton (1984) and Flam and Helpman (1987) introduced the verticaldifferentiation models. It is generally accepted that vertical IIT can be explained by traditional theoriesof comparative advantage. (See, for theoretical and empirical work, Greenaway and Milner (1986),Greenaway, Hine and Milner (1994, 1995),Tharakan and Kerstens(1995), Blanes and Martin (2000)).The relative labor abundant countries have comparative advantage in labor-intensive products (lowerquality varieties) and relative capital abundant countries have comparative advantage in capital-
*In http://www.iseg.utl.pt/~faustino(“what´s new” item) all the statistical annexes will soon beavailable.The authors wish to thank AvisAnne Julien for editorial assistance.1 Falvey(1981) explains the simultaneous existence of vertical IIT and inter-industry trade .E. Helpmanand P. Krugman (1985) build up a model which generates both inter and intra-industry trade. Themodel incorporates factor endowments, decreasing costs and horizontal product differentiation. So, it isknown as the Chamberlin-Heckscher-Ohlin model. Recently, D. Davis (1995)provides a Heckscher-Ohlin-Ricardo framework that gives a unified account of inter-industry and intra-industry trade andwhere decreasing costs are not necessary for intra-industry trade. There are also some models of IIT inhomogeneous products (e.g. Brander, 1981 ; Brander and Krugman, 1983).
3
intensive products. So, according to comparative advantage law, the first countries will export the
labor-intensive varieties and the other countries will export the capital-intensive varieties. 2
The difference between horizontal IIT and vertical IIT3 is important for another reason – theadjustment costs. It is generally accepted that the adjustment costs of a given specialization change or,in response to integration processes, are lower if horizontal product differentiation is predominant. Thereason is that quality of varieties is similar, so we have similar factor intensity and lower costs of factoradjustment when the trade expands.
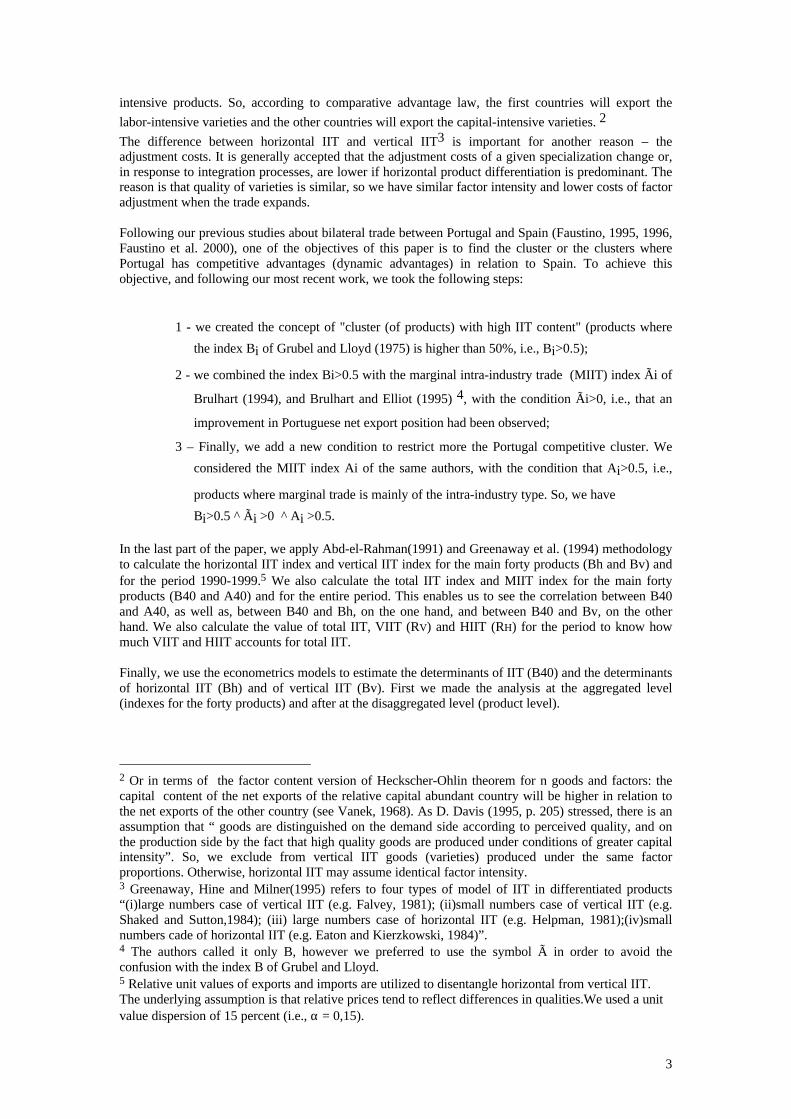
Following our previous studies about bilateral trade between Portugal and Spain (Faustino, 1995, 1996,Faustino et al. 2000), one of the objectives of this paper is to find the cluster or the clusters wherePortugal has competitive advantages (dynamic advantages) in relation to Spain. To achieve thisobjective, and following our most recent work, we took the following steps:
1 - we created the concept of "cluster (of products) with high IIT content" (products where
the index Bi of Grubel and Lloyd (1975) is higher than 50%, i.e., Bi>0.5);
2 - we combined the index Bi>0.5 with the marginal intra-industry trade (MIIT) index Ãi of
Brulhart (1994), and Brulhart and Elliot (1995) 4, with the condition Ãi>0, i.e., that an
improvement in Portuguese net export position had been observed;
3 – Finally, we add a new condition to restrict more the Portugal competitive cluster. We
considered the MIIT index Ai of the same authors, with the condition that Ai>0.5, i.e.,
products where marginal trade is mainly of the intra-industry type. So, we have
Bi>0.5 ^ Ãi >0 ^ Ai >0.5.
In the last part of the paper, we apply Abd-el-Rahman(1991) and Greenaway et al. (1994) methodologyto calculate the horizontal IIT index and vertical IIT index for the main forty products (Bh and Bv) andfor the period 1990-1999.5 We also calculate the total IIT index and MIIT index for the main fortyproducts (B40 and A40) and for the entire period. This enables us to see the correlation between B40and A40, as well as, between B40 and Bh, on the one hand, and between B40 and Bv, on the otherhand. We also calculate the value of total IIT, VIIT (RV) and HIIT (RH) for the period to know howmuch VIIT and HIIT accounts for total IIT.
Finally, we use the econometrics models to estimate the determinants of IIT (B40) and the determinantsof horizontal IIT (Bh) and of vertical IIT (Bv). First we made the analysis at the aggregated level(indexes for the forty products) and after at the disaggregated level (product level).
2 Or in terms of the factor content version of Heckscher-Ohlin theorem for n goods and factors: thecapital content of the net exports of the relative capital abundant country will be higher in relation tothe net exports of the other country (see Vanek, 1968). As D. Davis (1995, p. 205) stressed, there is anassumption that “ goods are distinguished on the demand side according to perceived quality, and onthe production side by the fact that high quality goods are produced under conditions of greater capitalintensity”. So, we exclude from vertical IIT goods (varieties) produced under the same factorproportions. Otherwise, horizontal IIT may assume identical factor intensity.3 Greenaway, Hine and Milner(1995) refers to four types of model of IIT in differentiated products“(i)large numbers case of vertical IIT (e.g. Falvey, 1981); (ii)small numbers case of vertical IIT (e.g.Shaked and Sutton,1984); (iii) large numbers case of horizontal IIT (e.g. Helpman, 1981);(iv)smallnumbers cade of horizontal IIT (e.g. Eaton and Kierzkowski, 1984)”.4 The authors called it only B, however we preferred to use the symbol à in order to avoid theconfusion with the index B of Grubel and Lloyd.5 Relative unit values of exports and imports are utilized to disentangle horizontal from vertical IIT.The underlying assumption is that relative prices tend to reflect differences in qualities.We used a unitvalue dispersion of 15 percent (i.e., α = 0,15).

4
We must emphasize that some lack of the data did not allow us to estimate a complete model.6 In thenear future we will do that.
II. Presentation of the indexes
Below we present the indexes used in this paper.
Grubel and Lloyd (GL) Indexes
Grubel and Lloyd (1975: pp. 20-23) define IIT as the difference between the trade balance of the
industry or product i, (Xi-Mi) and the total trade (TT) of this same industry or product (Xi+Mi), i.e.,
Ri = (Xi + Mi ) - | Xi - Mi |
In order to make the comparison easier between industries or countries, the index is presented as a ratiowhere the denominator is the TT, i.e.,
Bi = {[(Xi + Mi) - | Xi - Mi |] / (Xi + Mi)} x 100
For all n industries of the country, the index Bi becomes:
n n B = Σ Bi [(Xi + Mi) / Σ (Xi + Mi)] x 100
i=1 i=1
So, the index B corresponds to the average of Bi weighted by the share of each sector in the TT.
Intra-industry trade index for n main products and for m main trading partners
For example, Portugal in our case, this index can be represented as follows:
n m n m Bn = ΣΣ Rij / [ΣΣ (Xij + Mij )],
i j i j
With i=1,...n, products, and j=1,...,m, countries, where Rij represents the IIT in absolute value of the n
products (n equals to 40 in our case). This index, similarly derived from the GL index B, can be applied
to bilateral trade, as we have done for Portugal and Spain.
6 As we have calculated IIT for the main forty products at the 4-digit level we needed to aggregatethem at the 2-digit industry level (Portuguese classification of 1993) to use factor intensity asexplanatory variable. Otherwise, unfortunately we have no data for Direct Investment from Portugal toSpain and from Spain to Portugal during the period 1990-1995. So, we could not use this asexplanatory variable either.

5
Marginal intra-industry (MIIT) indexes
As Azhar, Elliott and Milner(1998,p.407) refer « One of its [traditional GL index] limitations whenmeasuring changes in intra-industry trade is that a significant increase(decrease) in the indexdocumented over two periods need not necessarily imply a large (small) change in the absolute valuesof IIT.»
Hamilton and Kniest (1991) had proposed the MIIT index, in the following terms:
MIIT = (Xt - X t-n) /(Mt - Mt-n), if ∆M > ∆X >0
= (Mt - Mt-n)/(Xt - Xt-n), if ∆X > ∆M >0
= Indefinite, if ∆X and/or ∆M < 0
0 � MIIT � 1, if ∆X, ∆M >0
Besides being indefinite for negative values of ∆X and/or ∆M, this index did not allow for the
comparison between industries of different size: i.e., it did not eliminate scale effect. Another
shortcoming pointed out by Greenaway, Hine and Elliot (1994) was associated with the question of
considering the flows in nominal terms and not in real terms7. Its relevance came from the link of the
adjustment problems - deriving from dynamic analysis - to the changes in the intra-industry trade
flows.
After the criticism of Greenaway et al., the MIIT index took the following form (see, for instance,
Brulhart, 1994, and Brulhart and Elliot, 1995):
A= [(|∆X| + |∆M|) - (|∆X - ∆M|)] / (|∆X| + |∆M|)
= 1 - [(|∆X -∆M|) / (|∆X| + |∆M|)]
0� A � 1, where the value 0 means that the marginal trade in a certain industry was all of the inter-
industry type and the value 1 means that the increase from one period to the other was all of the intra-
industry type, and
à = (∆X - ∆M) / (|∆X| + |∆M|)
-1� Ã � 1. This index Ã, according to its authors, aims at measuring the distribution of gains resulting
from the change in the marginal intra-industry trade, i.e., if Ãi>0 the country strengthens its net export
position in the industry or product i; if Ãi<0, the change in exports is lesser than the change in imports.
This index is also used in the analysis of problems of structural adjustment.
7 Trying to overcome this deficiency, Greenaway, Hine and Elliot (1994) put forward another index onthe basis of Grubel and Lloyd's definition of intra-industry trade: ∆Rij /Deflator. This index gives us thechange in the global intra-industry trade in real terms.
6
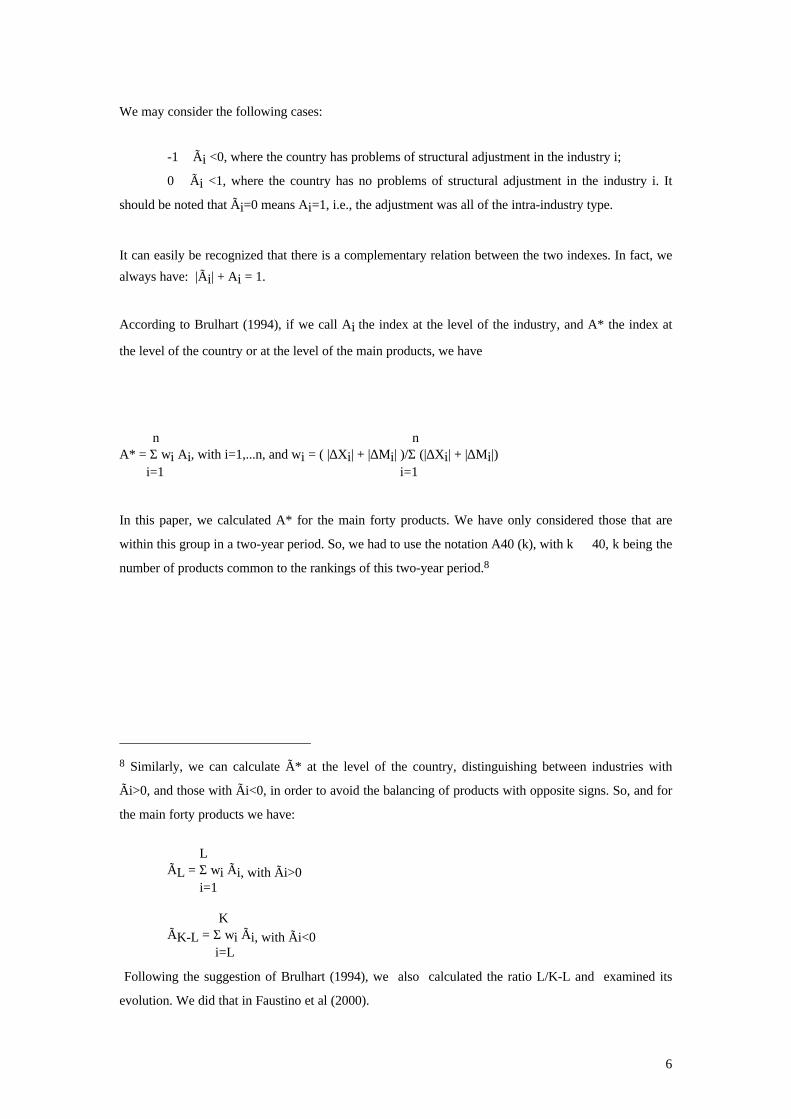
We may consider the following cases:
-1� Ãi <0, where the country has problems of structural adjustment in the industry i;
0� Ãi <1, where the country has no problems of structural adjustment in the industry i. It
should be noted that Ãi=0 means Ai=1, i.e., the adjustment was all of the intra-industry type.
It can easily be recognized that there is a complementary relation between the two indexes. In fact, we
always have: |Ãi| + Ai = 1.
According to Brulhart (1994), if we call Ai the index at the level of the industry, and A* the index at
the level of the country or at the level of the main products, we have
n nA* = Σ wi Ai, with i=1,...n, and wi = ( |∆Xi| + |∆Mi| )/Σ (|∆Xi| + |∆Mi|) i=1 i=1
In this paper, we calculated A* for the main forty products. We have only considered those that are
within this group in a two-year period. So, we had to use the notation A40 (k), with k � 40, k being the
number of products common to the rankings of this two-year period.8
8 Similarly, we can calculate Ã* at the level of the country, distinguishing between industries with
Ãi>0, and those with Ãi<0, in order to avoid the balancing of products with opposite signs. So, and for
the main forty products we have:
LÃL = Σ wi Ãi, with Ãi>0
i=1
KÃK-L = Σ wi Ãi, with Ãi<0
i=L
Following the suggestion of Brulhart (1994), we also calculated the ratio L/K-L and examined its
evolution. We did that in Faustino et al (2000).

7
III. Looking for the clusters where Portugal has competitive advantage in relation to Spain
At this point in our paper, following the main required steps, we tried to establish the cluster of
products where Portugal has competitive advantage in relation to Spain.
1. Clusters of products with Bi>0, 50
The analysis of data shows that the annual cluster in terms of the number of the products had the
following evolution:
TABLE 1 - Number of products selected by the criterion Bi>0.5
1990 1991 1992 1993 1994 1995 1996 1997 1998 1999
16 15 15 17 14 17 29 18 17 19
In 1999 we have the following 19 products (with values of Bi):
Code Products Bi
7210 Flat-rolled products of iron or non-alloy steel, of a width>=600mm, hot-rolled or cold-rolled… 0,948
7214 Other bars and rods of iron or non-alloy steel, not further worked than forged, hot-rolled, hot -drawn… 0,879
9401 Seats, whether or not convertible into beds, and parts thereof N.E. … 0,860
6110 Jerseys, pullovers, cardigans, waistcoats and similar articles, knitted or crocheted… 0,842
8536 Electrical apparatus for switching or protecting electrical circuits, or for making connections… 0,773
8418 Refrigerators, freezers and other refrigerating or freezing equipment, electric or other… 0,733
6203 Men’s or boys suits, ensembles, jackets, blazers, trousers, bib and brace overalls, breeches and shorts… 0,703
6403 Footwear with outer soles of rubber, plastics, leather or composition leather and uppers of leather… 0,688
3901 Polymers of ethylene, in primary forms 0,683
8544 Wire and cable for electrical purposes, insulated, whether or not enameled or anodized and other electric… 0,680
0302 Fish, fresh or chilled… 0,668
8704 Motor vehicles for the transport of goods, inc. chassis with engine and cab. 0,622
6204 Women’s or girls´suits, ensembles, jackets, dresses, skirts, divided skirts, trousers, bib and brace overalls,… 0,592
7601 Aluminum, not alloyed, unwrought. 0,574
4501 Natural cork,raw or merely surface-worked or otherwise cleaned, cork waste;crushed, powdered or ground cork 0,572
4011 New pneumatic tires, of rubber 0,549
8708 Parts and accessories for tractors, motor vehicles for the transport of ten or more persons, motor cars and other… 0,540
4411 Fiberboard of wood or other ligneous materials, whether or not agglomerated with resins or other organic … 0,524
0401 M ilk and cream, not concentrated nor containing added sugar or other sweating matter 0,501

8
2. Clusters of products with Bi>0, 50 and Ãi>0
Here we combined the products with high intra-industry trade content (Bi>0) with the condition that animprovement in Portuguese net export position had been observed (Ãi>0).
The analysis of data shows that the annual cluster in terms of the number of the products had the
following evolution:
TABLE 2 - Number of products selected by the criterion Bi>0.5 and Ãi>0
1991 1992 1993 1994 1995 1996 1997 1998 1999
8 5 7 10 10 11 10 8 6
In 1999 we have the following six products (with values of Ãi in parenthesis):
7214 - Other bars and rods of iron or non-alloy steel, not further worked than forged, hot-rolled, hot -drawn… (0,422)6110 - Jerseys, pullovers, cardigans, waistcoats and similar articles, knitted or crocheted… (0,142)8536 - Electrical apparatus for switching or protecting electrical circuits, or for makingconnections…(0,508)6203 - Men’s or boys suits, ensembles, jackets, blazers, trousers, bib and brace overalls, breeches and
8544 - Wire and cable for electrical purposes, insulated, whether or not enameled or anodized, andother electric… (1,0)4011 - New pneumatic tires, of rubber (0,995)
3. Clusters of products with Bi>0, 50 , Ãi>0 and Ai>0, 50
Here the criterion becomes more selective. We have a cluster of products with “high intra-industrycontent”, where Portugal improved its net export position and where marginal intra-industry trade wasmainly intra-industry type.
The analysis of data shows that the annual cluster in terms of the number of the products had the
following evolution:
TABLE 3 - Number of products selected by the criterion Bi>0.5, Ãi>0 and Ai>0.5
1991 1992 1993 1994 1995 1996 1997 1998 1999
3 2 3 2 6 8 6 4 2
In 1999 we have the following two products (with values of Ai in parenthesis):
7214 - Other bars and rods of iron or non-alloy steel, not further worked than forged, hot-rolled, hot -drawn… (0,578)6110 -Jerseys, pullovers, cardigans, waistcoats and similar articles, knitted or crocheted… (0,858).
9
Conclusion. The first criterion was the one we used in the previous empirical studies ( Faustino, 1995,1996) and as we can see is not very selective. We prefer the other two criterions. If we are worriedabout commercial deficit and balance of payments deficit, as well as structural adjustment costs, weapply the second citerion. If we are worried about structural adjustment path, we use the third criterion.As we can see, from 1996 the situation became worse for Portugal when we apply these two criterions.
IV- Intra-industry trade and marginal intra-industry trade indexes for the main forty products(B40 e A40)
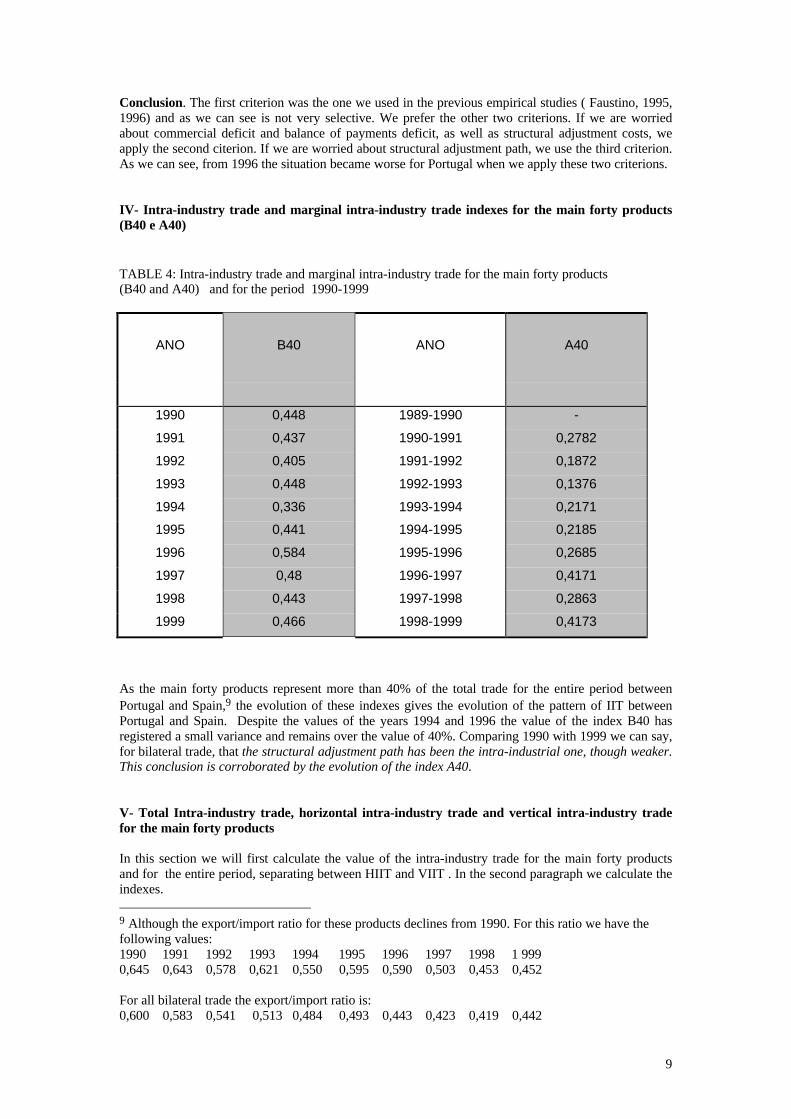
TABLE 4: Intra-industry trade and marginal intra-industry trade for the main forty products(B40 and A40) and for the period 1990-1999
ANO B40 ANO A40
1990 0,448 1989-1990 -
1991 0,437 1990-1991 0,2782
1992 0,405 1991-1992 0,1872
1993 0,448 1992-1993 0,1376
1994 0,336 1993-1994 0,2171
1995 0,441 1994-1995 0,2185
1996 0,584 1995-1996 0,2685
1997 0,48 1996-1997 0,4171
1998 0,443 1997-1998 0,2863
1999 0,466 1998-1999 0,4173
As the main forty products represent more than 40% of the total trade for the entire period betweenPortugal and Spain,9 the evolution of these indexes gives the evolution of the pattern of IIT betweenPortugal and Spain. Despite the values of the years 1994 and 1996 the value of the index B40 hasregistered a small variance and remains over the value of 40%. Comparing 1990 with 1999 we can say,for bilateral trade, that the structural adjustment path has been the intra-industrial one, though weaker.This conclusion is corroborated by the evolution of the index A40.
V- Total Intra-industry trade, horizontal intra-industry trade and vertical intra-industry tradefor the main forty products
In this section we will first calculate the value of the intra-industry trade for the main forty productsand for the entire period, separating between HIIT and VIIT . In the second paragraph we calculate theindexes. 9 Although the export/import ratio for these products declines from 1990. For this ratio we have thefollowing values:1990 1991 1992 1993 1994 1995 1996 1997 1998 1 9990,645 0,643 0,578 0,621 0,550 0,595 0,590 0,503 0,453 0,452
For all bilateral trade the export/import ratio is:0,600 0,583 0,541 0,513 0,484 0,493 0,443 0,423 0,419 0,442

10
1. The relation between the value of total intra-industry trade (R40), vertical intra-industry trade(RV) and horizontal intra-industry trade (RH)
TABLE 5 – Total intra-industry trade (R40), horizontal intra-industry trade (RH) and vertical intra-industry trade (RV) and its relation for the period 1990-1999.
Unit: 106 PTE
1990 1991 1992 1993 1994 1995 1996 1997 1998 1999
(1)R40
190 445 193 185 200 190 219 575 197 013 271 651 380 899 369 100 419 032 504 973
(2)RH
100 103 125 051 95 229 84 984 72 079 93 432 134 878 102 444 154 916 272 129
(3)RV
90 342 68 134 104 961 134 591 124 934 178 219 246 021 266 656 264 166 232 844
(2): (1)RH/R40
0,5256 0,6473 0,4757 0,3870 0,3659 0,3439 0,3541 0,2776 0,3697 0,5389
(3): (1)RV/R40
0,4744 0,3527 0,5243 0,6130 0,6341 0,6561 0,6459 0,7224 0,6303 0,4611
(3): (2)RV/RH
0,9026 0,5449 1,1022 1,5840 1,7331 1,9075 1,8242 2,6023 1,7050 0,8557
Taking into account the relation between RV and R40 we can see that it has been increasing since 1991up until 1997. In 1997 the VIIT is 72,24% of the total IIT for the main forty products. It is a valuewhich is in accordance with the values expected for a new industrialized country as Portugal. For thedeveloped countries VIIT accounts for 80 to 90 percent of total IIT (Aturupane et al. 1999). Thistendency was reversed in 1998 (VIIT accounts for 63% of total IIT) and in 1999, VIIT accounts foronly 46% of total IIT. It is an unexpected value. We came back to the values of 1990.
Regarding the number of products where we have VIIT and HIIT, we can confirm this negativetendency in the last two years.
TABLE 6 – Number of products where Portugal has HIIT (BH) and where Portugal has VIIT (BV) forthe period 1990-1999
1990 1991 1992 1993 1994 1995 1996 1997 1998 1999 TOTAL
BH 18 17 11 13 14 12 12 12 14 16 139
BV 22 23 29 27 26 28 28 28 26 24 261

11
2. The horizontal intra-industry trade and vertical intra-industry trade indexes for the mainforty products (BH and BV)
But more important than the number of products where we have VIIT or HIIT is the value of the trade.So, we calculate the VIIT and HIIT indexes as well as the total IIT index for the main forty products.
TABLE 7– HIIT index (BH), VIIT index (BV) and total IIT index (B40) for the main forty products,1990 - 1999
1990 1991 1992 1993 1994 1995 1996 1997 1998 1999
BH 0,582 0,488 0,357 0,372 0,284 0,341 0,588 0,527 0,557 0,568
BV 0,414 0,367 0,448 0,514 0,377 0,371 0,582 0,480 0,396 0,385
B40 0,448 0,437 0,405 0,448 0,336 0,441 0,584 0,480 0,443 0,466
According to these data, the HIIT index (BH) is higher than VIIT index (BV) and total IIT index (B40)from 1996. In the last two years this tendency has been stressed in favor of HIIT index. We can ask if itis a “good thing” or a “bad thing”. According to the theory, HIIT is explained by the interactionbetween economies of scale and (horizontal) product differentiation. As we pointed out in theintroduction, horizontal IIT falls much more within the field of modern theories of trade. VIIT can beexplained by comparative advantages in the context of Heckscher –Ohlin (H-O) or Ricardo-Heckscher-Ohlin (R-H-O) framework, without recourse to economies of scale. Following Tharakanand Kerstens (1995, p.87) “The latter study ( Tharakan 1989) which carries out a product-by-productanalysis (corresponding to SITC 5-digit ) suggests that the observed IIT is partly due to H-O-typedeterminants and partly caused by other factors such as vertical, and in some cases, horizontal productdifferentiation.” In the same direction of rising importance of traditional trade theories, especially theH-O model and H-O-Vanek factor content model, we can refer to the theoretical and empirical studiesof D. Davis (1995), Davis and Weinstein (1996, 2000) and Davis et al (1996, 1997). In Portugal wehave a recent empirical work that assesses the importance of H-O-V model to explain productionstructure and trade in the Portugal Northern region (see Maria Girante, 2000).
We can conclude by saying: (i) it is important to make the comparison between VIIT and HIIT indexesof Portugal-Spain bilateral trade with other developed countries indexes; (ii) more important is theevolution of these indexes as well as the evolution of total IIT (B40); (iii) very important is to know thevariables (country characteristics and industry characteristics) which explain the variation of total IIT,VIIT and HIIT.

12
VI- The determinants of total intra-industry trade, horizontal intra-industry trade and verticalintra-industry trade
First we use the total IIT index, VIIT index, and HIIT index for the main forty products as a dependentvariable. As we work at the product level we can not use the factor proportion variable (industry level).Following Davis and Weinstein (1997)10 we will consider the “good” factors and the division of humancapital in three levels: CH1 (High qualified labor), CH2 (Medium and qualified labor) and CH3 (theremainders). Anther explanatory variable is GDP per capita, using PPPs. We expected that humancapital (variables that are introduced in both neofactorial trade models and intra-industry trade models)has a positive effect on total IIT (B40), VIIT (BV) and HIIT (BH). So the expected signals for thecoefficients of these variables are positive.We use the difference between GDPpc in Spain and GDPPpc in Portugal (GDPSpc –GDPPpc). Theexpected signal for the coefficient of this variable differs in accordance with the dependent variable.For VIIT (BV) the expected signal is positive because VIIT is mainly due to H-O determinants. So thedifferences of endowments between countries have a positive effect on VIIT (and we can consider theGDPpc differences a proxy for factor endowment differences). If we consider HIIT the dependentvariable, then the expected signal is negative because HIIT is mainly explained by the variables of themodern trade theory (economies of scale). If the dependent variable is total IIT (B40), we can havepositive or negative coefficients because both theories can explain the total trade. We also introduce the variable A40 to know if the marginal IIT (the dynamic aspects) has significantstatistical influence. We used simple regression, multiple regression and polynomial regression.Unfortunately, as we have already noted, the Portuguese Central Bank has no single data seriesavailable for bilateral direct investment between 1990 and 1999.
As we can see by Table 8, some coefficients have the expected signal but the variables are onlystatistically significant in two estimated equations. The adjustment is better when we use thepolynomial model.The variable A40 is only statistically significant to explain HIIT (BH).
10 “Consider, next , the problem of measuring endowments. One option is to choose a coarse partitionof endowments into so-called “good” factors – like college-educated labor, non-college educated labor,and capital – that are good in the sense that the factors have clear definitions are conceptually close tothe notion of endowment. Or one can choose a much finer partition into “bad” factors, for example,distinguishing labor categories such as professional/technical, clerical, sales and service.(…) However,the occupational categories associated with the bad factors may fail to be independent of the outputmeasure” (Davis et al. 1997, p.427)

13
TABLE 8 – Regression results for bilateral IIT (B40), VIIT (BV) and HIIT (BH) for the main fortyproducts (aggregated level), in the period 1990- 1999
Dependentvariable Constant GDPS-
GDPP
(GDPS-GDP
P)2
A CH1 CH2 CH3 R2 DW n
B40 0,234(0,977)
0,0001(0,901)
0,092 1,813
10
B40 -73,1(-2,11)
0,011(2,21)
-0,0001**
*(2,18)
0,460 2,43 10
B40 -0,298(-0,0001)
0,463(0,0001)
1,698(0,0001)
-0,074(-0,0001)
0,243 2,2 9
B40 0,387(5,57)
0,231(0,946)
0,113 2,2 9
BV 0,771(2,89)
-0,0001(-1,27)
0,168 2,16 10
BV -5,17(-1,15)
0,008(-1,296)
-0,0001(-1,33)
0,337 2,56 10
BV 1,849(0,0001)
0,214(0,0001)
-4,946(-0,0001)
-0,565(-0,0001)
0,143 2,45 9
BV 0,462(5,45)
-0,099(-
0,331)
0,015 2,18 9
BH -0,245(-0,617)
0,0001(1,798)
0,288 1,539
10
BH-11,06
(-1,779)0,016
(1,799)-0,0001(-1,793)
0,503 1,850
10
BH 4,67(-0,0001)
0,867(0,0001)
15,18(0,0001)
1,36(0,0001)
0,506 2,16 9
BH 0,222(2,454)
0,859**
(2,7)
0,511 2,76 9
The figures in parentheses are t-values. The symbol *, **, *** denotes that the coefficient is significant (2-tail test) at the 1, 5 and10 per cent confidence level, respectively.
In a second stage (see table 9) we considered the same dependent variables but at the product level. Wenow have more observations but the difficulty in finding explanatory variables is evident. We used therevealed comparative advantages index (RCA) in logarithm form and also the marginal IIT index asdeterminants. In all econometric models the best adjusted model is the polynomial one. Although

14
theory suggests that their determinants will differ, the empirical evidence presented by theseestimations do not support the theory. A priori we expected that lnRCA explains the variation of thelnVIIT but not the variation of the lnBH. But as we have seen before (Tables 5 and 7) HIIT accountsfor 53,8% of total IIT in 1999 and HIIT index is higher than VIIT index during the period 1996-1999.On the other hand, we used only a simple model. So we must be careful with the conclusions.
TABLE 9 – Regression results for bilateral IIT (Bi), VIIT (BVi) and HIIT (BHi) for the period 1990-1999 and for the main forty products (product level)
Dependentvariable Constant lnRCA (lnRCA)
2 A R2 DW n
ln Bi -1,264(-19,3)
0,429*(6,972)
0,109 1,965 398
ln Bi -0,947(-24,7)
0,62*(17,57)
-0,293*(-29,16)
0,718 2,01 398
ln Bi -1,546(-18,29)
0,373*(5,928)
1,19*(5,31)
0,167 1,98 359
ln BV i -1,319(-15,9)
0,567*(7,43)
0,178 1,952 258
ln BV i -0,931(-20,18)
0,545*(13,5)
-0,332*(-25,67)
0,771 2,12 258
ln BH i -1,126(-13,6)
0,631*(6,298)
0,221 1,873 142
ln BH i -0,561(-15,0)
0,422*(10,79)
-0,788*(-28,58)
0,887 2,25 142
The figures in parentheses are t-values. The symbol * denotes that the coefficient is significant (2-tail test) at the 1 per centconfidence level.
VII- Main conclusions
In terms of bilateral trade and applying the second criterion (Bi>0,5 and Ãi>) or the third criterion(Bi>0,5, Ãi>0 and Ai>0,5) we conclude that the competitive position of Portugal has deteriorated from1996. There is empirical evidence that Portugal will suffer structural adjustment costs if the situation isnot reversed.As the bilateral trade is concerned, the evolution of the VIIT and HIIT follows in a opposite way of theothers countries: in Portugal we observe the strength of HIIT ( 53,89% of total IIT in 1999) and theweakness of VIIT.The regression results are not conclusive, although there is some empirical evidence against theprediction made by theory for separating the determinants of horizontal and vertical IIT.

15
ANNEX
PRODUCTS WITH: Ãi >>0, Bi >>0,5 and Ai >>0,5
1990-1991
CODE PRODUCTS Ãi>>01990-1991
Bi>>0,51991
Ai>>0,51990-1991
0302 Fish, fresh or chilled (excl. Fish filletsand other fish meat of heading 0304)
0,151 0,984 0,849
6110 Jerseys, pullovers, cardigans, waistcoats andsimilar articles, knitted or crocheted (excl.Wadded waistcoats)a)
0,478 0,522 0,522
8704 Motor vehicles for the transport of goods,incl. Chassis with engine and cab
0,316 0,973 0,684
Source: ICEP
a) In 1990, this product is not within the main forty products. So, as the analysis has to be done only atthe level of the main forty products, we gave the value zero to that product in 1990, however it does notcorrespond necessarily to its real value.
1991-1992
CODE PRODUCTS Ãi>>01991-1992
Bi>>0,51992
Ai>>0,51991-1992
8418 Refrigerators, freezers and otherrefrigerating or freezing equipment,electric or other; heat pumps (excl. Airconditioning machines of heading no 8415)…
0,297 0,876 0,703
8544 Wire and cable -incl. Co-axial cable- forelectrical purposes, insulated, whether ornot enamelled or anodised, and otherinsulated electric conductors, whether ornot fitted with connectors; optical fibrecables, made up of individually…
0,089 0,641 0,911
Source: ICEP

16
1992-1993
CODE PRODUCTS Ãi>>01992-1993
Bi>>0,51993
Ai>>0,51992-1993
3904 Polymers of vinyl chloride or otherhalogenated olefins, in primary forms… a)
0,081 0,919 0,919
7210 Flat-rolled products of iron or non-alloysteel, of a width >= 600 mm, hot-rolled orcold-rolled 'cold-reduced', clad, plated orcoated…
0,159 0,85 0,841
8704 Motor vehicles for the transport of goods,incl. Chassis with engine and cab …
0,086 0,506 0,914
Source: ICEP
a) In 1992, this product is not within the main forty products. So, as the analysis has to bedone only at the level of the main forty products, we gave the value zero to that product in1992, however it does not correspond necessarily to its real value.
1993-1994
CODE PRODUCTS Ãi>>01993-1994
Bi>>0,51994
Ai>>0,51993-1994
3904 Polymers of vinyl chloride or otherhalogenated olefins, in primary forms…
0,346 0,824 0,654
4403 Wood in the rough, whether or not strippedof bark or sapwood, or roughly squared(excl. Rough-cut wood for walking sticks,umbrellas, tool shafts and the like; woodin the form of railway sleepers; wood cutinto boards or beams, etc.)…a)
0,213 0,787 0,787
Source: ICEP
a) In 1993, this product is not within the main forty products. So, as the analysis has to bedone only at the level of the main forty products, we gave the value zero to that product in1993, however it does not correspond necessarily to its real value.

17
1994-1995
CODE PRODUCTSÃi>>0
1994-1995
Bi>>0,51995 Ai>>0,5
1994-19950302 Fish, fresh or chilled (excl. Fish fillets
and other fish meat of heading 0304)…0,175 0,7 0,825
1905 Bread, pastry, cakes, biscuits and otherbakers' wares, whether or not containingcocoa; communion wafers, empty cachets of akind suitable for pharmaceutical use, sealingwafers, rice paper and similar products…
0,013 0,788 0,987
6110 Jerseys, pullovers, cardigans, waistcoats andsimilar articles, knitted or crocheted (excl.Wadded waistcoats)…a)
0,385 0,615 0,615
8544 Wire and cable -incl. Co-axial cable- forelectrical purposes, insulated, whether ornot enamelled or anodised, and otherinsulated electric conductors, whether or notfitted with connectors; optical fibre cables,made up of individually…
0,475 0,512 0,525
8708 Parts and accessories for tractors, motorvehicles for the transport of ten or morepersons, motor cars and other motor vehiclesprincipally designed for the transport ofpersons, motor vehicles for the transport ofgoods and special purposes…
0,337 0,564 0,663
9401 Seats, whether or not convertible into beds,and parts thereof n.e.s. (excl. Medical,surgical, dental or veterinary of heading9402…
0,035 0,661 0,965
Source: ICEP
a) In 1994, this product is not within the main forty products. So, as the analysis has to bedone only at the level of the main forty products, we gave the value zero to that product in1994, however it does not correspond necessarily to its real value.

18
1995-1996
CODE PRODUCTS Ãi>>01995-1996
Bi>>0,51996
Ai>>0,51995-1996
0306 Crustaceans, fit for human consumption,whether in shell or not, live, fresh,chilled, frozen, dried, salted or in brine,incl. Crustaceans in shell cookedbeforehand by steaming or by boiling inwater; flours, meals and pellets ofcrustaceous…
0,127 0,873 0,873
0401 Milk and cream, not concentrated norcontaining added sugar or other sweeteningmatter…a)
0,331 0,669 0,669
8409 Parts suitable for use solely orprincipally with the engines of heading n84.07 or 84.08 …
0,128 0,744 0,872
6203 Men's or boys' suits, ensembles, jackets,blazers, trousers, bib and brace overalls,breeches and shorts (excl. Knitted orcrocheted, wind-jackets and similararticles, separate waistcoats, track suits,ski suits and swimwear)…
0,280 0,727 0,720
8419 Machinery, plant or laboratory equipmentwhether or not electrically heated, for thetreatment of materials by a processinvolving a change of temperature such asheating, cooking, roasting, distilling,rectifying, sterilizing, pasteurizin…
0,307 0,693 0,693
6205 Men's or boys' shirts (excl. Knitted orcrocheted, nightshirts, singlets and othervests)…a)
0,311 0,689 0,689
4411 Fibreboard of wood or other ligneousmaterials, whether or not agglomerated withresins or other organic bonding agents(excl. Particle board, whether or notbonded with one or more sheets offibreboard; laminated wood…
0,416 0,584 0,584
8527 Reception apparatus for radio-telephony,radio-telegraphy or radio-broadcasting,whether or not combined, in the samehousing, with sound recording orreproducing apparatus or a clock…a)
0,432 0,568 0,568
Source: ICEP
a) In 1995, this product is not within the main forty products. So, as the analysis has to bedone only at the level of the main forty products, we gave the value zero to that product in1995, however it does not correspond necessarily to its real value.

19
1996-1997CODE PRODUCTS Ãi>>0 Bi >0,5 Ai>0,5
1997-1996 1997 1997-19968703 Motor cars and other motor vehicles
principally designed for the transport ofpersons, including station wagons andracing cars (excl. Motor vehicles ofheading no 8702)…
0,235 0,52 0,765
8471 Automatic data processing machines andunits thereof; magnetic or opticalreaders, machines for transcribing dataonto data media in coded form and machinesfor processing such data n.e.s….
0,055 0,609 0,945
7210 Flat-rolled products of iron or non-alloysteel, of a width >= 600 mm, hot-rolled orcold-rolled 'cold-reduced', clad, platedor coated…
0,152 0,873 0,848
6203 Men's or boys' suits, ensembles, jackets,blazers, trousers, bib and brace overalls,breeches and shorts (excl. Knitted orcrocheted, wind-jackets and similararticles, separate waistcoats, tracksuits, ski suits and swimwear)…
0,226 0,729 0,774
6110 Jerseys, pullovers, cardigans, waistcoatsand similar articles, knitted or crocheted(excl. Wadded waistcoats)…
0,177 0,714 0,823
3904 Polymers of vinyl chloride or otherhalogenated olefins, in primary forms…
0,182 0,984 0,818
Source: ICEP

20
1997-1998
CODE PRODUCTSÃi>>0
1997-1998Bi>0,51998
Ai>>0,51997-1998
8419 Machinery, plant or laboratory equipmentwhether or not electrically heated, for thetreatment of materials by a processinvolving a change of temperature such asheating, cooking, roasting, distilling,rectifying, sterilizing, pasteurizin…a)
0,136 0,864 0,864
8708 Parts and accessories for tractors, motorvehicles for the transport of ten or morepersons, motor cars and other motor vehiclesprincipally designed for the transport ofpersons, motor vehicles for the transport ofgoods and special purposes…
0,250 0,520 0,750
8536 Electrical apparatus for switching orprotecting electrical circuits, or formaking connections to or in electricalcircuits -for example, switches, relays,fuses, surge suppressors, plugs, sockets,lamp-holders and junction boxes- for…
0,308 0,711 0,692
6109 T-shirts, singlets and other vests, knittedor crocheted…
0,436 0,506 0,564
Source: ICEP
a) In 1997, this product is not within the main forty products. So, as the analysis has to be done only atthe level of the main forty products, we gave the value zero to that product in 1997, however it does notcorrespond necessarily to its real value.
1998-1999
CODE PRODUCTSÃi>>0
1998-1999Bi>0,51999
Ai>>0,51998-1999
7214 Other bars and rods of iron or non-alloysteel, not further worked than forged, hot-rolled, hot-drawn or hot-extruded, but incl.Those twisted after rolling
0,422 0,879 0,578
6110 Jerseys, pullovers, cardigans, waistcoats andsimilar articles, knitted or crocheted (excl.Wadded waistcoats
0,142 0,842 0,858
Source: ICEP

21
References
Abed-el-Rahman, K.(1991). “Firms Competitive and National Comparative Advantages as JointDeterminants of Trade Composition”, Weltwirtschaftliches Archiv, Vol. 127, pp.83-97.
Aturupane, C., S. Djankov, and B. Hoekman (1999). “Horizontal and Vertical Intra-Industry Tradebetween Eastern Europe and the European Union”, Weltwirtschaftliches Archiv, Vol. 135, Nº1, pp.62-81.
Azhar, A., R Elliot, and C. Milner (1998).”Static and Dynamic Measurement of Intra-Industry Tradeand Adjustment: A Geometric Reappraisal”, Weltwirtschaftliches Archiv, Vol. 134, Nº3, pp.404-422.
Blanes, J.V. and C. Martin (2000). “The Nature and Causes of Intra-Industry Trade:Back to theComparative Advantage Explanation? The Case of Spain”. Weltwirtschaftliches Archiv , Vol. 136,Nº3, pp.423-441.
Brander, J. (1981).“Intra-industry Trade in Identical CommoditiesEconomics ,Vol. 11, pp.1-14.
Brander, J. and P. Krugman (1983). “A Reciprocal Dumping Model of International Trade”. Journal ofInternational Economics , Vol.13, pp.313-321.
Brulhart, M. (1994). “Marginal Intra-Industry Trade: Measurement and Relevance for the Pattern ofWeltwirtschaftliches Archiv, Vol. 130, pp. 600-613.
Brulhart, M., and R. Elliot. (1995). A Critical Survey of Trends in Intra-Industry Trade. WorkingPaper, Universidade de Coimbra.
Brulhart, M. (1998). “Trading Places: Industrial Specialization in the European Union” Journal ofCommon Market Studies, Vol. 36, Nº 3, pp.319-346.
Davis, D. R. (1995). “Intra-Industry Trade: A Heckscher-Ohlin-Ricardo Approach”. Journal ofInternational Economics , Vol.39, Nº3/4, pp. 201-226.
Davis, D., and D. Weinstein (1996). “Does Economic Geography Matter for InternationalSpecialization?” NBER Working Paper 5706, p. 61
Davis, D., D. Weintein, S. Bradford and K. Shimpo (1996). “The Heckscher-Ohlin-Vanek Model ofTrade: Why Does it Fail? When Does it WorK?”, NBER Working Paper 5625, p.77.
Davis, D., D. Weintein, S. Bradford and K. Shimpo (1997). “Using International and JapaneseRegional Data to Determine When the Factor Abundance Theory of Trade Works”, AmericanEconomic Review ,Vol.87, Nº3, pp. 421-446.
Davis, D., and D. Weinstein (2000). “Do Factor Endowments Matter for North-North Trade?presented at the International Economic Association Conference, Nottingham University, 7-8 July.
Eaton, J. and H. Kierzkowski (1984). “Oligopolistic Competition, Product Variety and Internationaled), pp.69-83.
Falvey, R. E. (1981). “Commercial Policy and Intra-Industry Trade”. Journal of InternationalEconomics , Vol. 11, Nº 4, pp. 495-511.
Falvey, R. and H. Kierzkowski (1984). “Product Quality, Intra-Industry Trade and (Im)PerfectCompetition” , Discussion Paper, Graduate Institute of International Studies, Geneva( or in H.Kierzkowski(ed.)(1987), pp.143-161.

22
Faustino, Horácio (1995).”O Cluster Europeu de Portugal em Termos de Comércio Intra- Sectorial eIntra-Comunitário: análise para o período 1983-1992”, Estudos de Economia ,Vol. XV, Nº 4, pp.391-428.
Faustino, Horácio (1996). “Comércio Intra-Sectorial e Vantagens Comparativas entre Portugal eEspanha para o Período 1983-1992”, Notas Económicas , Nº 7, pp. 66-68.
Faustino, H.J. Silva e R. Carvalho(2000) Testing Intra-Industry Trade Between Portugal and Spain1990-1996 , Working Paper, ISEG, Departamento de Economia, pp.20.
Flam, H. and E. Helpman (1987). “Vertical Product Differentiation and North-South Trade”. AmericanEconomi Review ,Vol. 77. pp. 810-822.
Girante, Maria (2000). O Modelo de Abundância Factorial: Aplicação ao caso da Região Norte . Tesede Mestrado, Universidade do Minho, p. 161
Greenaway, D., and C. Milner(1986). The Economics of Intra-Industry Trade .Basil Blackwell, NovaIorque, pp.207.
Greenaway, D. and P. Tharakan (eds) (1986). Imperfect Competition and International Trade ,Wheatsheaf Books, p. 242.
Greenaway, D., et al. (1994).Adjustment and the Measurement of Marginal Intra-Industry Trade.Weltwirtschaftliches Archiv, Vol. 130 pp.77-99.
Greenaway, D., R. Hine, and C. Milner(1994).Country-Specific Factors and the Pattern of Horizontaland Vertical Intra-Industry Trade in the UK. Weltwirtschaftliches Archiv, Vol.130, pp.77-100.
________________(1995).Vertical and Horizontal Intra-Industry Trade: A Cross Industry Analysis forthe United Kingdom. The Economic Journal , Vol. 105, Nº 433, pp.1505-1518.
Grubel, H., and P. Lloyd (1975). Intra-industry Trade. The Theory and Measurement of InternationalTrade in Differentiation Products, London, The Mcmillan Press.
Hamilton, C., and P. Kniest (1991).Trade Liberalisation, Structural Adjustment and Intra-IndustryTrade: A Note. Weltwirtschaftliches Archiv, Vol. 127, Nº 2, pp. 356-367.
Helpman, E. and P. Krugman (1985). Market Structure and Foreign Trade . Brighton, HarvesterWheatsheaf, p.271.
ICEP, Dados do Comércio Externo para o Período 1990-1999.
Kierzkowski, H. (ed) (1984) Monopolistic Competition and International Trade. Oxford: OxfordUniversity Press.
Kierzkowski, H.(ed.) (1987).Protection and Competition in International Trade. Essays in Honor ofW.M. Corden. Oxford: Basil Blackwell
Krugman, P.(1979).Increasing Returns, Monopolistic Competition, and International Trade. Journal ofInternational Economics ,Vol. 9(4), pp.469-480.____________(1980). Scale Economies, Product Differentiation, and the Pattern of Trade. AmericanEconomic Review, Vol. 70(December), pp. 950-959.
Lancaster, K.(1980).Intra-Industry Trade under Perfect Monopolistic Competition. Journal ofInternational Economics, Vol. 10 (May), pp.151-170.
Shaked, A. and J. Sutton (1984) “Natural oligopolies and international trade” in H. Kierzkowski(ed),pp.34-50 .

23
Tharakan, P. K. (1989). “Bilateral Intra-Industry Trade between Countries with Different FactorEndowment Patterns” in P. K. Tharakan, J. Kol (eds). Intra-Industry Trade. Theory, Evidence andExtensions, London: MacMillan Press , pp. 69-91.
Tharakan, P.K. and B. Kerstens (1995). “Does North-South Horizontal Intra-Industry Trade ReallyExist? An Analysis of the Toy Industry”. Weltwirtschaftliches Archiv , Vol.131, Nº1, pp. 86-105.
Thom, R., and M. McDowell (1999).Measuring Marginal Intra-Industry Trade. WeltwirtschaftlichesArchiv, Vol. 135, Nº 1, pp. 48-61.
Vanek, J. (1968). “The factor Proportions Theory: The N-Factor Case”, Kyklos, Vol. 21(4),pp.749-756.