The international role of the euro, July 2013 - European Central Bank
83
THE INTERNATIONAL ROLE OF THE EURO JULY 2013 EUROPEAN CENTRAL BANK THE INTERNATIONAL ROLE OF THE EURO JULY 2013
Transcript of The international role of the euro, July 2013 - European Central Bank

THE INTERNAT IONAL ROLE OF THE EUROJULY 2013
EURO
PEAN
CEN
TRAL
BAN
K
THE
INTE
RNAT
IONA
L RO
LE O
F TH
E EU
RO
JULY
201
3

THE INTERNATIONAL
ROLE OF THE EURO
JULY 2013
In 2013 all ECBpublications
feature a motiftaken from
the €5 banknote.

© European Central Bank, 2013
Address Kaiserstrasse 29
60311 Frankfurt am Main
Germany
Postal address Postfach 16 03 19
60066 Frankfurt am Main
Germany
Telephone +49 69 1344 0
Website http://www.ecb.europa.eu
Fax +49 69 1344 6000
All rights reserved. Reproduction for educational and non-commercial purposes is permitted provided that the source is acknowledged.
As at 31 May 2013
ISBN 978-92-899-1018-7 (print)
ISBN 978-92-899-1019-4 (epub)
ISBN 978-92-899-1017-0 (online)
ISSN 1725-2210 (print)
ISSN 1725-6593 (epub)
ISSN 1725-6593 (online)
EU Catalogue Number QB-XN-13-001-EN-C (print)
EU Catalogue Number QB-XN-13-001-EN-E (epub)
EU Catalogue Number QB-XN-13-001-EN-N (online)

3ECB
The international role of the euro
July 2013
CONTENTS
ABBREVIATIONS 5
FOREWORD 6
1 INTRODUCTION 7
2 MAIN FINDINGS 8
3 PRICE-BASED INDICATORS AND EURO AREA CAPITAL FLOWS 11
3.1 Price-based indicators 11
Box 1 The evolution of market uncertainty surrounding the euro exchange rate 13
3.2 Euro area capital fl ows and foreign demand for euro area assets 15
Box 2 Capital fl ows to stressed and non-stressed euro area countries 16
4 RECENT DEVELOPMENTS IN THE INTERNATIONAL USE OF THE EURO 19
4.1 The euro in global foreign exchange reserves and exchange rate anchoring 19
Box 3 The accumulation of euro-denominated reserves by the Swiss National Bank 21
4.2 The euro in international debt markets 22
4.3 The euro as a parallel currency 23
4.4 The euro in other market segments 27
4.5 Results from the OeNB Euro Survey of households in central, eastern
and south-eastern Europe 29
SPECIAL FEATURES
A GLOBAL SAFE ASSET SHORTAGE, NON-TRADITIONAL RESERVE CURRENCIES AND THE GLOBAL
FINANCIAL CRISIS 34
1 Introduction 34
2 Stylised facts on the emergence of non-traditional reserve currencies 35
3 Determinants of international reserve currency status 36
4 Empirical estimates 38
5 Concluding remarks 41
B THE EMERGENCE OF THE CHINESE RENMINBI AS AN INTERNATIONAL CURRENCY 44
1 Introduction 44
2 Recent developments in the international use of the Chinese renminbi 44
3 Determinants of the growing international use of the renminbi 46
4 Challenges related to the internationalisation of the renminbi 49
5 Implications of the rise of the renminbi for the international monetary system 50
6 Conclusion 51

4ECB
The international role of the euro
July 20134
C HISTORY, GRAVITY AND INTERNATIONAL FINANCE 55
1 Introduction 55
2 Theoretical motivations 56
3 Empirical estimates 57
4 Concluding remarks 60
STATISTICAL ANNEX
1 The euro in global foreign exchange reserves and exchange rate anchoring 64
2 The euro in international debt markets 68
3 The euro in international loan and deposit markets 76
4 The euro in international trade in goods and services 78
5 The euro as a parallel currency: the use of euro-denominated bank loans
and deposits in countries outside the euro area 81

5ECB
The international role of the euro
July 2013 5
ABBREVIAT IONS
BIS Bank for International Settlements
CESEE central, eastern and south-eastern Europe
CHF Swiss franc
CLS continuous linked settlement
CNY Chinese renminbi
COFER currency composition of foreign exchange reserves
EA euro area
ECB European Central Bank
ERM II exchange rate mechanism II
ESCB European System of Central Banks
EU European Union
EUR euro
GBP pound sterling
i.i.p. international investment position
IMF International Monetary Fund
JPY Japanese yen
MFI monetary financial institution
NEER nominal effective exchange rate
OeNB Oesterreichische Nationalbank
OMTs Outright Monetary Transactions
OMS other Member States
SEK Swedish krona
ULCT unit labour costs of the total economy
USD US dollar
ABBREVIATIONS

6ECB
The international role of the euro
July 20136
FOREWORD
This is the 12th annual review of the international role of the euro published by the ECB. It
presents the main findings of the continued monitoring and analysis conducted by the ECB and the
Eurosystem as regards the development, determinants and implications of the use of the euro by
non-euro area residents.
This review finds that in 2012 the euro area sovereign debt crisis continued to weigh on the
international use of the euro, which declined moderately in some market segments. The persistent
fragmentation of the euro area financial system is one of the main underlying causes of these
developments, as it affects the depth and liquidity of euro area capital markets. Several policy
measures taken at both the European and the national level started to reduce the degree of financial
fragmentation in the latter part of 2012. Some survey indicators signal a tentative turnaround as
regards the international role of the euro in market segments that had previously witnessed some
decline.
This review also examines in greater depth issues that have a bearing on the euro’s international
role and the global currency order, including prospects for non-traditional reserve currencies and
a multi-polar international monetary system. This analysis is presented in the form of three special
features.
The international role of the euro is primarily determined by market forces, and the Eurosystem
neither hinders nor promotes the international use of the euro. At the same time, the ECB will
continue to monitor developments and disseminate information with respect to the international
role of the euro on a regular basis.
Mario Draghi
President of the European Central Bank

7ECB
The international role of the euro
July 2013
1 INTRODUCTION
This report reviews developments in the international role of the euro in 2012, tracking a
comprehensive set of indicators covering a number of different market segments. As in previous
issues, the main focus is on measures of the euro’s relevance in financial markets, such as the use
of the euro in foreign exchange reserves or in debt securities markets. In addition, this issue of the
report includes a chapter on price-based measures, which may provide a better understanding of the
international use of the euro.
The first part of the review continues to provide high-quality and timely data as well as an
analysis of the changes during the period under review. The Statistical Annex contains historical
time series for many key data for use by academic researchers, professionals and the general
public. Where relevant, the review removes exchange rate-related valuation effects by showing
statistical time series at constant exchange rates, so as to facilitate comparisons over time. Data
are compiled by the ECB and the national central banks of the Eurosystem, also drawing on data
available from international financial institutions such as the Bank for International Settlements
and the International Monetary Fund. The report also presents survey-based evidence prepared by
the Oesterreichische Nationalbank looking at the use of the euro as a parallel currency in central,
eastern and south-eastern Europe.
The second part of the review offers an in-depth analysis of issues that have a bearing on the
international role of the euro and the international monetary system. This year, this second part
contains three special features: an analysis of global safe asset shortages as evidenced by the
gradually rising use of non-traditional reserve currencies since the start of the crisis; a stock-taking of
recent developments and prospects regarding the international use of the Chinese renminbi; and an
analysis shedding light on long-term persistence effects in international financial investment patterns.

8ECB
The international role of the euro
July 2013
2 MAIN FINDINGS
DEVELOPMENTS IN THE INTERNATIONAL ROLE OF THE EURO IN 2012
In 2012 the euro area crisis continued to weigh on the international use of the euro, which declined
moderately in some market segments.
The persistent fragmentation of the euro area financial system is one of the main underlying causes
of these developments, as it affects the depth and liquidity of euro area capital markets.
Nevertheless, some survey indicators point to some improvements as regards the international
use of the euro during the second half of 2012. These improvements were supported by several
policy measures taken at the European level which demonstrated the strength of cohesion within
Europe. In particular, the decision in June 2012 by European leaders to create a single supervisory
mechanism and the announcement by the ECB on Outright Monetary Transactions (OMTs) helped
to mitigate market concerns about the possible materialisation of tail risks. Furthermore, policies at
the national level, such as the restructuring of the Spanish banking system and the success of the
Greek debt buy-back operation, helped to restore market confidence towards the end of the period
covered by the review, i.e. essentially 2012. However, further efforts are needed both at the euro
area and the national level to tackle the fundamental causes of the financial fragmentation in the
euro area, and a strengthening of the institutional framework of Economic and Monetary Union will
also make a positive contribution to this end.
In addition to these factors related to the euro area crisis, some global developments, which
might prove to be more long-lived, also affected the international role of the euro. For example,
the rising importance of non-traditional reserve currencies may reflect, to some extent, concerns
related to high public debt burdens among traditional issuers of reserve currencies, which need to
be addressed.
In 2012 the financial account of the euro area remained relatively balanced, as also mirrored in
a relatively stable exchange rate of the euro. The depreciation of the euro exchange rate from
April 2012 until the end of July 2012 was largely related to a deteriorating economic outlook for
the euro area and market concerns about the possible materialisation of tail risks. The euro then
appreciated until January 2013, largely owing to positive confidence effects stemming from the
announcement on OMTs. From February 2013, a moderate depreciation of the euro was followed
by a period of relative stability.
The share of the euro in globally disclosed foreign exchange reserves declined in 2012 by around
1 percentage point (see Table 1). Survey evidence suggests that concerns among foreign reserve
managers related to the euro area sovereign debt crisis had been alleviated by early 2013, however.
Among emerging and developing countries, some portfolio rebalancing occurred; this led to the
weight of the euro in emerging market reserves being aligned more closely with that in total global
reserves for which the currency composition is known. Overall, these developments suggest that
the US dollar and the euro, as the second-most important reserve currency, continued to perform
their function as a credible store of value for foreign central banks.
In international debt markets, the share of the euro declined somewhat in 2012 (see Table 1) as
tensions in the euro area sovereign debt market possibly dented the appetite for new international
debt issuance denominated in euro. Funding cost considerations continued to favour issuance of
debt securities denominated in US dollars, rather than issuance denominated in euro.

9
2 MAIN F INDINGS
9ECB
The international role of the euro
July 2013 9
Regarding currency substitution in 2012, statistics on net shipments of euro banknotes to
destinations outside the euro area suggest that foreign demand for euro banknotes increased further
in 2012 (see Table 1). This implies that the intensification of the euro area sovereign debt crisis in
the second half of 2011 did not have a major impact on the use of euro banknotes outside the euro
area.
With respect to the use of the euro as a parallel currency in central, eastern and south-eastern
European (CESEE) countries, the euro’s share in total foreign deposits remained unchanged on
average (see Table 1). Evidence from household surveys in the region provided by the OeNB
Table 1 Key data on the international role of the euro
Share of the euro (percentages, unless otherwise indicated)
Total outstanding amounts
Indicator Latest Comparison period
Difference (percentage
points)
Latest Comparison period
Unit Difference (percentages)
Stock of global foreign exchange reserves with known currency
composition, at constant exchange rates 23.9 25.1 -1.2 10,936 10,202 USD
billions
7.2(Q4 2012) (Q4 2011) (Q4 2012) (Q4 2011)
International debt securities: narrow measure, i.e. including home curency
issuance, at constant exchange rates 25.5 26.2 -0.7 11,893 10,885 USD
billions
9.3(Q4 2012) (Q4 2011) (Q4 2012) (Q4 2011)
Daily foreign exchange trading (settled by CLS), annual averages,
at current exchange rates, volumes
in EUR billion 19.6 19.6 0.0 3,689 3,455 EUR
billions
6.8(2012) (2011) (2012) (2011)
Foreign currency-denominated loans in CESEE countries, as a percentage
of total foreign currency loans,
at current exchange rates 82.2 81.7 0.5 293.2 300.9 EUR
billions
-2.5(2012) (2011) (2012) (2011)
Foreign currency-denominated deposits in CESEE countries, as a
percentage of total foreign currency
deposits, at current exchange rates 80.9 81.1 -0.3 188.85 175.13 EUR
billions
7.8(2012) (2011) (2012) (2011)
Invoicing of goods exported from the
euro area to non-euro area countries,
at current exchange rates 62.5 64.9 -2.4 … … …
(2012) (2011) … … …
Invoicing of goods imported to the
euro area from non-euro area countries,
at current exchange rates 49.0 49.8 -0.8 … … …
(2012) (2011) … … …
Foreign holdings of euro area debt denominated in euro (as percentage
of total euro-denominated debt) 17.3 17.6 -0.3 14,884 14,427 EUR
billions
3.2(H1 2012) (H1 2011) (H1 2011) (H1 2010)
Cumulative net shipments of euro banknotes to destinations outside the
euro area (not seasonally adjusted) … … … 131 118 EUR
billions
11.0… … … (Dec. 2012) (Dec. 2011)
Sources: BIS, IMF, national sources and ECB calculations.

10ECB
The international role of the euro
July 201310
confirms that trust in the euro in CESEE countries, which decreased in spring 2012, recovered in the
autumn of that year. As a result, the euro remained the most widespread currency of denomination
for foreign currency deposits and continued to be regarded as a more reliable store of value than
most local currencies.
MAIN FINDINGS OF THE SPECIAL FEATURES
The first special feature reviews key developments regarding the emergence of non-traditional
reserve currencies, such as the Australian dollar and the Canadian dollar, as well as the determinants
of their growing importance since the outbreak of the global financial crisis. It shows that non-
traditional reserve currency issuers have a track record of rapid and resilient growth, price stability
and sound public finances. Higher risk aversion in foreign exchange markets and perceptions
of heightened credit risk for some advanced economy sovereigns are shown to be two possible
determinants of their recent ascent. A lack of large, deep and liquid financial markets limits the
potential of non-traditional currencies to become truly major reserve units, however. In addition,
their growing use might be dampened if market conditions normalise and ambitious and credible
medium-term fiscal consolidation plans are introduced and implemented by all major advanced
economy sovereigns.
The second special feature article takes stock of recent developments in the international use of
the Chinese renminbi. It shows that China’s growing weight in global output and trade, together
with policy measures taken by the Chinese authorities, have led to an increasing use of the Chinese
currency in international trade and, to a lesser extent, international financial markets. However,
the lack of sufficiently deep and liquid domestic financial markets, tight financial restrictions,
remaining capital controls and insufficient exchange rate flexibility hamper the development of the
international use of the renminbi, notably as a reserve currency. It is nevertheless conceivable that
the renminbi could play an increasingly prominent role to the extent that the Chinese authorities
continue to gradually address these challenges.
The third special feature sheds light on one manifestation of inertia in the international financial
system and on the potential sources thereof using unique data on foreign bond holdings of US
investors in the early 1940s. It documents a “history effect” whereby the pattern of holdings seven
decades ago continues to influence holdings today. Up to 15% of the cross-country variation in US
holdings of foreign bonds in 2010 is explained by holdings 70 years ago, against 30% for bonds
denominated in currencies other than the dollar. This plausibly reflects the existence of sunk costs
in international financial investment, together with endogenous learning effects, i.e. the propensity
of international investors to continue to invest disproportionally in assets which they have already
invested in and are accustomed to.

11ECB
The international role of the euro
July 2013
3 PRICE-BASED INDICATORS AND EURO AREA CAPITAL FLOWS
3.1 PRICE-BASED INDICATORS
3.1.1 DEVELOPMENTS IN THE EXCHANGE RATE OF THE EURO
The nominal effective exchange rate of the euro has gone through three distinct phases since the
start of 2012. First, the euro went through a period of weakness between April and July 2012,
when the nominal effective exchange rate index of the euro against 20 main trading partners
(NEER-20) depreciated by around 5%. This depreciation was mainly driven by a deterioration
in the euro area economic outlook and by renewed tensions in euro area sovereign debt markets,
largely reflecting unfounded fears about the reversibility of the euro, and characterised by widening
government bond spreads across euro area countries (see below). The euro then entered a phase
of broad appreciation between August 2012 and February 2013, with the index rising by more
than 6%. This upward movement was initially supported by several factors. The announcement of
the Eurosystem’s Outright Monetary Transactions (OMTs) and the temporary improvement in the
euro area’s economic outlook exerted a positive confidence effect and led to a decrease in market
uncertainty about the medium-term path of the euro exchange rate (see Box 1). Finally, in the third
phase, after having peaked in February 2013, the euro exchange rate depreciated slightly by around
1% up to May 2013 (Chart 1).
In bilateral terms vis-à-vis major trading partners, the euro appreciated against the Japanese yen
by more than 13% in 2012, by far the largest bilateral movement over the year. The euro also
appreciated against the US dollar, by 2%, and against the Chinese renminbi (which fluctuates within
a pre-defined moving band against the US
dollar), by less than 1%. By contrast, the euro
depreciated by more than 2% against the pound
sterling and by around 4%, on average, against
the currencies of the other EU Member States
that are not part of the euro area (Chart 2a).
Between the beginning of 2013 and end-May,
the euro declined by 1.4% against the US dollar,
while it appreciated by 4.6% against the pound
sterling (Chart 2b). Notably, the euro continued
to appreciate, by a further 15%, against the
Japanese yen, a development that was largely
driven by the announcement of quantitative
and qualitative easing by the Bank of Japan,
which led to higher inflation expectations and
lower real interest rates in Japan and a general
depreciation of the yen.
The realised volatility of the euro exchange
rate – measured as the standard deviation of
daily returns against the currencies of the main
trading partners – declined in the course of 2012.
In particular, the volatility of the euro exchange
Chart 1 Euro nominal effective exchange rate and bilateral rate against the US dollar
(US dollar per euro; index, daily)
92
94
96
98
100
102
104
1.20
1.22
1.24
1.26
1.28
1.30
1.32
1.34
1.36
1.38
1.40
Jan. Apr. July Oct. Jan. Apr.
2012 2013
USD/EUR (left-hand scale)
NEER-20 (right-hand scale)
Source: ECB.Notes: The NEER-20 is the nominal effective exchange rate of the euro against 20 main trading partners of the euro area. An upward movement of the index indicates an appreciation of the euro. The latest observation is for 31 May 2013.

12ECB
The international role of the euro
July 201312
Chart 2 Changes in selected bilateral exchange rates and euro nominal effective exchange rate
(percentages)
a) 1 January 2012 – 31 December 2012 b) 1 January 2013 – 31 May 2013
2.0
-2.3
13.4
0.8
-0.7
-3.7 -4.0-3.3
-0.4
-5
0
5
10
15
-5
0
5
10
15
USD GBP JPY CNY CHF SEK OMS Other NEER-20
-5
0
5
10
15
-5
0
5
10
15
USD GBP JPY CNY CHF SEK OMS Other NEER-20
-1.4
4.6
-2.9
2.8
0.0
2.23.0
1.8
14.8
Source: ECB.Notes: The category “other Member States” (OMS) refers to the aggregate contribution of the currencies of the non-euro area EU Member States (except the pound sterling and the Swedish krona). The category “Other” refers to the aggregate contribution of the currencies of the remaining six trading partners of the euro area included in the NEER-20 index. The latest observation is for 31 May 2013.
Chart 3 Realised volatility of the euro exchange rate since 1999
(standard deviation of daily returns; percentages)
0.0
0.2
0.4
0.6
0.8
1.0
1.2
0.0
0.2
0.4
0.6
0.8
1.0
1.2
USD/EUR GBP/EUR JPY/EUR NEER-20
1999-2007
2008-2011
2012
January-May
Source: ECB.Note: The latest observation is for 31 May 2013.
Chart 4 Euro nominal and real effective exchange rates (EER-20)
(quarterly data; index: average since 1999=100)
80
85
90
95
100
105
110
115
80
85
90
95
100
105
110
115
1999 2001 2003 2005 2007 2009 2011 2013
nominal
real, CPI-deflated
real, ULCT-deflated
Source: ECB.Notes: An upward movement of the EER-20 indices represents an appreciation of the euro. “ULCT” stands for unit labour costs of the total economy. The latest observation for “real, ULCT-defl ated” is for the fourth quarter of 2012.
13ECB
The international role of the euro
July 2013 13
3 PRICE-BASED INDICATORS
AND EURO AREA CAPITAL FLOWS
13
rate was significantly lower than the level prevailing in 2008-11, during a period of rising global
risk aversion, and returned to levels close to those recorded before the financial crisis. However,
the first few months of 2013 were characterised by an increase in euro exchange rate volatility, in
particular in the bilateral rates of the euro against the Japanese yen and the pound sterling (Chart 3).
Finally, taking a longer-term perspective, in the first quarter of 2013, the euro remained very close
to the average levels recorded since 1999, in nominal and real (when deflated by the CPI) effective
terms (see Chart 4). When deflated by the unit labour costs of the total economy, as at the fourth
quarter of 2012, the real exchange rate of the euro is slightly below (by around 4 to 5 percentage
points) the long-run average.
Box 1
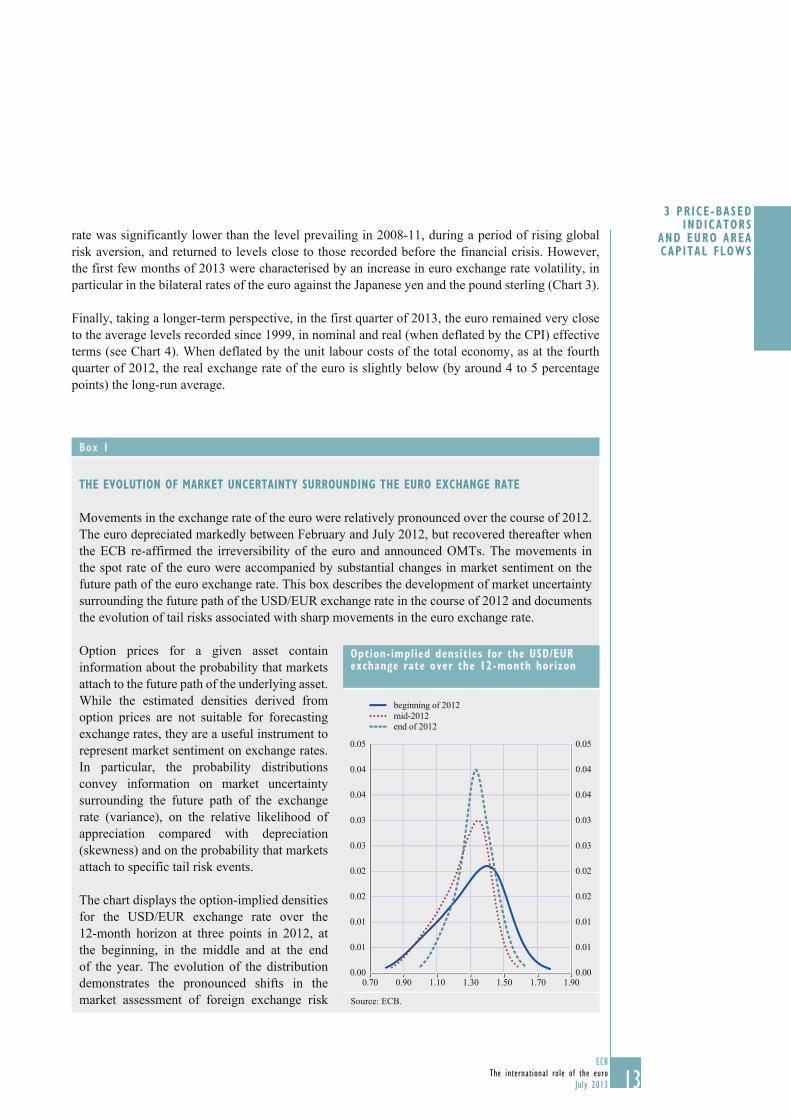
THE EVOLUTION OF MARKET UNCERTAINTY SURROUNDING THE EURO EXCHANGE RATE
Movements in the exchange rate of the euro were relatively pronounced over the course of 2012.
The euro depreciated markedly between February and July 2012, but recovered thereafter when
the ECB re-affirmed the irreversibility of the euro and announced OMTs. The movements in
the spot rate of the euro were accompanied by substantial changes in market sentiment on the
future path of the euro exchange rate. This box describes the development of market uncertainty
surrounding the future path of the USD/EUR exchange rate in the course of 2012 and documents
the evolution of tail risks associated with sharp movements in the euro exchange rate.
Option prices for a given asset contain
information about the probability that markets
attach to the future path of the underlying asset.
While the estimated densities derived from
option prices are not suitable for forecasting
exchange rates, they are a useful instrument to
represent market sentiment on exchange rates.
In particular, the probability distributions
convey information on market uncertainty
surrounding the future path of the exchange
rate (variance), on the relative likelihood of
appreciation compared with depreciation
(skewness) and on the probability that markets
attach to specific tail risk events.
The chart displays the option-implied densities
for the USD/EUR exchange rate over the
12-month horizon at three points in 2012, at
the beginning, in the middle and at the end
of the year. The evolution of the distribution
demonstrates the pronounced shifts in the
market assessment of foreign exchange risk
Option-implied densities for the USD/EUR exchange rate over the 12-month horizon
0.00
0.01
0.01
0.02
0.02
0.03
0.03
0.04
0.04
0.05
0.00
0.01
0.01
0.02
0.02
0.03
0.03
0.04
0.04
0.05
0.70 0.90 1.10 1.30 1.50 1.70 1.90
beginning of 2012
mid-2012
end of 2012
Source: ECB.

14ECB
The international role of the euro
July 20131414
3.1.2 BOND YIELDS OF EURO AREA ISSUERS
On average the bond yields of euro area issuers remained relatively stable throughout 2012.
However, the divergence of bond yields across different euro area issuers increased during the
first half of the year (see Chart 5) as euro area sovereign bond markets continued to experience
severe tensions and a significant degree of segmentation. These developments were the result of
several factors: while sovereign bond yields of
countries under financial stress rose owing to
increasing concerns with respect to sovereign
risk and its interaction with banking sector risks,
the search for safe assets caused a decrease in
yields in other Member States, deepening the
divide in market conditions across euro area
countries. In addition, a divergence in terms of
market liquidity – which dried up in the case
of sovereign bonds issued by stressed countries
and increased in the case of other Member States
as investors searched also for liquidity during
times of financial stress – also contributed to
the divergence in sovereign bond yields in the
euro area.1 As a result of these developments,
the dispersion of sovereign bond yields across
Member States increased to levels comparable
with or exceeding those prevailing in the mid-
1990s (ECB, 2013). After the announcement
of OMTs and a clear commitment by European
leaders to a single supervisory mechanism,
sovereign yields declined in distressed
countries, especially in the countries where
they had increased the most in the preceding
months, whereas they increased slightly in
non-distressed countries.
1 Liquidity risk premia can be isolated for example by comparing agency bonds with sovereign bonds (see ECB, 2013).
in the course of 2012. Three main observations can be made. First, general market uncertainty
about the medium-term path of the euro exchange rate decreased sharply in the course of 2012.
In late 2012, the variance of the distribution was approximately half and one-third the size of that
observed in mid-2012 and early 2012 respectively. Second, the gradual reduction in investors’
uncertainty was accompanied by a pronounced decline in the tail risks associated with sharp
movements in the euro exchange rate. The likelihood attached to a 20% drop in the euro exchange
rate vis-à-vis the US dollar over the 12-month horizon decreased from 10.5% at the beginning
of 2012 to 7% and 1.5% in mid- and late 2012 respectively. Finally, in contrast to general levels
of exchange rate uncertainty, which decreased continuously in the course of 2012, the negative
skewness of the distribution peaked in mid-2012 at the height of the euro area sovereign debt
crisis. In July market participants attached a markedly higher likelihood to euro depreciation than
to appreciation. Following the announcement of the OMT modalities, this skewness gradually
declined, with the option-implied density being broadly balanced at the end of 2012.
Chart 5 Sovereign bond yields in the euro area
(percentages)
0
2
4
6
8
10
12
14
16
18
0
2
4
6
8
10
12
14
16
18
2007 2008 2009 2010 2011 2012
min-max range
average non-distressed
average distressed
Sources: Bloomberg and ECB calculations.Notes: “Non-distressed” countries comprise Germany, Austria, Belgium, Finland, France and the Netherlands. “Distressed” countries comprise Spain, Italy, Portugal and Ireland. The yields for Cyprus, Estonia, Greece, Luxembourg, Malta, Slovakia and Slovenia are excluded owing to infrequent or missing observations. The latest observation is for 31 May 2013.

15ECB
The international role of the euro
July 2013 15
3 PRICE-BASED INDICATORS
AND EURO AREA CAPITAL FLOWS
15
In the euro area corporate bond market, yields for lower-rated financial institutions also rose during
the first half of 2012, reflecting to a large extent concerns about an adverse feedback loop between
sovereign and banking sector risk in some Member States (see Chart 6). At the same time, euro area
companies with high ratings benefited from low funding costs, similar to those enjoyed by euro
area sovereigns with high ratings. The improved market sentiment in sovereign bond markets since
July 2012 extended to bonds issued by lower-rated financial institutions as the announcement of
OMTs provided a credible backstop for sovereign risk and the commitment of euro area leaders to
form a single bank supervisor within the ECB sent a strong signal of cohesion.
3.2 EURO AREA CAPITAL FLOWS AND FOREIGN DEMAND FOR EURO AREA ASSETS
The financial account of the euro area balance of payments remained in 2012 relatively balanced
(see Chart 7). However, these developments mask significant cross-country divergence in the euro
area, with significant private capital outflows from stressed countries coming to a halt only at the
end of 2012 (see Box 2).
Chart 6 Five-year euro corporate bond yields
(percentages)
0
1
2
3
4
5
6
7
0
1
2
3
4
5
6
7
Jan. July Jan. July Jan.
AA – composite euro
BBB – composite euro
AA – Europe financials
BBB – Europe financials
2011 2012 2013
Source: Bloomberg.Note: The last observation is for 31 May 2013.
Chart 7 Euro area financial account
(three-month cumulated fl ows; as a percentage of euro area GDP)
-10
-8
-6
-4
-2
0
2
4
6
8
10
-10
-8
-6
-4
-2
0
2
4
6
8
10
2008 2009 2010 2011 2012
direct investment
portfolio investment
other investment
net financial account
Source: ECB.Note: The latest observation is for March 2013.

16ECB
The international role of the euro
July 20131616
Box 2
CAPITAL FLOWS TO STRESSED AND NON-STRESSED EURO AREA COUNTRIES
This box analyses developments in private capital flows 1 for two groups of euro area countries:
“stressed” euro area countries (comprising Greece, Portugal, Spain, Ireland, Cyprus, Italy and
Slovenia for the purposes of this box) and “other” euro area countries. The financial account data
of the national balance of payments 2 are used for this purpose.
After a short-lived resumption of private capital inflows to stressed countries in mid-2011, these
turned into outflows in the second half of the year as the sovereign debt crisis in the euro area –
which had spread to the larger economies Spain and Italy – intensified. The magnitude of this
reversal was thus considerable, with outflows reaching as much as 23% of GDP by mid-2012.
Capital outflows took the form of both portfolio investment (mainly reflecting a reduction in
exposure to government debt securities) and other investment (representing deposit flight from
stressed countries). At the same time, other euro area countries recorded considerable inflows
of private funds from the beginning of 2012. Outflows of private capital from stressed countries
were compensated for by an increase in official capital flows, including the provision of liquidity
by the Eurosystem which was reflected in an increase in TARGET2 balances. This together
1 Capital flows are estimated as net cross-border financial flows excluding Eurosystem financing via the TARGET2 system and
excluding EU-IMF programme-led funding. Official capital flows also include ECB sovereign debt purchases under the Securities
Markets Programme (SMP), for which separate data are not available.
2 Net private capital flows are estimated for the purposes of this analysis as the sum of net transactions in foreign direct investment,
portfolio investment and other investment, excluding net other investment transactions of monetary authorities (which stands for
TARGET2 financing) and excluding other investment transactions in liabilities of general government (which stands for EU-IMF
financing).
Chart B Net private financial flows to other euro area countries
(four-quarter sums; as a percentage of GDP)
-10
-8
-6
-4
-2
0
2
4
6
8
-10
-8
-6
-4
-2
0
2
4
6
8
20062005 2007 2008 2009 2010 2011 2012
foreign direct investment
portfolio investment
private other investment
net private financial flows
Source: ECB.
Chart A Net private financial flows to stressed euro area countries
(four-quarter sums; as a percentage of GDP)
-25
-20
-15
-10
-5
0
5
10
15
-25
-20
-15
-10
-5
0
5
10
15
2005 2006 2007 2008 2009 2010 2011 2012
foreign direct investment
portfolio investment
private other investment
net private financial flows
Source: ECB.

17ECB
The international role of the euro
July 2013 17
3 PRICE-BASED INDICATORS
AND EURO AREA CAPITAL FLOWS
17
For the euro area as a whole, capital outflows in 2012 amounted to €133 billion. These outflows
mainly reflected net sales of other investment, which amounted to €132 billion, and of foreign
direct investment, which made a contribution of €45 billion. These outflows were only partly offset
by a cumulated portfolio investment inflow to the euro area of €52 billion.
On the liability side, temporary portfolio outflows by foreign residents were halted and reversed
in early 2012 (see Chart 8). Net portfolio investment flows to the euro area from non-residents
peaked in the final quarter of 2012, largely related to the gradual reduction in perceived euro area
tail risks in the second half of 2012.
In terms of asset allocation across portfolio investment classes, portfolio inflows from foreign
investors in early 2012 were primarily driven by net purchases of euro area equities, while net
acquisitions of euro area bonds did not turn
positive until mid-2012 (see Chart 8). The fact
that foreign inflows in euro area equities and
bonds remained positive in summer 2012 shows
that foreign residents largely refrained from
repatriating such longer-term investments.
Foreign investors did, however, temporarily
sell short-term money market instruments in
mid-2012.
Further evidence of a return in market
confidence in euro area assets is provided
by an analysis of the asset allocation of US
money market funds, which account for a
considerable share of the dollar funding of
euro area banks. According to a survey by
Fitch Ratings, the share of short-term financial
instruments issued by euro area banks in total
assets under management of prime US money
market funds increased somewhat in early 2012
from the historically low levels reached at the
end of 2011 (see Chart 9). Following renewed
concerns related to tail risks for the euro area,
Chart 8 Euro area portfolio investment liabilities by instrument
(three-month cumulated fl ows; as a percentage of GDP)
-6
-4
-2
0
2
4
6
8
-8
-6
-4
-2
0
2
4
6
8
-82008 2009 2010 2011 2012
equity securities
bonds and notes
money market instruments
Source: ECB.Note: The latest observation is for March 2013.
with EU-IMF financing mitigated the outflow of private capital and contributed to a gradual
rebalancing of the affected economies.3
Following – inter alia – the announcement of OMTs in September 2012 and other policy
measures taken at the European and at the national level, private funds (in the form of portfolio
investment) returned to stressed countries over the last four months of 2012. As suggested by
the reduction in the size of other investment liabilities of stressed countries’ central banks and
the concomitant decrease in the respective claims of other countries’ central banks, TARGET2
balances have fallen from their peak in mid-2012, reflecting reduced funding pressure amid the
first signs of a normalisation in financial market conditions.
3 It should be noted that the estimate of private capital inflows to stressed countries is on the high side since it is not possible to separate
out sovereign debt purchases in the framework of the SMP.

18ECB
The international role of the euro
July 20131818
this share dropped to a historical low of 8.2% in June 2012. The share of short-term debt instruments
issued by euro area banks recovered thereafter following – inter alia – the announcement of OMTs
in September 2012, reaching 15.2% in April 2013, following a temporary drop in March 2013.
At the same time, the share of US government securities in total assets under management of US
money market funds, which had increased steadily since early 2011, peaked in August 2012 and
decreased to 26.6% in April 2013.
Chart 9 Asset allocation of prime US money market funds
(as a percentage of total assets under management)
0
5
10
15
20
25
30
35
40
0
5
10
15
20
25
30
35
40
Feb. Apr. June Aug. Oct. Dec. Feb. Apr. June Aug. Oct. Dec. Feb. Apr.2011 2012 2013
short-term instruments issued by euro area banks
US government securities
Source: Fitch Ratings.Notes: Prime money market funds participating in the survey include the ten largest US money market funds. Short-term instruments issued by euro area banks include certifi cates of deposit, commercial paper, repos and other instruments. US government securities include Treasury and agency bonds as well as repos collateralised by such bonds. The latest observation is for April 2013.
19ECB
The international role of the euro
July 2013
4 RECENT DEVELOPMENTS IN THE INTERNATIONAL USE OF THE EURO
4.1 THE EURO IN GLOBAL FOREIGN EXCHANGE RESERVES AND EXCHANGE RATE ANCHORING
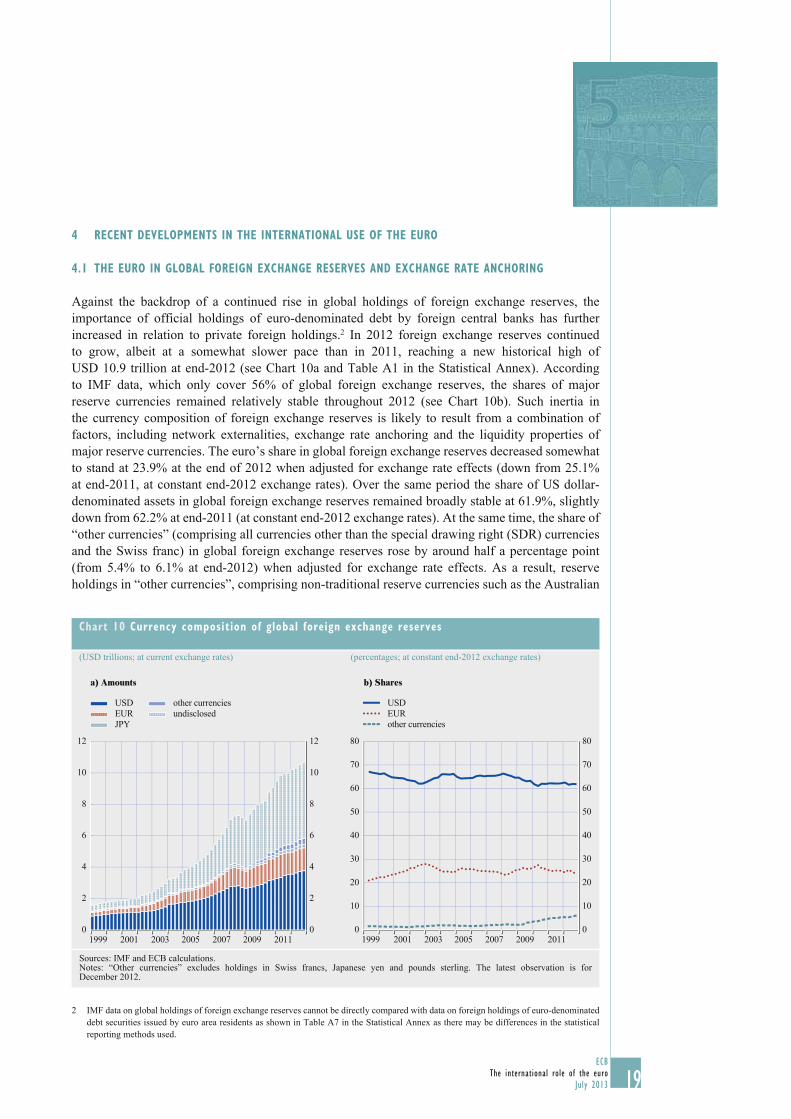
Against the backdrop of a continued rise in global holdings of foreign exchange reserves, the
importance of official holdings of euro-denominated debt by foreign central banks has further
increased in relation to private foreign holdings.2 In 2012 foreign exchange reserves continued
to grow, albeit at a somewhat slower pace than in 2011, reaching a new historical high of
USD 10.9 trillion at end-2012 (see Chart 10a and Table A1 in the Statistical Annex). According
to IMF data, which only cover 56% of global foreign exchange reserves, the shares of major
reserve currencies remained relatively stable throughout 2012 (see Chart 10b). Such inertia in
the currency composition of foreign exchange reserves is likely to result from a combination of
factors, including network externalities, exchange rate anchoring and the liquidity properties of
major reserve currencies. The euro’s share in global foreign exchange reserves decreased somewhat
to stand at 23.9% at the end of 2012 when adjusted for exchange rate effects (down from 25.1%
at end-2011, at constant end-2012 exchange rates). Over the same period the share of US dollar-
denominated assets in global foreign exchange reserves remained broadly stable at 61.9%, slightly
down from 62.2% at end-2011 (at constant end-2012 exchange rates). At the same time, the share of
“other currencies” (comprising all currencies other than the special drawing right (SDR) currencies
and the Swiss franc) in global foreign exchange reserves rose by around half a percentage point
(from 5.4% to 6.1% at end-2012) when adjusted for exchange rate effects. As a result, reserve
holdings in “other currencies”, comprising non-traditional reserve currencies such as the Australian
2 IMF data on global holdings of foreign exchange reserves cannot be directly compared with data on foreign holdings of euro-denominated
debt securities issued by euro area residents as shown in Table A7 in the Statistical Annex as there may be differences in the statistical
reporting methods used.
Chart 10 Currency composition of global foreign exchange reserves
(USD trillions; at current exchange rates) (percentages; at constant end-2012 exchange rates)
a) Amounts b) Shares
0
2
4
6
8
10
12
0
2
4
6
8
10
12
1999 2001 2003 2005 2007 2009 2011
USD
EUR
JPY
other currencies
undisclosed
0
10
20
30
40
50
60
70
80
0
10
20
30
40
50
60
70
80
1999 2001 2003 2005 2007 2009 2011
USD
EUR
other currencies
Sources: IMF and ECB calculations.Notes: “Other currencies” excludes holdings in Swiss francs, Japanese yen and pounds sterling. The latest observation is for December 2012.
20ECB
The international role of the euro
July 20132020
dollar and the Canadian dollar, have become larger than holdings in Japanese yen or pounds
sterling (see Table A1 in the Statistical Annex). This increased but still limited importance of non-
traditional reserve currencies is likely to stem from a variety of factors, as discussed in Special
Feature A.
Disaggregated IMF data suggest that the currency composition of foreign exchange reserves followed
fairly distinct patterns at the regional level. Among the central banks in advanced economies, the
share of the euro increased by around 1½ percentage points to 23.7% at end-2012 (from 22.3% at
end-2011, at constant exchange rates). To some extent, this increase could reflect interventions
in euro by the Swiss National Bank (see Box 3), which would be consistent with the fact that the
share of the US dollar in reserves held by advanced economies dropped somewhat (see Table A1
in the Statistical Annex). Turning to emerging and developing economies, the share of the euro in
reserve holdings dropped by more than 3 percentage points (from 27.4% at end-2011 to 24.2%)
when measured at constant exchange rates. The US dollar and “other currencies” mostly benefited
from these developments.
Recent survey-based evidence suggests that concerns of foreign reserve managers about the euro
area, which may have resulted in some portfolio shifts within the euro-denominated market segment,
eased following the ECB’s announcement of OMTs by the Eurosystem. In a survey of 60 central
banks managing reserves worth USD 6.7 trillion, 89% of respondents indicated between January
and March 2013 that this announcement had alleviated their concerns about the euro in the wake of
the euro area sovereign debt crisis.3
Among the non-euro area central banks which disclose the currency composition of their foreign
exchange reserves, the euro’s share remained relatively stable in most advanced economies and
declined in some emerging markets, most likely reflecting factors which are specific to the reserve
management practices of the individual countries (see Table A2 in the Statistical Annex). In the
case of Chile, a change of the criteria for reserve management putting more emphasis on return
versus liquidity considerations led to a decline in the share of the euro from 31.9% to 22.0% while
the share of US dollar share increased. This portfolio adjustment took place in July 2012.
Overall, these findings suggest that the euro continued in 2012 to perform its function as the
second-most important reserve currency in the world. At the same time, concerns among foreign
reserve managers related to the euro area sovereign debt crisis had been significantly alleviated by
early 2013. Among emerging and developing countries, some portfolio rebalancing materialised,
aligning the weight of the euro more closely with that in overall reserves. Finally, the US dollar’s
status as the leading global reserve currency remained unchanged.
The use of the euro as an exchange rate anchor remained broadly unchanged. As in previous years,
the use of the euro in the exchange rate regimes of countries outside the euro area was, to a large
extent, underpinned by geographical and institutional factors, being observed mainly in countries
neighbouring the euro area and countries that have established special institutional arrangements
with the EU or its Member States (see Table A3 in the Statistical Annex). With the exception of the
countries participating in ERM II, the decision to use the euro as an anchor currency is a unilateral
one and does not involve any commitment on the part of the ECB.
3 See Royal Bank of Scotland (2013).

21ECB
The international role of the euro
July 2013 21
4 RECENT DEVELOPMENTS
IN THE INTERNATIONAL
USE OF THE EURO
21
Box 3
THE ACCUMULATION OF EURO-DENOMINATED RESERVES BY THE SWISS NATIONAL BANK
The total holdings of foreign exchange reserves of the Swiss National Bank (SNB) were broadly
stable at around CHF 50 billion between the inception of the euro in 1999 and the beginning of
the financial crisis in late 2008. Over the same period the euro’s share in the SNB’s total reserves
remained in a relatively narrow range between 40% and 50%. The stability of both the level
and the composition of the SNB’s currency reserves came to an end during the financial crisis.
Indeed, substantial capital inflows – reflecting the Swiss franc’s role as a safe-haven currency –
led to strong interventions by the SNB in foreign exchange markets in order to counteract the
resulting appreciation pressure on the Swiss franc. As a result, the SNB’s holdings of foreign
exchange reserves had increased by more than CHF 170 billion to CHF 226 billion by the second
quarter of 2010. Substantial upward pressure on the Swiss currency re-emerged in mid-2011 and
mid-2012 on the back of a renewed flight to safety amid rising uncertainty with respect to future
developments in the euro area. As a result of the interventions in foreign exchange markets, the
SNB’s foreign exchange reserves stood at more than CHF 420 billion in the final quarter of 2012
(see Chart a).
The SNB diversified out of euro-denominated reserves after each intervention period in order
to rebalance its foreign reserve portfolio and to bring the share of the euro in total reserves
back to the long-run average. In the final quarter of 2012, the currency shares of the SNB’s
foreign exchange reserves stood close to levels observed before the financial crisis (see Chart b).
This notwithstanding, the SNB accumulated almost CHF 200 billion of euro-denominated assets
between 2008 and 2012.
Currency breakdown of the SNB’s foreign exchange reserves
(CHF billions) (percentages)
EUR
USD
other
a) in volumes b) in shares
0
50
100
150
200
250
300
350
400
450
0
50
100
150
200
250
300
350
400
450
2005 2006 2007 2008 2009 2010 2011 20120
10
20
30
40
50
60
70
80
90
100
0
10
20
30
40
50
60
70
80
90
100
2005 2006 2007 2008 2009 2010 2011 2012
Sources: SNB and ECB calculations.Note: “Other” comprises: Japanese yen, Canadian dollar, Australian dollar, Swedish krona, Danish krone, Singapore dollar and Korean won.

22ECB
The international role of the euro
July 20132222
4.2 THE EURO IN INTERNATIONAL DEBT MARKETS
Following the revision and enhancement of the debt securities statistics of the Bank for International
Settlements (BIS), this review will report on a new “broad” measure of the importance of different
currencies in the international debt market, in addition to the ECB’s traditional “narrow” measure
of international debt issuance. According to the new BIS definition, international debt securities are
“those issued in a market other than the local market of the country where the borrower resides”.4
In this report, the BIS measure of international debt securities is further refined in order to exclude
all debt issuance which is purely domestic when the euro area is considered a single economic
area (e.g. a bond issued by a German resident with registration domain or listed in Luxembourg).
The ECB’s “broad” measure of international debt issuance thus excludes intra-euro area issuance
from the international debt securities reported by the BIS.
At the end of the fourth quarter of 2012, the total outstanding amounts of international debt
securities according to the new “broad” measure (excluding intra-euro area issuance) increased
by around USD 700 billion compared with the previous year, reaching USD 19.4 trillion. Euro-
denominated debt securities accounted for around USD 7.3 trillion of those outstanding amounts
– 37.7% at current (end-2012) exchange rates (see Table 2). When measured at constant (end-2012)
exchange rates, this share shows a steady increase from 26.5% in 1999 to 39.4% in 2006, which
is followed by a period of relative stability until 2011 and a decline in 2012, possibly owing to the
impact of the euro area sovereign debt crisis (see Table A4 in the Statistical Annex).
As in the past, this report emphasises the “narrow” concept of international issuance, which
comprises only issuance in a currency other than that of the country in which the borrower resides.5
According to this “narrow” measure, the total stock of international debt securities reached almost
USD 12 trillion at the end of 2012. Euro-denominated securities accounted for USD 3 trillion of
the total outstanding amount, representing 25.5% of total stock (see Table 2). This represented a
decline in the share of the euro of 0.7% compared with the end of 2011, continuing the downward
correction seen in previous years (see Chart 11). By contrast, the US dollar’s share in the narrow
measure of international debt issuance increased by almost 2 percentage points in 2012, reaching a
level of more than 52% of total issuance.
The declining share of the euro in international issuance, according to the narrow measure, can
possibly be explained by two factors. First, the tensions in the euro area sovereign debt market,
4 See BIS Quarterly Review, December 2012, for more information. In order to distinguish domestic from international issuance, the new
BIS definition focuses on the “primary market”, i.e. the market where securities are issued for the first time. This primary market is
identified by three characteristics: the registration domain (ISIN), the listing place and the governing law. If at least one of these features
is different from the country of residence of the issuer of the security, the issuance is classified as international.
5 The “narrow” definition has also changed slightly following the review of the BIS debt securities statistics. However, some offsetting
effects between the two concepts produce very similar results. The “global” measure of international debt securities presented in previous
reports is not referred to in this report owing to the above-mentioned statistical changes.
Table 2 Alternative measures of the supply of debt securities and the shares of major currencies
(fourth quarter of 2012; at current exchange rates)
Amounts outstanding (USD billions) Shares (%)Total Euro US dollar Japanese yen Euro US dollar Japanese yen
“Narrow” measure 11,839 3,025 6,199 581 25.5 52.4 4.9
“Broad” measure 19,374 7,299 7,523 663 37.7 38.8 3.4
Sources: BIS and ECB calculations.

23ECB
The international role of the euro
July 2013 23
4 RECENT DEVELOPMENTS
IN THE INTERNATIONAL
USE OF THE EURO
23
which peaked at the end of 2011 and resurfaced in the summer of 2012, apparently dented
the appetite for new international debt issuance denominated in euro. Second, funding cost
considerations continued to favour the issuance of debt securities denominated in US dollars, rather
than those denominated in euro (or in Japanese yen). The US dollar basis swap, which measures
deviations from the covered interest parity, spiked at the end of 2011 and remained positive for a
large part of 2012. This implies that it was cheaper to borrow in US dollars and swap the proceeds
into euro (or yen) than to borrow directly in euro (or yen).
4.3 THE EURO AS A PARALLEL CURRENCY
4.3.1 CURRENCY SUBSTITUTION
The use of euro banknotes outside the euro area cannot be estimated with complete accuracy.
One estimate of the amount of euro banknotes circulating abroad (reported on a regular basis in
this report) is based on the accumulation over time of net shipments of euro banknotes by euro
area monetary financial institutions (MFIs) to destinations outside the euro area. On the basis
of this method, some €130 billion worth of euro banknotes (after adjusting for seasonal effects)
are estimated to have been in circulation outside the euro area at the end of December 2012
(see Chart 12). This was around 14% of the total euro currency in circulation in that month. This
estimate is regarded as a clear lower bound, given that the banking channel is just one of a number
of channels through which euro banknotes leave and re-enter the euro area. Anecdotal evidence
suggests that the outflows of euro banknotes via non-MFI channels (e.g. via tourism or workers’
remittances) are, for most countries, greater than the inflows via such channels. Net shipments by
banks thus provide an incomplete picture of true net flows of banknotes. Other estimates suggest
that around 25% of euro currency in circulation (and possibly slightly more) was circulating outside
the euro area at the end of 2012.
Chart 11 Stock of international debt securities (narrow measure): outstanding amounts and currency shares
(USD trillions; at current exchange rates) (percentages; at constant exchange rates)
a) Outstanding amounts b) Shares
0
2,000
4,000
6,000
8,000
10,000
12,000
14,000
0
2,000
4,000
6,000
8,000
10,000
12,000
14,000
1999 2001 2003 2005 2007 2009 2011
USD
EUR
JPY
other currencies
0
10
20
30
40
50
60
0
10
20
30
40
50
60
1999 2001 2003 2005 2007 2009 2011
USD
EUR
JPY
Sources: BIS and ECB calculations.Note: The latest observation is for December 2012.

24ECB
The international role of the euro
July 20132424
Foreign demand for euro banknotes – as measured by net shipments by euro area MFIs – increased
further in 2012, growing again at a higher annual rate than banknotes in circulation within the euro
area. Indeed, the annual growth of foreign demand for euro banknotes (based on the accumulation
over time of net shipments of euro banknotes by euro area MFIs to destinations outside the euro area)
remained at double-digit levels for the second consecutive year (standing at 11.1% in December 2012),
while that of euro banknotes in domestic circulation moderated considerably (to 2.7%). The value
of monthly net shipments of euro banknotes abroad remained robust throughout 2012 and was
marginally higher than the value registered on average in 2011, following a modest contraction
in 2010. Nonetheless, monthly net shipments in the last two years have not been as large as the
average shipments observed in 2007-08, in particular following the collapse of Lehman Brothers.
The marginal rise in net shipments of euro banknotes in 2012 as compared with 2011 was mostly
explained by the somewhat lower gross backflows of euro banknotes from non-euro area residents.
At the same time, the gross outflows of euro banknotes remained broadly unchanged from the
previous year. Overall, recent developments in the net shipments of euro banknotes abroad continue
to suggest that the intensification of the euro area sovereign debt crisis in the second half of 2011 did
not have a major impact on the use of euro banknotes outside the euro area.
Further evidence on the holdings of euro currency abroad can be derived from statistics provided
by the monetary authorities of non-euro area countries. For example, the Central Bank of Russia
publishes data on foreign currency brought into and taken out of the Russian Federation by
authorised banks. These statistics show that net shipments of euro banknotes to Russia increased
for the second consecutive year in 2012 (see Chart 13), following persistent net outflows for
most of 2009 and 2010. The net increase in euro banknotes taken into the Russian Federation by
authorised banks in 2012 was somewhat higher than in the previous year and reached broadly the
levels observed on average before the collapse of Lehman Brothers. The data thus suggest that
Russian residents might have increased their euro and US dollar banknote holdings by broadly the
same amounts in 2011 and 2012, after reducing their holdings of both currencies for most of the
previous two years.
Chart 12 Net shipments of euro banknotes to destinations outside the euro area
(EUR billions; adjusted for seasonal effects)
0
20
40
60
80
100
120
140
-4
-2
0
2
4
6
8
10
12
14
2001 2002 2004 2006 2008 20102003 2005 2007 2009 2011 2012
monthly shipments (left-hand scale)cumulative shipments (right-hand scale)
Source: Eurosystem.Notes: Net shipments are the sum of euro banknotes sent to destinations outside the euro area minus euro banknotes received from outside the euro area. The latest observation is for December 2012.

25ECB
The international role of the euro
July 2013 25
4 RECENT DEVELOPMENTS
IN THE INTERNATIONAL
USE OF THE EURO
25
Data collected from international wholesale banks show that sales of euro banknotes increased
in 2012, mainly owing to an increased demand from Russia and northern Africa, while banknote
sales to Switzerland and the United Kingdom continued to account for the largest share of total
sales to non-euro area destinations (see Chart 14a). At the same time, backflows of euro banknotes
Chart 13 Foreign currency brought into and taken out of the Russian Federation by authorised banks
(USD billions; USD/EUR)
0.6
0.8
1.0
1.2
1.4
1.6
1.8
-4
-2
0
2
4
6
8
in/out balance US dollar (left-hand scale)
in/out balance euro (left-hand scale)
USD/EUR exchange rate (right-hand scale)
1999 2001 2003 2005 2007 2009 2011
Sources: Central Bank of Russia and ECB.Note: The latest observation is for December 2012.
Chart 14 Regional breakdown of euro banknote purchases from and sales to locations outside the euro area
(EUR billions)
Central and South America
North America
Africa
Asia and Australia
Middle East
Switzerland
rest of Europe
Russia
non-EU Member States in eastern Europe excluding Russia
other non-euro EU
non-euro area EU Member States in eastern Europe
a) Sales b) Purchases
0
10
20
30
40
50
60
70
0
10
20
30
40
50
60
70
2009 2010 2011 20120
10
20
30
40
50
60
70
0
10
20
30
40
50
60
70
2009 2010 2011 2012
Source: ECB (based on data from wholesale banks).Notes: These data exclude trades between wholesale banks. The 2012 fi gures contain data obtained from one additional wholesale bank which previously had not responded to this survey. These data differ from statistics on net shipments, as the latter do not take account of the recirculation of banknotes by wholesale banks outside the euro area (e.g. where a wholesale bank purchases a euro banknote from a client in Asia and sells it to a client in Russia).

26ECB
The international role of the euro
July 20132626
(i.e. purchases from wholesale banks) stemmed mainly from EU Member States in eastern Europe
and from Turkey, broadly in line with developments in previous years (see Chart 14b).
4.3.2 ASSET AND LIABILITY SUBSTITUTION
Economic agents in central, eastern and south-eastern European (CESEE) countries use the euro
widely in the domestic economy. As in previous reports, this section reviews the share of euro
deposits and loans in total deposits and loans in CESEE countries.
The euroisation of liabilities on banks’ balance sheets remains substantial in several non-euro area
EU Member States, as well as in most EU candidate and potential candidate countries. In general,
the use of the euro seems to be most widespread in the Western Balkans6. Among non-euro area EU
Member States, Poland and the Czech Republic are at the lower end of the range, with the euro’s
share in total deposits standing at about 6% in 2012, while Latvia (42.3 %) is at the upper end of the
range. By comparison, in the Western Balkans this share ranges from 32.6% in Albania to 70.6%
in Serbia. The euro’s share in total deposits remained broadly stable in 2012 (see Table A16 in the
Statistical Annex). Marginal changes in this ratio in most CESEE countries appear to be related to
differing factors.7
Overall, the euro remained the most widespread currency of denomination for foreign currency
deposits in CESEE countries, and continued to be perceived as a preferable store of value
relative to local currencies, particularly in countries which had previously experienced periods
of macroeconomic instability. In countries where the euro’s share in total deposits declined
somewhat, the fall may stem from economic agents’ response to a gradual decline in domestic
macroeconomic and financial uncertainty. The euro’s share in total foreign deposits also remained
6 Albania, Bosnia and Herzegovina, Croatia, FYR Macedonia, Kosovo, Montenegro and Serbia.
7 Valuation effects might also be reflected to some extent, as the data are not adjusted for exchange rate movements.
Chart 15 The euro’s share in deposits in non-euro area EU Member States and EU candidate and potential candidate countries
(as a percentage of foreign currency-denominated deposits)
0
20
40
60
80
100
0
20
40
60
80
100
HR RO BG LV HU CZ LT PL RS BA MK AL TR
EU Member States EU candidate and potential
candidate countries
20112012
Sources: National central banks and ECB calculations.Notes: The defi nition of deposits may vary from country to country. Foreign exchange-indexed loans are not included. For EU candidate and potential candidate countries, fi gures for 2012 refer to outstanding amounts in September 2012. Kosovo and Montenegro are excluded owing to the lack of a separate legal tender. Croatia joined the EU on 1 July 2013.

27ECB
The international role of the euro
July 2013 27
4 RECENT DEVELOPMENTS
IN THE INTERNATIONAL
USE OF THE EURO
27
broadly unchanged on average (see Chart 15). Evidence provided by the OeNB confirms that trust
in the euro in CESEE countries, while decreasing in spring 2012, increased in the autumn of 2012
(see Section 4.5).
On the assets side of banks’ balance sheets, euroisation continues to be pronounced in line with the
pattern on the liabilities side. The share of euro-denominated loans in total lending varies between
countries but in general remains high, in particular in countries with a currency board or tightly
managed exchange rate vis-à-vis the euro. It ranged from 7.5% in the Czech Republic to 81.4% in
Latvia in 2012 (see Table A16 in the Statistical Annex). Lending in euro outside the euro area or
in foreign currency in general entails macroeconomic costs and financial stability risks, especially
if borrowers’ liabilities do not correspond to assets in the same currency.8 In this context, it should
be noted that foreign exchange loan-to-deposit ratios in many countries remain relatively high
(see Chart 16).
4.4 THE EURO IN OTHER MARKET SEGMENTS
4.4.1 THE USE OF THE EURO IN FOREIGN EXCHANGE MARKETS
The use of the euro in foreign exchange markets remained broadly unchanged in 2012. Data
on settlements in CLS show that, while foreign exchange transactions have continued to rise,
notwithstanding some volatility (see Chart 17a), the currency composition of trades settled in
CLS has remained stable: the US dollar was the counterpart in 90% of all currency exchanges,
8 In order to address the risks stemming from lending in foreign currency, the European Systemic Risk Board published seven
recommendations on lending in foreign currencies in October 2011 (see ESRB, 2011). Further information can also be found in ECB
(2011), in particular in Box 3 entitled “Risks and costs associated with foreign currency lending”.
Chart 16 Ratio of loans in foreign currency to deposits in foreign currency in non-euro area EU Member States and EU candidate and potential candidate countries
(percentages)
0
50
100
150
200
250
300
350
400
0
50
100
150
200
250
300
350
400
2011
2012
HR PL LV LT RO BG HR CZ RS MK TR AL ME
EU Member States EU candidate and potential
candidate countries
Sources: National central banks and ECB calculations.Notes: The defi nition of loans may vary from country to country. Where available, foreign exchange-indexed loans are included. For EU candidate and potential candidate countries, fi gures for 2012 refer to outstanding amounts in September 2012. Bosnia and Herzegovina is excluded for reasons of scale. The corresponding fi gures are 4.4% (2011) and 3.3% (2012). Given the use of the euro as legal tender in Montenegro, “foreign currency” here refers to all currencies except the euro. Croatia joined the EU on 1 July 2013.

28ECB
The international role of the euro
July 20132828
confirming its role as the main vehicle currency9 in foreign exchange markets, while the euro’s
share remained around 40% (see Chart 17b).10
4.4.2 THE USE OF THE EURO IN INTERNATIONAL
TRADE INVOICING
In 2012 the euro’s use in the settlement or
invoicing of international trade flows remained
close to levels observed in previous years. The
share of the euro in the euro area’s exports of
goods declined by about 2 percentage points
relative to 2011, to 62.5%, but remained
about 3 percentage points higher than in 2007,
i.e. before the onset of the global economic
and financial crisis (see Table A13 in the
Statistical Annex). The share of the euro in
euro area imports of goods remained stable,
at 49%, roughly 1 percentage point higher
than in 2007. The share of the euro in the euro
area’s international trade in services declined
by about 2 percentage points for exports, while
remaining stable for imports, standing at 52.1%
and 58.4% respectively.11 The euro’s share as
9 A vehicle currency (B) is used to exchange two other currencies (A and C), so A and C are exchanged not directly (i.e. AC), but in two
transactions (i.e. AB and BC). Most transactions between relatively illiquid currencies are executed via vehicle currencies, owing to the
lower transaction costs.
10 Payment-versus-payment settlement involves two currencies, so the sum of all currency shares equals 200%.
11 It should be noted that the euro area’s international trade transactions in services account for about one-third of total international trade
transactions in goods and services.
Chart 18 Share of the euro in extra-EU trade of euro area countries
(cross-country median; as a percentage; 2010)
0
20
40
60
80
100
0
20
40
60
80
100
primary
goods
petroleum
products
manufactured
goods
imports
exports
Sources: Eurostat and ECB staff calculations.Notes: Petroleum products = petroleum, petroleum products and related materials. Calculations exclude Belgium for imports and exports and Malta for imports owing to data availability.
Chart 17 Settlement volumes and currency breakdown in the CLS system
(EUR billions; at current exchange rates) (percentages; at current exchange rates)
a) Amounts b) Shares
0.0
0.5
1.0
1.5
2.0
2.5
3.0
3.5
4.0
4.5
0.0
0.5
1.0
1.5
2.0
2.5
3.0
3.5
4.0
4.5
2008 2009 2010 2011 2012
average daily turnover (value in EUR equivalent)
three-month moving average
0
10
20
30
40
50
60
70
80
90
100
0
10
20
30
40
50
60
70
80
90
100
2006 2007 2008 2009 2010 2011 2012
GBP
USD
EUR
JPY
Sources: CLS and ECB calculations.Notes: The last observation is for February 2013.

29ECB
The international role of the euro
July 2013 29
4 RECENT DEVELOPMENTS
IN THE INTERNATIONAL
USE OF THE EURO
29
an invoicing/settlement currency in the external trade of most non-euro area EU countries remained
by and large stable in 2012 (see Table A13 in the Statistical Annex).
New data available for 2010 on the currency composition of euro area countries’ extra-EU trade
broken down by main product groups also provide further evidence on the use of the euro across
sectors (see Chart 18). The median share of the euro across the euro area countries for which
data are available is roughly the same for primary goods and manufactured goods (about 50% for
imports and over 66% for exports). However, the euro’s share is markedly lower for petroleum,
petroleum products and related materials, at 43% for exports and only 12% for imports, reflecting
the dominant role traditionally played by the dollar in the global oil market.
4.5 RESULTS FROM THE OENB EURO SURVEY OF HOUSEHOLDS IN CENTRAL,
EASTERN AND SOUTH-EASTERN EUROPE
Households’ portfolio choices in CESEE countries are mainly based on the interplay between two
elements: the cash-versus-deposits decision and the foreign currency-versus-domestic currency
decision. The underlying preferences motivating these decisions are determined by various
(supply and demand-related) factors that influence a person’s assessment of return and risk. Recent
research underlines the central role of confidence in households’ financial decisions: confidence in
the security of deposits, in the stability of banks and in positive economic developments, as well
as in the stability of the domestic currency versus a safe-haven currency (Stix, 2012; Coupé, 2011;
Beck and Brown, 2011). Furthermore, there is evidence that past periods of crisis have a lasting
effect on household preferences for a safe-haven currency (Mudd et al., 2010; Stix, 2011; Beckmann
and Scheiber, 2012). Against this background this section addresses the following questions: How
do households view the euro as compared with their domestic currency, and can we observe any
significant change in this assessment? What was the portfolio composition of households in CESEE
countries in 2007? Has the portfolio composition changed since 2007? Can we infer any trends in
households’ saving behaviour for the future?
Relative trust in the euro versus the domestic currency has a significant impact on the currency
composition of households’ savings, in particular in the highly euroised economies of south-eastern
Europe (SEE).
According to the OeNB Euro Survey, households’ trust in the euro relative to their domestic
currencies declined considerably in all countries except Serbia in the course of the sovereign debt
crisis (Chart 19). Agreement with the statement that “the euro will be a very stable and trustworthy
currency over the next five years” reached a historic low in spring 2012. However, trust in the euro
has recovered substantially in all countries since then. As a result, in autumn 2012 the share of
respondents who trusted the euro exceeded the share of those who trusted their domestic currencies
in all countries surveyed except the Czech Republic.
Turning to the composition of households’ financial portfolios in CESEE countries, evidence
from the OeNB Euro Survey reveals that households mainly hold their savings in bank accounts
or as cash reserves.12 Furthermore, some countries exhibit a relatively strong demand for foreign
currency cash and deposits designed to serve as a safe-haven asset. In most cases these safe-haven
assets are denominated in euro.
12 This descriptive analysis focuses on these two main components of the financial portfolio of CESEE households.
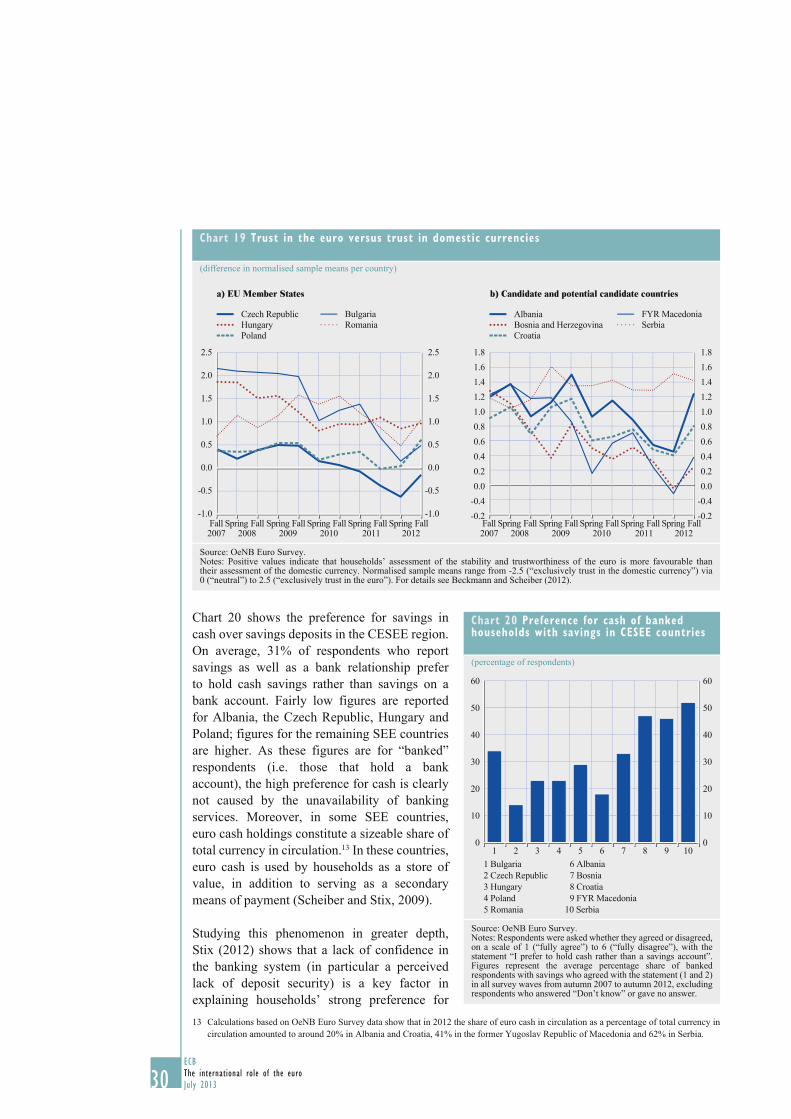
30ECB
The international role of the euro
July 20133030
Chart 20 shows the preference for savings in
cash over savings deposits in the CESEE region.
On average, 31% of respondents who report
savings as well as a bank relationship prefer
to hold cash savings rather than savings on a
bank account. Fairly low figures are reported
for Albania, the Czech Republic, Hungary and
Poland; figures for the remaining SEE countries
are higher. As these figures are for “banked”
respondents (i.e. those that hold a bank
account), the high preference for cash is clearly
not caused by the unavailability of banking
services. Moreover, in some SEE countries,
euro cash holdings constitute a sizeable share of
total currency in circulation.13 In these countries,
euro cash is used by households as a store of
value, in addition to serving as a secondary
means of payment (Scheiber and Stix, 2009).
Studying this phenomenon in greater depth,
Stix (2012) shows that a lack of confidence in
the banking system (in particular a perceived
lack of deposit security) is a key factor in
explaining households’ strong preference for
13 Calculations based on OeNB Euro Survey data show that in 2012 the share of euro cash in circulation as a percentage of total currency in
circulation amounted to around 20% in Albania and Croatia, 41% in the former Yugoslav Republic of Macedonia and 62% in Serbia.
Chart 20 Preference for cash of banked households with savings in CESEE countries
(percentage of respondents)
0
10
20
30
40
50
60
0
10
20
30
40
50
60
1 Bulgaria
2 Czech Republic
3 Hungary
4 Poland
5 Romania
6 Albania
7 Bosnia
8 Croatia
9 FYR Macedonia
10 Serbia
1 2 3 4 5 6 7 8 9 10
Source: OeNB Euro Survey.Notes: Respondents were asked whether they agreed or disagreed, on a scale of 1 (“fully agree”) to 6 (“fully disagree”), with the statement “I prefer to hold cash rather than a savings account”. Figures represent the average percentage share of banked respondents with savings who agreed with the statement (1 and 2) in all survey waves from autumn 2007 to autumn 2012, excluding respondents who answered “Don’t know” or gave no answer.
Chart 19 Trust in the euro versus trust in domestic currencies
(difference in normalised sample means per country)
a) EU Member States b) Candidate and potential candidate countries
-1.0
-0.5
0.0
0.5
1.0
1.5
2.0
2.5
-1.0
-0.5
0.0
0.5
1.0
1.5
2.0
2.5
2007 2008 2009 2010 2011 2012
Czech Republic
Hungary
Poland
Bulgaria
Romania
Fall Spring Fall Spring Fall Spring Fall Spring Fall Spring Fall
-0.4
-0.2
0.0
0.2
0.4
0.6
0.8
1.0
1.2
1.4
1.6
1.8
-0.4
-0.2
0.0
0.2
0.4
0.6
0.8
1.0
1.2
1.4
1.6
1.8
2007 2008 2009 2010 2011 2012Fall Spring Fall Spring Fall Spring Fall Spring Fall Spring Fall
Albania
Bosnia and Herzegovina
Croatia
FYR Macedonia
Serbia
Source: OeNB Euro Survey.Notes: Positive values indicate that households’ assessment of the stability and trustworthiness of the euro is more favourable than their assessment of the domestic currency. Normalised sample means range from -2.5 (“exclusively trust in the domestic currency”) via 0 (“neutral”) to 2.5 (“exclusively trust in the euro”). For details see Beckmann and Scheiber (2012).

31ECB
The international role of the euro
July 2013 31
4 RECENT DEVELOPMENTS
IN THE INTERNATIONAL
USE OF THE EURO
31
holding sizeable shares of their assets in cash at home rather than with banks. The recollection
of past banking crises aggravates this effect. Furthermore, weak institutional frameworks, with
low levels of legal enforceability or tax collection, for example, as well as a low penetration of
banks constitute significant factors that explain the strong preference for cash. Finally, Stix (2012)
provides empirical evidence that the preference for cash is stronger in euroised economies.
To allow an identification of the trends in households’ portfolio choices since 2007,
Chart 21 combines aggregate data from monetary statistics and microdata from the OeNB Euro
Survey. It shows the portfolio composition of an average household with respect to cash holdings
and savings deposits in both domestic and foreign currency. Deposits per capita (for the household
sector including non-profit institutions serving households) denominated in both domestic and
foreign currency are annual averages of monthly figures from the monetary statistics of national
central banks. Domestic currency cash per capita is derived from M0. Euro cash holdings per capita
have been calculated on the basis of Euro Survey data.14 Foreign currency assets have been adjusted
for exchange rate fluctuations by holding the exchange rate fixed at the level of 2007. These
adjustments make it possible to identify changes in the relative shares of the four asset classes. This
overcomes the often-faced limitation that figures for per capita cash in circulation are uninformative
in euroised/dollarised economies because data on foreign currency cash in circulation are not
available (Feige, 2003). Chart 21 thus presents new information following up on earlier work in this
area by Scheiber and Stix (2009).
Looking at the status quo in 2007, households in the Czech Republic, Hungary and Poland
predominantly held savings as bank deposits denominated in domestic currency. In Romania and
Albania, the share of domestic currency deposits was somewhat higher on average than that of
14 For details see Scheiber and Stix (2009).
Chart 21 Relative importance of savings deposits and cash holdings in households’ portfolios, 2007 compared with 2012
(percentages)
0
10
20
30
40
50
60
70
80
90
100
0
10
20
30
40
50
60
70
80
90
100
BG2007
BG2012
CZ2007
CZ2012
HU2007
HU2012
PL2007
PL2012
RO2007
RO2012
AL2007
AL2012
BA2007
BA2012
HR2007
HR2012
MK2007
MK2012
RS2007
RS2012
domestic currency deposits
foreign currency deposits
domestic currency cash
foreign currency cash
Sources: National central banks and OeNB Euro Survey.

32ECB
The international role of the euro
July 20133232
foreign currency deposits. The opposite was true for Bosnia and Herzegovina, Bulgaria and the
former Yugoslav Republic of Macedonia, where foreign currency deposits played a more important
role. In Croatia and Serbia, foreign currency deposits, mainly denominated in euro, dominated
households’ portfolios. Furthermore, euro cash holdings made up over 10% of households’
portfolios in Albania and Bosnia and Herzegovina, 23% in the former Yugoslav Republic of
Macedonia and as much as 27% in Serbia. The relatively high shares of domestic currency cash
holdings in several countries suggest that domestic currency cash also served as a store of value in
these countries. In Croatia, the former Yugoslav Republic of Macedonia and Serbia, by contrast,
the shares were fairly low, indicating that domestic currency cash holdings were mainly used as a
means of payment.
In general, since 2007 the relative importance of savings deposits over cash holdings has increased
in all countries, except Hungary. Households tend to hold fewer savings in cash, which is mainly
attributable to a relative decline in euro cash holdings. In particular, SEE countries which had
recorded a relatively high share of euro cash in total currency in circulation in 2007 (currency
substitution) witnessed a substantial decline both in the relative importance of euro cash holdings in
households’ portfolios and in the absolute value of euro cash holdings.15 However, savings at banks
have increased over the last six years in absolute terms.
From 2007 to 2012, the portfolio structure of Czech and Hungarian households remained broadly
unchanged, while that of households in the other countries surveyed shifted considerably. The
increase in the relative share of savings deposits in Bulgaria, the Czech Republic, Poland and
Romania was exclusively driven by domestic currency deposits. In the former Yugoslav Republic
of Macedonia, the growth rate of domestic currency deposits outpaced the growth rate of foreign
currency deposits, with the result that the relative importance of domestic currency deposits
increased by around 12 percentage points. In Albania, Bosnia and Herzegovina and Serbia, by
contrast, foreign currency deposits grew faster than domestic currency deposits, increasing the
relative importance of foreign currency deposits by around 10 percentage points, mainly at the
expense of euro cash holdings. Finally, the increase in the relative share of savings deposits in
Croatia was exclusively caused by a rise in the volume of foreign currency deposits.
In seven out of nine countries, the relative share of foreign currency assets has declined since 2007;
in particular, savers in the former Yugoslav Republic of Macedonia and Romania have increasingly
turned to their domestic currencies. By contrast, in Albania and Croatia the share of foreign currency
assets has increased moderately. Overall, assets denominated in foreign currency, mainly euro, still
account for a significant share of SEE households’ portfolios, in particular in Croatia and Serbia,
where foreign currency assets amount to 71% and 79% respectively. The euro can be expected to
continue to play an important role in SEE households’ portfolios, not least because of the recent
rebound in relative trust in the euro in CESEE countries.
Moreover, the recent drop in euro cash holdings seems to be related not only to households’
depletion of euro cash reserves to finance basic expenditure in times of crisis; it also reflects a
medium-term trend towards restructuring household portfolios that will strengthen (euro) deposits
in relation to (euro) cash. This phenomenon can be interpreted as a slow recovery of confidence
in the banking system or the result of easier access to banking services for larger parts of the
population in south-eastern Europe.
15 At the onset of the financial and economic crisis in autumn 2008, the erosion of trust in banks and in the safety of deposits prompted
withdrawals of savings deposits in some SEE countries. However, this shift towards assets that were considered secure (e.g. euro cash)
was moderate and short-lived (Ritzberger-Grünwald and Scheiber, 2012).

33ECB
The international role of the euro
July 2013 33
4 RECENT DEVELOPMENTS
IN THE INTERNATIONAL
USE OF THE EURO
33
REFERENCES
Beck, T. and Brown, M. (2011), “Which Households Use Banks? Evidence from the Transition
Economies”, Swiss National Bank Paper, Zurich, 2011(1).
Beckmann, E. and Scheiber, T. (2012), “The Impact of Memories of High Inflation on Households’
Trust in Currencies”, Focus on European Economic Integration, 2012(4), Vienna, pp. 80–93.
Coupé, T. (2011), “Mattresses versus Banks – The Effect of Trust on Portfolio Composition”,
Kyiv School of Economics and Kyiv Economics Institute Discussion Paper, 40.
European Central Bank (2011), The international role of the euro, July 2011.
European Central Bank (2013), Financial integration in Europe, April 2013.
European Systemic Risk Board (2011), “Recommendations of the European Systemic Risk
of 21 September 2011 on lending in foreign currencies (ESRB/2011/1)”, Office Journal of the European Union, C342, pp. 1-47.
Feige, E. (2003), “The Dynamics of Currency Substitution, Asset Substitution and De Facto
Dollarization and Euroization in Transition Countries”, Comparative Economic Studies, 45(3),
pp. 358–383.
Mudd, S., Pashev, K. and Valev, N. (2010), “The Effect of Loss Experiences in a Banking Crisis on
Future Expectations and Behavior”, The B.E. Journal of Macroeconomics, 10(1), Article 32.
Ritzberger-Grünwald, D. and Scheiber, T. (2012), “Euro Cash in Central, Eastern and Southeastern
Europe”, Monetary Policy & the Economy, 2012(1), Vienna, pp. 41–55.
Royal Bank of Scotland (2013), RBS Reserve Management Trends 2013, Central Banking
Publications, London.
Scheiber, T. and Stix, H. (2009), Euroization in Central, Eastern and Southeastern Europe –
New Evidence On Its Extent and Some Evidence on Its Causes”, OeNB Working Paper, 159, Vienna.
Stix, H. (2011), “Euroization: What Factors Drive its Persistence? Household Data Evidence for
Croatia, Slovenia and Slovakia”, Applied Economics, 43(21), pp. 2689–2704.
Stix, H. (2012), “Why Do People Save in Cash? Distrust, Memories of Banking Crises,
Weak Institutions and Dollarization”, OeNB Working Paper, 178, Vienna.
34ECB
The international role of the euro
July 2013
SPECIAL FEATURES
A GLOBAL SAFE ASSET SHORTAGE, NON-TRADITIONAL RESERVE CURRENCIES AND THE GLOBAL
FINANCIAL CRISIS16
The share of global reserves invested in non-traditional currencies, such as the Australian or the Canadian dollar, has increased significantly since the onset of the global financial crisis, reaching a 40-year peak of more than 6% at the end of 2012. This marked increase has occurred against the backdrop of growing discussions about a possible shortage of safe assets globally and a perceived worsening in the credit risk of several major advanced economy sovereigns.
This special feature reviews key developments regarding the emergence of non-traditional reserve currencies as well as the determinants of their growing importance since the outbreak of the global financial crisis. It shows that non-traditional reserve currency issuers are characterised by a track record of rapid and resilient growth, price stability and sound public finances. However, their debt security markets are markedly thinner and less liquid than those of major reserve currency issuers, which may act as a drag on the role of non-traditional currencies as reserve assets in the future. In addition, the special feature shows that higher risk aversion in foreign exchange markets and perceptions of a heightened credit risk of some advanced economy sovereigns have been two contributing factors to the increasing share of non-traditional currencies in global reserve portfolios, while traditional factors such as diversification and trade relations with the issuers of non-traditional reserve currencies have been less relevant.
1 INTRODUCTION
Foreign exchange reserve holdings of central banks are traditionally invested in liquid financial
assets denominated in the major floating currencies, namely the US dollar, the euro and – to a
lesser extent – the pound sterling and the yen. About 95% of all global foreign exchange reserve
holdings for which the composition is disclosed are invested in these four currencies. The fact that
these four major reserve currencies are the only units (along with the Swiss franc) reported by the
IMF in its statistics on the currency composition of official foreign exchange reserves (COFER)
further illustrates their dominant reserve currency status. In addition, these four currencies are used
to calculate the special drawing right.
The outbreak of the European sovereign debt crisis together with the credit downgrades of previously
highly-rated sovereigns have triggered growing discussions about a possible shortage of assets
perceived as safe and the potential implications for global financial stability (see Caballero, 2010;
Garcia, 2011; Gourinchas and Jeanne, 2012). Such implications may stem from the key role of
safe assets in global financial markets, including their use as a reliable store of value and reserve
instruments, as collateral in repurchase and derivatives markets, as the main vehicle to fulfil
prudential requirements and as a benchmark for the pricing of other financial assets (IMF, 2012).
Against this backdrop, there is tentative evidence that central banks have recently started to diversify
part of their reserve portfolios into non-traditional currencies, albeit in still modest amounts.
These “other” currencies (i.e. other than the US dollar, euro, pound sterling, yen and Swiss franc)
accounted for more than 6% of global reserve holdings at the end of 2012, according to the IMF
COFER data, standing at a four-decade high. In addition, the Australian dollar and the Canadian
dollar are planned to be reported as separate items in these data. Many market participants consider
16 Prepared by Roland Beck and Arnaud Mehl.
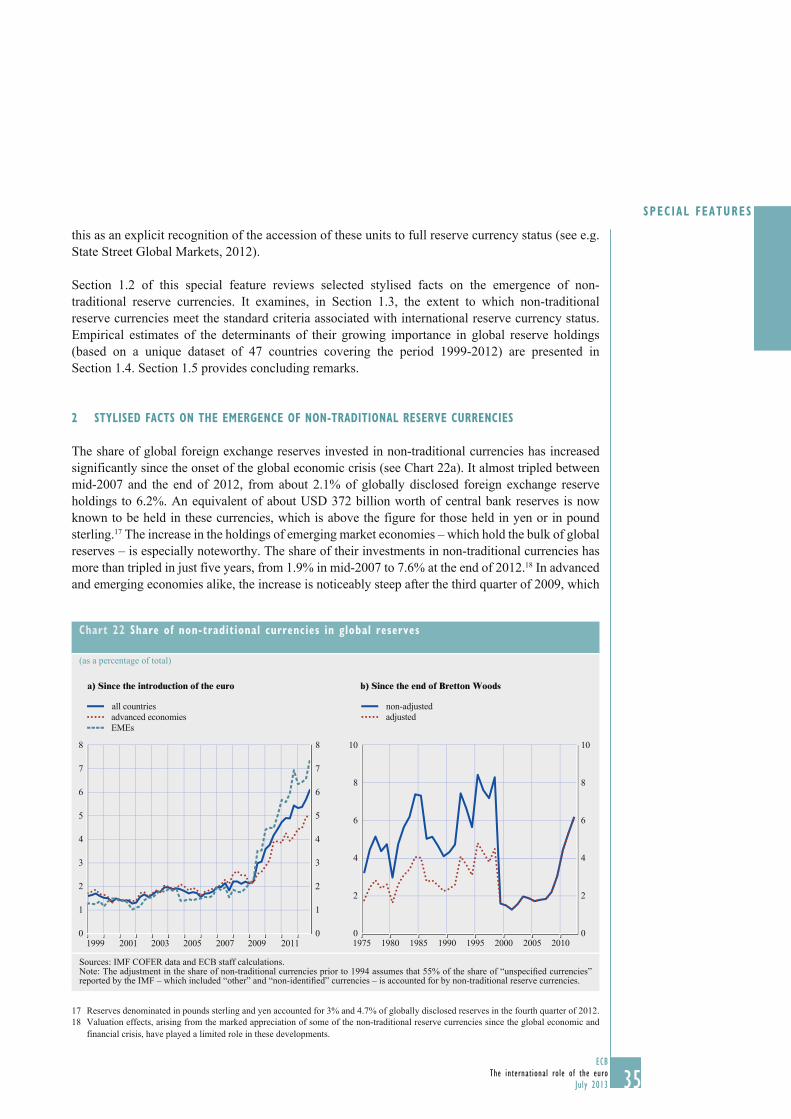
35ECB
The international role of the euro
July 2013 35
SPECIAL FEATURES
35
this as an explicit recognition of the accession of these units to full reserve currency status (see e.g.
State Street Global Markets, 2012).
Section 1.2 of this special feature reviews selected stylised facts on the emergence of non-
traditional reserve currencies. It examines, in Section 1.3, the extent to which non-traditional
reserve currencies meet the standard criteria associated with international reserve currency status.
Empirical estimates of the determinants of their growing importance in global reserve holdings
(based on a unique dataset of 47 countries covering the period 1999-2012) are presented in
Section 1.4. Section 1.5 provides concluding remarks.
2 STYLISED FACTS ON THE EMERGENCE OF NON-TRADITIONAL RESERVE CURRENCIES
The share of global foreign exchange reserves invested in non-traditional currencies has increased
significantly since the onset of the global economic crisis (see Chart 22a). It almost tripled between
mid-2007 and the end of 2012, from about 2.1% of globally disclosed foreign exchange reserve
holdings to 6.2%. An equivalent of about USD 372 billion worth of central bank reserves is now
known to be held in these currencies, which is above the figure for those held in yen or in pound
sterling.17 The increase in the holdings of emerging market economies – which hold the bulk of global
reserves – is especially noteworthy. The share of their investments in non-traditional currencies has
more than tripled in just five years, from 1.9% in mid-2007 to 7.6% at the end of 2012.18 In advanced
and emerging economies alike, the increase is noticeably steep after the third quarter of 2009, which
17 Reserves denominated in pounds sterling and yen accounted for 3% and 4.7% of globally disclosed reserves in the fourth quarter of 2012.
18 Valuation effects, arising from the marked appreciation of some of the non-traditional reserve currencies since the global economic and
financial crisis, have played a limited role in these developments.
Chart 22 Share of non-traditional currencies in global reserves
(as a percentage of total)
a) Since the introduction of the euro b) Since the end of Bretton Woods
0
1
2
3
4
5
6
7
8
0
1
2
3
4
5
6
7
8
1999 2001 2003 2005 2007 2009 2011
all countries
advanced economies
EMEs
0
2
4
6
8
10
0
2
4
6
8
10
1975 1980 1985 1990 1995 2000 2005 2010
non-adjusted
adjusted
Sources: IMF COFER data and ECB staff calculations.Note: The adjustment in the share of non-traditional currencies prior to 1994 assumes that 55% of the share of “unspecifi ed currencies” reported by the IMF – which included “other” and “non-identifi ed” currencies – is accounted for by non-traditional reserve currencies.
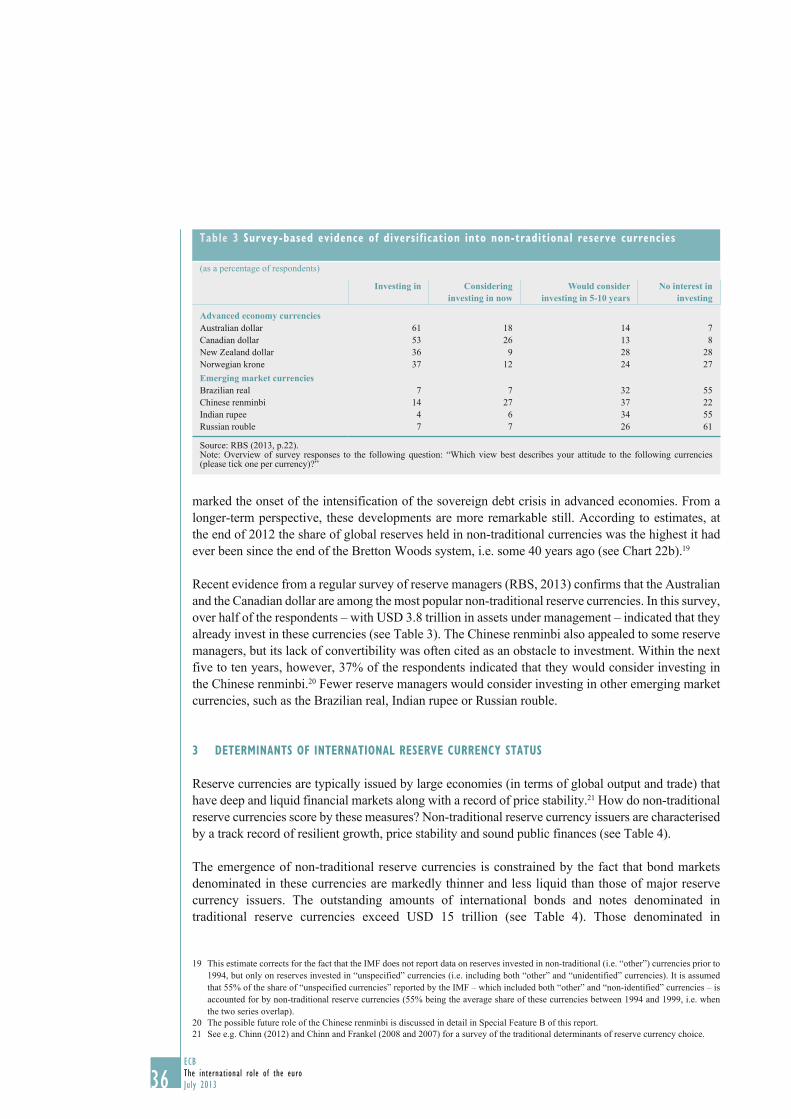
36ECB
The international role of the euro
July 20133636
marked the onset of the intensification of the sovereign debt crisis in advanced economies. From a
longer-term perspective, these developments are more remarkable still. According to estimates, at
the end of 2012 the share of global reserves held in non-traditional currencies was the highest it had
ever been since the end of the Bretton Woods system, i.e. some 40 years ago (see Chart 22b).19
Recent evidence from a regular survey of reserve managers (RBS, 2013) confirms that the Australian
and the Canadian dollar are among the most popular non-traditional reserve currencies. In this survey,
over half of the respondents – with USD 3.8 trillion in assets under management – indicated that they
already invest in these currencies (see Table 3). The Chinese renminbi also appealed to some reserve
managers, but its lack of convertibility was often cited as an obstacle to investment. Within the next
five to ten years, however, 37% of the respondents indicated that they would consider investing in
the Chinese renminbi.20 Fewer reserve managers would consider investing in other emerging market
currencies, such as the Brazilian real, Indian rupee or Russian rouble.
3 DETERMINANTS OF INTERNATIONAL RESERVE CURRENCY STATUS
Reserve currencies are typically issued by large economies (in terms of global output and trade) that
have deep and liquid financial markets along with a record of price stability.21 How do non-traditional
reserve currencies score by these measures? Non-traditional reserve currency issuers are characterised
by a track record of resilient growth, price stability and sound public finances (see Table 4).
The emergence of non-traditional reserve currencies is constrained by the fact that bond markets
denominated in these currencies are markedly thinner and less liquid than those of major reserve
currency issuers. The outstanding amounts of international bonds and notes denominated in
traditional reserve currencies exceed USD 15 trillion (see Table 4). Those denominated in
19 This estimate corrects for the fact that the IMF does not report data on reserves invested in non-traditional (i.e. “other”) currencies prior to
1994, but only on reserves invested in “unspecified” currencies (i.e. including both “other” and “unidentified” currencies). It is assumed
that 55% of the share of “unspecified currencies” reported by the IMF – which included both “other” and “non-identified” currencies – is
accounted for by non-traditional reserve currencies (55% being the average share of these currencies between 1994 and 1999, i.e. when
the two series overlap).
20 The possible future role of the Chinese renminbi is discussed in detail in Special Feature B of this report.
21 See e.g. Chinn (2012) and Chinn and Frankel (2008 and 2007) for a survey of the traditional determinants of reserve currency choice.
Table 3 Survey-based evidence of diversification into non-traditional reserve currencies
(as a percentage of respondents)
Investing in Considering investing in now
Would consider investing in 5-10 years
No interest in investing
Advanced economy currenciesAustralian dollar 61 18 14 7
Canadian dollar 53 26 13 8
New Zealand dollar 36 9 28 28
Norwegian krone 37 12 24 27
Emerging market currenciesBrazilian real 7 7 32 55
Chinese renminbi 14 27 37 22
Indian rupee 4 6 34 55
Russian rouble 7 7 26 61
Source: RBS (2013, p.22).Note: Overview of survey responses to the following question: “Which view best describes your attitude to the following currencies (please tick one per currency)?”

37ECB
The international role of the euro
July 2013 37
SPECIAL FEATURES
37
non-traditional reserve currencies including the Canadian dollar and the Australian dollar are
considerably smaller (at about USD 2 trillion).
Other factors that work against a growing role for non-traditional reserve currencies include
network externalities and lock-in effects, which tend to benefit incumbent currencies and lead to
significant inertia in the composition of global reserve portfolios.22 If reserves are mainly held
for precautionary or insurance motives – e.g. to pay for imports of goods and services, to service
external debt or to provide a cushion against sudden stops in capital flows – central banks have
limited interest in diversification. Therefore, even large reserve holdings, to the extent that they are
held for precautionary reasons, are not necessarily more diversified.23 In line with this, the build-
up in reserves by emerging economies since the Asian crisis has largely been interpreted as a shift
towards a preference for self-insurance against sudden stops in capital flows.24
Other factors might have contributed to the growing importance of non-traditional reserve
currencies in global foreign exchange reserves. One such factor might be risk and return motives,
i.e. the fact that central banks might wish to invest part of their reserves (e.g. the fraction not
held for precautionary reasons) in non-traditional currencies to enhance returns and achieve a
more diversified reserve portfolio. This is supported by a long-standing body of literature which
derives the optimal currency composition of official reserves as the solution to a mean-variance
optimisation problem à la Markowitz.25 In this framework central banks maximise the risk-adjusted
return of their reserve holdings in a similar way to private investors, albeit with a smaller risk
appetite parameter or additional hedging considerations.26 Hence central banks could invest in
non-traditional currencies if they expect attractive returns (not least since the Australian and the
Canadian dollar, for example, have both appreciated markedly in the last decade) or if they consider
these currencies helpful in lowering the variance of their portfolio because they might be negatively
correlated with traditional reserve assets.
22 See e.g. Krugman (1980) and (1984), as well as Matsuyama, Kiyotaki and Matsui (1993).
23 See e.g. Beck and Weber (2011).
24 See e.g. Aizenman and Lee (2008), Jeanne and Rancière (2011) or Obstfeld, Shambaugh and Taylor (2010), who find strong empirical
support for this hypothesis. Non-linearities might also be at play. The larger the reserve holdings of a country are, the more likely it is that
that country might move prices against its reserve positions involuntarily, and the weaker is its incentive to diversify into non-traditional
currencies.
25 See Ben-Bassat (1980) for an earlier contribution, as well as Dooley (1983), Dooley et al. (1989), Dellas and Yoo (1991), and Papaioannou
et al. (2006).
26 Beck and Rahbari (2011) consider the case where central banks hedge against sudden stops in capital inflows.
Table 4 Reserve currency characteristics
Indicator Unit Traditional reserve currency issuers
Non-traditional reserve currency issuers
Size of the economy GDP, USD billions (2011) 37,104 4,132
Size of the trade sector Exports plus imports, USD billions (2011) 19,859 2,603
Size of bond market USD billions (2012 Q2) 72,507,331 5,153,637
Size of international bond market USD billion (2012 Q4) 15,162 2,046
Infl ation CPI, average (January 1999 – September 2012) 1.4 2.1
GDP growth Average (1999-2011) 1.6 2.5
Sovereign rating Long-term foreign currency rating by S&P AA+ AAA
General government gross debt (percentages of GDP) 114.6 50.3
Sources: IMF, World Bank, BIS, Standard and Poor’s and ECB calculations.Notes: Traditional reserve currency issuers include the United States, the euro area, Japan, Switzerland and the United Kingdom. Non-traditional reserve currency issuers include Australia, Canada, Norway and Sweden. Both aggregates show unweighted averages or sums in the case of size measures. The size of the bond market refers to total debt securities issued by residents in the respective countries, irrespective of the currency of denomination.
38ECB
The international role of the euro
July 20133838
Mercantilist motives might be a further factor. The recent accumulation of foreign reserves in
non-traditional currencies may arise from concerns about export competitiveness losses vis-à-
vis countries issuing these currencies. Such motives also seem to partly explain the large build-
up in foreign exchange reserves in emerging economies in recent years (see e.g. Dooley et al.,
2003). Given that trade linkages with countries issuing non-traditional reserve currencies have
strengthened (with several of them being commodity producers which face growing demand from
emerging economies), the incentive to increase portfolio exposure to these currencies might, in
turn, increase.27 The fact that several non-traditional reserve currencies have appreciated strongly
over the last decade works prima facie against the hypothesis that competitiveness concerns have
become more pressing, however.
A final factor might stem from the tight risk management standards typically applied in central
bank reserve management in connection with recent changes in risk appetite in foreign exchange
markets and perceptions of increased credit risk among the traditional issuers of reserve currencies.
In the recent period non-traditional reserve currency issuers have, on average, received higher
sovereign credit ratings than traditional reserve currency issuers (see Table 4). In addition, survey-
based evidence suggests that the euro area sovereign debt crisis, along with the downgrading of
US government debt by one rating agency, has triggered a “profound debate about the future of
reserve management” (RBS, 2012, p. 1). As this survey evidence puts it, challenges regarding the
two major reserve currencies have “sharply increased interest in non-traditional currencies” (ibid).
It also suggests that such considerations are indeed taken into account by central bank reserve
managers.28
4 EMPIRICAL ESTIMATES
In order to shed light on the relative importance of alternative potential explanations for the rising
importance of non-traditional reserve currencies, Table 5 reports panel estimates of the determinants
of the share of non-traditional reserve currencies in a sample of 47 countries – i.e. all countries that
publish data on their holdings of reserves denominated in currencies other than SDR currencies –
over the period 1999-2012.29 The estimates include standard determinants of reserve currency
choice, namely persistence, stability and liquidity metrics. They also include a range of alternative
determinants relating to (i) precautionary, (ii) mercantilist and (iii) diversification motives, as well
as to (iv) changes in risk appetite in foreign exchange markets and in perceptions of the credit risk
of advanced economy sovereigns.30 Finally, the estimates control for fixed effects and time effects.
The overall model explains reasonably well the heterogeneity of the share of non-traditional
currencies over time and across countries (fitting about 80% of the latter’s variance; see also
Chart 23). Persistence is found to exert a statistically significant effect, confirming the relatively
27 Heller and Knight (1978) find that a country’s exchange rate regime and its trade patterns are significantly related to the currency
composition of its reserves. Dooley et al. (1989) and Eichengreen and Mathieson (2000) find similar evidence for such a trade channel,
as well as for a financial channel in the form of the currency composition of external debt or financial flows. Dellas and Yoo (1991) note,
however, that the currency composition of reserves should be related to the currency denomination of imports.
28 78% of respondents to the survey also indicated that the euro area sovereign debt crisis had “impacted” their reserve management strategy.
Moreover, 8% of respondents stated that the S&P rating downgrade of the United States in August 2011 had put the reserve currency
status of the US dollar “at risk”.
29 Such data are made publicly available in the framework of the IMF’s Data Template on International Reserves and Foreign Currency
Liquidity and may include reserves denominated in the Swiss francs, which is considered a traditional reserve currency. However, the
IMF data on the currency composition of global foreign exchange reserves suggest that the share of Swiss franc holdings in total reserves
is relatively small.
30 In an alternative specification, it is shown that the VIX as an indicator of risk aversion related to global stock market volatility is not
statistically significant, in contrast to a more narrow measure of risk appetite in foreign exchange markets.

39ECB
The international role of the euro
July 2013 39
SPECIAL FEATURES
39
prudent portfolio management style of central bank reserve managers. Stability and liquidity are
both found to have effects in line with theoretical priors (higher inflation reduces the share of non-
traditional currencies; greater liquidity increases it), albeit statistically insignificant. Alternative
determinants relating to precautionary, mercantilist and diversification motives are not found to
exert statistically significant effects either. This contrasts with changes in risk appetite in foreign
exchange markets and in perceptions of credit risk among the issuers of traditional reserve
currencies, which are both found to have statistically significant and economically meaningful
effects.31 The aforementioned results are robust to the inclusion of additional control variables
such as the VIX index, an EMU membership dummy variable, terms of trade, imports relative to
31 As a metric of the former, the carry-to-risk ratios (based on a long Australian dollar/Canadian dollar-short yen position) and, as a metric of
the latter, the differential between the sovereign CDS spreads of traditional reserve currency issuers (average of the United States, the euro
area, Japan, the United Kingdom and Switzerland) relative to that of the (average) Australian and Canadian sovereigns are used.
Table 5 Panel estimates of determinants of the share of non-traditional reserve currencies
(47 countries; 1999-2012)
Standard Precautionary Mercantilist Diversifi cation Perceived safety(1) (2) (3) (4) (5) (6) (7) (8) (9)
Persistence 0.838*** 0.838*** 0.751*** 0.838*** 0.864*** 0.510*** 0.837*** 0.838*** 0.752***
(0.063) (0.063) (0.120) (0.063) (0.074) (0.176) (0.064) (0.063) (0.062)
Stability -0.096 -0.095 0.112 -0.202 -0.467 -0.487 -0.200 0.206 -0.249
(0.607) (0.608) (0.289) (0.575) (0.457) (0.321) (0.426) (0.575) (0.581)
Liquidity 0.770 0.760 1.182* 0.717 0.954* 1.099** 0.714
(0.984) (0.999) (0.631) (0.947) (0.495) (0.513) (1.038)
Bilateral imports 0.021
(0.134)
External debt -0.016
(0.038)
Export growth 0.006
(0.016)
Overvaluation 0.018
(0.025)
Excess reserves 0.037
(0.071)
Hedging -0.090
(1.339)
Risk appetite -0.023*
(0.013)
Credit risk 0.019*
(0.012)
Constant -1.339 -1.365 -3.671 -0.880 -1.363 2.064** -2.698 -1.164 2.310*
(3.247) (3.224) (2.387) (3.708) (2.119) (0.845) (2.320) (3.972) (1.220)
Observations 461 461 246 461 392 172 461 461 379
R2 (overall) 0.823 0.826 0.728 0.826 0.803 0.645 0.823 0.826 0.809
Sources: Beck and Mehl (2013).Notes: Estimates obtained with a fi xed effect estimator and controlling for time effects. The standard errors reported in brackets are robust to heteroskedasticity and clustered heterogeneity; *** p<0.01, ** p<0.05, * p≤0.11.Persistence: lag of the share of non-traditional reserve currencies. Stability: domestic infl ation in Australia and Canada. Liquidity: share of Canada and Australia in the global stock of debt securities. Bilateral imports: imports from Australia and Canada to total imports. External debt and export growth: external debt-to-GDP ratio and nominal export growth in USD. Overvaluation: real effective exchange rate deviation from a time trend. Excess reserves: residual of a regression of reserves-to-GDP on a range of precautionary and mercantilist determinants of reserve accumulation. Hedging: average correlation coeffi cient between returns in AUD-USD and CAD-USD, on the one hand, and EUR-USD, on the other hand. Risk appetite: carry-to-risk ratios (long AUD-USD/CAD-USD short JPY/USD) for the three-month maturity. Credit risk: differential of the CDS sovereign spreads of major reserve currency issuers (United States, euro area, Japan and United Kingdom) relative to those of Australia and Canada. See Beck and Mehl (2013) for more details on the estimation and the results, as well as for robustness checks and sensitivity tests.

40ECB
The international role of the euro
July 20134040
GDP and exchange rate flexibility. With respect to potential endogeneity, system GMM estimates
suggest that relations between the variables may not necessarily be causal, however.32
Chart 24 gives more indications of the magnitudes involved. It shows the estimated short-term
and long-term impacts (in percentage points) on the share of non-standard reserve currencies
of (i) a two-thirds decline in risk appetite in foreign exchange markets and (ii) a 50 basis point
widening in the sovereign CDS spreads of major reserve currency issuers relative to those of
Australia and Canada (two scenarios fairly close to actual developments during the crisis).
The estimated effects are large.33 Higher risk aversion in foreign exchange markets is associated
with an almost 2 percentage point increase in the share of non-standard currencies in the short
term (and 7 percentage points in the long term). Perceptions of a heightened credit risk for
major reserve currency issuers are associated with about a 1 percentage point increase in the
share of non-standard currencies in the short term (and 5 percentage points in the long term).
This is broadly comparable with the actual increase in the share of non-traditional reserve
currencies, i.e. about 5 percentage points in our sample between 2007 and 2012, hence
underscoring that higher risk aversion in foreign exchange markets and perceptions of a
32 Owing to instrument proliferation arising from the relatively small number of cross-sectional units relative to the time dimension of the
panel dataset, these system GMM estimates should be interpreted with caution, however.
33 The effects shown in Chart 28 stem from separate ceteris paribus exercises. They are therefore not additive and cannot be considered to be
contributions if the explanatory variables are correlated.
Chart 23 Model fit
0 20 40 60
0
20
-20
40
60
80
0
20
-20
40
60
80
non-SDR currencies (% of FX reserves)
OLS line
x-axis: model-based estimates
y-axis: actual shares
Sources: Beck and Mehl (2013).Note: The chart plots the average share of non-standard currencies in foreign exchange reserve holdings across all country-year observations for a sample of 47 countries between 1999 and 2012 against the fi tted share obtained with the benchmark model estimates.
Chart 24 Estimated impact on the share of non-standard reserve currencies
(percentage points)
50 bp CDS spread widening2/3 carry attractiveness decline0
2
4
6
8
0
2
4
6
8
short term
long term
y-axis: increase in non-SDR currencies’ share (p.p.)
Sources: Beck and Mehl (2013).Note: The chart shows the estimated short-term and long-term impact (in percentage points) on the share of non-standard currencies in the foreign exchange reserves of the sample’s 47 countries of changes in risk appetite in foreign exchange markets and in perceptions of credit risk among issuers of traditional reserve currencies under two scenarios: (i) a two-thirds decline in carry trade attractiveness and (ii) a 50 basis point widening in the differential of the CDS sovereign spreads of major reserve currency issuers relative to those of Australia and Canada.

41ECB
The international role of the euro
July 2013 41
SPECIAL FEATURES
41
heightened credit risk for some advanced economy sovereigns have been two contributing factors
to the increasing share of non-traditional currencies in global reserve portfolios.
5 CONCLUDING REMARKS
Within the investment universe of globally safe assets, which has become smaller owing to rating
downgrades of major advanced economies, the share of non-traditional reserve currencies in
global foreign exchange reserves (among countries which disclose such information) has increased
markedly since 2009, albeit from a low level. The results presented in this special feature tentatively
suggest that this increase cannot be explained by traditional factors which used to largely determine
the portfolio allocation of central bank reserves. In particular, precautionary reserve holdings,
for example due to trade relations with the issuers of non-traditional reserve currencies, do not
appear to be associated with the increase in non-traditional reserve holdings. Reserve portfolio
diversification – which was put forward as one way to reduce the cost of large reserve holdings
prior to the crisis – does not explain the increase in non-traditional reserve holdings either.
Two other factors which appear to be more novel drivers of reserve currency choice appear to
largely explain the increase in non-traditional reserve holdings: perceptions of increased credit risk
among the traditional issuers of reserve currencies and risk aversion in foreign exchange markets,
both of which have intensified since 2009.
Overall, the use of new reserve currencies such as the Australian and the Canadian dollar reflects
temporary and structural factors alike. The lack of large, deep and liquid financial markets limits
their potential to become truly major reserve currencies, however. In addition, the growing use
of such currencies might decelerate to the extent that market conditions normalise and all major
advanced economy sovereigns introduce and implement ambitious and credible medium-term fiscal
consolidation plans.
REFERENCES
Beck, R. and Mehl, A. (2013), “Global safe asset shortage, non-traditional reserve currencies and
the global financial crisis”, ECB mimeo, Frankfurt am Main.
Beck, R. and Rahbari, E. (2011) “Optimal Reserve Composition in the Presence of Sudden Stops”,
Journal of International Money and Finance 30 (2011) 1107-1127.
Beck, R. and S. Weber (2011), “Should larger reserve holdings be more diversified?” International Finance, 14(3), pp. 415–444.
Ben-Bassat, A. (1980), “The optimal composition of foreign exchange reserves”, Journal of International Economics, 10, pp. 285–295.
Caballero, R. (2010), “Understanding the global turmoil: It’s the general equilibrium, stupid”, Vox,
21 May 2010.
42ECB
The international role of the euro
July 20134242
Chinn, M. (2012),“A note on reserve currencies with special reference to the G-20 Countries”,
prepared for the International Growth Centre, India Central Programme, 24 April 2012.
Chinn, M. and J. Frankel (2008), “Why the dollar will rival the euro”, International Finance, 11(1),
pp. 49-73.
Chinn, M. and J. Frankel (2007), “Will the euro eventually surpass the dollar as leading
international reserve currency?” in R. Clarida (ed.), G7 Current Account Imbalances: Sustainability and Adjustment (Chicago: University of Chicago Press), pp. 285-322.
Dellas, H. and C.B. Yoo (1991), “Reserve currency preferences of central banks: the case of
Korea”, Journal of International Money and Finance, 10, pp. 406–419.
Dooley, M. (1983), “An analysis of the management of the currency composition of reserve
assets and external liabilities of developing countries” in Aliber, R. (ed.), The Reconstruction of International Monetary Arrangements, Macmillan, Basingstoke.
Dooley, M., S. Lizondo and D. Mathieson (1989), “The currency composition of foreign exchange
reserves”, International Monetary Fund Staff Papers, 36(2), pp. 385–434.
Dooley, M., D. Folkerts-Landau and P. Garber (2003), “An essay on the revived Bretton Woods
system”, NBER Working paper, No 9971.
Eichengreen, B. and D. Mathieson (2000), “The currency composition of foreign exchange reserves:
retrospect and prospect”, IMF Working Paper, No 131, Washington DC.
Garcia, C. (2011), “The decline of safe assets”, Financial Times, Alphaville, 5 December 2011.
Gourinchas, P. O. and O. Jeanne (2012), “Global safe assets”, paper prepared for the XIth
BIS Annual Conference held in Lucerne, 20-21 June 2012, mimeo, UC Berkeley and Johns
Hopkins University.
Heller, H. and M. Knight (1978), “Reserve currency preferences of central banks”, Essays in
International Finance, No 131, Princeton.
International Monetary Fund (2012), “Safe assets: Financial system cornerstone?”, Global Financial
Stability Report, chapter 3, April, Washington, DC.
Jeanne, O. (2007), “International reserves in emerging market countries: too much of a good
thing?”, Brookings Papers in Economic Activity, Economic Studies Program, The Brookings
Institution, pp. 1-80.
Jeanne, O. and R. Ranciere (2011), “The optimal level of international reserves for emerging market
countries: a new formula and some applications”, Economic Journal, 121(555), pp. 905-930.
Krugman, P. (1980), “Vehicle currencies and the structure of international exchange”, Journal of Money, Credit and Banking, 12(3), pp.513-526.

43ECB
The international role of the euro
July 2013 43
SPECIAL FEATURES
43
Krugman, P. (1984), “The international role of the dollar: theory and prospects”, in Exchange Rate Theory and Practice, edited by J. Bilson and R. Marston (Chicago: University of Chicago Press).
Matsuyama, K., N. Kiyotaki and A. Matsui (1993), “Toward a theory of international currency”,
Review of Economic Studies, 60, pp. 283-307.
Lane, P. and J. Shambaugh (2010), “Financial exchange rates and international currency exposures”,
American Economic Review, 100(1), pp. 518-40.
Lim, E.-G. (2006), “The euro’s challenge to the dollar: different views from economists and
evidence from COFER and other data”, IMF Working Paper, No 06/153, Washington DC.
Lim, E.-G. (2007), “Do reserve portfolios respond to exchange rate changes using a portfolio
rebalancing strategy? An Econometric Study Using COFER Data”, IMF Working Paper, No 07/293.
Obstfeld, M., J. Shambaugh and A. Taylor (2010), “Financial stability, the trilemma, and
international reserves”, American Economic Journal: Macroeconomics, 2 (2), pp. 57–94.
Papaioannou, E., R., Portes and G. Siourounis (2006), “Optimal currency shares in international
reserves: the impact of the euro and the prospects for the dollar”, Journal of the Japanese and International Economies, 20(4), pp. 508–547.
RBS (2012), RBS Reserve Management Trends 2011, Central Banking Publications.
RBS (2013), RBS Reserve Management Trends 2012, Central Banking Publications.
State Street Global Markets (2012), “Small dollars make it into the big league”, Global Markets Today, 20 November 2012.
Roger, S. (1993), “The management of foreign exchange reserves”, BIS Economic Papers,
No 38, Basel.
Wong, A. (2007), “Measurement and inference in international reserve diversification”, Peterson Institute for International Economics Working Paper, No 07-6, Washington DC.

44ECB
The international role of the euro
July 201344
B THE EMERGENCE OF THE CHINESE RENMINBI AS AN INTERNATIONAL CURRENCY34
In view of China’s rapid economic development and the recent measures taken by the Chinese authorities to enable the international use of the Chinese renminbi (RMB), some observers have argued that the latter could become an important international currency over the medium term, alongside the US dollar and the euro, which could possibly lead to the emergence of a tri-polar international monetary system. This special feature takes stock of recent developments in the international use of the renminbi, discussing drivers and challenges, and updates the analysis presented in earlier releases of this review. Overall, the special feature finds that China’s growing weight in global output and trade, together with policy measures taken by the Chinese authorities, have led to an increasing use of the Chinese currency in international trade and, to a lesser extent, international financial markets. However, the lack of sufficiently deep and liquid domestic financial markets, financial restrictions and remaining capital controls, as well as constraints regarding exchange rate flexibility, hamper the development of the renminbi as an international currency, and in particular as a reserve currency. However, it is conceivable that the renminbi could play an increasingly prominent international role over the medium term to the extent that the Chinese authorities continue to gradually introduce domestic financial sector reforms, liberalise the capital account and strengthen exchange rate flexibility.
1 INTRODUCTION
In view of China’s rapid economic development and the recent measures taken by the Chinese
authorities to remove obstacles to the international use of the renminbi, some observers have
argued that the latter could become a prominent international currency over the medium term,
alongside the US dollar and the euro, which could possibly lead to the emergence of a tri-polar
international monetary system.35 Some observers have argued that the renminbi could play a
prominent international role within the next 15 to 20 years (see e.g. Eichengreen, 2012, for a review
of the debate). The Chinese authorities have already taken several steps to allow the international
use of the renminbi as a trade invoicing and settlement currency, in particular. At the same time,
the renminbi’s international role has also developed along several other dimensions, including
as an international investment and financing currency. This special feature takes stock of recent
developments in the international role of the renminbi (Section 2.2), reviews economic and policy-
driven determinants of this role (Section 2.3) and assesses the challenges ahead if the renminbi is to
play a still more prominent role in the international monetary system (Section 2.4).
2 RECENT DEVELOPMENTS IN THE INTERNATIONAL USE OF THE CHINESE RENMINBI
The gradual internationalisation of the renminbi is particularly visible in its growing use as an
invoicing and settlement currency for China’s international trade transactions, in line with China’s
significant integration into global trade. While the US dollar remains the dominant settlement
currency of China’s international trade transactions to date, the use of the renminbi has grown
significantly in just a few years, inspired by the desire to reduce the foreign exchange exposure of
Chinese companies. Between 2010 and the end of 2012, the share of China’s trade in goods settled
in renminbi increased from essentially nought to almost 10% (see Chart 25).
34 Prepared by Roland Beck, Georgios Georgiadis and Arnaud Mehl with comments by Michel Soudan.
35 See ECB (2012) for a review of this debate.

45ECB
The international role of the euro
July 2013 45
SPECIAL FEATURES
45
As non-Chinese resident companies started to accumulate renminbi payments in exchange for
exports to China, the renminbi’s growing use as an international settlement currency also gave
impetus to its use as an international deposit currency. Renminbi-denominated deposits in Hong
Kong have grown steeply since 2004, reaching roughly USD 100 billion in 2011 (see Chart 26).36
In turn, the international issuance of renminbi-denominated bonds has risen strongly since 2007
(see Chart 27). Although the bulk of issuance of such bonds is still accounted for by firms originating
from China or Hong Kong (see Chart 28)37, several non-Chinese multinational companies have also
issued so-called “dim sum” bonds in Hong Kong, thereby offering an investment opportunity for
non-resident renminbi deposit holders. Furthermore, non-financial firms from mainland China have
launched initial public offerings in Hong Kong. In addition, international development organisations
have issued renminbi-denominated bonds in mainland China (also known as “panda” bonds), and
London, Singapore and Taipei have taken steps to develop their own renminbi financial centres.
The international use of the renminbi as a reserve currency is significantly more limited thus far,
mainly reflecting the fact that it is still largely inconvertible for investment purposes. Only a few
central banks have started to add renminbi-denominated assets to their reserve holdings, as part of
bilateral agreements with China, although the amounts – which remain confidential – are believed to
be marginal to date.38
36 Renminbi deposits in Hong Kong have stabilised recently owing to a greater use of the renminbi to pay for imports from China, thereby
creating more, although not fully, balanced payment flows. The emergence of expectations of a depreciation of the renminbi vis-à-vis the
US dollar during 2012 also played a role.
37 BIS data based on the residence of issuer reveal similar trends, although the assessment of issuer distribution is complicated by the fact
that many Chinese firms issue renminbi-denominated bonds via subsidiaries registered in small financial offshore centres, such as the
Cayman Islands.
38 According to IMF guidelines, only assets denominated in convertible currencies count as foreign exchange reserves. The central banks of
a few countries are reported to have added renminbi assets to their foreign exchange reserve portfolios, while others have said that they
would consider adding renminbi-denominated reserves to their reserve portfolios. In a recent survey of reserve managers, 37% of the
respondents indicated that they would consider investing in the renminbi within the next five to ten years (RBS, 2013).
Chart 26 RMB-denominated deposits in Hong Kong
(RMB billions; as a percentage of total deposits)
0
100
200
300
400
500
600
700
0
2
4
6
8
10
12
2004 2005 2006 2007 2008 2009 2010 2011 2012
share of RMB deposits in total deposits
in Hong Kong (left-hand scale)
RMB deposits in Hong Kong (right-hand scale)
Sources: CEIC and Hong Kong Monetary Authority.
Chart 25 Share of RMB-denominated settlements in China’s trade in goods
(as a percentage)
0
2
4
6
8
10
0
2
4
6
8
10
Mar.2010 2011 2012
Sep. Mar. Sep. Mar. Sep.
Sources: CEIC and People’s Bank of China.

46ECB
The international role of the euro
July 20134646
Despite its rapid development, the use of the renminbi in trade and financial transactions in Asia
remains limited compared with the US dollar, which is still the main international currency in the
region. For example, 80% of the trade settled in renminbi is between mainland China and Hong
Kong, partly reflecting processing trade. Settlement of exports to China denominated in renminbi
is also larger than renminbi-denominated settlement of imports from China, which some observers
consider to be evidence that the use of China’s currency as a settlement unit might be driven by
expectations of a future appreciation of the renminbi (see Prasad and Ye, 2012, and Yu, 2012).
There is thus still some way to go until the renminbi fulfils the regional role of an international
currency in Asia.
3 DETERMINANTS OF THE GROWING INTERNATIONAL USE OF THE RENMINBI
International currency status can largely be explained by persistence, economic size, the stability of
the value of the currency (measured against either a basket of currencies or a basket of goods), and
the depth and liquidity of financial markets.39
With respect to economic size, the growing international use of the renminbi results first and
foremost from the increasing importance of China in the global economy. In 2010 China overtook
Japan as the second largest economy behind the United States in PPP-adjusted terms. Projections
suggest that China could overtake the United States as the largest economy by 2016 (see IMF
39 For a policy-oriented review of international currency status, see BIS (2011). Academic reviews in this context include Chinn (2012) and
Chinn and Frankel (2007, 2008).
Chart 27 Amount of international RMB-denominated bonds and notes outstanding
(USD billions; as a percentage)
0.00
0.05
0.10
0.15
0.20
0.25
0.30
0
10
20
30
40
50
60
70
2005 2006 2007 2008 2009 2010 2011 2012
stock of RMB-denominated international bonds
and notes (left-hand scale)
share of RMB-denominated bonds
and notes in international debt security markets
(right-hand scale)
Source: BIS.
Chart 28 Dim sum bond issuance
(USD billions)
0
10
20
30
40
50
0
10
20
30
40
50
2007 2008 2009 2010 2011 2012
total dim sum bond issuance
non-mainland CHN/non-HKG issuers
Source: Bloomberg.Note: Bloomberg’s “country risk” indicator is used to determine the economic residence of the issuer.

47ECB
The international role of the euro
July 2013 47
SPECIAL FEATURES
47
WEO, 2012).40 China also accounts for 9% of global trade, closely behind the United States, which
accounts for 11%. In terms of price stability, the level of inflation in China and its volatility have
been relatively moderate in recent years and this is expected to continue.41 The development of deep,
liquid and broad domestic financial markets,
on the other hand, remains a key challenge
for the internationalisation of the renminbi
(see below).42
A particular feature of the growing international
use of the renminbi – which is typically not
taken directly into account by empirical models
of international currency use – is the key
role played by supporting policies aimed at
liberalising China’s current and capital account
as well as fostering the international use of the
renminbi. For example, in 2009 a pilot project
for settling trade in renminbi was initiated.
It was initially limited to a small number of
Chinese cities, firms and trading partners,
40 Similarly, OECD projections suggest that China will overtake the US economy in 2018. There are ongoing discussions about the
plausibility of the assumptions underlying these projections (see Subramanian, 2011; Eichengreen, 2013).
41 The People’s Bank of China does not have a precise medium-term inflation target, but gears its monetary policy towards balancing
stable but relatively fast growth and supporting China’s reform process while maintaining a stable price level and managing inflation
expectations.
42 Financial development and liquidity are also among the criteria considered for currencies to be included in the SDR basket (see e.g. IMF,
2011a).
Table 6 Overview of bilateral swap agreements signed by the People’s Bank of China
Partner country Date Observation AmountRMB billions USD billions
Korea 12/2008 Renewed (10/2011) 360 57
Hong Kong 01/2009 Renewed (11/2011) 400 63
Malaysia 02/2009 Renewed (02/2012) 180 29
Belarus 03/2009 20 3
Indonesia 03/2009 100 15
Argentina 04/2009 70 10
Iceland 06/2010 3.5 1
Singapore 07/2010 Renewed (03/2013) 300 22
New Zealand 04/2011 25 4
Uzbekistan 04/2011 0.7 0
Mongolia 04/2011 Expanded (03/2012) 10 2
Kazakhstan 06/2011 7 1
Thailand 12/2011 70 11
Pakistan 12/2011 10 2
United Arab Emirates 01/2012 35 6
Turkey 02/2012 10 2
Australia 03/2012 200 31
Ukraine 06/2012 15 2
Brazil 03/2013 190 30
United Kingdom Under discussion (02/2013)
Total 2,006.2 289
Source: People’s Bank of China.
Table 7 Liquidity of Chinese government bond markets
(percentages)
Stock Turnover Ratio(percentages)RMB billions
2000 1,574 13 1
2002 2,716 95 3
2004 4,717 805 17
2006 8,271 2,149 26
2008 13,187 10,373 79
2010 15,906 15,312 96
2012 17,200 12,950 75
Sources: AsianBondsOnline and ECB staff calculations.Notes: Turnover is defi ned as the value of bonds traded on the secondary market. The turnover ratio is defi ned as total turnover divided by the amount of bonds and notes outstanding in the corresponding year.

48ECB
The international role of the euro
July 20134848
but was extended in 2012 so that (almost) all of China’s trade can now be settled in renminbi.
The Chinese authorities have also developed a network of bilateral swap agreements between the
People’s Bank of China and foreign central banks (see Table 6). These facilities are mainly intended
to provide renminbi liquidity for situations in which foreign importers are temporarily unable to
obtain renminbi for the settlement of trade transactions with Chinese exporters (see Ito, 2011). So
far only marginal amounts have been drawn from these swap lines (Prasad and Ye, 2012).43
The Chinese authorities have also adopted measures to support the use of the renminbi in financial
markets in mainland China and Hong Kong, as well as to liberalise China’s capital account.
Policy initiatives undertaken by China’s authorities have focused on (i) promoting Hong Kong
as an offshore renminbi financial centre (by using its position as a financial hub and as an entry
point to mainland China’s financial markets; see Vallée, 2012); (ii) increasingly allowing selected
Hong Kong-based subsidiaries of Chinese investment firms to invest limited amounts of renminbi
raised offshore in specific assets in mainland China; (iii) promoting the use of the renminbi as
a reserve currency for foreign central banks. To that end, the authorities have taken a host of
measures, ranging from streamlining application procedures to allowing issuance of renminbi-
denominated bonds by foreign institutions in mainland China (see Table 8). There have also been
important bilateral policy initiatives, such as the agreement announced by China and Japan in
December 2011 to liberalise bilateral financial flows.44 In particular, the agreement involves the
development of direct exchange markets in yen and renminbi, allowing Japanese firms to undertake
renminbi-denominated foreign direct investment vis-à-vis subsidiaries in mainland China and to
issue renminbi-denominated bonds in Tokyo. The agreement also allows the Japanese authorities to
invest in Chinese government bonds.
43 In December 2012 the People’s Bank of China and the Bank of Korea agreed to use their swap line more actively as a trade financing
facility.
44 The agreement also involved measures to facilitate trade settlement in renminbi and yen.
Table 8 Overview of policy measures aimed at fostering the use of the renminbi in international trade and financial transactions
Date Content
January 2003 Qualifi ed Foreign Institutional Investor (QFII) scheme for foreign investment in listed mainland China bonds
and equities
February 2004 Hong Kong banks permitted to offer RMB personal accounts to residents
February 2005 Eligible international development organisations allowed to issue RMB-denominated (“panda”) bonds in mainland
China
April 2006 Qualifi ed Domestic Institutional Investor (QDII) programme allowing domestic institutions to convert RMB into
foreign currency and invest in overseas equities and bonds
January 2007 Mainland China fi nancial institutions allowed to issue RMB-denominated (“dim-sum”) bonds in Hong Kong
February 2010 Foreign fi rms authorised to issue RMB-denominated bonds in Hong Kong
August 2010 Foreign central banks, offshore RMB clearing banks and participating banks allowed to invest RMB raised offshore
in mainland China interbank bond market
January 2011 Mainland China fi rms allowed to apply to take RMB offshore for overseas direct investment in foreign fi rms
October 2011 Rules formalised to allow approved foreigners to invest RMB raised offshore directly in mainland China fi rms,
including through the provision of RMB cross-border loans
December 2011 RMB Qualifi ed Foreign Institutional Investor (RQGFII) scheme allowing RMB raised offshore to be invested
in mainland China bonds and equities
May 2012 Rules formalised for onshore non-fi nancial corporations to issue RMB-denominated bonds offshore
March 2013 RQFII quota applying to offshore RMB that can be re-invested in mainland China fi nancial markets increased;
group of eligible investors as well as range of assets broadened signifi cantly
Note: See also Cockerell and Shoory (2012) and Prasad and Ye (2012).

49ECB
The international role of the euro
July 2013 49
SPECIAL FEATURES
49
In 2011 the People’s Bank of China published a three-stage roadmap which proposes to liberalise
remaining unconvertible items according to the general sequencing principle of “inflow first
and outflow later; long-term first and short-term later; direct investment first and portfolio later;
institutional investors first and individuals later”. More recently, in May 2013 the Chinese State
Council announced that a detailed plan on renminbi capital account liberalisation, including further
measures on currency and interest rate reform, would be put forward in due course. The plan is
expected to stipulate mechanisms through which capital could move more freely in and out of China.
Some observers have described the gradual, integrated approach to financial market development
and capital account liberalisation pursued by the Chinese authorities as “crossing the river by
feeling the stones” (see Yu, 2012; Prasad and Ye, 2012). It has also been argued that the Chinese
authorities have been pursuing capital account liberalisation gradually so as not to expose shallow
domestic financial markets to volatile capital inflows. At the same time, they have liberalised
selected financial account transactions to allow foreign participation in domestic financial markets
and import technology and know-how. This careful sequencing of the liberalisation of international
transactions and domestic financial reforms is broadly in line with recent recommendations by the
IMF and empirical studies, which find that the benefits of full capital account openness can only be
reaped if a threshold level of domestic financial and institutional development has been reached.45
4 CHALLENGES RELATED TO THE INTERNATIONALISATION OF THE RENMINBI
Challenges remain as regards further developments in the internationalisation of the renminbi.
First, China still lacks to a large extent sufficiently deep, liquid and broad domestic financial
markets, which are instrumental in fostering a currency’s international role, as suggested, for
example, by the experience of the period between the First and the Second World War.46 Financial
market regulations and controls, such as deposit rate ceilings, lending rate floors and directed credit,
remain pervasive in China and restrict competition as well as the diversity of financial products
(see IMF, 2011b; Ito, 2011; Eichengreen, 2012). The liquidity of international financial assets
denominated in renminbi remains low. For instance, daily turnover in renminbi foreign exchange
markets accounts for less than 1% of total transactions, according to the latest Triennial Central
Bank Survey, conducted by the BIS in 2010. Markets for renminbi-denominated international
debt securities remain shallow compared with those in US dollars or euro, accounting for less
than 0.3% of total international debt securities. The liquidity of the Chinese government bond
market is particularly low (see Table 7). The turnover ratio of Chinese government bonds is in the
order of 100%, i.e. 14 times lower than that of US government bonds; the turnover of government
bonds in India is about twice that in China, although the absolute size of India’s market is smaller
(see Prasad and Ye, 2012).
Second, China’s financial markets remain largely closed. Foreign investment in mainland China
remains subject to quotas and tight regulations to a large extent (Vallée, 2012). It has been argued
that international demand for renminbi-denominated financial assets is likely to remain constrained
as long as investors do not have greater freedom regarding investment types and amounts undertaken
in China (Ito, 2011). The limited convertibility of China’s capital account hampers its international
financial integration, especially by comparison with other major international currency issuers,
45 See IMF (2012) and, for example, Kose et al. (2009) and Dell’Ariccia et al. (2008).
46 Financial development appears to have been a decisive factor in helping the US dollar overtake the pound sterling as the leading
international currency (see e.g. Eichengreen, 2013).

50ECB
The international role of the euro
July 20135050
in terms of both de jure and de facto integration
measures (see Chart 29).
Considering the use of the renminbi specifically
as a trade settlement currency, it is not certain
that China will manage to gradually switch from
local or vehicle currency pricing to producer
currency pricing in export settlement.47 This will
depend, among other factors, on the strength
of network effects (which favour the use of
the US dollar or the euro in many of China’s
export markets), on the degree of competition
in the export markets concerned, and hence on
the market and bargaining power of China’s
exporters.48 Japan’s experience in the 1980s
suggests that supportive policies can be
temporarily successful, as indicated by the rising
use of the yen as an invoicing currency in Japan’s
international trade transactions (see ECB, 2012).
Nevertheless, Japan’s experience also suggests
that international currency status has to be
continuously underpinned by strong economic
and financial fundamentals, given the significant decline in the yen’s share in global foreign
exchange reserves following the bursting of an asset price bubble in the 1990s and the subsequent
period of subdued economic growth.
A final question is whether China will manage to maintain rapid and sustainable growth in the
medium to longer term. Recent empirical studies have pointed to the existence of a “middle-income
trap”, i.e. a slowdown in fast-growing emerging market economies once they reach middle-income
status (see Eichengreen et al. 2012, 2013; World Bank, 2012). Sustaining rapid growth in China
will require further structural reforms to ensure a smooth transition to a growth model based more
on domestic consumption and the development of services industries than on investment, exports
and manufacturing. In turn, this is likely to require developing China’s domestic financial system,
liberalising the capital account and increasing exchange rate flexibility.
5 IMPLICATIONS OF THE RISE OF THE RENMINBI FOR THE INTERNATIONAL MONETARY SYSTEM
The rise of the renminbi to international currency status has stimulated discussions about the
implications for the future of the international monetary system (see, for example, Angeloni et
al., 2011, for a review of the debate). On the one hand, it has been argued that a move towards
a more multipolar international monetary system could increase its stability. According to this
line of argument, the existence of alternative reserve currencies would impose discipline on the
national economic policies of reserve currency issuers, alleviating the so-called “Triffin dilemma”.
In particular, the existence of alternative reserve currencies in a multipolar world would enable
investors to rebalance their international portfolios more easily should macroeconomic policies
47 For a review of the determinants of currency choice in international trade invoicing, see e.g. Goldberg and Tille (2011).
48 According to Cui et al. (2009), only around 20-30% of China’s exports could eventually be settled in renminbi.
Chart 29 Measures of international financial integration of selected economies
(percentages; percentage of GDP)
-2
-1
0
1
2
3
0
400
800
1,200
1,600
United
Kingdom
Euro area United
States
Japan China
gross external liabilities (left-hand scale)
gross external assets (left-hand scale)
Chinn-Ito index (right-hand scale)
Sources: Chinn and Ito (2003) and IMF.

51ECB
The international role of the euro
July 2013 51
SPECIAL FEATURES
51
pursued by one reserve currency-issuing economy become unsustainable (see Farhi et al., 2011).49
Moreover, it has been argued that the move to a multipolar system involving the renminbi would
mitigate exchange rate volatility by allowing investors to respond to shocks by adjusting their
renminbi as well as their US dollar or euro positions (see Bénassy-Quéré and Forouheshfar, 2013).
It has also been argued that, to the extent that the move towards a multipolar international monetary
system would involve an increase in the flexibility of the renminbi exchange rate, the accumulation
of reserves by China would be reduced, contributing to a global rebalancing and a more efficient
allocation of capital (see Bénassy-Quéré and Pisany-Ferry, 2011).50
On the other hand, it has been postulated that a move towards a multipolar international monetary
system could make the international monetary system less stable. This could be the case insofar as
a more frequent rebalancing of global investment portfolios in response to changes in perceptions
about the sustainability of economic policies in reserve-issuing countries would amplify exchange
rate volatility (see United Nations, 2009). In the presence of alternative reserve currencies,
rebalancing and precipitous capital flows could be triggered even by minor changes in fundamentals
due to asymmetric information and herding behaviour among investors (see Farhi et al., 2011).
It is therefore essential that any transition towards a multipolar international monetary
system occurs in an orderly manner so that disruptions and excessive volatility can be avoided
(see Bini Smaghi, 2011, and Constâncio, 2011).
6 CONCLUSION
China’s increasing weight in global output and trade as well as efforts by the Chinese authorities
aimed at facilitating the international use of the renminbi have led to an increasing use of the
Chinese currency in international trade and, to a lesser extent, international bond markets. At the
same time, the lack of deep and liquid domestic financial markets, tight financial market and capital
account restrictions, and limited exchange rate flexibility continue to hamper the development
of the international use of the renminbi in several respects, most notably as a reserve currency.
A further challenge relates to the question of whether China will manage to sustain rapid and
sustainable growth in the medium to longer term, insofar as international currency status is crucially
underpinned by economic dynamism, albeit only in tandem with price and financial stability.
There is potential for the renminbi to play a still more prominent international role in the medium
term, provided that the Chinese authorities continue to gradually introduce financial sector reforms,
liberalise China’s capital account and strengthen exchange rate flexibility. Historical experience
suggests that a gradual shift to a multipolar international monetary system is not inconceivable
and that network externalities, which favour the incumbent currency, are not insurmountable.
The evidence of the US dollar overtaking the pound as the leading international currency as early as
the period following the First World War, although the British currency still retained a significant
role, provides a case in point.51
49 An additional stabilising effect of the rise of the renminbi to international currency status would stem from the increase in the global
supply of reserve assets that could satisfy more easily the growing demand from emerging market economies that converge to middle
and high-income status. The existence of renminbi-denominated reserve assets would also mitigate the tensions in the international
monetary system stemming from a possible reduction in the supply of reserve assets due to the limits to fiscal capacity of the United States
(see Farhi et al., 2011).
50 Similarly, a liberalised renminbi exchange rate would reduce the potential for persistent misalignments that could distort the allocation of
capital.
51 See ECB (2012) and Chiţu, Eichengreen and Mehl (2012).

52ECB
The international role of the euro
July 20135252
REFERENCES
Angeloni, I, A. Bénassy-Quéré, B. Carton, Z. Darvas, C. Destais, L. Gauvin, J. Pisani-Ferry,
A. Sapir and S. Vallée (2011), Reforming the international monetary system: options and implications, joint Bruegel-CEPII report, April 2011.
Bank of International Settlements (2011), “Currency internationalisation: lessons from the
global financial crisis and prospects for the future in Asia and the Pacific”, proceedings of a joint
conference organised by the BIS and the Bank of Korea in Seoul on 19–20 March 2009, BIS Paper
No 61, December.
Bénassy-Quéré, A. and J. Pisani-Ferry (2011), “What International Monetary System for a Fast-
Changing World Economy?”, Bruegel Working Paper 2011/06.
Bénassy-Quéré, A. and Y. Forouheshfar (2013), “The Impact of Yuan Internationalization on the
Euro-Dollar Exchange Rate”, CESifo Working Paper 4149.
Bini Smaghi, L. (2011), “The Reform of the International Monetary System”, speech held at the
Conference in Memory of Tommaso Padoa-Schippa, 16 December, 2011, Rome.
Constâncio, V. (2011), “The Future of the International Monetary System”, speech held at the
Golden Series Lecture at the Official Monetary and Financial Institutions Forum, 23 November,
London.
Cui, L., C. Shu and J. Chang (2009), “Exchange rate pass-through and currency invoicing in
China’s exports”, China Economic Issues, Hong Kong Monetary Authority, July 2009.
Chinn (2012), “A note on reserve currencies with special reference to the G-20 countries”, mimeo,
University of Wisconsin.
Chinn, M. and J. Frankel (2007), “Will the euro eventually surpass the dollar as leading international
currency?” in G7 Current account imbalances and adjustment, University of Chicago Press,
Chicago.
Chinn, M. and J. Frankel (2008), “The euro may over the next 15 years surpass the USD as leading
international currency”, NBER Working Paper, No 13909.
Chiţu, L., B. Eichengreen and A. Mehl (2012), “When did the dollar overtake sterling as the leading
international currency? Evidence from the bond markets”, NBER Working Paper, No 18097.
Cockerell, L. and M. Shoory (2012), “Internationalising the Renminbi”, Bulletin, Reserve Bank of
Australia, June Quarter 2012.
Dell’Ariccia, G., J. Di Giovanni, A. Faria, A. Kose, P. Mauro, J. Ostry, M. Schindler,
and M. Terrones (2008), “Reaping the Benefits of Financial Globalization”, IMF Occasional Paper
No 264.
ECB (2011), The international role of the euro, July 2011, Frankfurt am Main.

53ECB
The international role of the euro
July 2013 53
SPECIAL FEATURES
53
ECB (2012), The international role of the euro, July 2012, Frankfurt am Main.
Eichengreen, B. (2012), “Number one country? Number one currency?”, World Economy Lecture,
CEPII-GEP-IFO Conference on China and the World Economy, 6-7 September 2012, Munich.
Eichengreen, B. (2013), Renminbi internationalization: Tempest in a teapot?, Asian Development
Bank Distinguished Lecture, Manila, 11 January 2013.
Eichengreen, B., D. Park and K. Shin (2012), “When fast-growing economies slow down:
international evidence and implications for China”, Asian Economic Papers, MIT Press, vol. 11(1),
pp. 42-87.
Eichengreen, B., D. Park and K. Shin (2013), “Growth slowdowns redux: new evidence on the
middle-income trap”, NBER Working Paper, No 18673.
Farhi, E., P.-O. Gourinchas and H. Rey (2011), Reforming the International Monetary System,
CEPR.
Goldberg, L. and C. Tille (2011), Micro, macro, and strategic forces in international trade Invoicing, New York Fed mimeo, September 2011.
International Monetary Fund (2011a), Criteria for Broadening the SDR Currency Basket, September.
International Monetary Fund (2011b), “People’s Republic of China: Financial System Stability
Assessment”, IMF Country Report No 11/321, November.
International Monetary Fund (2012), The Liberalization and Management of Capital Flows: An Institutional View, November.
Ito (2011), “The internationalisation of the RMB: Opportunities and pitfalls”, Council on Foreign Relations, Washington DC.
Kose, M.A., E.S. Prasad, K. Rogoff and S.J. Wei, 2009, “Financial Globalization: A Reappraisal”,
Staff Papers, International Monetary Fund, Vol. 56, No 1, pp.8–62.
Prasad and Ye (2012), The renminbi’s role in the global monetary system, Brookings,
Washington DC.
Subramanian, A. (2011), “Renminbi rules: the conditional imminence of the reserve currency
transition”, Peterson Institute for International Economics Working Paper 11-14.
United Nations (2009), Report of the Commission of Experts of the President of the United Nations General Assembly on Reforms of the International Monetary and Financial System.
Vallée (2012), “The internationalisation path of the renminbi”, Bruegel Working Paper, 2012/05,
Brussels.

54ECB
The international role of the euro
July 20135454
World Bank (2012), China 2030: Building a Modern, Harmonious, and Creative Society,
Washington DC.
Yu, Y. (2012), “Revisiting the internationalisation of the yuan”, ADBI Working Paper, No 366,
July 2012.

55ECB
The international role of the euro
July 2013 55
SPECIAL FEATURES
55
C HISTORY, GRAVITY AND INTERNATIONAL FINANCE52
It is sometimes argued in policy discussions on the future of the international monetary system that an evolution towards multipolarity is unlikely owing to strong persistence effects which benefit the incumbent currency, i.e. the US dollar. How strong these effects are remains subject to debate, however.
This special feature quantifies persistence effects in international financial investment patterns. Using unique data on foreign bond holdings of US investors in the early 1940s, and comparing them with investment patterns in 2010, the special feature documents a “history effect” in which the pattern of holdings seven decades ago continues to influence holdings today, which plausibly reflects fixed costs of market entry and exit, together with endogenous learning. It shows that up to 15% of the cross-country variation in US investors’ foreign bond holdings today is explained by holdings 70 years ago. This effect is twice as large for bonds held by US investors that are denominated in currencies other than the dollar.
These findings help quantify the extent to which the role of the dollar as a global investment currency today is partly a legacy of this earlier era when it dethroned sterling as the leading international currency. They also complement the results presented in the 2012 edition of this report on the existence of significant inertia effects in international currency use which, however, were shown not to be insurmountable. The present special feature aims to deepen these earlier results by looking more closely at potential sources of inertia. In so doing it points to fixed costs and endogenous learning as two potential sources of inertia in the use of international currencies, alongside well-known network externality effects.
1 INTRODUCTION
It is sometimes argued in policy discussions on the future of the international monetary system that
an evolution towards multipolarity is unlikely owing to strong persistence effects which benefit the
incumbent currency, i.e. the US dollar. The proximate source of these effects as well as how strong
they are remains subject to debate, however. How large, for instance, are persistence effects in
international financial investment patterns?
One particularly relevant development in this context is growing interest in the geography of
international finance. The direction and determinants of cross-border financial stocks and flows have
been intensely studied in recent years using so-called “gravity models” (e.g. Aviat and Coeurdacier,
2007). In this approach, bilateral trade in assets is posited to increase with country size and to
decline with transaction costs and information asymmetries, as captured by geographic distance and
related variables.53 Attention so far has focused on recent decades, which usefully highlights the
recent progress of financial globalisation, but says nothing about longer-term historical forces that
may also influence patterns of international investment.
This special feature aims to address this shortcoming and quantifies the role played by history in
shaping the patterns of international financial investment. In so doing, it also aims to shed light
on one manifestation of persistence effects in the international monetary and financial system
52 Prepared by Livia Chiţu and Arnaud Mehl.
53 See e.g. Portes and Rey (2005); Ahearne, Griever and Warnock (2004); Eichengreen and Luengnaruemitchai (2006); Lane and Milesi-
Ferretti (2008a) and (2008b); Coeurdacier and Martin (2009); Forbes (2010); Okawa and van Wincoop (2012).

56ECB
The international role of the euro
July 20135656
as well as on their potential sources. It presents estimates from a gravity model of international
investment based on data on US investors’ holdings of foreign bonds in 88 countries seven
decades ago. It documents a “history effect” in which the pattern of holdings seven decades ago
continues to influence holdings today. 10% to 15% of the cross-country variation in US investors’
foreign bond holdings is explained by holdings 70 years ago. This plausibly reflects fixed costs of
market entry and exit together with endogenous learning, namely the propensity of international
investors to continue to invest disproportionally in assets in which they have already invested in
and are accustomed to. This history effect is shown to be twice as large for bonds denominated in
currencies other than the dollar, suggesting the existence of even higher fixed costs of initiating US
foreign investment in such currencies. Overall the findings presented in this special feature point to
fixed costs and endogenous learning as two potential sources of inertia in the use of international
currencies, alongside well-known network externality effects.
This special feature reviews the theoretical motivations in Section 3.2, presents the empirical results
in Section 3.3 and provides some concluding remarks in Section 3.4.
2 THEORETICAL MOTIVATIONS
Why might past investment influence current investment? One answer is fixed costs. The theoretical
and empirical literature on so-called beachhead and hysteresis effects (Baldwin, 1988; Dixit, 1989;
Baldwin and Krugman, 1989) has shown that transitory shocks resulting in market penetration can
permanently impact patterns of trade if firms incur fixed costs when entering new markets but
cannot easily recoup them when they exit.54 When coupled with endogenous learning, as described
in the study by Van Nieuwerburg and Veldkamp (2009), the cumulative impact of passing shocks
can be more powerful still. A shock that leads a firm to penetrate a market can then give it the
incentive and ability to learn more about the market in question, amplifying the initial informational
advantage.
Intuition suggests that what is true of international trade is also true of international investment.
Financial firms face fixed costs when investing in the ability to assess the creditworthiness of
foreign bonds. They face set-up costs when seeking to market the foreign bonds of a country or
countries to domestic investors. This was plausibly true of US banks at the middle of the 20th
century, the case analysed in this special feature.
Commercial banks had been prohibited from establishing foreign branches under the provisions
of the National Banking Act.55 When the ban on foreign branching was then lifted by the Federal
Reserve Act of 1913, US banks had to sink the costs of setting up foreign branches in order to
gather intelligence on foreign markets and underwrite the bond issues of foreign borrowers. They
had to sink the costs of setting up store-front brokerages and other marketing tools to sell those
bonds to investors (Eichengreen, 1989). The foreign market penetration of US banks was uneven,
54 For instance, it is observed that Japanese firms that entered US markets in the early 1980s, when the dollar had significantly appreciated,
did not abandon their sunk investments when the dollar fell in the wake of the Plaza agreement of 1985. Once firms had invested in
marketing, R&D, reputation, distribution networks, etc., they found it profitable to remain in US markets even at a lower exchange rate
(Dixit, 1989). Stricto sensu, hysteresis is when a transitory shock has permanent effects. In our case, however, what is necessary is only
that a transitory shock has highly persistent effects that are still perceptible after decades. With limited data, the two cases are, of course,
difficult to distinguish.
55 Unlike federally chartered banks, trust companies could branch abroad, and those which set up foreign offices did so mainly in order
to gather information on foreign bonds, which were attractive assets to add to their portfolios since these matched the maturity of their
liabilities to their trustees. Some state charters also allowed state banks to branch abroad, although few, if any, ever did. See Eichengreen
and Flandreau (2010).

57ECB
The international role of the euro
July 2013 57
SPECIAL FEATURES
57
however. US banks focused disproportionately on Latin America and western Europe, leaving the
British Commonwealth and Empire, along with parts of Scandinavia and eastern Europe, to their
UK rivals. That structure was then essentially frozen by the Second World War, post-war capital
controls and new restrictions on foreign branching imposed by the destination countries during the
Bretton Woods period. It is thus plausible that the geography of international investment carved out
in the interwar period could have had an unusually long-lived legacy.56
Fixed costs need not be large to have persistent effects on the geography of bilateral asset holdings;
they only need to be different across countries. This is the implication of asymmetric information in
the literature on endogenous learning. In the model of Van Nieuwerburg and Veldkamp mentioned
above, even a small informational advantage associated with domestic assets can cause significant
home bias. The informational advantage reduces the perceived riskiness of domestic assets, which
encourages investors to hold more of them. This in turn induces investors to learn even more about
such assets, making them still more attractive. Endogenous learning thus amplifies the initially
small information advantage. Analogously, lower initial fixed costs of investing in some countries
may significant tilt investment towards those countries over time; moreover, this pattern may persist
and be amplified over time by endogenous learning.
This idea might also extend to currency choice. When deciding to invest in bonds denominated in
foreign currencies, domestic investors will have to learn not just about the creditworthiness of the
foreign issuer but also about the characteristics of its currency; additional frictions may also come
into play, such as the absence of liquid markets to hedge currency risk.
Ideally, one would have direct measures of these fixed costs, including differences in brokers’ fees
between domestic and foreign investments, differences in tax treatment, and policy-related costs
(e.g. those associated with limits to foreign investment and capital controls). Unfortunately, no
study has been able to provide a comprehensive measure of direct costs in investing in foreign
assets, not even for the contemporary period, much less for earlier historical eras (Coeurdacier and
Rey, 2011). It is thus necessary to make inferences about their importance from indirect evidence.
3 EMPIRICAL ESTIMATES
To indirectly estimate the importance of fixed costs and endogenous learning effects, Chiţu,
Eichengreen and Mehl (2013) estimate a standard gravity model akin to the specification
proposed in, for example, Coeurdacier and Martin (2009) and Okawa and van Wincoop (2012).
They use past holdings of a country’s bonds as an indicator that investors have sunk the costs
of acquiring information about this particular class of investment. They estimate a gravity model
of international investment using unique data on US investors’ holdings of foreign bonds in 88
countries seven decades ago, a period for which uniquely detailed information exists. These data
stem from a detailed survey of US foreign investments conducted by the US Treasury during the
Second World War for the purpose of gleaning information that might prove useful in subsequent
peace negotiations and help US residents to obtain compensation for foreign assets confiscated or
destroyed during wartime (see US Treasury, 1947). For about half of the countries in the sample,
56 There is also the counterargument that subsequent events overwhelmed the influence of earlier investment patterns. An example is Cuba,
a country with close economic links to the United States until 1959 and with which US investors had developed significant economic
interests and held relatively large numbers of bonds. After the Cuban revolution, however, the new government expropriated foreign
investors. This explains why US investors today hold negligible amounts of Cuban bonds, although they used to hold large ones in the
past. Which argument is of more general applicability is, of course, an empirical question.

58ECB
The international role of the euro
July 20135858
information was also available as to whether
foreign bonds were denominated in dollars or
other currencies.
The results are strongly supportive of a “history
effect”. Chart 30 juxtaposes the logarithm of US
foreign bond holdings surveyed in 1943 against
the logarithm of 2010 holdings. The correlation
between current and lagged holdings is striking.
This is confirmed when gravity estimates for US
foreign bonds holdings in 2010 are considered
(see Table 9). Indeed, even after controlling for
the arguments of the standard gravity model
(distance and size), bilateral trade (a traditional
complement to bilateral financial investment)
and informational frictions (proxied by common
language, legal origin, and past colonial status),
this correlation is statistically significant, robust
and economically important. Not only do
1943 holdings help to predict 2010 holdings,
but their effect is large. In the OLS estimates,
a 1% increase in US holdings in a country 70
years ago is associated with higher holdings
of about 1% in the same country today. The
adjusted-R2 jumps from roughly 35% to 50%
when the 1943 holdings are added (compare the
estimates reported in columns 1 and 2 with those in columns 3 and 5 respectively). In other words,
the pattern of 1943 holdings explains about 15 percentage points of the allocation by US investors
of their current foreign bond holdings. The result is unchanged when excluding offshore centres
and including common language, colony and legal system dummies (columns 4 to 10). It remains
essentially unchanged in significance and economic magnitude if one controls for omitted variables
(as in columns 7 and 8) and outliers (as in columns 9 and 10). These findings also extend to other
securities besides bonds.57
The causal interpretation of the effect is buttressed by the observation that it continues to hold after
instrumenting lagged holdings with dummies that aim to capture the effects of the disintegration
of the gold standard and of the sovereign defaults of the 1930s, which contributed to the growing
segmentation of global financial markets during the Great Depression. The same result is found for
capital flows in the other direction; in other words, the history effect holds for foreign investments
in US securities as well as for US investments abroad.58
To what extent does the history effect matter for international currency choice? As mentioned above,
one might expect sunk costs and therefore the history effect to be even larger for bonds issued in
currencies other than the dollar. US investors will have to learn not just about the creditworthiness
of the foreign issuer but also about the characteristics of its currency; additional frictions may also
come into play, such as the absence of liquid markets to hedge currency risk.
57 Detailed results are not reported here for reasons of space but are available in Chiţu, Eichengreen and Mehl (2013).
58 The same results are obtained when the dependant variable is substituted with a measure of foreign investment bias like that proposed by
Bekaert, Siegel and Wang (2012).
Chart 30 US foreign security holdings: 1943 versus 2010
-5
0
5
10
15
-5
0
5
10
15
British West IndiesCanada
Cuba
AustraliaUK
y-axis: log of US foreign bond holdings in 2010
0 2 4 6 8
x-axis: log of US foreign bond holdings in 1943
investment destination
OLS line
Mexico
Sources: Chiţu, Eichengreen and Mehl (2013).Notes: The chart plots the logarithm of US foreign bond holdings in 1943 against the logarithm of the corresponding holdings in 2010 in the respective investment destination country. The data for US foreign bond holdings in 1943 are from US Treasury (1947). The data for US foreign bond holdings in 2010 are from US Treasury et al. (2011).

59ECB
The international role of the euro
July 2013 59
SPECIAL FEATURES
59
This hypothesis is explicitly tested in Table 10, which provides estimates of the history
effect separately for dollar and non-dollar bond holdings (columns 2 to 5 and columns 7 to 10
respectively). These equations are estimated on a subset of 41 countries for which data on the
currency of denomination of foreign bond holdings is available in both 1943 and 2010. Columns
1 and 6 report pro memoria simple gravity model estimates as benchmarks against which to gauge
the new results. The history effect is prominent for both dollar and non-dollar bonds, but it is more
important for non-dollar bonds, as the preceding arguments suggest. The estimated elasticity of
today’s holdings relative to lagged holdings is 0.8-1.1 for dollar bonds but close to 1.6 for non-
dollar bonds. Moreover, the adjusted R2 increases by roughly 30 percentage points for non-dollar
bonds, as opposed to 15 percentage points for dollar bonds. On balance, therefore, the history effect
is about twice as large for non-dollar bonds, indicative of larger sunk costs giving rise to stronger
persistence, in line with theoretical priors.
Table 9 Testing for a “history effect” – baseline empirical estimates
(1) (2) (3) (4) (5) (6) (7) (8) (9) (10)Full
sampleFull
sampleFull
sampleExcl.
offshore centres
Full sample
Excl. offshore centres
Full sample
Excl. offshore centres
Full sample
Excl. offshore centres
Log (distance from US) 1.125** 1.400 1.510*** 1.931*** 1.531*** 1.375** -0.338 -3.901** -1.369 -2.119
(0.553) (1.991) (0.559) (0.686) (0.475) (0.566) (1.897) (1.894) (1.251) (1.416)
GDP size 0.064 0.155 -0.037 -0.003 -0.057 0.014 -0.073 0.000 -0.094 -0.065
(0.175) (0.169) (0.097) (0.108) (0.093) (0.105) (0.111) (0.136) (0.116) (0.113)
Log (trade with US) 1.592*** 1.889*** 1.331*** 1.121*** 1.329*** 0.964*** 1.229*** 0.567* 1.052*** 0.760**
(0.263) (0.363) (0.262) (0.280) (0.265) (0.274) (0.329) (0.296) (0.281) (0.301)
1943 bond holdings 0.845*** 1.012*** 0.948*** 1.090*** 1.232*** 1.471*** 1.063*** 1.069***
(0.185) (0.185) (0.178) (0.186) (0.282) (0.266) (0.207) (0.207)
Common language
dummy 0.225 0.694 -1.051 1.080 -1.370 1.352* 0.930
(1.208) (1.171) (1.808) (1.205) (1.559) (0.745) (1.005)
Cuba-Philippines
dummy -0.730 -4.190*** -6.334*** -4.977** -9.246*** -3.971** -11.742***
(1.803) (1.459) (0.835) (2.124) (1.253) (1.565) (2.809)
Common legal origin
dummy -0.023 -0.880 0.902 -0.628 1.798 -0.474 0.304
(1.244) (1.179) (1.742) (1.232) (1.516) (0.895) (1.112)
Regional effects NO YES NO NO NO NO YES YES YES YES
Constant -15.801*** -20.454 -17.848*** -20.049*** -18.029*** -14.018** -1.114 35.114** 9.362 18.196
(5.571) (18.305) (5.510) (6.765) (4.817) (5.490) (17.375) (16.865) (11.846) (13.472)
Observations 74 74 73 61 73 61 73 61 73 59
Adjusted R2 0.355 0.352 0.483 0.513 0.508 0.551 0.511 0.605 0.609 0.658
log likelihood -170.5 -165.0 -159.8 -133.8 -156.3 -129.7 -152.0 -121.4 . .
Sources: Chiţu, Eichengreen and Mehl (2013).Notes: The table reports gravity estimates for US foreign bond holdings in 2010 (columns 1 and 2) augmented with the lag of these holdings in 1943 (columns 3-10). The estimates for the full sample and excluding offshore fi nancial centres are obtained using simple OLS (columns 1, 3-6), OLS and regional effects (columns 2, 7 and 8) as well as robust-to-outlier (columns 9 and 10) estimation. The regional effects aim to capture unobserved investment destination effects, as suggested in Okawa and van Wincoop (2012). The eight regions (Asia, Central America, Europe, North America, South America, Oceania; West Indies; Africa is the base region) follow the classifi cation of US Treasury (1947). Bilateral trade with the US is instrumented with transport costs, its square as well as the number of landlocked countries in the country pair as in Aviat and Coeurdacier (2007). Robust-to-heteroskedasticity standard errors are reported in parentheses; *** p<0.01, ** p<0.05, * p<0.1.

60ECB
The international role of the euro
July 20136060
4 CONCLUDING REMARKS
This special feature has shown that history plays a role in the geography of international finance.
Using unique data on US investors’ holdings in 1943, it has documented a “history effect” in
which US bilateral holdings 70 years ago help to explain the allocation of US holdings around
the world today. This effect is statistically significant, robust and economically important even
after controlling for the arguments of the standard gravity model. It is interpreted in terms of the
path dependence effects arising from sunk costs of market entry and exit coupled with endogenous
learning. The estimates suggest that a 1% increase in US holdings in a country 70 years ago is
associated with holdings of some 1% higher in the same country today. They suggest that 10 to
15% of the cross-sectional variance of today’s holdings is attributable to the effect of the holdings
70 years ago. These findings are robust to an array of sensitivity checks.
Earlier studies had shown that the geographical component of cross-border financial flows and
holdings is substantial – that international financial markets are not frictionless but segmented by
market size, informational asymmetries and familiarity effects. More recent studies have established
the importance of complementarities between trade in goods and trade in assets. This special feature
has shown that history also matters and that historical patterns persistently weigh on the geography
of bilateral asset holdings.
Table 10 Testing for a “history effect” – dollar versus non-dollar bonds
US dollar bonds non-US dollar bonds(1) (2) (3) (4) (5) (6) (7) (8) (9) (10)
Log (distance from US) 0.349 0.602 0.476 -0.218 -1.884 2.923*** 3.185*** 3.463*** -0.192 -1.353
(0.682) (0.571) (0.741) (2.017) (1.435) (0.944) (0.766) (0.770) (2.597) (0.873)
GDP size -0.035 -0.019 0.011 0.215 0.160 -0.046 -0.141 -0.184** -0.189 -0.314***
(0.121) (0.081) (0.095) (0.146) (0.156) (0.232) (0.084) (0.078) (0.167) (0.100)
Log (trade with US) 1.511*** 1.213*** 1.108** 1.347* 0.231 1.689*** 1.053*** 1.184*** 1.243** 2.517***
(0.375) (0.364) (0.427) (0.733) (0.302) (0.441) (0.383) (0.421) (0.444) (0.177)
1943 bond holdings 0.813*** 0.783** 1.128** 1.155*** 1.551*** 1.571*** 1.649*** 0.753***
(0.272) (0.308) (0.412) (0.237) (0.319) (0.356) (0.452) (0.143)
Common language
dummy 2.420** 1.171*** 1.267 -0.599 -0.776*** 8.310***
(0.886) (0.262) (1.671) (0.636) (0.211) (1.622)
Cuba-Philippines
dummy -3.148*** 0.970 0.086 -1.113 -0.061 -9.787***
(0.990) (1.482) (2.678) (0.685) (1.676) (2.087)
Common legal origin
dummy -1.058 1.859* 2.261 -0.030 0.317 -9.048***
(1.536) (0.971) (1.924) (1.737) (2.248) (1.637)
Regional effects NO NO NO YES YES NO NO NO YES YES
Constant -8.516 -9.377 -7.592 -2.303 20.100 -32.547*** -31.181*** -34.471*** -3.049 -11.218
(7.218) (5.995) (7.862) (21.364) (13.589) (9.148) (6.446) (6.288) (23.562) (7.528)
Observations 38 37 37 37 36 38 37 37 37 35
Adjusted R2 0.317 0.475 0.466 0.537 0.681 0.391 0.718 0.698 0.718 0.956
log likelihood -85.78 -78.52 -77.02 -69.26 . -88.85 -72.17 -71.61 -65.20 .
Sources: Chiţu, Eichengreen and Mehl (2013).Note: The table reports gravity estimates for US foreign dollar and non-dollar holdings in 2010 augmented with the lag of these holdings in 1943. The estimates for the full sample are obtained using simple OLS (columns 1 to 3 and 6 to 8), OLS and regional effects (columns 4 and 9) as well as robust-to-outlier (columns 5 and 10) estimation. The regional effects are as in Table 1 and bilateral trade is instrumented as explained in the notes to that table. Robust-to-heteroskedasticity standard errors are reported in parentheses; *** p<0.01, ** p<0.05, * p<0.1.

61ECB
The international role of the euro
July 2013 61
SPECIAL FEATURES
61
Importantly, it has also shown that the history effect is twice as large for non-dollar bonds, which
is interpreted as reflecting larger sunk costs and endogenous learning effects for US financial
investments in currencies other than the dollar. These findings shed light on one manifestation of
persistence effects in the international monetary and financial system as well as on their potential
sources. They underscore how the role of the dollar as a global investment currency today is partly
a legacy of this earlier era when it dethroned sterling as the leading international currency. They
also point to fixed costs and endogenous learning as two potential sources of inertia in the use of
international currencies, alongside well-known network externality effects.
REFERENCES
Ahearne, A., W. Griever and F. Warnock (2004), “Information Costs and Home Bias: an Analysis
of US Holdings of Foreign Equities”, Journal of International Economics, 62, pp. 313-336.
Aviat, A and N Coeurdacier (2007), “The Geography of Trade in Goods and Asset Holdings”,
Journal of International Economics, 71, pp. 22-51.
Baldwin, R (1988), “Hysteresis in Import Prices: The Beachhead Effect”, American Economic Review, 74, pp. 773-785.
Baldwin, R and P Krugman (1989), “Persistent Trade Effects of Exchange Rate Shocks”, Quarterly Journal of Economics, 104, pp. 635-654.
Bekaert, G., S. Siegel and X. Wan (2012), Home Bias Revisited, Columbia Business School, mimeo.
Chiţu, L., B. Eichengreen and A. Mehl (2013), “History, Gravity and International Finance”, NBER Working Paper, No 18697, January 2013.
Coeurdacier, N. and P. Martin (2009), “The Geography of Asset Trade and the Euro: Insiders and
Outsiders”, Journal of the Japanese and International Economies, 23, pp. 90-113.
Coeurdacier, N. and H. Rey (2011), “Home Bias in Open Economy Financial Macroeconomics”,
Journal of Economic Literature, forthcoming.
Dixit, A. (1989), “Hysteresis, Import Penetration and Exchange Rate Pass-through”, Quarterly Journal of Economics, 104, pp. 205-228.
Eichengreen, B. (1989), “The U.S. Capital Market and Foreign Lending, 1920-1955”, in J. Sachs
(ed.), Developing Country Debt and Economic Performance, Volume 1, The International Financial
System, Chicago: University of Chicago Press, pp. 107-158.
Eichengreen, B. and M. Flandreau (2010), “The Federal Reserve, the Bank of England, and the
Rise of the Dollar as an International Currency”, BIS Working Paper No 328, November.
Eichengreen, B. and P. Luengnaruemitchai (2006), “Bond Markets as Conduits for Capital Flows:
How does Asia Compare?”, in T. Ito and A. Rose (eds.), International Financial Issues in the Pacific Rim: Global Imbalances, Financial Liberalization, and Exchange Rate Policy, pp. 267-313.

62ECB
The international role of the euro
July 20136262
Forbes, K. (2010), “Why do Foreigners Invest in the US?”, Journal of International Economics, 80,
pp. 3-21.
Lane, P. and G.-M. Milesi-Ferretti (2008a), “The Drivers of Financial Globalization”, American Economic Review: Papers and Proceedings, 98(2), pp. 327-332.
Lane, P. and G.-M. Milesi-Ferretti (2008b), “International Investment Patterns”, Review of Economics and Statistics, 90(3), pp. 538-549.
Okawa, Y. and E. van Wincoop (2012), “Gravity in International Finance”, Journal of International Economics, 87, pp. 205-215.
Portes, R. and H. Rey (2005), “The Determinants of Cross-Border Equity Flows”, Journal of International Economics, 65, pp. 269-296.
US Treasury (1947), Census of American-owned Assets in Foreign Countries, US Treasury
Department, Office of the Secretary, Washington DC.
US Treasury, Federal Reserve Bank of New York, Board of Governors of the Federal Reserve
System (2011), Report on U.S. Portfolio Holdings of Foreign Securities (as of December 31, 2010).
Van Nieuwerburgh S and L Veldkamp (2009), “Information Immobility and the Home Bias
Puzzle”, Journal of Finance, 64(3), pp. 1187-1215.


64ECB
The international role of the euro
July 201364
1 THE EURO IN GLOBAL FOREIGN EXCHANGE RESERVES AND EXCHANGE RATE ANCHORING
STATISTICAL ANNEX
Table A1 Global holdings of foreign exchange reserves
All countries Advanced economiesTotal holdings
of foreign reserves 1)
EUR USD JPY GBP Other 2) Total holdings of foreign reserves 1)
EUR
Outstanding amounts (in USD billions, at current exchange rates)
1999 1,782 247 980 88 40 22 1,122 183
2000 1,936 278 1,080 92 42 23 1,217 204
2001 2,049 301 1,122 79 42 20 1,246 213
2002 2,408 427 1,205 78 51 28 1,443 297
2003 3,025 559 1,466 88 62 44 1,767 359
2004 3,748 659 1,751 102 89 50 2,071 417
2005 4,320 684 1,903 102 102 49 2,078 387
2006 5,253 832 2,171 102 145 60 2,253 440
2007 6,704 1,082 2,642 120 193 76 2,432 522
2008 7,346 1,112 2,699 132 169 93 2,491 511
2009 8,164 1,270 2,848 133 195 140 2,779 616
2010 9,265 1,342 3,192 189 203 229 3,092 647
2011 10,202 1,394 3,518 204 217 307 3,399 672
2012 Q1 10,437 1,401 3,556 215 228 304 3,438 677
Q2 10,526 1,446 3,631 225 223 314 3,542 752
Q3 10,783 1,435 3,733 248 246 342 3,649 754
Q4 10,936 1,455 3,764 240 243 372 3,691 778
Currency shares in foreign exchange reserves with disclosed currency composition (at constant exchange rates)
1999 - 22.0 66.4 7.1 2.7 1.5 - 22.2
2000 - 23.6 64.6 7.3 2.7 1.4 - 23.6
2001 - 25.5 63.5 6.8 2.7 1.1 - 25.1
2002 - 27.7 62.1 5.5 2.6 1.4 - 27.0
2003 - 25.8 64.7 4.8 2.5 1.9 - 23.6
2004 - 24.2 66.3 4.6 2.8 1.9 - 22.2
2005 - 25.9 64.3 4.7 3.2 1.7 - 22.8
2006 - 25.0 65.1 4.2 3.6 1.8 - 22.0
2007 - 24.2 65.9 3.9 3.9 1.9 - 22.1
2008 - 25.2 64.6 3.3 4.5 2.2 - 22.2
2009 - 25.9 63.4 3.2 4.3 3.1 - 23.7
2010 - 25.8 62.1 3.5 4.1 4.5 - 23.7
2011 - 25.1 62.2 3.2 4.0 5.4 - 22.7
2012 Q1 - 24.3 62.6 3.6 4.1 5.4 - 22.1
Q2 - 25.7 61.5 3.5 3.9 5.3 - 24.8
Q3 - 24.3 62.0 3.7 4.1 5.7 - 23.7
Q4 - 23.9 61.9 3.9 4.0 6.1 - 23.7
Currency shares in foreign exchange reserves with disclosed currency composition (at current exchange rates)
1999 - 17.9 71.0 6.4 2.9 1.6 - 18.1
2000 - 18.3 71.1 6.1 2.8 1.5 - 18.4
2001 - 19.2 71.5 5.0 2.7 1.3 - 19.0
2002 - 23.8 67.1 4.4 2.8 1.6 - 23.3
2003 - 25.2 65.9 3.9 2.8 2.0 - 23.1
2004 - 24.8 65.9 3.8 3.4 1.9 - 22.9
2005 - 24.1 66.9 3.6 3.6 1.7 - 21.2
2006 - 25.1 65.5 3.1 4.4 1.8 - 22.2
2007 - 26.3 64.1 2.9 4.7 1.8 - 24.2
2008 - 26.4 64.1 3.1 4.0 2.2 - 23.3
2009 - 27.7 62.0 2.9 4.2 3.1 - 25.4
2010 - 26.0 61.8 3.7 3.9 4.4 - 23.9
2011 - 24.7 62.3 3.6 3.8 5.4 - 22.3
2012 Q1 - 24.5 62.3 3.8 4.0 5.3 - 22.3
Q2 - 24.7 62.1 3.8 3.8 5.4 - 23.9
Q3 - 23.9 62.1 4.1 4.1 5.7 - 23.2
Q4 - 23.9 61.9 3.9 4.0 6.1 - 23.7
Sources: IMF and ECB calculations.1) The total includes unallocated reserves, i.e. reserves with undisclosed currency composition, as well as allocated reserves with disclosed currency composition.2) The category “other” also excludes CHF.

65ECB
The international role of the euro
July 2013 65
STAT IST ICAL ANNEX
Advanced economies Emerging and developing economiesUSD JPY GBP Other 2) Total holdings
of foreign reserves 1)
EUR USD JPY GBP Other 2)
Outstanding amounts (in USD billions, at current exchange rates)
706 73 30 17 660 64 274 15 9 5
772 81 31 17 719 74 307 11 11 6
792 68 30 15 803 88 330 11 12 5
850 69 36 20 964 130 355 9 14 8
1,045 81 36 32 1,258 200 421 7 25 12
1,228 91 48 38 1,678 241 523 11 41 12
1,261 86 50 34 2,241 297 641 16 52 15
1,350 84 65 38 3,000 392 821 18 80 22
1,423 85 76 46 4,272 560 1,218 35 117 30
1,476 94 59 54 4,855 601 1,223 38 110 39
1,582 95 68 64 5,386 653 1,266 38 127 76
1,762 121 68 106 6,172 696 1,430 68 135 123
2,004 132 77 124 6,803 721 1,514 72 140 183
2,005 136 84 135 7,000 723 1,550 78 144 169
2,029 145 78 141 6,984 694 1,601 79 145 173
2,074 160 97 161 7,133 681 1,659 89 149 182
2,082 156 98 165 7,245 677 1,682 84 145 208
Currency shares in foreign exchange reserves with disclosed currency composition (at constant exchange rates)
65.2 8.1 2.8 1.6 - 21.4 69.7 4.4 2.4 1.3
63.0 8.8 2.7 1.3 - 23.4 68.8 3.4 2.6 1.4
62.3 8.2 2.6 1.2 - 26.3 66.3 3.3 2.8 0.9
61.3 6.9 2.6 1.4 - 29.5 64.1 2.2 2.6 1.4
65.7 6.3 2.1 2.0 - 31.0 62.4 1.3 3.4 1.8
67.4 5.9 2.2 2.1 - 28.6 64.0 1.6 4.2 1.4
66.5 6.2 2.5 1.8 - 31.3 60.5 2.0 4.6 1.4
67.3 5.8 2.7 1.9 - 29.6 61.8 1.9 5.0 1.6
67.3 5.2 2.9 2.2 - 26.5 64.4 2.4 5.0 1.6
67.6 4.5 3.0 2.5 - 28.6 61.3 2.0 6.1 1.9
66.3 4.3 2.8 2.7 - 28.4 60.0 1.9 6.0 3.6
65.3 4.2 2.6 3.9 - 28.1 58.4 2.6 5.7 5.0
66.5 3.9 2.7 4.1 - 27.8 57.2 2.4 5.5 6.9
66.3 4.3 2.8 4.5 - 26.9 58.3 2.8 5.5 6.4
63.9 4.2 2.6 4.4 - 26.7 58.7 2.7 5.5 6.3
63.9 4.4 3.0 4.9 - 25.1 59.9 2.9 5.4 6.6
63.5 4.7 3.0 5.0 - 24.2 60.1 3.0 5.2 7.4
Currency shares in foreign exchange reserves with disclosed currency composition (at current exchange rates)
69.8 7.3 3.0 1.7 - 17.3 74.3 3.9 2.5 1.4
69.7 7.3 2.8 1.5 - 18.0 74.9 2.8 2.6 1.5
70.5 6.1 2.7 1.4 - 19.6 73.9 2.4 2.8 1.0
66.4 5.4 2.8 1.6 - 25.1 68.7 1.7 2.8 1.5
67.1 5.2 2.3 2.1 - 30.1 63.2 1.1 3.8 1.8
67.3 5.0 2.7 2.1 - 29.1 63.1 1.3 4.9 1.4
69.2 4.7 2.7 1.9 - 29.0 62.8 1.5 5.1 1.5
68.1 4.2 3.3 1.9 - 29.4 61.6 1.3 6.0 1.6
66.0 4.0 3.5 2.1 - 28.5 62.1 1.8 5.9 1.5
67.1 4.3 2.7 2.5 - 29.9 60.8 1.9 5.5 1.9
65.1 3.9 2.8 2.6 - 30.2 58.6 1.8 5.9 3.5
65.0 4.5 2.5 3.9 - 28.4 58.3 2.8 5.5 5.0
66.5 4.4 2.5 4.1 - 27.4 57.5 2.7 5.3 6.9
66.0 4.5 2.8 4.4 - 27.1 58.1 2.9 5.4 6.3
64.5 4.6 2.5 4.5 - 25.8 59.4 2.9 5.4 6.4
63.9 4.9 3.0 4.9 - 24.6 60.0 3.2 5.4 6.6
63.5 4.7 3.0 5.0 - 24.2 60.1 3.0 5.2 7.4

66ECB
The international role of the euro
July 201366
Table A2 Currency composition of foreign exchange reserves for selected countries
(share of the euro in total foreign exchange reserve holdings; percentages; at current exchange rates)
2007 2008 2009 2010 2011 2012
Non-euro area EU Member States 68.6 61.3 63.7 61.1 60.9 58.0
Bulgaria 99.1 99.1 99.1 99.6 99.9 99.9
Czech Republic 54.0 62.6 61.3 57.4 60.1 58.7
Latvia 38.8 60.5 63.1 58.3 57.0 51.4
Lithuania 96.1 97.3 96.9 98.9 94.9 83.4
Poland 36.3 33.7 36.7 35.0 30.4 30.9
Romania 67.8 63.2 65.2 67.2 77.8 73.0
Sweden 46.9 48.5 48.1 50.0 37.0 37.1
United Kingdom 68.4 41.4 65.5 59.0 59.1 60.4
Candidate and potential candidate countriesCroatia 84.1 76.6 71.7 73.7 75.9 n.a.
Turkey 55.2 46.0 44.6 46.5 40.3 27.3
Other industrial countriesCanada 47.5 40.4 41.9 40.0 37.0 34.9
Norway 44.0 48.3 47.2 36.4 36.1 35.9
Russia 38.8 40.0 33.2 43.1 42.1 40.4
Switzerland 40.2 47.9 55.6 54.9 57.0 50.1
United States 37.9 53.7 54.0 54.2 53.5 57.0
Latin American countriesChile 34.8 37.3 34.8 35.2 35.5 20.3
Peru 11.9 14.9 17.4 16.8 38.0 30.0
Sources: National central banks and ECB calculations.Notes: Calculations are generally based on international reserve and foreign currency liquidity statistics. Figures for Sweden and Poland up to 2010 refer to currency benchmarks as published in the annual reports of the central banks of these countries. Figures for Bulgaria and Serbia refer to currency compositions as published in the annual reports of the central banks of these countries. Figures for the United Kingdom refer to combined currency shares for the Bank of England and the UK government (including other foreign currency assets, such as claims vis-à-vis residents). Data for the United States refer to combined currency shares for the Open Market Account at the Federal Reserve and the US Treasury Exchange Stabilization Fund; reciprocal currency arrangements are not included. In the case of Norway, currency shares refer to the fi xed income part of Norges Bank’s foreign exchange reserve investment portfolio, while the currency composition is taken from quarterly reports. Data for Chile refer to the combined currency shares in the liquidity and investment portfolio of the Central Bank of Chile. In the case of Peru, the euro’s share refers to reserve assets denominated in currencies other than the US dollar. According to the Central Reserve Bank of Peru, these are mostly euro-denominated assets.

67ECB
The international role of the euro
July 2013 67
STAT IST ICAL ANNEX
Table A3 Countries and territories with exchange rate regimes linked to the euro
(as at end-May 2013)
Region Exchange rate regimes Countries
EU (non-euro area) ERM II
Euro-based currency boards
Managed fl oating regime with the euro as
reference currency and an infl ation target
Pro memoria: Free-fl oating regime with an
infl ation target
Denmark, Latvia, Lithuania
Bulgaria
Czech Republic, Romania
Hungary, Poland, Sweden,
United Kingdom
EU acceding, candidate and potential
candidate countries
Unilateral euroisation (no separate legal
tender)Euro-based currency boardsStabilized arrangement with euro as a
reference currency
Pro memoria: Free-fl oating regime with an infl ation target
Kosovo, Montenegro
Bosnia and HerzegovinaCroatia, Former Yugoslav Republic of Macedonia
Albania, Iceland, Serbia, Turkey
Others Euroisation
Pegs based on the euro
Other arrangements using the euro as a
reference currency
Crawling peg involving the euro
Pegs and managed fl oats based on the
SDR and other currency baskets involving
the euro (share of the euro)
European microstates, some French
overseas collectivities
CFA franc zone, CFP franc zone, Cape
Verde, Comoros, São Tomé e Príncipe
Switzerland
Botswana
Algeria, Belarus, Fiji, Iran, Kuwait, Lybia,
Morocco (80%), Russian Federation
(45%), Samoa, Singapore, Syria, Tunisia,
Vanuatu
Denmark: Participates in ERM II with a +/-2.25% fl uctuation band.Latvia: Participates in ERM II with a +/-15% fl uctuation band. Latvia continues with a fl uctuation band of +/-1% as a unilateral commitment.Lithuania: Participates in ERM II with a +/-15% fl uctuation band. Lithuania continues with its currency board arrangement as a unilateral commitment.Bulgaria: Maintains a peg to the Euro within the framework of a currency board arrangement.European microstates: Republic of San Marino, Vatican City, Principality of Monaco and Andorra. The other countries and jurisdictions are entitled to use the euro as their offi cial currency. Liechtenstein uses the Swiss franc as its offi cial currency.Saint Barthelémy, Saint Martin and Saint-Pierre and Miquelon are French overseas collectivities but use the euro as their offi cial currency.CFA franc zone: WAEMU (Benin, Burkina Faso, Côte d’Ivoire, Guinea-Bissau, Mali, Niger, Senegal, Togo) and CEMAC (Cameroon, Central African Republic, Chad, Republic of Congo, Equatorial Guinea and Gabon).CFP franc zone: New Caledonia and the French overseas collectivities of French Polynesia and Wallis and Futuna.Switzerland: On 6 September 2011 the Swiss National Bank issued a statement establishing a minimum exchange rate for the euro of CHF 1.20 per euro. As stated in the Swiss National Bank’s annual report for 2011, the Swiss National Bank would “enforce this minimum rate with the utmost determination and was prepared to buy foreign currency in unlimited quantities.”Algeria: Managed fl oating regime with no preannounced path for the exchange rate.Belarus: The currency was pegged to a basket comprising the euro, the US dollar and the Russian rouble at the beginning of 2009, with a fl uctuation margin of 10%. In April 2011 the Belarussian rouble lost more than a third of its value against the US dollar after the central bank introduced a free fl oating exchange rate for trade between banks.Botswana: Weighted basket of currencies comprising the SDR and the South African rand (crawling peg since 2005).Fiji: The currency was pegged to a basket of international currencies in May 2007.Iran: Maintains de jure a managed fl oating arrangement against a basket of currencies including the euro, the US dollar and the Japanese yen.Kuwait: The currency was pegged to a basket of international currencies in May 2007.Libya: The rate of exchange is established using a basket of SDR currencies with a fl uctuation margin of 25%.Morocco: Bi-currency basket comprising the euro (80%) and the US dollar (20%).Russian Federation: Trade-weighted currency basket for monitoring and setting ceilings for real appreciation (combined share of euro and euro-linked currencies of around 60%); since February 2005 US dollar-euro basket for daily exchange rate management (since February 2007 the euro’s share has been 45%). The Bank of Russia does not target a specifi c exchange rate level against the currency basket.Samoa: The central bank maintains an exchange rate peg based on a basket comprising the currencies of Samoa’s six main trading partners and countries that represent primary sources of tourism revenue, namely New Zealand, Australia, the United States and the euro area. The exchange rate can fl uctuate within +/- 2% band.Singapore: Since 1981 a managed fl oating regime against an undisclosed basket of currencies maintained within an undisclosed target band. Syria: In August 2007, the authorities changed the de facto exchange rate regime from a peg to the US dollar to an SDR basket within a relatively wide fl uctuation margin.Tunisia: The de facto exchange rate regime is a conventional peg to an undisclosed basket of currencies.Vanuatu: Weighted basket comprising (undisclosed) currencies of Vanuatu’s major trading partners.
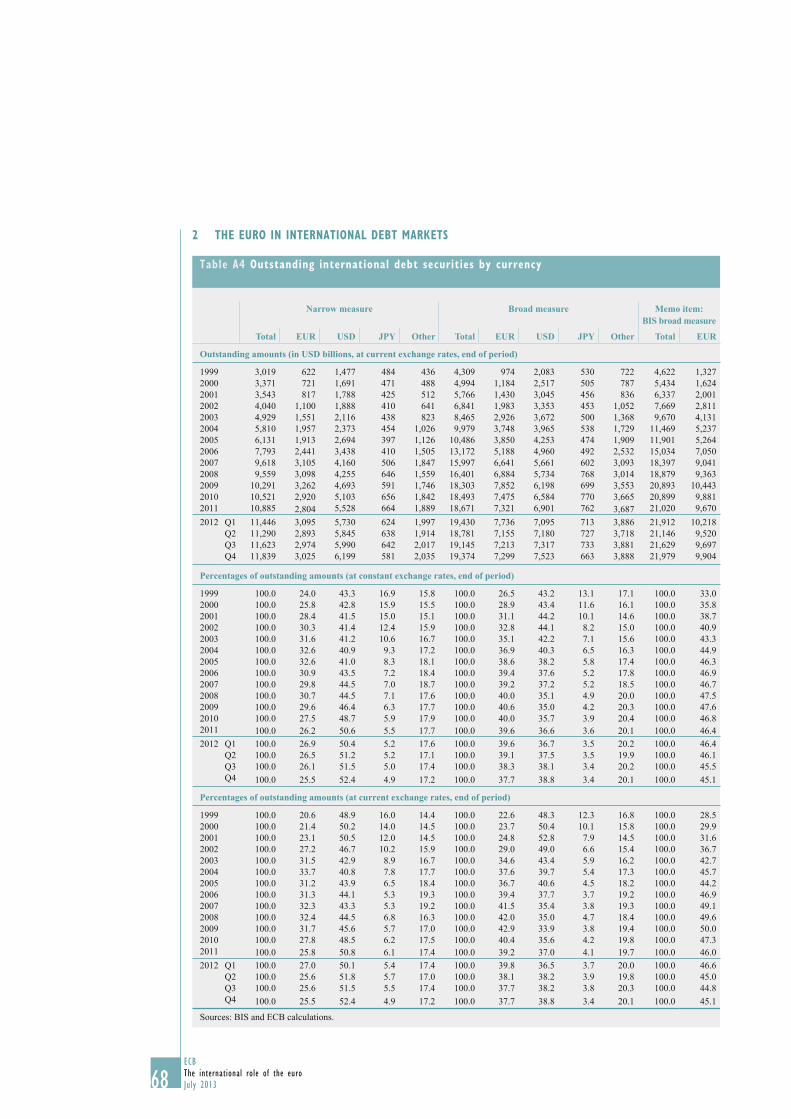
68ECB
The international role of the euro
July 201368
2 THE EURO IN INTERNATIONAL DEBT MARKETS
Table A4 Outstanding international debt securities by currency
Narrow measure Broad measure Memo item:BIS broad measure
Total EUR USD JPY Other Total EUR USD JPY Other Total EUR
Outstanding amounts (in USD billions, at current exchange rates, end of period)
1999 3,019 622 1,477 484 436 4,309 974 2,083 530 722 4,622 1,327
2000 3,371 721 1,691 471 488 4,994 1,184 2,517 505 787 5,434 1,624
2001 3,543 817 1,788 425 512 5,766 1,430 3,045 456 836 6,337 2,001
2002 4,040 1,100 1,888 410 641 6,841 1,983 3,353 453 1,052 7,669 2,811
2003 4,929 1,551 2,116 438 823 8,465 2,926 3,672 500 1,368 9,670 4,131
2004 5,810 1,957 2,373 454 1,026 9,979 3,748 3,965 538 1,729 11,469 5,237
2005 6,131 1,913 2,694 397 1,126 10,486 3,850 4,253 474 1,909 11,901 5,264
2006 7,793 2,441 3,438 410 1,505 13,172 5,188 4,960 492 2,532 15,034 7,050
2007 9,618 3,105 4,160 506 1,847 15,997 6,641 5,661 602 3,093 18,397 9,041
2008 9,559 3,098 4,255 646 1,559 16,401 6,884 5,734 768 3,014 18,879 9,363
2009 10,291 3,262 4,693 591 1,746 18,303 7,852 6,198 699 3,553 20,893 10,443
2010 10,521 2,920 5,103 656 1,842 18,493 7,475 6,584 770 3,665 20,899 9,881
2011 10,885 2,804 5,528 664 1,889 18,671 7,321 6,901 762 3,687 21,020 9,670
2012 Q1 11,446 3,095 5,730 624 1,997 19,430 7,736 7,095 713 3,886 21,912 10,218
Q2 11,290 2,893 5,845 638 1,914 18,781 7,155 7,180 727 3,718 21,146 9,520
Q3 11,623 2,974 5,990 642 2,017 19,145 7,213 7,317 733 3,881 21,629 9,697
Q4 11,839 3,025 6,199 581 2,035 19,374 7,299 7,523 663 3,888 21,979 9,904
Percentages of outstanding amounts (at constant exchange rates, end of period)
1999 100.0 24.0 43.3 16.9 15.8 100.0 26.5 43.2 13.1 17.1 100.0 33.0
2000 100.0 25.8 42.8 15.9 15.5 100.0 28.9 43.4 11.6 16.1 100.0 35.8
2001 100.0 28.4 41.5 15.0 15.1 100.0 31.1 44.2 10.1 14.6 100.0 38.7
2002 100.0 30.3 41.4 12.4 15.9 100.0 32.8 44.1 8.2 15.0 100.0 40.9
2003 100.0 31.6 41.2 10.6 16.7 100.0 35.1 42.2 7.1 15.6 100.0 43.3
2004 100.0 32.6 40.9 9.3 17.2 100.0 36.9 40.3 6.5 16.3 100.0 44.9
2005 100.0 32.6 41.0 8.3 18.1 100.0 38.6 38.2 5.8 17.4 100.0 46.3
2006 100.0 30.9 43.5 7.2 18.4 100.0 39.4 37.6 5.2 17.8 100.0 46.9
2007 100.0 29.8 44.5 7.0 18.7 100.0 39.2 37.2 5.2 18.5 100.0 46.7
2008 100.0 30.7 44.5 7.1 17.6 100.0 40.0 35.1 4.9 20.0 100.0 47.5
2009 100.0 29.6 46.4 6.3 17.7 100.0 40.6 35.0 4.2 20.3 100.0 47.6
2010 100.0 27.5 48.7 5.9 17.9 100.0 40.0 35.7 3.9 20.4 100.0 46.8
2011 100.0 26.2 50.6 5.5 17.7 100.0 39.6 36.6 3.6 20.1 100.0 46.4
2012 Q1 100.0 26.9 50.4 5.2 17.6 100.0 39.6 36.7 3.5 20.2 100.0 46.4
Q2 100.0 26.5 51.2 5.2 17.1 100.0 39.1 37.5 3.5 19.9 100.0 46.1
Q3 100.0 26.1 51.5 5.0 17.4 100.0 38.3 38.1 3.4 20.2 100.0 45.5
Q4 100.0 25.5 52.4 4.9 17.2 100.0 37.7 38.8 3.4 20.1 100.0 45.1
Percentages of outstanding amounts (at current exchange rates, end of period)
1999 100.0 20.6 48.9 16.0 14.4 100.0 22.6 48.3 12.3 16.8 100.0 28.5
2000 100.0 21.4 50.2 14.0 14.5 100.0 23.7 50.4 10.1 15.8 100.0 29.9
2001 100.0 23.1 50.5 12.0 14.5 100.0 24.8 52.8 7.9 14.5 100.0 31.6
2002 100.0 27.2 46.7 10.2 15.9 100.0 29.0 49.0 6.6 15.4 100.0 36.7
2003 100.0 31.5 42.9 8.9 16.7 100.0 34.6 43.4 5.9 16.2 100.0 42.7
2004 100.0 33.7 40.8 7.8 17.7 100.0 37.6 39.7 5.4 17.3 100.0 45.7
2005 100.0 31.2 43.9 6.5 18.4 100.0 36.7 40.6 4.5 18.2 100.0 44.2
2006 100.0 31.3 44.1 5.3 19.3 100.0 39.4 37.7 3.7 19.2 100.0 46.9
2007 100.0 32.3 43.3 5.3 19.2 100.0 41.5 35.4 3.8 19.3 100.0 49.1
2008 100.0 32.4 44.5 6.8 16.3 100.0 42.0 35.0 4.7 18.4 100.0 49.6
2009 100.0 31.7 45.6 5.7 17.0 100.0 42.9 33.9 3.8 19.4 100.0 50.0
2010 100.0 27.8 48.5 6.2 17.5 100.0 40.4 35.6 4.2 19.8 100.0 47.3
2011 100.0 25.8 50.8 6.1 17.4 100.0 39.2 37.0 4.1 19.7 100.0 46.0
2012 Q1 100.0 27.0 50.1 5.4 17.4 100.0 39.8 36.5 3.7 20.0 100.0 46.6
Q2 100.0 25.6 51.8 5.7 17.0 100.0 38.1 38.2 3.9 19.8 100.0 45.0
Q3 100.0 25.6 51.5 5.5 17.4 100.0 37.7 38.2 3.8 20.3 100.0 44.8
Q4 100.0 25.5 52.4 4.9 17.2 100.0 37.7 38.8 3.4 20.1 100.0 45.1
Sources: BIS and ECB calculations.


70ECB
The international role of the euro
July 2013
Table A5 Outstanding international bonds and notes, by currency and by sector
EUR USDSovereigns Other public
entitiesFinancial
institutionsInternational organisations
Sovereigns Other public entities
(Outstanding amounts in USD billions, end of period)
1999 101 21 332 128 412 83
2000 102 19 421 112 449 78
2001 99 18 514 101 454 79
2002 117 21 734 122 475 85
2003 149 26 1,093 150 486 96
2004 166 33 1,438 170 516 116
2005 156 28 1,445 149 519 143
2006 179 31 1,891 168 517 160
2007 198 32 2,458 190 516 186
2008 188 28 2,469 184 532 297
2009 217 24 2,534 243 618 399
2010 205 22 2,393 249 649 415
2011 226 20 2,349 299 707 458
2012 Q1 208 19 2,153 500 771 527
Q2 195 17 1,986 494 813 557
Q3 201 18 1,993 544 822 389
Q4 213 18 1,992 575 858 418
(Percentages of outstanding amounts, end of period)
1999 17.3 3.6 57.0 22.0 32.9 6.6
2000 15.6 3.0 64.3 17.1 31.6 5.5
2001 13.5 2.5 70.2 13.8 30.1 5.3
2002 11.8 2.1 73.9 12.2 29.4 5.2
2003 10.5 1.8 77.1 10.6 26.6 5.3
2004 9.2 1.8 79.6 9.4 24.9 5.6
2005 8.8 1.6 81.3 8.4 21.7 6.0
2006 7.9 1.4 83.4 7.4 16.7 5.2
2007 6.9 1.1 85.4 6.6 13.7 4.9
2008 6.6 1.0 86.0 6.4 11.6 4.6
2009 7.2 0.8 84.0 8.1 12.1 5.5
2010 7.2 0.8 83.4 8.7 12.3 5.7
2011 7.8 0.7 81.2 10.3 12.2 5.5
2012 Q1 7.2 0.6 74.8 17.4 12.2 5.7
Q2 7.2 0.6 73.8 18.4 12.5 5.8
Q3 7.3 0.6 72.3 19.7 15.6 7.4
Q4 7.6 0.6 71.2 20.5 15.8 7.7
Source: BIS.

71ECB
The international role of the euro
July 2013 71
STAT IST ICAL ANNEX
USD JPYFinancial
institutionsInternational organisations
Sovereigns Other public entities
Financial institutions
International organisations
(Outstanding amounts in USD billions, end of period)
640 117 100 24 300 40
762 134 86 20 291 32
821 154 69 14 276 27
891 168 68 15 267 30
1,065 179 69 17 295 35
1,258 184 62 16 322 35
1,536 188 45 14 290 32
2,233 186 39 14 311 31
2,875 197 36 18 400 35
2,881 228 42 31 511 45
3,044 280 38 37 455 44
3,115 282 36 34 444 43
3,351 339 46 41 486 48
3,552 382 45 37 474 49
3,584 392 47 38 484 50
3,670 392 46 34 485 50
3,764 397 42 31 440 44
(Percentages of outstanding amounts, end of period)
51.1 9.4 21.5 5.1 64.7 8.7
53.6 9.4 20.1 4.7 67.7 7.5
54.4 10.2 17.9 3.6 71.5 7.0
55.0 10.4 18.0 3.9 70.2 7.9
58.3 9.8 16.7 4.0 7.9 8.4
60.7 8.9 14.2 3.7 74.0 8.1
64.4 7.9 11.8 3.7 76.0 8.4
72.1 6.0 9.9 3.5 78.7 7.8
76.2 5.2 7.3 3.6 81.9 7.2
62.8 5.0 5.9 3.6 72.1 6.4
59.5 5.5 5.8 4.6 70.2 6.8
59.3 5.4 5.7 4.3 70.6 6.9
57.8 5.8 6.6 5.0 69.3 6.8
56.1 6.0 6.6 4.7 69.7 7.2
55.3 6.0 6.7 4.6 69.6 7.2
69.6 7.4 7.5 5.5 78.9 8.1
69.2 7.3 7.6 5.5 79.0 7.9

72ECB
The international role of the euro
July 201372
Table A6 Outstanding international bonds and notes in selected regions at the end of the review period, by currency
(percentages; end-2012, narrow measure; USD billions and as a percentage of the total amount outstanding)
Total amounts outstanding
(USD billion)
of which denominated in:
US dollar Euro Japanese yen Other currencies
Africa 50 66.9 20.9 2.9 9.2
Asia and Pacifi c 1,092 62.9 11.2 5.2 20.7
of which:Japan 99 79.7 9.3 ... 11.0
Europe 5,704 48.2 26.6 5.0 20.2
of which:Euro area 2,444 58.5 ... 5.9 35.6
Denmark, Sweden, United Kingdom 2,643 39.6 48.8 3.9 7.7
Other non-euro EU Member States 191 24.5 66.9 3.0 5.6
EU27 5,281 47.8 26.5 4.8 20.9
Non-EU developed Europe 1) 287 36.6 37.7 11.6 14.1
Non-EU developing Europe 151 82.3 12.4 0.0 5.3
International organisations 1,321 29.9 40.9 3.3 25.9
Latin America 528 82.9 7.5 1.3 8.3
Middle East 210 83.2 8.4 2.1 6.3
North America 1,401 30.7 32.0 4.8 32.5
of which:Canada 711 60.6 4.3 1.0 34.1
United States 690 ... 60.4 8.6 31.0
Offshore centres 1,690 75.5 8.5 6.7 9.3
Total 11,996 51.5 23.7 4.8 20.0
Sources: BIS and ECB calculations.1) Iceland, Norway, Switzerland and European microstates.

73ECB
The international role of the euro
July 2013 73
STAT IST ICAL ANNEX
Table A7 International dimensions of euro-denominated debt securities
(EUR billions; percentages)
Held by residents Held by non-residents Total
a) As at end-June 2012
Issued by residents 11,912
69%2,973
17%14,884
87%
Issued by non-residents 1,494
9%806
5%2,300
13%
Total 13,406
78%3,779
22%17,184
100%
b) As at end-June 2011
Issued by residents 11,505
69%2,922
18%14,427
87%
Issued by non-residents 1,432
9%766
5%2,198
13%
Total 12,937
78%3,689
22%16,625
100%
Source: ECB.
Chart A1 Debt securities issued by euro area countries, by holder
(percentages of total outstanding amounts; as at end-2011)
0
20
40
60
80
100
0
20
40
60
80
100
AT BE CY FI FR DE EE GR IE IT LU MT NL PT SK SI ES
other EU holders
other euro area holders
domestic holders
holdings as reserve assets and by international organisations
other holders (non-reporters to IMF surveys)
holders outside EU
Sources: ECB calculations, IMF (CPIS, SEFER and SSIO surveys) and national sources (national accounts and i.i.p. data). Notes: i.i.p. fi gures for Cyprus and the Netherlands include “special fi nancial institutions”. Reserve assets and holdings by international organisations cannot be allocated to reporting countries, since the results of the IMF’s surveys on Securities Held as Foreign Exchange Reserves (SEFER) and Securities Held by International Organizations (SSIO) report fi gures only in aggregate form.

74ECB
The international role of the euro
July 201374
Chart A2 Debt securities issued by euro area residents held in the portfolios of selected countries outside the euro area
(as a percentage of total debt securities held as portfolio investment assets; as at end-2011)
0.0
0.1
0.2
0.3
0.4
0.5
0.6
0.0
0.1
0.2
0.3
0.4
0.5
0.6
GB NO US JP AU CA CH
IE
ESEE
GR
SIDE
PT
SK
FI
FR
NLCY
LU
MT
AT
BE
IT
Sources: ECB and IMF.
Table A8 Net issuance of international debt securities
(narrow measure, i.e. excluding home currency issuance USD billions; at current exchange rates)
Annual Quarterly 20122008 2009 2010 2011 2012 Q1 Q2 Q3 Q4
Euro 185.2 50.0 -102.0 -23.2 165.2 197.0 -24.7 3.0 -10.2
US dollar 95.5 437.2 409.9 425.6 670.8 202.2 114.8 144.5 209.2
Japanese yen 7.9 -45.2 -10.3 -15.7 -20.2 -4.5 -7.8 -10.3 2.4
Total (including other currencies) 1,636.1 1,294.8 656.4 474.1 707.9 489.1 -88.8 85.4 222.2
Sources: ECB and BIS calculations.

75ECB
The international role of the euro
July 2013 75
STAT IST ICAL ANNEX
Table A9 The top 20 non-euro area issuers of euro-denominated bonds and non-USissuers of US dollar-denominated bonds
(total amount issued in 2012; EUR millions)
Top 20 non-Euro Area Issuers of euro-denominated bonds Top 20 non-US Issuers of US dollar-denominated bonds
Abbey National Treasury Services plc 11,201 Kreditanstalt für Wiederaufbau 26,366
Lloyds TSB Bank plc 11,055 European Investment Bank (EIB) 21,778
Barclays Bank plc 8,461 Republic of the Philippines 16,769
Danske Bank A/S 8,031 Bank of Nova Scotia 14,939
DnB Boligkreditt AS 6,880 Barclays Bank PLC 13,637
Nordea Bank AB 5,628 London Branch CORP 11,990
Poland, Republic of (Government) 5,500 Caisse D’amortissement de la Dette Sociale 10,520
Swedbank AB 4,875 Kingdom of the Netherlands 10,423
Commonwealth Bank of Australia 4,850 Kommunalbanken AS 10,313
Svenska Handelsbanken AB 4,806 International Bank for Reconstruction and Development
(IBRD)/World Bank 10,266
Credit Agricole S.A. – London Branch 4,057 Dutch State Treasury Agency 10,000
BHP Billiton Finance Ltd 4,000 ING Bank N.V. 9,915
Nationwide Building Society 3,663 Australia and New Zealand Banking Group Ltd 9,323
Banco Espirito Santo SA 3,658 Nv Bank Nederlandse Gemeenten BNG 9,203
UBS AG (London Branch) 3,638 Ukraine (Government) 8,710
National Australia Bank Ltd 3,565 Coöperatieve Centrale Raiffeisen-Boerenleenbank B.A. 8,549
Ministry of Finance of the Czech Republic 3,500 Volkswagen International Finance NV 8,524
Standard Chartered PLC 3,500 Commonwealth Bank of Australia 8,098
DLR Kredit A/S 3,319 SB Capital SA 7,731
Holmes Master Issuer PLC 3,050 Lyondellbasell Industries NV 7,693
Memo Items:
European Stability Mechanism (ESM) 30,500
European Investment Bank (EIB) 23,900
European Union 15,800
Source: DCM Analytics.

76ECB
The international role of the euro
July 201376
Table A10 Outstanding international loans, by currency
All cross-border loans 1) Loans by banks outside the euro area to borrowers outside the euro area 2)
Total EUR USD JPY Other Total EUR USD JPY Other
Outstanding amounts (in USD billions, at current exchange rates, end of period)
1999 1,856 - - - - 481 - - - -
2000 1,852 266 999 81 506 413 23 181 - -
2001 2,024 304 1,174 84 463 377 44 201 46 85
2002 2,233 379 1,241 105 507 364 64 189 44 67
2003 2,678 521 1,469 116 572 399 92 237 38 33
2004 3,082 668 1,615 152 647 430 136 236 37 22
2005 3,421 640 1,889 118 774 527 107 296 50 73
2006 4,505 832 2,545 121 1,006 693 135 412 44 102
2007 5,650 1,255 3,129 181 1,085 1,066 306 689 65 6
2008 5,415 1,199 3,060 168 989 1,105 239 771 68 28
2009 5,123 1,058 2,960 110 995 1,131 223 796 41 71
2010 5,504 1,107 3,214 125 1,058 1,240 258 875 42 62
2011 5,856 1,214 3,329 192 1,121 1,385 243 919 54 169
2012 Q1 5,952 1,257 3,358 190 1,147 1,418 237 969 59 153
Q2 5,954 2,086 2,486 182 1,200 1,436 232 988 61 155
Q3 6,059 1,227 3,426 168 1,238 1,452 229 1,007 56 160
Percentages of outstanding amounts (at constant exchange rates, end of period)
1999 100.0 - - - - - - - - -
2000 100.0 18.2 49.1 5.9 26.8 - - - - -
2001 100.0 19.7 51.8 6.2 22.3 100.0 15.2 46.9 18.2 19.7
2002 100.0 19.5 51.7 6.7 22.1 100.0 19.6 47.1 16.6 16.7
2003 100.0 19.5 53.6 5.9 21.1 100.0 22.5 56.6 12.6 8.3
2004 100.0 20.6 52.4 6.5 20.5 100.0 29.5 53.9 11.1 5.5
2005 100.0 19.7 53.1 5.0 22.2 100.0 20.8 52.4 13.5 13.3
2006 100.0 18.0 56.2 4.1 21.7 100.0 18.5 57.4 9.4 14.8
2007 100.0 20.0 56.6 4.7 18.7 100.0 25.4 65.3 8.9 0.4
2008 100.0 20.6 56.6 3.6 19.2 100.0 20.1 69.9 7.2 2.7
2009 100.0 18.8 58.7 2.6 19.9 100.0 17.9 71.3 4.4 6.4
2010 100.0 19.5 58.6 2.4 19.5 100.0 20.3 71.1 3.6 5.1
2011 100.0 20.7 56.7 3.3 19.4 100.0 17.5 66.3 3.9 12.3
2012 Q1 100.0 20.5 56.7 3.4 19.4 100.0 16.2 68.5 4.4 10.8
Q2 100.0 35.6 41.3 3.1 20.0 100.0 16.5 68.4 4.3 10.7
Q3 100.0 20.3 56.5 2.8 20.4 100.0 15.8 69.4 3.9 11.0
Percentages of outstanding amounts (at current exchange rates, end of period)
1999 100.0 - - - - 100.0 - - - -
2000 100.0 14.4 53.9 4.4 27.3 100.0 5.6 43.9 - -
2001 100.0 15.0 58.0 4.1 22.9 100.0 11.8 53.4 12.3 22.5
2002 100.0 17.0 55.6 4.7 22.7 100.0 17.5 52.1 12.0 18.4
2003 100.0 19.4 54.9 4.3 21.4 100.0 23.0 59.2 9.6 8.2
2004 100.0 21.7 52.4 4.9 21.0 100.0 31.6 54.7 8.5 5.1
2005 100.0 18.7 55.2 3.4 22.6 100.0 20.4 56.2 9.5 13.9
2006 100.0 18.5 56.5 2.7 22.3 100.0 19.5 59.5 6.3 14.7
2007 100.0 22.2 55.4 3.2 19.2 100.0 28.7 64.6 6.1 0.6
2008 100.0 22.1 56.5 3.1 18.3 100.0 21.6 69.8 6.2 2.5
2009 100.0 20.7 57.8 2.1 19.4 100.0 19.7 70.4 3.6 6.3
2010 100.0 20.1 58.4 2.3 19.2 100.0 20.8 70.6 3.4 5.0
2011 100.0 20.7 56.8 3.3 19.1 100.0 17.5 66.3 3.9 12.2
2012 Q1 100.0 21.1 56.4 3.2 19.3 100.0 16.7 68.3 4.2 10.8
Q2 100.0 35.0 41.8 3.1 20.2 100.0 16.2 68.8 4.2 10.8
Q3 100.0 20.3 56.5 2.8 20.4 100.0 15.8 69.4 3.9 11.0
Sources: BIS and ECB calculations.Note: Excluding interbank loans.1) Including loans to/from Japan, Switzerland, the United Kingdom and the United States in their domestic currency.2) Excluding loans to/from Japan, Switzerland, the United Kingdom and the United States in their domestic currency.
3 THE EURO IN INTERNATIONAL LOAN AND DEPOSIT MARKETS

77ECB
The international role of the euro
July 2013 77
STAT IST ICAL ANNEX
Table A11 Outstanding international deposits, by currency
All cross-border loans 1) Deposits by depositors outside the euro area in banks outside the euro area 2)
Total EUR USD JPY Other Total EUR USD JPY Other
Outstanding amounts (in USD billions, at current exchange rates, end of period)
1999 1,930 - - 89 - 535 - - 40 -
2000 2,102 391 1,303 85 323 - 77 464 29 -
2001 2,419 465 1,435 84 435 689 103 507 35 44
2002 2,789 598 1,542 93 555 712 135 449 38 90
2003 3,472 819 1,899 84 670 852 192 523 40 97
2004 4,075 992 2,201 112 770 906 239 530 34 103
2005 4,244 921 2,362 116 844 1,048 237 629 55 128
2006 5,383 1,099 3,063 135 1,086 1,306 289 805 46 166
2007 6,727 1,406 3,949 146 1,226 1,688 441 1,121 48 79
2008 6,344 1,334 3,817 127 1,067 1,581 408 1,012 58 105
2009 5,949 1,274 3,474 94 1,107 1,635 414 964 41 216
2010 6,356 1,341 3,855 81 1,079 1,714 396 1,077 34 207
2011 6,297 1,307 3,794 118 1,079 1,788 375 1,139 46 228
2012 Q1 6,485 1,336 3,866 116 1,167 1,838 385 1,160 49 243
Q2 6,277 1,208 3,086 110 1,873 1,805 368 1,175 47 215
Q3 6,390 1,214 3,838 113 1,224 1,823 385 1,181 45 239
Percentages of outstanding amounts (at constant exchange rates, end of period)
1999 100.0 - - - - - - - - -
2000 100.0 24.0 55.1 5.4 15.5 - - - - -
2001 100.0 24.8 52.1 5.1 18.0 100.0 19.6 66.0 7.7 6.8
2002 100.0 24.6 51.3 4.7 19.4 100.0 21.7 58.6 7.5 12.1
2003 100.0 23.8 54.0 3.3 18.9 100.0 22.6 60.1 6.3 11.0
2004 100.0 23.4 54.7 3.7 18.2 100.0 25.2 59.0 5.0 10.8
2005 100.0 22.9 53.7 4.0 19.4 100.0 23.7 57.2 7.5 11.7
2006 100.0 20.0 56.9 3.9 19.2 100.0 21.5 61.0 5.4 12.1
2007 100.0 18.9 60.5 3.2 17.4 100.0 23.6 68.2 4.2 4.0
2008 100.0 19.6 60.3 2.3 17.8 100.0 24.1 64.4 4.3 7.2
2009 100.0 19.6 59.4 1.9 19.1 100.0 23.2 60.2 3.0 13.6
2010 100.0 20.5 60.9 1.3 17.3 100.0 22.5 63.2 2.1 12.3
2011 100.0 20.7 60.1 1.9 17.4 100.0 21.0 63.6 2.6 12.8
2012 Q1 100.0 20.1 59.9 1.9 18.1 100.0 20.4 63.5 2.8 13.3
Q2 100.0 19.7 48.9 1.8 29.7 100.0 20.8 64.7 2.7 11.8
Q3 100.0 19.0 60.1 1.8 19.2 100.0 19.6 64.8 2.5 13.1
Percentages of outstanding amounts (at current exchange rates, end of period)
1999 100.0 - - 4.6 - 100.0 - - - -
2000 100.0 18.6 62.0 4.1 15.3 - - - - -
2001 100.0 19.2 59.3 3.5 18.0 100.0 14.9 73.6 5.1 6.4
2002 100.0 21.5 55.3 3.3 19.9 100.0 19.0 63.1 5.3 12.7
2003 100.0 23.6 54.7 2.4 19.3 100.0 22.5 61.4 4.7 11.4
2004 100.0 24.3 54.0 2.8 18.9 100.0 26.4 58.5 3.7 11.4
2005 100.0 21.7 55.7 2.7 19.9 100.0 22.6 60.0 5.2 12.2
2006 100.0 20.4 56.9 2.5 20.2 100.0 22.1 61.6 3.5 12.7
2007 100.0 20.9 58.7 2.2 18.2 100.0 26.1 66.4 2.8 4.7
2008 100.0 21.0 60.2 2.0 16.8 100.0 25.8 64.0 3.7 6.6
2009 100.0 21.4 58.4 1.6 18.6 100.0 25.3 59.0 2.5 13.2
2010 100.0 21.1 60.7 1.3 17.0 100.0 23.1 62.9 2.0 12.1
2011 100.0 20.7 60.7 1.9 17.1 100.0 21.0 63.7 2.6 12.7
2012 Q1 100.0 20.6 59.6 1.8 18.0 100.0 20.9 63.1 2.7 13.2
Q2 100.0 19.2 49.2 1.8 29.8 100.0 20.4 65.1 2.6 11.9
Q3 100.0 19.0 60.1 1.8 19.2 100.0 19.6 64.8 2.5 13.1
Sources: BIS and ECB calculations.Note: Excluding interbank loans.1) Including loans to/from Japan, Switzerland, the United Kingdom and the United States in their domestic currency.2) Excluding loans to/from Japan, Switzerland, the United Kingdom and the United States in their domestic currency.

78ECB
The international role of the euro
July 201378
Table A12 The euro’s share as a invoicing/settlement currency in extra-euro area transactions of euro area countries
(as a percentage of the total)
1. Exports and imports of goods
2003 2004 2005 2006 2007 2008 2009 2010 2011 2012
Exports
Euro area - - - 59.5 59.6 63.6 64.1 63.6 64.9 62.5
of whichBelgium 56.6 57.7 54.8 58.5 52.8 56.2 57.4 52.3 55.3 56.6
France 49.0 49.2 49.8 50.8 51.5 49.3 52..3 51.8 51.9 48.8
Italy 58.2 59.0 58.3 59.4 64.3 68.7 69.2 67.4 - -
Greece 45.1 41.8 35.1 34.1 35.5 32.6 36.3 33.7 35.5 32.3
Spain 61.7 62.4 62.1 61.6 65.2 60.6 62.8 59.2 54.7 56.4
Cyprus - - - - 2.8 21.2 24.3 25.9 49.1 -
Luxembourg 51.5 61.8 61.4 57.7 59.2 51.9 50.3 63.2 55.3 -
Portugal 50.6 55.5 56.5 55.8 61.4 63.1 64.2 63.4 62.1 59.3
Slovenia - - - 74.2 79.0 79.4 84.7 82.7 83.5 81.6
Slovakia - - - - - 96.5 94.8 94.4 94.1 96.6
Estonia - - - - - - 52.4 48.2 69.7 71.5
Imports
Euro area - - - 48.8 47.9 47.5 45.2 49.5 49.8 49.0
of whichBelgium 57.8 55.7 51.2 58.3 56.1 56.4 57.7 53.0 55.7 57.3
France 44.1 45.7 46.3 44.7 44.8 44.2 44.3 44.4 47.3 46.3
Italy 44.5 41.2 39.4 43.0 44.3 47.8 49.7 46.9 - -
Greece 39.2 39.6 32.6 32.3 33.6 37.3 37.9 30.8 32.9 23.6
Spain 61.1 61.3 56.0 54.8 56.7 58.8 61.7 58.9 53.1 52.7
Cyprus - - - - 1.7 9.8 12.7 11.6 41.1 -
Luxembourg 41.9 50.0 43.8 38.8 37.9 38.8 55.3 55.0 48.7 -
Portugal 58.1 58.0 54.4 52.6 51.8 53.7 56.6 51.4 45.9 39.9
Slovenia - - - 64.0 73.1 75.0 69.9 61.9 64.2 54.1
Slovakia - - - - - 82.1 77.8 76.5 76.6 73.2
Estonia - - - - - - 47.1 45.1 60.9 66.0
Sources: National central banks and ECB calculations.1) Data for Estonia (services), Greece, Cyprus, Slovenia, Spain, Italy (goods until 2010), Portugal and Luxembourg refer to the currency of settlement. In the case of Luxembourg, a new survey for measuring international trade in services was introduced in 2012. It does not include information on the invoicing currency.2) Services data for Greece, Cyprus, Spain, Italy (after 2008) exclude travel item.3) Data for Italy for 2012 refer to the fi rst quarter only.
4 THE EURO IN INTERNATIONAL TRADE IN GOODS AND SERVICES

79ECB
The international role of the euro
July 2013 79
STAT IST ICAL ANNEX
2. Exports and imports of services
2003 2004 2005 2006 2007 2008 2009 2010 2011 2012
Exports
- - - 51.1 54.5 55.5 53.4 52.6 54.2 52.1
70.6 72.2 73.0 73.7 74.2 73.9 75.9 74.8 75.1 71.4
42.4 42.4 43.6 47.2 49.0 39.9 35.5 31.4 33.7 24.5
47.0 48.9 56.5 53.9 59.3 80.4 75.7 77.1 74.5 76.5
15.4 13.0 14.1 12.8 13.3 15.5 19.0 19.2 25.2 27.8
64.1 64.3 67.5 67.2 71.8 71.2 70.0 71.4 73.7 63.2
- - - - 40.0 39.9 37.7 38.9 45.0 51.1
41.6 41.9 42.4 47.7 48.4 46.6 47.2 45.7 48.3 -
54.0 56.2 58.2 60.8 59.9 65.8 68.1 62.1 62.1 60.1
- - - 80.1 80.8 83.2 82.7 80.1 85.4 85.8
- - - - - - 43.5 44.4 57.1 61.4
Imports
- - - 53.8 55.7 57.7 56.1 56.8 58.8 58.4
65.8 68.3 71.2 73.9 72.4 74.0 71.1 72.2 70.2 67.6
46.6 49.2 50.3 54.6 54.8 54.9 49.4 49.8 56.5 49.1
54.4 52.3 55.5 56.0 59.1 65.6 62.7 64.4 65.3 66.6
19.6 21.3 22.5 24.5 27.5 28.9 34.4 28.5 31.7 33.7
54.3 57.0 60.2 60.3 60.7 61.5 61.8 61.5 61.9 64.0
- - - - 27.9 13.3 50.9 51.2 45.7 59.4
34.3 30.2 31.2 29.8 34.0 38.4 41.2 48.0 45.8 -
68.9 70.8 72.5 74.5 72.6 73.3 72.7 71.3 66.7 62.1
- - - 53.1 57.2 58.1 64.8 67.1 69.2 66.4
- - - - - - 43.0 43.9 53.3 57.8

80ECB
The international role of the euro
July 201380
Table A13 The euro’s share in the exports and imports of selected non-euro area countries
(as a percentage of the total)
1. Exports and imports of goods
2003 2004 2005 2006 2007 2008 2009 2010 2011 2012Exports
Bulgaria 60.7 62.2 60.4 57.7 60.5 61.5 68.6 62.2 62.7 62.5
Czech Republic 70.3 73.4 71.9 68.8 72.0 73.6 76.0 76.4 77.0 77.2
Latvia 41.6 47.9 53.3 54.8 59.5 66.9 66.4 64.1 62.0 61.4
Lithuania 46.8 49.7 51.3 56.2 56.5 55.7 60.5 59.7 58.1 59.5
Poland 64.9 69.3 70.1 69.9 69.8 68.2 66.1 - - -
Romania 63.8 66.3 64.3 67.6 67.7 68.5 75.9 71.3 67.1 71.3
Sweden - - - - - - - 22.0 21.6 23.4
Imports
Bulgaria 62.7 63.6 60.4 58.9 60.2 62.7 70.9 62.6 61.8 58.9
Czech Republic 67.6 71.3 70.6 67.8 68.0 68.3 68.9 68.5 68.0 68.0
Latvia 49.6 52.8 59.2 61.2 67.2 67.4 66.1 62.1 62.9 63.3
Lithuania 53.0 55.0 51.3 53.8 55.4 55.6 57.2 55.8 55.7 55.4
Poland 60.2 61.7 60.5 58.6 59.1 56.4 54.8 - - -
Romania 67.9 70.8 71.1 73.4 71.5 70.9 73.2 66.8 64.2 60.4
Sweden - - - - - - - 18.8 18.5 17.3
2. Exports and imports of services
2003 2004 2005 2006 2007 2008 2009 2010 2011 2012Exports
Bulgaria - - - 73.1 76.3 77.9 79.0 65.1 67.2 66.7
Czech Republic 67.9 68.3 64.6 70.3 67.2 72.3 76.0 76.9 78.5 76.3
Latvia 20.7 26.4 33.2 37.9 42.5 51.5 54.1 52.5 51.0 53.2
Lithuania 42.8 49.4 51.1 51.9 53.9 54.7 59.8 56.9 54.2 56.5
Poland 64.9 69.3 70.1 69.9 69.8 68.2 66.1 - - -
Romania - - 71.0 72.0 71.2 75.2 73.8 62.2 67.0 64.4
Imports
Bulgaria - - - 69.9 77.1 77.1 80.8 73.8 73.2 75.4
Czech Republic 59.0 64.8 61.1 61.4 61.3 69.3 78.4 75.6 75.3 71.2
Latvia 25.4 29.0 33.3 36.8 39.3 42.7 43.0 44.3 35.9 34.9
Lithuania 43.0 47.0 47.8 54.1 53.5 51.0 52.4 50.5 50.8 51.0
Poland 52.1 53.0 54.8 54.3 54.0 54.0 58.9 - - -
Romania - - 64.0 69.0 74.6 74.5 78.6 69.4 69.5 63.6
Source: National central banks.1) Data for Bulgaria, Latvia and Romania refer to the currency of settlement.

81ECB
The international role of the euro
July 2013 81
STAT IST ICAL ANNEX
Table A14 Outstanding euro-denominated bank loans in selected countries
Outstanding amounts
(in EUR millions)
As a percentage of total loans
As a percentage of foreign
currency loans
Absolute amounts of foreign loans
(in EUR millions)2011 2012 2011 2012 2011 2012 2011 2012
Non-euro area EU Member StatesBulgaria 16,741 17,250 61.5 61.5 96.7 96.9 17,321 17,811
Croatia 21,443 20,898 61.7 61.4 82.6 84.1 25,975 24,837
Czech Republic 6,453 6,354 8.1 7.5 92.5 92.4 6,974 6,878
Hungary 14,444 13,049 25.6 24.8 40.5 43.9 35,669 29,700
Latvia 13,943 11,866 85.8 81.4 95.9 94.2 14,546 12,593
Lithuania 11,414 11,425 71.3 70.8 95.9 96.3 11,897 11,869
Poland 19,671 20,567 10.7 10.0 31.2 33.2 63,024 61,888
Romania 28,471 27,941 55.1 54.9 87.0 87.9 32,726 31,791
EU candidate and potential candidate countriesAlbania 2,261 2,222 58.9 57.1 88.9 88.9 2,542 2,500
Bosnia and Herzegovina* 121 92 1.7 1.3 90.0 88.7 135 104
FYR Macedonia 1,876 1,834 57.1 53.2 96.6 95.9 1,943 1,913
Serbia 9,540 9,995 58.2 60.1 82.2 83.7 11,612 11,946
Turkey 24,927 25,020 9.3 8.0 32.6 31.5 76,549 79,420
Sources: National central banks and ECB calculations.Notes: Defi nitions of loans may vary across countries. Data may be subject to revisions as compared with previous issues of this report owing to methodological changes. Where available, foreign exchange-indexed deposits are included. Figures for Turkey include foreign branches of Turkish banks.
Table A15 Outstanding euro-denominated bank loans in selected countries
Outstanding amounts
(in EUR millions)
As a percentage of total deposits
As a percentage of foreign currency
deposits
Absolute amounts of foreign deposits (in EUR millions)
2011 2012 2011 2012 2011 2012 2011 2012
Non-euro area EU Member StatesBulgaria 9,731 9,393 39.2 35.2 83.9 82.6 11,594 11,366
Croatia 18,590 19,686 60.2 60.6 89.4 89.2
Czech Republic 6,516 7,030 6.4 6.5 79.2 78.3 8,222 8,981
Hungary 6,790 7,233 15.8 15.7 78.7 78.7 8,624 9,197
Latvia 3,364 3,450 43.2 42.3 83.5 80.7 4,029 4,273
Lithuania 2,641 2,673 22.5 21.3 81.9 77.5 3,226 3,450
Poland 9,840 12,172 5.8 6.2 61.1 66.0 16,106 18,448
Romania 12,643 13,794 29.2 31.0 87.0 85.3 14,527 16,180
71.6 70.9
EU candidate and potential candidate countriesAlbania 2,043 2,310 30.5 32.6 61.4 64.2 3,330 3,601
Bosnia and Herzegovina 2,786 2,793 42.1 41.7 90.2 89.8 3,090 3,108
FYR Macedonia 1,745 1,646 45.8 42.4 87.0 86.9 2,006 1,893
Serbia 10,080 10,111 68.5 70.6 90.2 91.1 11,173 11,099
Turkey 35,010 38,683 12.7 12.5 39.2 39.8 89,205 97,257
73.6 74.4
Sources: National central banks and ECB calculations.Notes: Defi nitions of deposits may vary across countries. Data may be subject to revisions as compared with previous issues of this report owing to methodological changes. Where available, foreign exchange-indexed deposits are included. Figures for Turkey include foreign branches of Turkish banks.
5 THE EURO AS A PARALLEL CURRENCY: THE USE OF EURO-DENOMINATED BANK LOANS
AND DEPOSITS IN COUNTRIES OUTSIDE THE EURO AREA