THE EURO BONDS AND DERIVATIVES MARKETS JUNE · PDF fileissn 1830768-x 9 771830 768002 the euro...
75
THE EURO BONDS AND DERIVATIVES MARKETS JUNE 2007 EUROPEAN CENTRAL BANK THE EURO BONDS AND DERIVATIVE MARKETS JUNE 2007
Transcript of THE EURO BONDS AND DERIVATIVES MARKETS JUNE · PDF fileissn 1830768-x 9 771830 768002 the euro...

ISSN 1830768-X
9 7 7 1 8 3 0 7 6 8 0 0 2
THE EURO BONDS AND DER IVAT IVES MARKETS
JUNE 2007
EURO
PEAN
CEN
TRAL
BAN
KTH
E EU
RO B
ON
DS
AND
DER
IVAT
IVE
MAR
KET
S JU
NE
2007

THE EURO BONDS AND DER IVAT IVES MARKETS
JUNE 2007
In 2007 all ECB publications
feature a motif taken from the €20 banknote.

© European Central Bank, 2007
AddressKaiserstrasse 2960311 Frankfurt am Main Germany
Postal addressPostfach 16 03 1960066 Frankfurt am Main Germany
Telephone +49 69 1344 0
Websitehttp://www.ecb.int
Fax +49 69 1344 6000
Telex411 144 ecb d
All rights reserved. Reproduction for educational and non-commercial purposes is permitted provided that the source is acknowledged. ISSN 1830-7698 (online)

3ECB
The euro bonds and derivatives marketsJune 2007
CONTENTSCONTENTSEXECUTIVE SUMMARY 4
INTRODUCTION 6
1 OUTSTANDING AMOUNTS OF DEBT INSTRUMENTS 71.1 Debt securities 7
1.1.1 Euro debt securities and debt securities worldwide 7
1.1.2 Issuers of euro debt securities 10
1.2 Credit derivatives 281.3 Options and futures on debt
securities 31
2 TRADING AND POST-TRADING INFRASTRUCTURE 332.1 Infrastructure for debt securities 33
2.1.1 Trading debt securities 332.1.2 Post-trading arrangements
for debt securities 382.2 Infrastructure for credit derivatives 45
2.2.1 Trading infrastructure for credit derivatives 45
2.2.2 Post-trading infrastructure for credit derivatives 46
2.3 Infrastructure for futures and options on debt securities 472.3.1 Trading infrastructure for
options and futures on debt securities 47
2.3.2 Post-trading infrastructure for options and futures on debt securities 48
3 TRENDS IN PRICES, YIELDS AND SPREADS 493.1 Euro area government bond
yields and spreads 493.1.1 Yields and term spreads 493.1.2 Yield spreads across euro
area government bonds 503.2 Euro corporate bond spreads
and corporate CDS spreads 543.3 Bond bid-ask spreads 60
4 REGULATORY DEVELOPMENTS 63
ANNEX 66
GLOSSARY 68
LIST OF DRAFTERS 73

4ECBThe euro bonds and derivatives marketsJune 2007
EXECUTIVE SUMMARY
The markets for euro-denominated debt securities, meant as integrated markets no longer segmented along national borders, are still young institutional arrangements but have already achieved a high level of efficiency. This assessment applies in particular to government bond markets but is also valid for private sector bond markets.
On a global level, debt securities have become more and more important for raising funds: world bond markets have grown at rates clearly exceeding those of world GDP in the last few years. Outstanding amounts of euro-denominated debt securities have grown even faster than global markets. In 2006 the euro accounted for 27% of all debt securities outstanding, up from 22% in 1999. The corresponding shares for the US dollar and the Yen are about 43% and 14% respectively.
A bond segment which has grown particularly fast, as a result of globalisation, is the one in which an issuer denominates its securities in a currency different from its national one. The euro has increased its share in this segment since 1999, although it has slightly declined in the last two years. Whereas in Q3 1999 21% of all foreign currency denominated bonds were denominated in euro, this figure stood at 31% in Q3 2006, indicating that the euro has become particularly attractive as a currency in international capital markets.
In recent years euro bond markets have increasingly improved their attractiveness for private sector issuers. The share of private sector securities in all euro-denominated debt securities outstanding has risen from 43% in 1999 to 53% in 2006. This trend indicates that euro bond markets can ensure sufficient liquidity even for smaller issues, as private sector issues are, on average, smaller than government issues. Monetary Financial Institutions (MFIs), the biggest private sector issuer category in the euro area, increasingly issues short-term debt securities and floating
rate bonds. MFIs now raise funds at short-term interest rates not only through deposits, but also through debt securities.
The permanence of some spreads between yields of government bonds issued by different euro area governments do not indicate a lack of financial integration across the euro area, but are the result, in particular, of different ratings. It is particularly interesting to look at the yield spreads for France, the Netherlands and Austria as compared with Germany, the four countries that have been rated triple-A continuously since 1999. These yield spreads were clearly positive between 1999 and 2003, but have been close to zero ever since, suggesting that liquidity premia may have largely disappeared.
Euro government bond markets are complemented by a liquid and efficient futures and options market. Futures and options on euro-denominated government bonds are almost exclusively traded on one trading platform, Eurex, where open interest and trading volumes are still growing. Between 2002 and 2006 open interest in Eurex futures has grown by 23% per year and open interest in Eurex options by 18%.
Liquidity conditions in euro bond markets, measured in terms of bid-ask spreads, have improved significantly. Quoted spreads of corporate bonds went down from 0.38% of midquotes in 2003 to 0.24% in 2006, while spreads of government bonds declined from about 0.08% in 2003 to 0.05% in 2006. The main reason behind these improvements is stronger competition between market makers.
European bond trading, in particular trading of government bonds, displays a clear trend towards electronic systems. Sell-side firms (i.e. brokers, dealers) reported that 29% of their trades were executed electronically in 2006, up from 22 % in 2005. The share of electronic trading is expected to increase to 40% in 2007. Not only technical progress, but also competition between electronic trading platforms has probably contributed to lower trading fees and

5ECB
The euro bonds and derivatives marketsJune 2007
higher electronic trading volumes. However, the bulk of bonds are still traded via the phone or through voice brokers. European bonds are hardly traded on traditional exchanges.
The European securities post-trading infrastructure was highly fragmented when the single currency was introduced, but several initiatives aimed at consolidation have taken place since then. However, the post-trading infrastructures at cross-border level remain largely fragmented, complex and therefore costly. As a consequence, public authorities and market participants have launched a number of initiatives to foster integration and competition and enhance the inter-operability and efficiency of the post-trading environment.
Alongside the mature markets for euro-denominated bonds and related derivatives, two young and innovative markets segments deserve particular attention: securitisation markets and, even more so, markets for credit derivatives. Both have displayed outstanding growth rates and many new features over the past few years.
Outstanding notional amounts of credit default swaps (CDSs), the most important credit derivatives, have grown worldwide at annual rates of 100% and more over the past three to four years and are now estimated to be about three times higher than outstanding amounts of world cash corporate bond markets. Empirical analysis shows that the market for euro-denominated credit default swaps now leads prices of underlying corporate bonds.
Innovations that have supported this growth have been numerous. The introduction of CDS indices, in particular the iTraxx index family in Europe, has fostered standardisation of instruments and has boosted market activity since 2004. CDS indices also paved the way for CDS index tranches, a product at the heart of the relatively new but strongly growing correlation markets. Other important market initiatives allow a reliable pricing of CDS obligations, facilitating cash settlement of
credit derivatives and multilateral netting of CDS contracts.
In the European securitisation markets between 2000 and 2005, gross issuance has grew about twice as fast as MFI gross issuance and 6 times faster than gross issuance from non-financial corporations. However, growth slowed somewhat after 2001 as securitisation markets reached higher levels of maturity. Synthetic securitisation, which makes use of credit derivatives such as CDSs and is particularly important in Europe, has advanced particularly fast in recent years. Major innovations in securitisation can also be observed in the field of synthetic processes. To be mentioned are, for example, Constant Proportion Debt Obligations (CPDOs), products that have received particular interest as they are highly rated and at the same time promise high interest.
Several regulatory initiatives have been started in recent years aimed at creating a single market in financial services across the EU and thus enhancing the efficiency of financial markets in general. These initiatives include the Prospectus Directive, the Transparency Directive, the Directive on Markets in Financial Instruments (MiFID), the Directive on Undertakings for Collective Investment in Transferable Securities (UCITS), the Collateral Directive and the Clearing and Settlement Code of Conduct. They are expected to have an impact on markets for euro-denominated bonds and related derivatives, although several of the measures are focused on the equity markets and it needs to be assessed whether it is appropriate to extend their scope to bond markets.
EXECUT IVE SUMMARY

6ECBThe euro bonds and derivatives marketsJune 2007
INTRODUCTION
This report, prepared by the Market Operations Committee of the Eurosystem and in particular by the team of drafters listed at its end, describes major developments in markets for euro-denominated debt securities and related derivatives over the past eight years. Its purpose is to provide detailed information on and a good understanding of these markets through descriptive and analytical illustrations. It focuses on those developments that are mainly structural and as such of a longer-term nature. Like its predecessor, the ECB’s Euro Bond Market Study of December 2004, this new report covers bonds, but also reviews markets for credit derivatives as well as options and futures on bonds.
The report is organised into four chapters. Chapter 1 describes various instruments in terms of outstanding nominal or notional amounts and thereby provides a picture of the relative importance of the instruments. Trading and post-trading infrastructures for bonds and derivatives are discussed in Chapter 2. Chapter 3 looks at trends in yields, yield spreads, bid-ask spreads and the like. The final chapter, Chapter 4, discusses the most relevant legal and regulatory initiatives.

7ECB
The euro bonds and derivatives marketsJune 2007
1 OUTSTANDING AMOUNTS OF DEBT INSTRUMENTS
This chapter illustrates developments in the different types of debt instruments and their relative importance in terms of outstanding amounts. Section 1.1 discusses debt securities. It provides several indications that the markets for euro-denominated bonds and notes have been maturing further over the past eight years. They have been growing faster than world bond markets while the euro has gained importance as a currency of denomination for issuers from outside the euro area. In addition, more and more private sector issuers are raising funds by issuing euro-denominated debt securities. Credit derivatives and options and futures on debt securities are analysed in Sections 1.2 and 1.3 in turn. Markets for both instruments are growing rapidly. While options and futures markets are already very mature, markets for credit derivatives can still be classified as very young markets that show impressive growth rates and innovations.
1.1 DEBT SECURITIES
The outstanding nominal amount of euro-denominated debt securities increased by 84% between Q1 1999 and Q4 2006, i.e. at an annual rate of 8% (see Table 1). Not surprisingly, the bulk of euro-denominated debt securities are issued by euro area issuers. However, the share of euro-denominated debt securities issued by non-euro area issuers has increased significantly.
First, sub-section 1.1.1 looks at euro-denominated debt securities in general and compares them
Table 1 Outstanding nominal amounts of euro denominated debt securities
(in EUR billions; by residence of issuer)
Source: ECB data.Note: Euro area including Greece since 2001.
Q1 1999 Q4 2000 Q4 2002 Q4 2004 Q4 2006
Euro area 5,800 6,499 7,451 8,581 9,859Rest of the world 581 878 1,059 1,452 1,866Total 6,381 7,377 8,509 10,033 11,725
with debt securities denominated in other currencies. Different types of euro-denominated debt securities – public debt securities, debt securities issued by monetary financial institutions (including covered bonds), asset-backed securities and, last, debt securities issued by non-financial corporations – are then analysed in sub-section 1.1.2.
1.1.1 EURO DEBT SECURITIES AND DEBT SECURITIES WORLDWIDE
Debt securities are becoming globally more and more important for raising funds. Outstanding nominal amounts worldwide have roughly doubled over the past seven to eight years, growing much faster than world GDP. At the same time the share of euro-denominated debt securities has risen significantly, although it is still below the US dollar share.
As a result of globalisation, the segment of debt securities denominated in a foreign currency from the issuer’s point of view grew rapidly worldwide by 140% between 1999 and 2006. Until 2004, the market share of euro-denominated securities in this segment increased strongly, indicating a growing interest of non-euro area issuers in raising euro funds at arm’s length.
World bond markets have been growing substantially in recent years, with growth rates clearly exceeding world GDP growth. Fund raising through the issuance of debt securities appears to be growing more attractive around the globe. According to BIS data, outstanding nominal amounts of debt securities worldwide increased from USD 34,428 billion in Q3 1999 to USD 65,796 billion in Q3 2006, i.e. by 91%
1 OUTSTANDING AMOUNTS OF DEBT
INSTRUMENTS

8ECBThe euro bonds and derivatives marketsJune 2007
or at an annual rate of 9.7%. Growth rates were relatively low during the recession years 2000 and 2001 and picked up again in 2002 (see Chart 1).
In the same time the outstanding nominal amounts of euro-denominated debt securities increased even faster by 134% from USD 7,651 billion to USD 17,913 billion.1 Although the particularly strong increase for euro-denominated securities must to some extent be attributed to valuation effects, it also indicates a growing relative attractiveness of markets for euro-denominated bonds and notes. The euro now accounts for about 27% of all debt securities, the US dollar for roughly 43% and the Yen for 14%.
It is helpful to decompose the outstanding amounts of debt securities worldwide into two subcomponents as they display somewhat different trends. We first look at debt securities denominated in the currency of the country of the issuer (home currency denominated debt securities) and then move on to those denominated in a foreign currency.2
The outstanding amount of home currency denominated debt securities rose from USD
Chart 2 Outstanding nominal amounts of home currency denominated debt securities, currency shares(USD, currency conversion at current exchange rates; percentages)
Sources: BIS data, ECB calculations.
othersYenUS dollareuro
Sep.1999
Sep.2000
Sep.2001
Sep.2002
Sep.2003
Sep.2004
Sep.2005
Sep.2006
0102030405060708090
100
0102030405060708090100
Chart 1 Outstanding nominal amounts of debt securities worldwide, by currency of denomination(in USD trillions, currency conversion at current exchange rates)
Sources: BIS data, ECB calculations.
othersYenUS dollareuro
0
10
20
30
40
50
60
70
0
10
20
30
40
50
60
70
Sep.1999
Sep.2000
Sep.2001
Sep.2002
Sep.2003
Sep.2004
Sep.2005
Sep.2006
31,406 billion in Q3 1999 to USD 58,539 billion in Q3 2006. This was an increase of 86%, slightly below the 91% increase for all debt securities. Home currency denominated debt securities now account for around 89% of all debt securities worldwide.
The currency shares are depicted in Chart 2. While remaining below the US dollar share, the share of euro-denominated securities went up from 22% in 1999 to about 27% in 2006. The upwards trend has been continuous since 2000. The share of US dollar securities decreased between 1999 and 2006 from 47% to 43% and that of Japanese Yen securities from 18% to 15%.
The increase in the share of euro-denominated securities is to some extent the result of valuation effects from exchange rate developments. The euro appreciated against the
1 This corresponds to an increase of 93% from €7,286 billion to €14,075 billion. It may be noted that this result differs from the result obtained from ECB data as described in Table 1. This discrepancy is mainly due to differences in the methodologies applied by the ECB and the BIS.
2 A detailed analysis of the role of the euro in international bond markets can also be found in the ECB’s Review of the International Role of the Euro.

9ECB
The euro bonds and derivatives marketsJune 2007
Chart 3 Outstanding nominal amounts of home currency denominated debt securities
(in USD trillions)
Sources: BIS data, ECB calculations.
euro, converted into USD at current exchange rateseuro, converted into USD at exchange rates of Q1 1999US dollar
Sep.1999
Sep.2000
Sep.2001
Sep.2002
Sep.2003
Sep.2004
Sep.2005
Sep.2006
0
5
10
15
20
25
30
0
5
10
15
20
25
30
Chart 4 Outstanding nominal amounts of home currency denominated debt securities
(in % of nominal GDP)
Sources: BIS and OECD data, ECB calculations.
euro areaUSJapan
1999 2000 2001 2002 2003 2004 20050
50
100
150
200
250
0
50
100
150
200
250
US dollar as well as against the Japanese yen. The dollar value of euro-denominated securities rose accordingly. The US dollar value of euro-denominated securities rose by 113% between 1999 and 2006 if current exchange rates are used for the conversion of EUR into USD and by 93% if a constant exchange rate is used. However, at the same time the outstanding amount of US dollar denominated securities increased by only 72% (see Chart 3). Thus, there are other reasons than valuation effects behind the growing relative importance of the euro for home currency denominated debt securities.
One other factor that could have influenced the share of euro-denominated debt securities as described in Chart 2 may be a growing attractiveness of securities markets to euro area entities for raising euro funds, compared with other means of financing. Chart 4 gives a rough indication of this trend. Relative to the nominal GDP of the respective currency areas, the markets for US dollar denominated debt securities and for euro and yen denominated debt securities have grown. The strongest growth occurred in Japan, owing to the very moderate GDP growth between 1999 and 2006. Euro-denominated debt securities are still less important than dollar or yen-denominated debt
securities relative to the economic size of the respective currency area, but the gap to US dollar denominated debt securities has been growing smaller since 2002.
However, moderate GDP growth in the euro area compared to GDP growth worldwide might have limited growth in euro securities markets at the same time.
The second sub-component of debt securities comprises debt securities denominated in a foreign currency from the issuer’s point of view. The outstanding total amount rose from USD 3,022 billion in Q3 1999 to USD 7,250 billion in Q3 2006. This is an increase of 140%. While foreign currency denominated debt securities accounted for only 8.7% of all debt securities worldwide in 1999, they accounted for 11% in 2006. In a globalising world it is apparently becoming more attractive for issuers to issue debt securities denominated in foreign currencies.
Chart 5 shows the currency shares with respect to foreign currency denominated debt securities. The share of euro-denominated securities went up from 21% in Q3 1999 to about 32% in 2004. Since then, it has slightly decreased to 31% in Q3 2006. The growth of the share of the euro
1 OUTSTANDING AMOUNTS OF DEBT
INSTRUMENTS

10ECBThe euro bonds and derivatives marketsJune 2007
since 1999 can only partially be explained by the appreciation of the euro against the US dollar.3 Another reason may be a growing appetite among non-euro area entities to raise euro funds through the issuance of debt securities (borrowing at “arm’s length”) rather than through for example bank loans as markets for euro-denominated debt securities have been growing more liquid since the start of Economic and Monetary Union (EMU). In addition, euro area entities may have been particularly active as originators of asset-backed securities, which are often issued by a special purpose vehicle located outside of the euro area (see sub-section of Section 1.1.2 on securitisation below).
On 4 January 2007 the International Capital Market Association (ICMA) published data on the international bond market. International bond markets as defined by the ICMA comprise bonds with an international syndicate and sold outside of the issuer’s home market. The data show that at the end of 2006 the size of this market, measured in terms of outstanding amounts in all currencies, was USD 10,545 billion. Euro-denominated bonds account for 45% and US dollar denominated bonds for 36% of this amount. While the euro is still less important than the US dollar for foreign currency denominated bonds, it is more important now for international bond markets. An important reason relates to the fact that euro-denominated bonds from a euro area issuer issued through the international central securities depositories (ICSDs, see also Chapter 2) Euroclear Bank (Belgium) and Clearstream Banking Luxembourg are typically regarded as part of the international bond market, although they are not foreign currency denominated. Since EMU, the issuance of euro-denominated bonds through the ICSDs has become increasingly attractive in particular for corporate issuers in order to reach investors from several countries efficiently.
1.1.2 ISSUERS OF EURO DEBT SECURITIES Eight years ago, public authorities were behind 57% of all euro-denominated debt securities issued by euro area entities. They now account
Chart 5 Outstanding nominal amounts of foreign currency denominated debt securities, currency shares(USD, currency conversion at current exchange rate; percentages)
Sources: BIS data, ECB calculations.
othersYenUS dollareuro
Sep.1999
Sep.2000
Sep.2001
Sep.2002
Sep.2003
Sep.2004
Sep.2005
Sep.2006
0102030405060708090
100
0102030405060708090100
for only 47% of such securities. This trend indicates that euro bond markets are becoming increasingly attractive for private sector issuers. Financial corporations, including MFIs and non-MFI financial corporations, represent almost half of all issues now. The fastest growing segment by far comprises debt securities issued by non-MFI financial institutions such as special purpose vehicles (SPVs) set up for asset securitisation.
The most important types of non-euro area issuer of euro-denominated debt securities are MFIs and non-MFI financial institutions. 37% of all issues from non-MFI financial institutions originate from outside of the euro area, probably reflecting the fact that asset-backed securities denominated in euro are often issued by non-euro area SPVs.
Table 2 provides an overview of debt securities by issuer type for euro area issuers. Slightly less than half of all euro-denominated debt securities are issued by public authorities so this market segment is still the most important
3 Measured at constant exchange rates, the share of the euro also rose gradually since 1999, but started to slightly decline in 2005.

11ECB
The euro bonds and derivatives marketsJune 2007
Table 2 Euro denominated debt securities issued by euro area1) issuers
(outstanding nominal amounts; in EUR billions; by type of issuer)
Q1 1999 Q4 2000 Q4 2002 Q4 2004 Q4 2006 Increase (%)
Public issuers 3,283 3,436 3,835 4,274 4,596 40MFIs 2,085 2,424 2,677 3,123 3,668 76Non-MFI financial institutions 146 266 465 667 1,035 609Non-financial corporations 286 373 473 518 561 96Total 5,800 6,499 7,452 8,582 9,859 70
Source: ECB data.1) Euro area including Greece since 2001.
one, followed by debt securities issued by monetary financial institutions (MFIs),4 by non-MFI financial institutions and those issued by non-financial corporations. For central governments in particular, the issuance of debt securities is an efficient fund-raising tool. The funding needs of governments are relatively high. Issuance volumes can easily reach a size that justifies the fixed costs of issuance and contributes to increasing liquidity in secondary markets so that bid-ask spreads remain low. Moreover, government bonds are widely accepted as collateral in repo transactions as they are particularly safe.
However, the relative importance of public debt securities has been decreasing. In Q1 1999 public issuers accounted for 57% of all debt securities. In Q4 2006 this figure stood at 47%. Euro bond markets are thus becoming increasingly attractive also for private sector issuers. This trend is interesting as private sector issues are, on average, much smaller than public sector issues. It suggests that euro bond markets can now ensure enough liquidity even for smaller issues.
4 Monetary financial institutions (MFIs) include the Eurosystem, and all financial institutions whose business is (1) to receive deposits and/or close substitutes for deposits from entities other than MFIs and (2) to grant for their own account credit and/or invest in securities.
Table 3 Euro denominated debt securities issued by non euro area issuers
(outstanding nominal amounts; in EUR billions; by type of issuer)
Q1 1999 Q4 2000 Q4 2002 Q4 2004 Q4 2006 Increase (%)
Public issuers 170 202 106 122 128 -25MFIs 114 202 271 523 771 576Non-MFI financial institutions 145 275 451 553 685 374Non-financial corporations 29 81 114 129 155 436Others 123 118 116 124 127 4Total 581 878 1,058 1,452 1,866 221
Source: ECB data.
The smallest market segment in 1999, securities issued by non-MFI financial institutions, has been at the same time the fastest growing segment by far (an increase of 609%) and is now bigger than the segment of issues from non-financial corporations. Non-MFI financial institutions comprise insurance corporations, pension funds and other financial institutions as for example financial vehicles set up for securitisation purposes (special purpose vehicles), investment funds and financing arms of non-financial corporations like industrial corporations as well as financing arms of MFIs. The high growth rates for this market segment might be partly the result of the strong trend towards securitisation through special purpose vehicles (SPVs).
Non financial corporations still appear to be relatively inactive as issuers of debt securities, presumably a result of the relatively low
1 OUTSTANDING AMOUNTS OF DEBT
INSTRUMENTS

12ECBThe euro bonds and derivatives marketsJune 2007
funding needs of this type of economic entities or a preference to raise funds through bank loans.
Table 3 describes outstanding amounts for non-euro area issuers. As indicated already before (see Table 1), outstanding amounts of euro-denominated debt securities issued by non-euro area issuers have been growing much faster than outstanding amounts of euro-denominated debt securities issued by euro area issuers (221% compared to 70%, according to ECB data). A comparison of the data provided in Tables 2 and 3 for each issuer group in turn is especially interesting. First, we find that MFIs located outside of the euro area increased their outstanding amounts by much more than euro area MFIs (576% versus 76%). The attractiveness of euro bond markets and/or the euro for non-euro area MFI issuers seems to have increased particularly sharply. Second, the outstanding amounts issued by non-euro area issuers are much lower than those issued by euro area issuers for all issuer groups except non-MFI financial institutions. Non-euro area non-MFI financial institutions were behind 37% of all euro-denominated debt securities issued by non-MFI financial institutions in 2006. An important reason for this might be the tendency to establish SPVs outside the euro
Chart 6 Nominal amounts of euro denominated debt securities, by securities rating(issued in September 2006)
AAA43%
AA30%
A18%
BBB5%
BB2%
NR4%
Sources: European Commission, ECFIN.
area, for example in the Cayman Islands, for tax related purposes.
Around 90% of euro debt securities, including securities issued by euro area issuers and by non-euro area issuers, are at least A-rated (see Chart 6). The main reason is the high share of bonds issued by governmental issuers. Indeed, all national euro area governments are rated A or above (see Chapter 3). Moreover, covered bonds, accounting for around one third of all MFI issues, are typically A-rated. The share of A-rated and higher rated debt securities has been fairly stable since 2001, according to data from the European Commission.
PUBLIC DEBT SECURITIES 79% of euro area public debt was financed through debt securities denominated in euro in 2006, up from 75% in 2000. The shares of long-term bonds and of fixed rate securities have increased slightly since EMU to 92% and 90% respectively in 2006.
Public debt securities are any debt securities issued by public authorities. This includes in particular central, regional and local government authorities and social securities funds. Excluded are government-owned entities that conduct commercial operations such as public enterprises. According to ECB data, the outstanding nominal amount of euro-denominated public debt securities increased by 40% from €3,372 billion in Q1 1999 to €4,727 billion in Q4 2006 (see Tables 2 and 3). At the same time, the outstanding nominal amounts of all euro-denominated debt securities increased between Q1 1999 and Q4 2006 by 86% to €11,732 billion (see Table 1).
Table 4 provides an overview of euro-denominated public debt securities by country of issuer between 2000 and 2006. In this period, the outstanding nominal amount of euro-denominated public debt securities issued by euro area public authorities increased on average by 4.9% each year. The sharp increase for Greece between 2000 and 2002 was, of course, the result of Greece joining the euro

13ECB
The euro bonds and derivatives marketsJune 2007
Table 4 Outstanding nominal amounts of euro denominated public debt securities
(in EUR billions; end of period)
Source: ECB data.1) The average annual increase for Greece refers only to the years 2002 to 2006.
2000 2002 2004 2006 Average annual
increase (%)
Austria 101.5 110.2 114.4 128.9 4.1 Belgium 242.8 256.0 254.2 256.3 0.9 Germany 779.9 867.3 1,006.6 1,123.1 6.3 Spain 303.0 319.0 330.9 336.9 1.8 Finland 53.9 51.0 54.8 53.4 -0.2 France 643.4 743.2 891.9 950.1 6.7 Greece1) 11.4 123.3 158.8 185.5 10.7 Ireland 21.8 22.3 31.3 31.2 6.2 Italy 1,064.9 1,094.8 1,144.2 1,232.8 2.5 Luxembourg 0.7 0.6 0.4 0.1 -27.6 Netherlands 177.6 189.2 215.4 211.8 3.0 Portugal 47.2 59.8 72.9 89.8 11.3 Euro area 3,448.1 3,836.9 4,275.8 4,599.9 4.9 Rest of the world 105.3 108.0 123.8 127.1 3.2 Total 3,553.4 3,944.9 4,399.6 4,727.0 4.9
Table 5 Outstanding nominal amounts of euro denominated public debt securities
(in % of public debt)
Source: ECB data.
2000 2002 2004 2006
Austria 73.3 75.7 76.0 79.5 Belgium 89.8 92.7 93.2 92.0 Germany 63.8 67.1 69.4 70.5 Spain 81.2 83.3 85.2 85.9 Finland 93.0 85.9 81.5 80.1 France 79.8 82.4 83.4 81.1 Greece 8.2 77.6 86.9 90.9 Ireland 55.2 53.3 71.5 65.2 Italy 82.1 80.1 79.4 78.7 Luxembourg 56.1 38.1 22.0 3.3 Netherlands 79.0 80.5 83.8 76.7 Portugal 76.6 79.6 87.0 88.8 Euro area 74.5 77.7 79.0 78.5
area in January 2001. Before 2001, most Greek public debt securities were still denominated in drachma, and they were converted into euro as of 1 January 2001. Countries with sharp increases either witnessed strong GDP growth (Ireland) or higher public debt levels relative to GDP (Germany, Greece, France, Portugal).
Table 5 shows outstanding euro-denominated public debt securities in percent of all public debt.5 The importance of euro-denominated debt securities for public authorities in most
euro area countries for raising funds increased slightly from 2000 to 2002 and was fairly stable in the following years. That means that the increase in outstanding public debt securities between 2000 and 2006 as reported in Table 4 does not reflect a shift from other means of raising funds towards issuing debt securities,
5 Ideally, one would compare outstanding amounts of euro-denominated public debt securities with euro denominated public debt. However, the proportion of euro area public debt denominated in currencies other than the euro is small and can be neglected.
1 OUTSTANDING AMOUNTS OF DEBT
INSTRUMENTS

14ECBThe euro bonds and derivatives marketsJune 2007
but was mainly due to increased fund raising by public authorities.
Chart 7 shows that public authorities in the euro area rely much less than MFIs and non-financial corporations on short-term debt securities. In addition, public authorities reduced the share of short-term securities somewhat further between 1999 and 2006, during which time the outstanding amount of short-term public debt securities increased by only 19%, compared to an increase of 45% for long-term public debt securities. In 2006 the outstanding amount was €372 billion, or about 8% of all debt securities issued by public issuers.
This trend might have several reasons, of which two are mentioned here. First, institutional investors, in particular pension funds and life insurers, have been growing more active in financial markets in recent years as a consequence of the ageing population in Europe. These institutional investors tend to invest in longer-term government bonds, so the demand for long-term securities might have increased accordingly. Second, central governments have been increasing the size of debt securities to enhance liquidity in secondary markets and to reduce issuing costs. They are issuing longer-term bonds and increasing the volume of existing bonds (fungible issues) rather than issuing new securities when they need to raise additional funds.6
In the segment of long-term debt securities, securities with a maturity of ten years or more play the major role as they have accounted for about 50% of these instruments in the past four years.
The coupon structure of long-term public debt securities has changed slightly since 1999. In 1999 about 85% of all long-term public debt securities were fixed rate bonds and 12% were floating rate bonds. In 2006 the share of fixed rate bonds increased to 90% and that of floating rate bonds decreased to 9%.7
Chart 7 Outstanding nominal amounts of euro-denominated short-term debt securities issued by euro area issuers1)
(by original maturity, in percent of all debt securities issued by the respective issuer type)
Source: ECB data.Note: Short term debt securities have an initial maturity of less than one year, long term debt securities of at least one year.1) Excluding Greece up to December 2000.
MFIspublic sectornon-financial corporations
Aug.1999
Aug.2000
Aug.2001
Aug.2002
Aug.2003
Aug.2004
Aug.2005
Aug.2006
0
5
10
15
20
25
30
0
5
10
15
20
25
30
Another recent trend is the issuance of inflation-indexed bonds by public authorities.8 France, Italy, Greece, Austria (to a very minor extent) and, for the first time in 2006, Germany have issued inflation-indexed bonds. According to Bloomberg data, in November 2006 the outstanding amount stood at €177 billion, accounting for 3.8% of all euro area public debt securities, up from €160 billion or 3.5% at the end of 2005. This was an increase of 10.6%.
The trend towards inflation indexation goes hand in hand with a tendency of governments to issue long-term bonds. Inflation-indexed bonds are typically characterised by relatively long maturities of around 10 years and more. Several euro area governments have started to issue bonds with maturities of more than 30 years in the past three years, including Austria, Belgium, Italy, France, Greece, the Netherlands,
6 To ensure in this context that the term structure of interest rate obligations remains unchanged, interest rate swaps can be used, i.e. longer term fixed interest payments are replaced by short-term variable interest rates.
7 The remaining 3% in 1999 and 1% in 2006 refer to zero coupon bonds and revaluation effects.
8 See Deutsche Bundesbank Monthly Bulletin October 2006, page 42.

15ECB
The euro bonds and derivatives marketsJune 2007
Portugal and Spain. Aging populations are forcing pension funds to invest in long-term inflation-indexed debt to ensure a matching of assets with obligations. As issuers of debt securities, governments have to react to the changing demand accordingly.
DEBT SECURITIES ISSUED BY MONETARY FINANCIAL INSTITUTIONS Since the start of EMU, outstanding amounts of debt securities directly issued by euro area MFIs (i.e. not through an SPV as asset-backed securities) have accounted for about 15% of all MFI liabilities, i.e. the importance of debt securities for MFIs has remained stable. In contrast to public authorities, euro area MFIs have increased the share of short-term debt securities and floating rate bonds.
About 33% of all debt securities issued by euro area MFIs are covered bonds. However, the share of covered bonds has been decreasing since 2001. Germany is still by far the most important euro area country for covered bonds, followed by Spain. However, outstanding amounts of covered bonds have declined in Germany, while they have increased sharply in Spain.
As described in Tables 2 and 3, the outstanding amount of euro-denominated debt securities issued by euro area MFIs increased by 76% between 1999 and 2006 to €3,670 billion, while those issued by non-euro area MFIs increased by 579% to €771 billion.9 There may be at least two possible reasons for this sharp increase in the amounts issued by non-euro area MFIs. First, worldwide demand for foreign currency may have been growing in recent years owing to continuing globalisation. Second, raising funds through the issuance of debt securities may have become more attractive as demand has increased and liquidity conditions have improved in markets for euro-denominated debt securities since the introduction of the euro. This may have had a particularly strong influence on the way non-euro area MFIs borrow euro funds.
For euro area MFIs, outstanding amounts of euro-denominated debt securities in percent of all euro-denominated liabilities remained stable at around 15% between 2000 and 2006. Therefore the importance of debt securities for raising euro funds does not seem to have changed significantly. It should however be noted in this context that securities issued through a special purpose vehicle (SPV) are not classified as MFI securities (but as securities issued by non-MFI financial institutions) although they do originate from MFIs.
Chart 7 above shows the maturity profile of MFI debt securities. MFIs, in contrast to public issuers, seem increasingly to be relying on short-term debt securities. Between Q1 1999 and Q4 2006 outstanding amounts of short-term debt securities rose by 145% to €421 billion, now accounting for 12% of all MFI debt securities. At the same time, outstanding amounts of long term debt securities increased by 69% to €3,249 billion. However, as discussed in Box 1, outstanding amounts of long-term MFI securities have grown faster
Chart 8 Outstanding nominal amounts of euro-denominated long-term debt securities issued by euro area MFIs1)
(fixed versus floating rate issues, shares, August data; percentages)
Source: ECB data.1) Including Greece for all years.
othersfloating ratefixed rate
1999 2000 2001 2002 2003 2004 2005 20060
20
40
60
80
100
0
20
40
60
80
100
9 By comparison, non-euro denominated debt securities issued by euro area MFIs had an outstanding amount of €286 billion in 1999 and of €832 billion in 2006, an increase of 191%.
1 OUTSTANDING AMOUNTS OF DEBT
INSTRUMENTS
16ECBThe euro bonds and derivatives marketsJune 2007
than deposits held with MFIs plus outstanding amounts of short-term MFI securities, indicating that MFIs are reducing their reliance on raising short-term funds through deposits.
Euro area MFIs show a clear and strong trend towards floating rate bonds as shown in Chart 8. In 1999 about 21% of long-term MFI debt securities were floating rate issues. This share increased to 39% in 2006. See Box 1 for a detailed discussion.
Curiously, public debt securities on the one hand and MFI debt securities on the other show opposite trends with respect to maturities and coupon types. A possible explanation is that the partial retreat of public authorities from short-term debt securities and from floating rate bonds has left a gap that has been filled by MFI issues so that demand and supply has remained in balance without significant price movements.
Box 1
THE ISSUANCE OF LONG-TERM DEBT SECURITIES BY MFIs
Although much of the money lent by banks is raised through the taking of deposits, MFIs are the second largest group of issuers of debt securities in the euro area economy, just behind the general government sector. MFIs are also the largest issuers of floating-rate long-term debt securities. MFIs issue both short-term and long-term debt securities. Short-term securities are in many cases certificates of deposits, which are closely related to bank deposits. The bulk of the debt securities issued by MFIs – accounting for nearly 90% of total outstanding – are, however, notes and bonds that have a long original maturity.
The use of market instruments by banks may serve several purposes.1 First, it enables banks to diversify their funding base. Second, floating-rate long-term debt securities save on the cost of constantly rolling over short-term securities as they reach maturity. Third, the issuance of floating rate securities might avoid uncertainties associated with what could be an unreceptive market at some future date. Fourth, the use of long-term debt securities may bring funding more in line with the characteristics of the assets, and offers benefits for banks in their management of portfolio maturity and their risk exposure. The use of floating-rate securities enables a closer matching of income flows from variable-rate assets. Issuers can fix or lock-in a spread between the cost of borrowed funds and the rate at which those funds are lent.
This box focuses on long-term debt securities issued by MFIs and seeks to provide some insights into two main questions. First, why do MFIs issue these types of instrument and why has their importance relative to deposits increased over recent years? Second, what is behind the increasing importance of floating-rate long-term debt securities issued by MFIs?
Issuance of long-term debt securities issued by MFIs
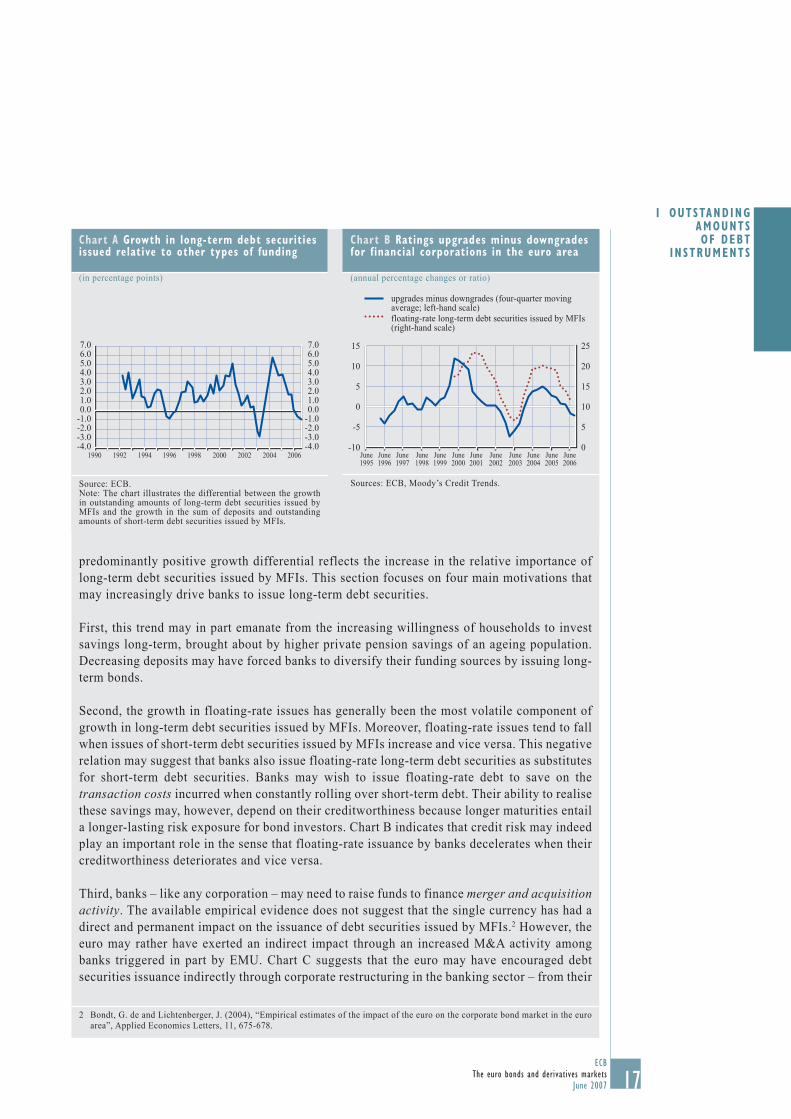
Chart A illustrates the differential between the growth in long-term debt securities issued by MFIs and the growth in retail deposits plus short-term debt securities issued by MFIs. The
1 See, for example, Caudamine, G. and Montier, J. (1998), “Banque et marchés financiers”, Economica (Paris); ECB (2006), “The changing structure of EU banks’ funding and its implications for their activities” in: EU banking structures, Chapter 3, October; and Fabozzi, F. J. and Modigliani, F. (2003), “Capital Markets – Institutions and Instruments”, Prentice Hall, Pearson Education International, 3rd international edition.
17ECB
The euro bonds and derivatives marketsJune 2007
predominantly positive growth differential reflects the increase in the relative importance of long-term debt securities issued by MFIs. This section focuses on four main motivations that may increasingly drive banks to issue long-term debt securities.
First, this trend may in part emanate from the increasing willingness of households to invest savings long-term, brought about by higher private pension savings of an ageing population. Decreasing deposits may have forced banks to diversify their funding sources by issuing long-term bonds.
Second, the growth in floating-rate issues has generally been the most volatile component of growth in long-term debt securities issued by MFIs. Moreover, floating-rate issues tend to fall when issues of short-term debt securities issued by MFIs increase and vice versa. This negative relation may suggest that banks also issue floating-rate long-term debt securities as substitutes for short-term debt securities. Banks may wish to issue floating-rate debt to save on the transaction costs incurred when constantly rolling over short-term debt. Their ability to realise these savings may, however, depend on their creditworthiness because longer maturities entail a longer-lasting risk exposure for bond investors. Chart B indicates that credit risk may indeed play an important role in the sense that floating-rate issuance by banks decelerates when their creditworthiness deteriorates and vice versa.
Third, banks – like any corporation – may need to raise funds to finance merger and acquisition activity. The available empirical evidence does not suggest that the single currency has had a direct and permanent impact on the issuance of debt securities issued by MFIs.2 However, the euro may rather have exerted an indirect impact through an increased M&A activity among banks triggered in part by EMU. Chart C suggests that the euro may have encouraged debt securities issuance indirectly through corporate restructuring in the banking sector – from their
Chart A Growth in long-term debt securities issued relative to other types of funding
(in percentage points)
Source: ECB.Note: The chart illustrates the differential between the growth in outstanding amounts of long-term debt securities issued by MFIs and the growth in the sum of deposits and outstanding amounts of short-term debt securities issued by MFIs.
1990 19941992 1996 1998 2000 200620042002-4.0-3.0-2.0-1.00.01.02.03.04.05.06.07.0
-4.0-3.0-2.0-1.00.01.02.03.04.05.06.07.0
Chart B Ratings upgrades minus downgrades for financial corporations in the euro area
(annual percentage changes or ratio)
Sources: ECB, Moody’s Credit Trends.
upgrades minus downgrades (four-quarter moving average; left-hand scale)floating-rate long-term debt securities issued by MFIs (right-hand scale)
-10
-5
0
5
10
15
0
5
10
15
20
25
June1995
June1996
June1997
June1999
June2000
June2001
June1998
June2002
June2004
June2005
June2006
June2003
2 Bondt, G. de and Lichtenberger, J. (2004), “Empirical estimates of the impact of the euro on the corporate bond market in the euro area”, Applied Economics Letters, 11, 675-678.
1 OUTSTANDING AMOUNTS OF DEBT
INSTRUMENTS

18ECBThe euro bonds and derivatives marketsJune 2007
domestic markets to a euro area perspective – which has been financed in part by debt securities.
Fourth, Chart D illustrates that the growth in long-term debt securities issued by MFIs appears to be positively related to the differential between growth in loans and the growth in the sum of deposits and short-term debt securities issued by MFIs. This provides some indication that MFIs issue long-term debt securities in order to finance the lending business that can not be financed out of retail deposits and short-term debt securities.
An expanding role for floating-rate long-term debt securities issued by MFIs
A notable trend in the issuance of long-term debt securities by MFIs in recent years has been the progressive increase in the importance of floating-rate notes and bonds (see Chart 8 in the main text). This section looks first at the bank’s choice of issuing long-term debt securities at floating-rate or at fixed-rate; and then it focuses on the decision to issue fixed-rate long-term debt securities rather than both floating-rate long-term debt securities and short-term debt securities.
A main motivation for banks to raise funds through the issuance of long-term debt securities at floating-rate (rather than at a fixed-rate) is to match the characteristics of the assets. While loans are typically granted with a long-term original maturity (more than 80% of total outstanding loans in the euro area), a key aspect of the loan characteristics is the duration of the lending rate, i.e. how often the interest rate changes during the life of the loan. By aligning the fixing of the interest rate on the liability side with the fixing of the interest rate on the asset side, banks can reduce their exposure to interest rate risk, i.e. the risk that an increase in money market interest rates will increases their short-term funding costs, and keep their fixed-rate loan receipts unchanged.
Data on the proportion of outstanding loans at fixed-rate and at variable-rate are currently not available but a rough approximation can be made using the MFI interest rates dataset, which
Chart D Growth in long-term debt securities issued by MFIs and funding requirements
Source: ECB.Note: The growth differential – as a measure of funding requirements – refers to the difference between the growth in loans and the growth in the sum of deposits and outstanding amounts of short-term debt securities issued by MFIs.
outstanding long-term debt securities issued by MFIs (annual growth rate)growth differential (percentage points)
1990 19941992 1996 1998 2000 200620042002-5.0
0.0
5.0
10.0
15.0
20.0
-5.0
0.0
5.0
10.0
15.0
20.0
Chart C Mergers and acquisitions in the banking sector
(annual percentage changes and EUR billions)
Sources: ECB, Thomson/Zehyr.
outstanding long-term debt securities issued by MFIs (annual growth rate; left-hand scale)mergers & acquisitions among financial institutions; non-equity financing (EUR billions, 12-month moving sum; right-hand scale)
1991 1993 1995 1997 1999 2001 200520030
5
10
15
20
25
30
050100150200250300350400

19ECB
The euro bonds and derivatives marketsJune 2007
reports the volume of new loans with different periods of initial rate fixation. Chart E provides an indication of whether floating rate loans are positively related to floating rate long-term debt securities. The chart exploits the cross-sectional dimension rather than the time dimension given that the data on new loans by initial period of fixation start only in 2003. If banks are issuing debt securities to match the characteristics of the assets, then countries would be expected to be located either in the top right cell or in the bottom left cell of the chart. There is some indication that this is the case looking at the location of the various countries. In other words, when bank issue a relatively high proportion of long-term debt securities at floating-rate, they tend to grant a relatively higher proportion of new loans at short-term fixation (IT, FI, ES, PT, AT and LU). Conversely, when bank issue a relatively high proportion of long-term debt securities at fixed-rate, they tend to grant a relatively higher proportion of new loans at initial fixation periods longer than one year (DE and NL).3 Furthermore, there is some indication that the increasing importance of floating-rate long-term debt securities may to some extent reflect an increase in the importance of floating-rate loans. More generally, banks may also have increased the matching of assets and liabilities on their balance sheets over the past few years, possibly in relation to Basel II.
As regards the choice of issuance at long-term fixed-rates rather than at short-term rates, the decision of the bank may partly be driven by changes in the yield curve. In particular, the growth of long-term issuance at fixed-rate compared to the issuance at short-term rates - both short-term debt securities and long-term debt securities at floating-rate – appears to be positively related to the term spread (see Chart F). When the term spread (e.g. the five-year government
Chart E The importance of floating-rate loans and floating-rate long-term debt securities(average between January 2003 and August 2006)
Sources: ECB, author’s calculation.Note: GR and IE are excluded because data on long-term debt securities issued by MFIs broken down by coupon type are not available.
y-axis: floating-rate long-term debt securities (% of outstanding long-term debt securities)x-axis: loans at floating rate and up to 1 year initial period of rate fixation (% of total new business)
BE
DE ES
FR
IT
LU
NL
AT
PTFI
euro area
0
10
20
30
40
50
60
70
80
0
10
20
30
40
50
60
70
80
50 60 70 80 90 100
Chart F The term spread and the importance of fixed-rate long-term issues
(in percentage points)
Source: ECB.Note: The growth differential refers to the differences between the growth in outstanding amounts of fixed-rate long-term debt securities and the combined growth in outstanding amounts of short-term debt securities and floating-rate long-term debt securities.
slope of yield curve (5-year minus 3-month),left-hand scalegrowth differential (fixed-rate minus sum of short-term and floating-rate), right-hand scale
Jan.1999
Jan.2000
Jan.2001
Jan.2002
Jan.2003
Jan.2004
Jan.2005
Jan.2006
-0.5
0.0
0.5
1.0
1.5
2.0
-25
-20
-15
-10
-5
0
3 Two exceptions can be noted. First, in France, new loans are predominantly granted at fixed-rate, but banks issue a relatively high proportion of long debt securities at floating-rate. This may suggest that banks issue long-term floating-rate liabilities but simultaneously enter into an interest rate swap to convert this obligation into a fixed-rate obligation and keep funding costs stable should they expect interest rates to increase. Second, in Belgium, the high proportion of floating-rate loans is due to new loans over €1 million to non-financial corporations; otherwise BE would be in same group as DE and NL.
1 OUTSTANDING AMOUNTS OF DEBT
INSTRUMENTS

20ECBThe euro bonds and derivatives marketsJune 2007
bond yield minus the 3-month Euribor) increases, the relative return advantage shifts towards long-term investments. Demand for deposits (with short-term return) falls and investors look for higher returns on fixed-rate (long-term). Despite the higher relative cost of issuing at long-term fixed rates for issuers, banks may nevertheless be willing to meet this demand and supply more long-term debt securities at fixed-rate to reduce asset-liability mismatches on their balance sheet. Moreover, some of the banks’ higher funding cost may be compensated by higher bank interest margins when the yield curve gets steeper (since banks predominantly borrow short and lend long).
Some of the recently observed faster relative growth in long-term debt securities at fixed-rate despite a flattening of the yield curve suggests that banks were able to benefit from the relative cost advantage of issuing at long-term rates. This may to some extent reflect the fact that the very low term spread currently prevailing in the euro area is partly driven by a gradual compression of the risk premia, without significantly affecting investor demand.4
4 See Box 3 entitled “The recent flattening of the euro area yield curve: what role was played by risk premia?” in the December 2006 issue of the ECB Monthly Bulletin.
An important type of MFI debt securities are covered bonds. Covered bonds are (in contrast to asset-backed securities as discussed below) first and foremost claims of the bond holders against the issuing MFI. However, covered bonds are secured by a pool of cover assets on the MFI’s balance sheet. The cover assets are typically mortgage loans or loans to the public sector, i.e. assets with a very low credit risk. As long as the issuing MFI is solvent, the covered bond generates cash flows to the bond holders that are independent of the performance of the assets. If, however, the issuing MFI becomes insolvent, then the covered bond holders can claim the cover assets.
Covered bonds are as such low risk investment opportunities for investors. The bonds are backed by the issuer’s own funds as well as the cover assets. They have been especially important in Europe. First, European securitisation markets were underdeveloped until some years ago, so mortgage loans could hardly be used in securitisation processes. Furthermore, investments in covered bonds require European banks to hold relatively low regulatory capital. Finally, in many European countries, covered bonds are protected by specific legislation. As a consequence, they
represent cheap refinancing instruments for issuing MFIs.
Table 6 shows outstanding amounts of covered bonds. In 2005 covered bonds issued by euro area issuers, mostly denominated in euro, amounted to €1,358 billion, about 33% of all debt securities issued by euro area MFIs. However, while the outstanding amount of all debt securities issued by euro area MFIs increased by 37% between 2001 and 2005, the outstanding amount of covered bonds issued by the same entities increased only by 13%.10 The potential for growth in this market segment is limited as MFIs can issue covered bonds only to the extent to which they have granted loans that can be used as cover assets (mortgage loans, public sector loans, ship loans and similar secure loans).
Still by far the most important country for covered bonds in the euro area is Germany, although the outstanding amounts of German covered bonds have declined in the past six
10 According to ECB data, the outstanding amount of all euro area MFI debt securities was €4,109 billion in December 2005, of which €3,346 billion was denominated in euro. In December 2001, €3,346 billion was the amount for all currencies and €2,991 billion for the euro.

21ECB
The euro bonds and derivatives marketsJune 2007
Table 6 Outstanding nominal amounts of covered bonds
(by country of issuer; in EUR billions; end of period data; all currencies)
2001 2002 2003 2004 2005
Austria 10.57 9.38 8.50 3.00 16.28Belgium 0.00 0.00 0.00 0.00 0.00Germany 1,104.83 1,088.00 1,056.69 1,010.11 975.93Spain 13.51 25.27 82.50 100.51 163.23Finland 0.05 0.05 0.07 0.07 1.50France 64.01 70.91 87.20 100.67 124.77Greece 0.00 0.00 0.00 0.00 0.00Ireland 0.00 0.00 13.50 30.95 45.11Italy 0.00 0.00 0.00 0.00 4.00Luxembourg 11.01 13.10 16.67 19.48 24.97Netherlands 0.99 0.88 0.69 12.75 2.00Portugal 0.00 0.00 0.00 0.00 0.00Euro area 1,204.97 1,207.58 1,265.82 1,277.53 1,357.79Denmark 199.85 191.37 231.57 232.80 293.15Sweden 65.45 70.91 60.51 82.49 92.81United Kingdom 0.00 0.00 7.00 14.96 25.44
Source: European Mortgage Federation/European Covered Bond Council.
Chart 9 Outstanding nominal amounts of covered bonds, by type of cover assets
(in %, end of period data, all currencies)
Source: European Mortgage Federation/European Covered Bond Council.
public sectormortgage
2001 2002 2003 2004 20050
102030405060708090
100
0102030405060708090100
years. Particularly strong growth rates were witnessed in Spain, which now comes second in the euro area after Germany. In recent years, several European countries have adopted or modernised covered bond legislation, leading to significant national covered bond market growth. An important reason might be the 1988 Directive on Undertakings for Collective Investments in Transferable Securities (UCITS). The UCITS Directive stipulates that covered
bonds need to be governed by a special legal framework in order to gain privileges as safe investments. In the Netherlands and the UK, covered bonds are still issued without a legal framework on the basis of contractual arrangements. Both countries, however, indicate that a formal legal framework is on its way to ensure UCITS compliance. Portugal is in the process of finalising a legal framework.
A high proportion of covered bonds are issued in the currency of the issuer’s home country. There are, however, two exceptions to this rule. In 2005 56% of all outstanding covered bonds issued by Luxembourg MFIs were not denominated in euro. In the same year, more than 90% of all covered bonds issued by UK MFIs were denominated in euro.11 This very much reflects the status of Luxembourg and London as financial centres for international bond markets.
The main types of asset used to secure covered bonds in Europe are mortgage loans and public sector loans. Mortgage loans have been becoming relatively more important since 2002
11 See European Covered Bond Council, European Covered Bond Fact Book, August 2006.
1 OUTSTANDING AMOUNTS OF DEBT
INSTRUMENTS

22ECBThe euro bonds and derivatives marketsJune 2007
and accounted for about 50% of cover assets in 2005, up from about 40% in 2002 (see Chart 9). Maturities of covered bonds typically range from two to ten years. The majority of covered bonds are rated AAA.
THE TREND TOWARDS SECURITISATIONGross issuance of asset-backed securities backed by European collateral grew by 309% between 2000 and 2005, about twice as fast as euro area MFI gross issuance and six times faster than gross issuance from euro area non-financial corporations. Growth, however, weakened somewhat after 2001 as securitisation markets reached higher levels of maturity. Around one half of asset-backed securities are backed by mortgages loans.
Spain, Italy and the Netherlands are the most important countries for the issuance of euro-denominated asset-backed securities and the most important euro area countries of collateral for European securitisation. Although a significant amount of securitisation collateral is located in Germany, issuance of asset-backed securities through special purpose vehicles (SPVs) located in Germany remains low.
Probably the most rapidly growing segment of debt securities in the past years has been created through a process known as securitisation. Such securities are often called asset-backed securities. However, the term asset-backed securities must be used carefully because it is also used in a narrow sense to denote a specific subset of securities created through securitisation, as explained below.
There are two typical motivations for the issuance of asset-backed securities – fund raising and credit risk transfer. Both can be achieved either through a “true sale” securitisation or through a funded synthetic securitisation. In a traditional “true sale” securitisation an entity called the originator (typically a bank) transfers the ownership of a pool of assets to another entity, the “special purpose vehicle” (SPV). The SPV is set up for the purpose of securitisation, typically by the
originator. It issues securities backed by the pool of assets (i.e. asset-backed securities) and transfers the funds raised through selling the securities to the originator as a payment for the asset pool. The securities are backed by the asset pool in the sense that their interest and principal payments are closely linked to the interest and principal received on the pool of assets.
In a funded synthetic securitisation process, the ownership of the asset pool is not transferred to the SPV, but remains on the balance sheet of the originator. The risks associated with the asset pool are nevertheless transferred to the SPV by means of a credit derivative.12 The SPV issues an asset-backed security to raise funds from investors at the start of the transaction and usually provides these funds or collateral bought using them to the originator. For example, the originator could issue a credit linked note (CLN) on the asset pool13 and sell it to the SPV. The SPV pays for the CLN with the proceeds from issuing asset-backed securities and makes payments on the asset-backed securities dependent on payments received on the CLN. Alternatively, the originator buys protection from the SPV through a credit default swap (CDS), while the SPV buys, for example, government bonds using the proceeds from issuing asset-backed securities and provides these government bonds as collateral to the originator.14
Anecdotal evidence suggests that synthetic securitisation in particular is growing fast, not least as a consequence of the now very liquid credit derivatives markets. Synthetic securitisation appears to be relatively efficient as it does not involve the transfer of assets to the SPV. It has also been the main field of innovations in securitisation markets. A recent innovation to be mentioned in this context is
12 See Section 1.2. 13 Thus the principal on the CLN to be paid by the originator to
the SPV depends on the performance of the asset pool.14 For information on unfunded synthetic securitisation, see
Section 1.2. As no asset-backed securities are issued in an unfunded synthetic securitisation process, these structures are not discussed here but in the section on credit derivatives.

23ECB
The euro bonds and derivatives marketsJune 2007
Constant Proportion Debt Obligations (CPDOs). CPDOs are similar to standard funded synthetic securitisation products. The SPV issues CPDO notes and invests the issuance proceeds in a deposit account that earns interest at a risk-free rate. The arranging bank sells protection through a CDS on a risky reference portfolio. The notional amount of the CDS is up to 15 times higher than the nominal amount of the CPDO notes, i.e. the structure is highly leveraged. The SPV sells protection to the arranger through a total return swap. Premium payments to the arranger are paid into the deposit account and default payments to be made by the arranger are paid out of the deposit account. During the life of the structure the leverage factor is rebalanced to ensure that the SPV’s payment obligations can be met out of the deposit account. The structure has aroused particular interest because CPDO notes are highly rated and at the same time promise high interest.
The credit quality of an asset-backed security is solely based on the characteristics of the asset pool and not related to the creditworthiness of the originator. It is interesting to note a major difference between asset-backed securities and covered bonds at this point. Covered bonds are primarily claims against the bond issuer. If the cover assets perform badly, then the bond holders do not suffer as long as the issuer remains solvent. Only if the issuer becomes insolvent are the cover assets used to satisfy the bond holders. However, cash flows from asset-backed securities to investors are independent of whether the originator is solvent or not and depend only on the performance of the asset pool.
Table 7 Gross issuance of asset-backed securities1) backed by European assets
(all currencies combined)
Source: European Securitisation Forum.1) “Asset-backed securities” in the broader sense, i.e. all securities created through securitisation.
2000 2001 2002 2003 2004 2005 2006
Total (EUR billions) 78.2 152.6 157.7 217.3 243.5 327 458.9Annual change (%) 95.1 3.3 37.8 12.1 34.3 40.3
The SPV usually issues a number of different types of security, called “tranches”, which are all backed by the same pool of assets. An equity tranche promises on average the highest return, but also suffers first if the asset pool incurs losses. One or more mezzanine tranches suffer next, while the senior tranche is the safest tranche, but also has the lowest average returns.
According to data from the European Securitisation Forum (Table 7), gross issuance of asset-backed securities backed by collateral located in Europe (including non-EU countries) stood at €458.9 billion in 2006, up by 487% compared with 2000. By comparison, gross issuance of debt securities by euro area MFIs (including Greece) increased at the same time by 202% (from €2,597 billion to €7,842 billion) and gross issuance of debt securities issued by euro area non-financial corporations increased by only 60% (from €674 billion to €1,077 billion).15 Thus the market segment of asset-backed securities seems to be growing relatively strongly still, although growth rates have been volatile and they were stronger about five years ago.16
Several reasons for the growth of securitisation markets have been put forward, including strong growth in assets that can be securitised and regulatory requirements to limit credit risks (especially in connection with the implementation of the Basel II regulations). In addition, the fact that asset-backed securities are issued in tranches might be an important
15 According to ECB data.16 This is also indicated by the series of data on securities issued
by non-MFI financial institutions (to which SPVs belong) shown in Tables 2 and 3.
1 OUTSTANDING AMOUNTS OF DEBT
INSTRUMENTS

24ECBThe euro bonds and derivatives marketsJune 2007
reason for strong demand from investors for securitisation products as they, for example, allow for additional yield in the current low yield environment.
In November 2006 the amount of euro-denominated asset-backed securities outstanding stood at €832 billion, according to ECB data (see Table 8). Of this total, €712 billion was issued by SPVs located in the euro area, accounting for about 76% of all debt securities issued by euro area non-MFI financial institutions.17, 18 Around 47% of all euro-denominated asset-backed securities issued in the euro area have been issued in Spain. This high market share results from relatively favourable legal conditions and government initiatives promoting securitisation in Spain.
Euro asset-backed securities issued by SPVs located outside of the euro area represented an outstanding amount of €120 billion in November 2006. This equals only 18% of all debt securities from non-euro area issuers classified as non-MFI financial institutions (€685 billion in Q4 2006, according to Table 3). However, this relatively low share of asset-backed securities should not be over-interpreted as it may well be due to measurement errors resulting from the collection of data from a large number of very different jurisdictions. Many SPVs seem to be located for tax and other
Table 8 Outstanding nominal amounts of euro denominated asset-backed securities1)
(by country of issuer/SPV; in EUR billion; as of November 2006)
Source: ECB data.1) “Asset-backed securities” in the broader sense, i.e. all securities created through securitisation.
Spain 336.00Italy 148.59Netherlands 113.23Ireland 57.82Luxembourg 24.95France 19.40Belgium 5.47Portugal 2.43Austria 2.37Germany 1.55Greece 0.11Finland 0.01
Euro area 711.91
United Kingdom 58.38United States 20.35Jersey 19.51Cayman Islands 9.49Australia 6.58Netherlands Antilles 2.56Virgin Islands, British 0.65Sweden 0.56Guernsey C.I. 0.44Czech Republic 0.42Iceland 0.37Denmark 0.36Others 0.73
Non-euro area 120.40
legal reasons in small financial centres like Jersey and Cayman Islands.
Table 8 displays outstanding amounts of asset-backed securities by country of issuer/SPV. Chart 10 describes gross issuance of asset-backed securities by country of collateral, which is in most cases also the country of the originator. The chart refers to asset-backed securities denominated in any currency, but backed by euro area collateral. In most cases these securities are denominated in euro. Spain, Italy and the Netherlands are the most important euro area countries not only in terms of location of SPVs, but also with respect to the country of collateral. Interesting, however, are the market shares of Germany and Luxembourg. Germany is relatively important as a country of collateral, but not as country of location of the SPV. For Luxembourg, it is the other way round. Germany does not seem to be a favourable location to set up an SPV, but has, as a major economy, significant amounts of collateral to back securities. However, relative to the size of its economy, German collateral still plays a small role in securitisation (in particular compared to Spain, the Netherlands and Italy). This may be due to the very large market for covered bonds
17 €1,035 billion in Q4 2006, according to Table 2.18 As mentioned before, SPVs are classified as non-MFI financial
institutions.

25ECB
The euro bonds and derivatives marketsJune 2007
Chart 10 Gross issuance of asset-backed securities1) by country of collateral
(in EUR billions, issuance between Q4 2005 and Q3 2006, all currencies combined)
Source: European Securitisation Forum.1) “Asset-backed securities” in the broader sense, i.e. all securities created through securitisation.
0
10
20
30
40
50
60
0
10
20
30
40
50
60
1 Spain 2 Netherlands 3 Italy 4 Germany
9 Belgium10 Austria11 Luxembourg
5 Ireland 6 France 7 Portugal 8 Greece
1 2 3 4 5 6 7 8 9 10 11
in Germany that may absorb major parts of German mortgage loans. Similarly, the relatively small covered bond markets in Italy and the Netherlands may explain why Italian
and Dutch collateral plays an important role in securitisation.
A common way to classify asset-backed securities refers to the type of underlying collateral. Mortgage backed securities (MBS) are backed by mortgages loans. A distinction is made between residential mortgage backed securities (RMBS) and commercial mortgages backed securities. Collateralised debt obligations (CDO) are backed by bonds (collateralised bond obligations, CBO) or loans (collateralised loan obligations, CLO). All other securitisation products are called asset-backed securities in a narrow sense. These are typically backed by credit card receivables, leasing receivables, trade receivables and others. According to data from the European Securitisation Forum, MBSs accounted for 66.4% and CDOs for 19.2% of gross issuances of asset-backed securities backed by European assets in 2006. In 2001 these shares stood at 42.2% for MBSs and 12.7% for CDOs, so the relative importance of the two types of asset-backed security appears to be increasing.
Box 2
SECURITISATION – COMPARISON BETWEEN THE EUROPEAN UNION AND THE US
The overall US securitisation market (defined as the securitisation market with an originator located in the US) stands roughly at USD 8.6 trillion (€6.5 trillion equivalent), most of which is USD denominated. The EUR denominated securitisation market is much smaller with a global outstanding volume of €0.8 trillion. The securitisation market is referred to here in the broad sense, i.e. encompassing ABSs (asset backed securities), CDOs (collateralised debt obligations) and MBSs (mortgage backed securities).
RMBSs (residential MBSs) account for the largest share of the US securitisation market. Most of these are issued by agencies such as Freddie Mac or Fannie Mae. Outstanding volumes of MBSs issued by the three main agencies can be evaluated at USD 5.1 trillion as at end September 2006. The European MBS issuance volume amounted to €300 million in 2006. Only 43% was EUR denominated while MBSs backed by UK collateral (hence GBP denominated) accounted for 57% of issuances. The difference lies in the traditional tendency of European credit institutions to fund their lending via deposits or to use covered bonds. The euro area covered bonds market is estimated at €1,357 billion1 as at end 2006. The first euro-denominated covered bond program of a US issuer was launched in September 2006 thanks to recent legal
1 Outstanding volumes. Source: ECB statistics.
1 OUTSTANDING AMOUNTS OF DEBT
INSTRUMENTS

26ECBThe euro bonds and derivatives marketsJune 2007
innovations. Some more issuances are expected in 2007. However, some European covered bonds are already issued in USD.
European securitisation has steadily increased since 2001. In 2006 issuances were 3 times larger than in 2001 (€450 billion versus €150 billion). The European dynamism is largely due to the credit expansion. Apart from MBSs, CDOs consisting of leveraged loans have expanded sharply in recent times to reach an issuance volume of €88 billion (versus €18 billion in 2001), staying however far behind the US market (USD 386 billion).
As it is much smaller than its US counterpart, the European securitisation market may have the potential to further grow substantially. However, several elements may temper this judgement. First, the European securitisation market (multi-currency issuances and location of SPV) has already expanded at a fast pace for the last five years. Second, a US-style agency system (whose activity leads the global market) does not exist in Europe. Last, the covered bond market remains the predominant European funding tool, and the activity of both commercial and residential MBSs/home ABSs relies on growth in the housing sector, where current conditions raise issues in both economic areas.
Chart A Comparison – US and European securitization market
(outstanding amounts in EUR billions)
Sources: ECB Statistics, Bloomberg, Federal Reserve Board of Governors, Bond Market Association.Note: All figures must be taken with caution as the methodology differs from one country to another. The US market refers to the US as the country of the originator whereas the European market refers to EUR denominated securitized instruments. Conversion rate applied: EUR 1 = USD 1.05 (end 2002).
Chart B US securitization market
(outstanding amounts in USD billions)
Sources: Federal Reserve Board of Governors, Bloomberg, Bond Market Association.
01,0002,0003,0004,0005,0006,0007,0008,0009,000
01,0002,0003,0004,0005,0006,0007,0008,0009,000
2002 2003 2004 2005 2006
US securitization market (in EUR billions equivalent)EUR securitization market
2,000
3,000
4,000
5,000
6,000
7,000
8,000
9,000
2,000
3,000
4,000
5,000
6,000
7,000
8,000
9,000
2001 2002 2003 2004 2005 Q32006
Agency MBSother MBSCDOsABS
Chart C European ABS/MBS
(issuance amounts; all currencies; in EUR billions)
Source: European Securitisation Forum.
20022001 2003 2004 2005 2006050100150200250300350400450500
050
100150200250300350400450500
MBSCDOsABS

27ECB
The euro bonds and derivatives marketsJune 2007
DEBT SECURITIES ISSUED BY NON FINANCIAL CORPORATIONSOutstanding amounts of euro-denominated corporate debt securities almost doubled between 1999 and 2003, but remained relatively stable thereafter. Debt securities accounted for about 15% of debt of non-financial corporations in the euro area in all years between 2002 and 2006.
As described in Tables 2 and 3, the outstanding amount of euro-denominated debt securities issued by euro area non financial corporations increased by 96% between 1999 and 2006 to €561 billion. Chart 11 shows that the increase was strong between Q1 1999 and Q3 2003 (from €271 billion to €516 billion) and lost its momentum afterwards.
In addition, between 1999 and 2006 the outstanding amount of securities issued by non-euro area non financial corporations increased by 417% to €155 billion. This strong trend is similar to what has been observed in the MFI sector (see above). The underlying reasons may also be similar. First, the demand for foreign currencies may have risen generally due to continuing globalisation. Second, raising funds through the issuance of debt securities may have become more attractive compared to borrowing through bank loans for non-euro area corporations.
Chart 11 Outstanding nominal amounts of euro-denominated debt securities issued by euro area1) non-financial corporations(in EUR billions)
Source: ECB data.1) Including Greece since 2001.
Dec.1999
Dec.2000
Dec.2001
Dec.2002
Dec.2003
Dec.2004
Dec.2005
Dec.2006
0
100
200
300
400
500
600
0
100
200
300
400
500
600
Table 9 Outstanding nominal amounts of euro-denominated debt securities issued by euro area non-financial corporations(in % of all euro-denominated debt of euro area non-financial corporations1); end of period data)
Source: ECB data. 1) Debt securities denominated in euro plus loans granted by euro area MFIs (excluding the Eurosystem).
2002 2003 2004 2005 2006
14.5 15.3 14.6 14.1 13.5
Table 9 provides indications of the importance of debt securities to euro area non financial corporations for raising funds. Debt securities issued by such corporations accounted for 14.5% of all their debt in 2002 and for 15.3% in 2003. This share has declined slightly since then, so there does not seem to be a move by non financial corporations in the euro area towards borrowing at arm’s length.
However, many non-financial corporations issue debt securities through a financial ancillary (typically a 100%-owned subsidiary of the corporation) that itself is a non-MFI financial institution. Such issues are accordingly not reflected in the data on debt securities issued by non-financial corporations. The data in Table 9 may therefore not provide the full picture and must be interpreted with some caution.
Outstanding amounts of short-term debt securities issued by non-financial corporations rose by 80% between 1999 and 2006 to €94 billion, now accounting for 17% of all debt securities issued by non-financial corporations. At the same time, outstanding amounts of long-term debt securities increased by 109% to €457 billion. Thus, the share of short-term securities has decreased slightly, especially after 2001. However, short-term securities remain more important for non-financial corporations than for public sector issuers and MFIs (see Chart 7).
There has been no clear trend towards fixed rate or floating rate issues since 1999 (see Chart 12). Slightly less than 20% of long-term debt securities issued by euro area non-financial
1 OUTSTANDING AMOUNTS OF DEBT
INSTRUMENTS

28ECBThe euro bonds and derivatives marketsJune 2007
corporations have been floating rate issues, with a somewhat lower share between 2002 and 2004.
1.2 CREDIT DERIVATIVES
Despite a lack of high quality data, different data sources consistently indicate that markets for credit derivatives, and in particular credit default swaps (CDSs), have been growing at a very high pace over recent years. In CDS markets, various innovations, such as, for example, the introduction of CDS indices, in particular the iTraxx index family in Europe, have fostered standardisation of instruments and have given a further boost to market activities since 2004.
Credit derivatives are financial products that can be used to transfer the credit risk associated with a specific asset or pool of assets (the reference assets or reference obligations) from one party (the protection buyer) to another (the protection seller) without transferring the assets. The cash flows from a credit derivative are often contractually linked to so-called credit events. Typical credit events are bankruptcy, failure to pay or restructuring (of payment obligations) of a reference entity.19
Chart 12 Outstanding nominal amounts of euro-denominated long-term debt securities issued by euro area non-financial corporations1)
(fixed versus floating rate issues, shares, August data; percentages)
Source: ECB data.1) Including Greece for all years.
1999 2000 2001 2002 2003 2004 2005 20060
102030405060708090
100
0102030405060708090100
othersfloating ratefixed rate
Typical reference entities are corporations and (emerging market) governments.
CREDIT DEFAULT SWAPSThe most common type of credit derivatives are credit default swaps (CDSs). A CDS requires fixed and regular premium payments from the protection buyer to the protection seller until a credit event occurs or the CDS matures. The premium is calculated as a percentage (called credit spread) of the nominal value of the reference obligation (the “notional amount”).
If a credit event occurs, the protection seller makes payments to the protection buyer. These payments can be settled physically or in cash. In the case of physical settlement, the protection seller transfers the nominal amounts of the reference obligation to the protection buyer and the protection buyer transfers the reference obligation to the protection seller. The protection buyer may have a choice of different equivalent obligations to deliver in this case (cheapest-to-deliver option) to mitigate the risk of being squeezed. If the CDS is settled in cash, then the reference obligation is valued and the protection seller simply pays the difference between the nominal and the calculated value of the reference obligation to the protection buyer. Cash settlement requires the valuation of the reference obligation, which may be a challenging exercise in the case of a credit event. In March 2005 Tradable Credit Fixings was launched, a market initiative20 that allows for a reliable pricing of CDS obligations, in particular in the case of a credit event, through the Credit Event Fixing algorithm. A new protocol of the International Swaps and Derivatives Association (ISDA) to facilitate cash settlement of credit derivatives makes direct use of Credit Event Fixing. As a result, cash settlement is becoming increasingly common in credit derivatives markets.
19 Standard documents for credit derivatives, in particular standard definitions of credit events, were developed by the International Swaps and Derivatives Association (ISDA) in 1999, with the latest update from 2003.
20 Tradable Credit Fixings was developed jointly by Markit Group Limited and Creditex.
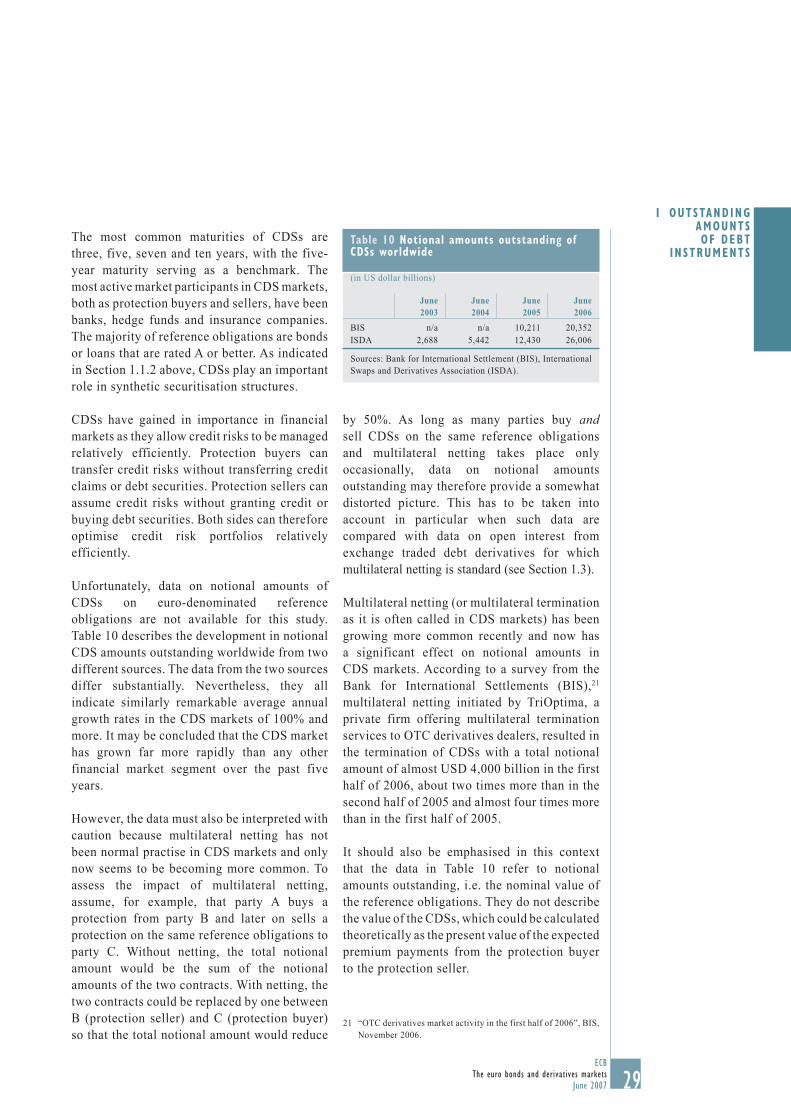
29ECB
The euro bonds and derivatives marketsJune 2007
The most common maturities of CDSs are three, five, seven and ten years, with the five-year maturity serving as a benchmark. The most active market participants in CDS markets, both as protection buyers and sellers, have been banks, hedge funds and insurance companies. The majority of reference obligations are bonds or loans that are rated A or better. As indicated in Section 1.1.2 above, CDSs play an important role in synthetic securitisation structures.
CDSs have gained in importance in financial markets as they allow credit risks to be managed relatively efficiently. Protection buyers can transfer credit risks without transferring credit claims or debt securities. Protection sellers can assume credit risks without granting credit or buying debt securities. Both sides can therefore optimise credit risk portfolios relatively efficiently.
Unfortunately, data on notional amounts of CDSs on euro-denominated reference obligations are not available for this study. Table 10 describes the development in notional CDS amounts outstanding worldwide from two different sources. The data from the two sources differ substantially. Nevertheless, they all indicate similarly remarkable average annual growth rates in the CDS markets of 100% and more. It may be concluded that the CDS market has grown far more rapidly than any other financial market segment over the past five years.
However, the data must also be interpreted with caution because multilateral netting has not been normal practise in CDS markets and only now seems to be becoming more common. To assess the impact of multilateral netting, assume, for example, that party A buys a protection from party B and later on sells a protection on the same reference obligations to party C. Without netting, the total notional amount would be the sum of the notional amounts of the two contracts. With netting, the two contracts could be replaced by one between B (protection seller) and C (protection buyer) so that the total notional amount would reduce
by 50%. As long as many parties buy and sell CDSs on the same reference obligations and multilateral netting takes place only occasionally, data on notional amounts outstanding may therefore provide a somewhat distorted picture. This has to be taken into account in particular when such data are compared with data on open interest from exchange traded debt derivatives for which multilateral netting is standard (see Section 1.3).
Multilateral netting (or multilateral termination as it is often called in CDS markets) has been growing more common recently and now has a significant effect on notional amounts in CDS markets. According to a survey from the Bank for International Settlements (BIS),21 multilateral netting initiated by TriOptima, a private firm offering multilateral termination services to OTC derivatives dealers, resulted in the termination of CDSs with a total notional amount of almost USD 4,000 billion in the first half of 2006, about two times more than in the second half of 2005 and almost four times more than in the first half of 2005.
It should also be emphasised in this context that the data in Table 10 refer to notional amounts outstanding, i.e. the nominal value of the reference obligations. They do not describe the value of the CDSs, which could be calculated theoretically as the present value of the expected premium payments from the protection buyer to the protection seller.
Table 10 Notional amounts outstanding of CDSs worldwide
(in US dollar billions)
Sources: Bank for International Settlement (BIS), International Swaps and Derivatives Association (ISDA).
June 2003
June 2004
June 2005
June 2006
BIS n/a n/a 10,211 20,352ISDA 2,688 5,442 12,430 26,006
21 “OTC derivatives market activity in the first half of 2006”, BIS, November 2006.
1 OUTSTANDING AMOUNTS OF DEBT
INSTRUMENTS

30ECBThe euro bonds and derivatives marketsJune 2007
CDSs either refer to obligations of a single reference entity (single-name CDSs) or to an index of obligations of a variety of reference entities (multi-name or index CDSs). In the latter case, the notional amount of the CDS is the sum of the nominal amounts of all underlying reference obligations and the CDS specifies a credit event for each reference obligation individually. If a credit event on one reference obligation occurs, the protection seller pays the nominal value minus the calculated value of this reference obligation to the protection buyer (in the case of cash settlement). The notional amount of the CDS is then reduced by the nominal value of the reference obligation and the protection buyer continues to pay the credit spread, but now on the reduced notional amount.
Multi-name CDSs have been growing in importance since 2004 when the providers of the most frequently traded CDS index families, Dow Jones Trac-x and iBoxx, merged to form iTraxx (a family of indices with European and Asian reference entities, offered by the International Index Company) and Dow Jones CDX (for North America reference entities). According to the BIS, the share of multi-name CDSs worldwide increased from below 20% in December 2004 to 32% in June 2006.22 The introduction of CDS indices has greatly increased standardisation and thus liquidity in CDS markets. As some CDS indices are intensively traded by many market participants, it is relatively easy to buy and later sell a CDS on the same set of reference obligations. Combined with multilateral netting, this gives market participants the possibility of closing positions at any time.
A very recent development in the CDS markets is the emergence of CDS index tranches. According to the British Banker’s Association (BBA), notional amounts outstanding in CDS index tranches stood at USD 1,536 billion in 2006, up from USD 100 billion in 2004.23 A CDS index tranche is a protection against losses above a particular percentage a, called the attachment point, and below another percentage
d, called the detachment point. As with other CDSs, the protection buyer makes regular premium payments to the protection seller.24 The protection seller pays compensation to the protection buyer only if the losses on the index are between a and d. In Europe, the iTraxx Europe, the main European index in the iTraxx family, is the standard for CDS index tranches. CDS index tranches characterised by a=0% and d=3% are commonly referred to as equity tranches, contracts with a=3% and d=6% are called mezzanine tranches and those with attachment point above 6% are called senior tranches and super-senior tranches. CDS index tranches played a specific role in what has become known as the “correlation crisis” of May 2005 (see Chapter 3).25
Another important development that may have had an impact on the growth of the CDS market is the emergence of the Markit RED (Reference Entity Database) codes, maintained by Markit Group Limited. Markit RED is the industry standard for reference entity and reference obligation codes used in CDS markets worldwide. It is, of course, essential to correctly identify in a CDS contract the reference entity and the reference obligation. For example, the confusion of (a bond issued by) a corporation with (another bond issued by) the corporation’s financing subsidiary in a CDS contract could for example lead to an ineffective protection of the protection seller against an exposure to a credit event. The Markit RED codes help to avoid mistakes, reduce operational and legal risks and have improved efficiency in CDS markets.
22 “OTC derivatives market activity in the second half of 2004”, BIS, May 2004. “OTC derivatives market activity in the first half of 2006”, BIS, November 2004.
23 See BBA Credit Derivatives Report 2006.24 In case of equity tranches, the protection buyer also makes an
up-front payment to the protection seller in addition to the regular premium payments.
25 Other recent innovative credit default swap variants are LCDSs (Loan Credit Default Swaps) and PCDSs (Preferred Credit Default Swaps). The principal difference between a standard CDS and a LCDS is that the reference obligation in the case of a LCDS is a syndicated loan rather than a bond. The two major differences for a PCDS to the standard CDS are the addition of preferred stocks as a deliverable obligation and deferral of the payment of preferred stock dividends as another credit event.

31ECB
The euro bonds and derivatives marketsJune 2007
OTHER CREDIT DERIVATIVESAnother type of credit derivative is the credit linked note (CLN). As mentioned in sub-section 1.1.2, CLNs play an important role in synthetic securitisation. CLNs are debt securities, i.e. securitised derivatives. As such, outstanding amounts of CLNs are included in the data described in Section 1.1 above. A CLN promises interest and redemption payments from the issuer to the holder of the CLN as a normal bond, until a credit event occurs. If a credit event occurs, payments from the issuer to the investor are either delayed or interest payments are cancelled altogether. The British Bankers’ Association estimates that outstanding nominal amounts of CLNs worldwide increased by around 600% from USD 89.3 billion in 2000 to USD 626.4 billion in 2006.
In a total (rate of) return swap, the protection seller pays to the protection buyer (fixed or floating) interest periodically in return for payments equal to the total returns on the reference obligations. Credit spread options constitute an option for the protection buyer to demand compensation from the protection seller if the credit spread on the reference obligations exceeds a certain amount.
Finally, unfunded synthetic securitisations must also be classified as credit derivative structures as they are also used to transfer credit risk without transferring the underlying assets. In an unfunded synthetic structure, no asset-backed securities are issued, so funds are not raised from investors at the start of the transaction. The originator buys protection against the credit risk associated with the asset pool from the SPV by means of a CDS and receives funds from the SPV only in the event of losses on the pool assets due to a credit event.
Credit derivatives are traded over-the-counter (OTC) and therefore belong to the broad class of OTC derivatives. While credit derivatives are one of the fastest growing OTC derivatives, they are by no means the most important. For example, single-currency interest rate swaps,
the biggest segment of OTC derivatives, stood at a worldwide outstanding notional amount in June 2006 of USD 207,323 billion, according to the BIS. This is about ten times higher than the outstanding notional amount of CDSs reported by the BIS for June 2006 (see Table 10). While CDSs are growing at a higher rate, growth rates of interest rate swaps are still substantial. Between 2004 and 2006 their outstanding notional amounts increased by 63%. As a detailed analysis of interest rate swaps and other OTC derivatives is presented in the ECB’s Euro Money Market Study 2006, they are not discussed further in this report.
1.3 OPTIONS AND FUTURES ON DEBT SECURITIES
With the introduction of the euro in 1999, futures and options on eur- denominated debt securities other than German government bonds virtually disappeared. Basically all such derivatives are now traded on Eurex. The market still displayed strong annual growth rates of 23% for futures and 18% for options between 2002 and 2006 when open interest is used as measure.
Futures and options contracts are market instruments with a long history. In particular, futures on agricultural products and on metals have been traded for hundreds of years. However, financial futures and options are relatively new products which have been used more actively only since the 1970s. Their importance has increased continuously since then.
Futures and options are used for three reasons: hedging, speculation and arbitrage. Hedging refers to buying an instrument as insurance against adverse price movements. For example, a trader with a government bond portfolio could buy a put option on the bonds in his portfolio (or bonds with similar characteristics). He could then sell the portfolio at the exercise price if the value of the portfolio falls below the exercise price so that the option compensates for the losses. A trader who speculates, for
1 OUTSTANDING AMOUNTS OF DEBT
INSTRUMENTS
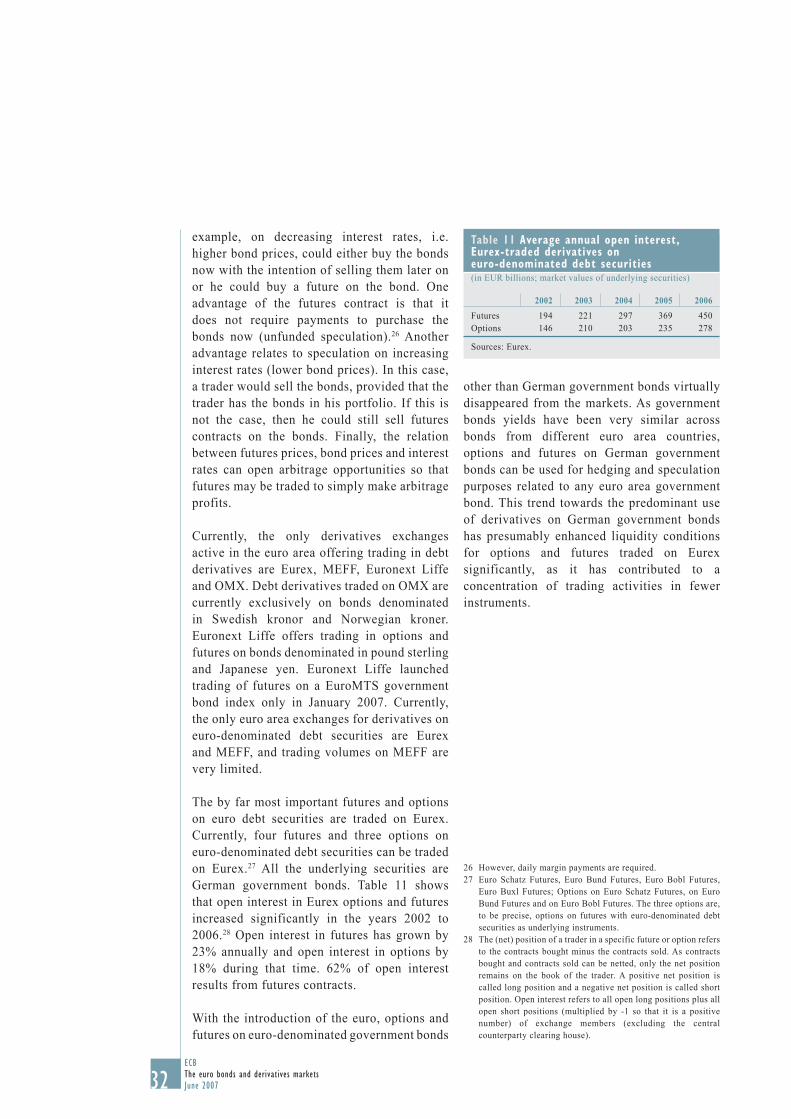
32ECBThe euro bonds and derivatives marketsJune 2007
example, on decreasing interest rates, i.e. higher bond prices, could either buy the bonds now with the intention of selling them later on or he could buy a future on the bond. One advantage of the futures contract is that it does not require payments to purchase the bonds now (unfunded speculation).26 Another advantage relates to speculation on increasing interest rates (lower bond prices). In this case, a trader would sell the bonds, provided that the trader has the bonds in his portfolio. If this is not the case, then he could still sell futures contracts on the bonds. Finally, the relation between futures prices, bond prices and interest rates can open arbitrage opportunities so that futures may be traded to simply make arbitrage profits.
Currently, the only derivatives exchanges active in the euro area offering trading in debt derivatives are Eurex, MEFF, Euronext Liffe and OMX. Debt derivatives traded on OMX are currently exclusively on bonds denominated in Swedish kronor and Norwegian kroner. Euronext Liffe offers trading in options and futures on bonds denominated in pound sterling and Japanese yen. Euronext Liffe launched trading of futures on a EuroMTS government bond index only in January 2007. Currently, the only euro area exchanges for derivatives on euro-denominated debt securities are Eurex and MEFF, and trading volumes on MEFF are very limited.
The by far most important futures and options on euro debt securities are traded on Eurex. Currently, four futures and three options on euro-denominated debt securities can be traded on Eurex.27 All the underlying securities are German government bonds. Table 11 shows that open interest in Eurex options and futures increased significantly in the years 2002 to 2006.28 Open interest in futures has grown by 23% annually and open interest in options by 18% during that time. 62% of open interest results from futures contracts.
With the introduction of the euro, options and futures on euro-denominated government bonds
Table 11 Average annual open interest, Eurex-traded derivatives on euro-denominated debt securities(in EUR billions; market values of underlying securities)
Sources: Eurex.
2002 2003 2004 2005 2006
Futures 194 221 297 369 450Options 146 210 203 235 278
other than German government bonds virtually disappeared from the markets. As government bonds yields have been very similar across bonds from different euro area countries, options and futures on German government bonds can be used for hedging and speculation purposes related to any euro area government bond. This trend towards the predominant use of derivatives on German government bonds has presumably enhanced liquidity conditions for options and futures traded on Eurex significantly, as it has contributed to a concentration of trading activities in fewer instruments.
26 However, daily margin payments are required.27 Euro Schatz Futures, Euro Bund Futures, Euro Bobl Futures,
Euro Buxl Futures; Options on Euro Schatz Futures, on Euro Bund Futures and on Euro Bobl Futures. The three options are, to be precise, options on futures with euro-denominated debt securities as underlying instruments.
28 The (net) position of a trader in a specific future or option refers to the contracts bought minus the contracts sold. As contracts bought and contracts sold can be netted, only the net position remains on the book of the trader. A positive net position is called long position and a negative net position is called short position. Open interest refers to all open long positions plus all open short positions (multiplied by -1 so that it is a positive number) of exchange members (excluding the central counterparty clearing house).
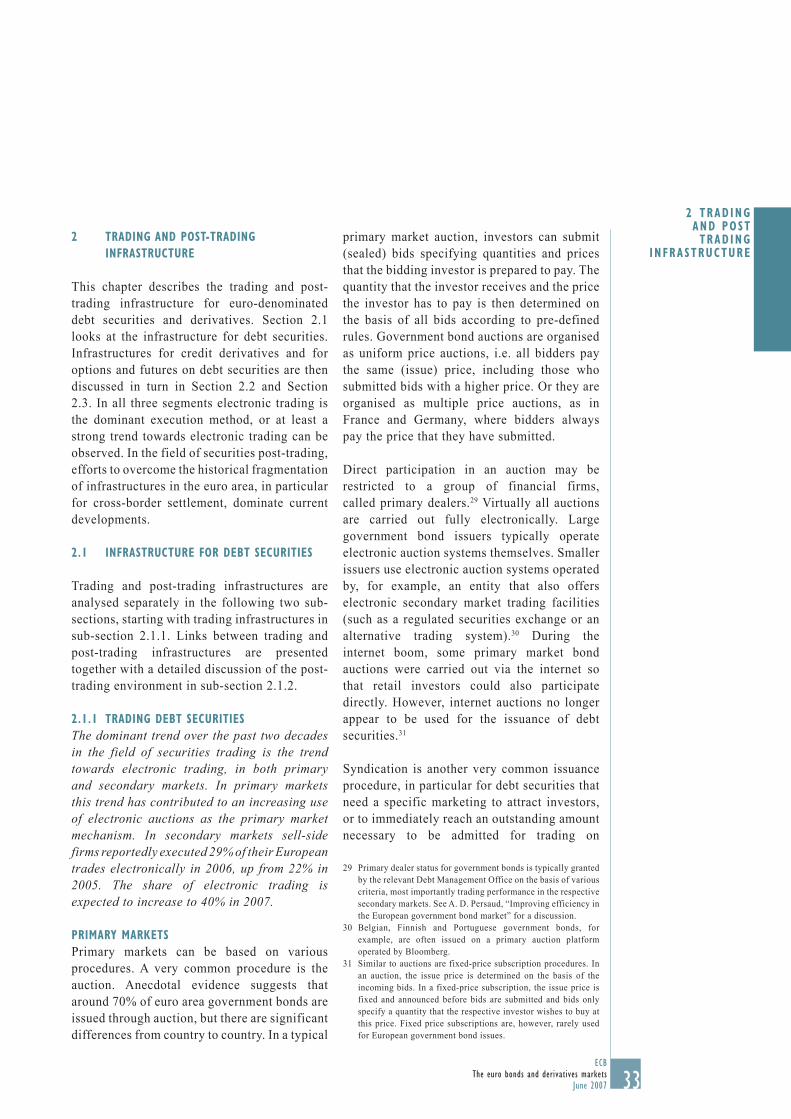
33ECB
The euro bonds and derivatives marketsJune 2007
2 TRADING AND POST-TRADING INFRASTRUCTURE
This chapter describes the trading and post-trading infrastructure for euro-denominated debt securities and derivatives. Section 2.1 looks at the infrastructure for debt securities. Infrastructures for credit derivatives and for options and futures on debt securities are then discussed in turn in Section 2.2 and Section 2.3. In all three segments electronic trading is the dominant execution method, or at least a strong trend towards electronic trading can be observed. In the field of securities post-trading, efforts to overcome the historical fragmentation of infrastructures in the euro area, in particular for cross-border settlement, dominate current developments.
2.1 INFRASTRUCTURE FOR DEBT SECURITIES
Trading and post-trading infrastructures are analysed separately in the following two sub-sections, starting with trading infrastructures in sub-section 2.1.1. Links between trading and post-trading infrastructures are presented together with a detailed discussion of the post-trading environment in sub-section 2.1.2.
2.1.1 TRADING DEBT SECURITIESThe dominant trend over the past two decades in the field of securities trading is the trend towards electronic trading, in both primary and secondary markets. In primary markets this trend has contributed to an increasing use of electronic auctions as the primary market mechanism. In secondary markets sell-side firms reportedly executed 29% of their European trades electronically in 2006, up from 22% in 2005. The share of electronic trading is expected to increase to 40% in 2007.
PRIMARY MARKETS Primary markets can be based on various procedures. A very common procedure is the auction. Anecdotal evidence suggests that around 70% of euro area government bonds are issued through auction, but there are significant differences from country to country. In a typical
primary market auction, investors can submit (sealed) bids specifying quantities and prices that the bidding investor is prepared to pay. The quantity that the investor receives and the price the investor has to pay is then determined on the basis of all bids according to pre-defined rules. Government bond auctions are organised as uniform price auctions, i.e. all bidders pay the same (issue) price, including those who submitted bids with a higher price. Or they are organised as multiple price auctions, as in France and Germany, where bidders always pay the price that they have submitted.
Direct participation in an auction may be restricted to a group of financial firms, called primary dealers.29 Virtually all auctions are carried out fully electronically. Large government bond issuers typically operate electronic auction systems themselves. Smaller issuers use electronic auction systems operated by, for example, an entity that also offers electronic secondary market trading facilities (such as a regulated securities exchange or an alternative trading system).30 During the internet boom, some primary market bond auctions were carried out via the internet so that retail investors could also participate directly. However, internet auctions no longer appear to be used for the issuance of debt securities.31
Syndication is another very common issuance procedure, in particular for debt securities that need a specific marketing to attract investors, or to immediately reach an outstanding amount necessary to be admitted for trading on
29 Primary dealer status for government bonds is typically granted by the relevant Debt Management Office on the basis of various criteria, most importantly trading performance in the respective secondary markets. See A. D. Persaud, “Improving efficiency in the European government bond market” for a discussion.
30 Belgian, Finnish and Portuguese government bonds, for example, are often issued on a primary auction platform operated by Bloomberg.
31 Similar to auctions are fixed-price subscription procedures. In an auction, the issue price is determined on the basis of the incoming bids. In a fixed-price subscription, the issue price is fixed and announced before bids are submitted and bids only specify a quantity that the respective investor wishes to buy at this price. Fixed price subscriptions are, however, rarely used for European government bond issues.
2 TRAD ING AND POST TRAD ING
INFRASTRUCTURE
34ECBThe euro bonds and derivatives marketsJune 2007
EuroMTS for example (see below). In particular, non-government debt securities, debt securities issued by governments of smaller countries and new types of debt security have been issued through syndication. For example, while the German government uses auctions for almost all of its securities issues, the first inflation-indexed German government bond, which was issued in 2006 (see Section 1.1.2), was issued through a syndicate. Almost all euro area government bonds that are not issued via auction are issued through syndication.
In a syndication procedure, a group of banks (the syndicate) intermediates between issuer and investors. In virtually all cases the syndicate banks also act as underwriters, i.e. firmly buying from the issuer the issued securities and keeping on their own books those securities that they cannot sell on to final investors. The placement risk is thus borne by the syndicate.32
In the case of large government bond issues, the syndication procedure is typically very flexible and does not follow pre-defined rules. This flexibility ensures that the entire issue is usually sold to final investors in a very short time at a uniform price. First, the syndicate contacts a number of potential (big institutional) investors to inform them of the new issue and to gain an impression of the demand for the new issue in the market. The issuer and the syndicate then typically identify a range of possible issue prices (often as a spread on a benchmark bond) through negotiation, taking into account information from contacts with potential investors. Subsequently, firm orders and indications of interest may be collected by the syndicate members from investors, while the issue price range is refined through ongoing negotiations between the issuer and the syndicate until the issue price is fixed. The allocation of the securities to final investors is also determined through negotiation between issuer and syndicate.
For smaller issues, in particular for corporate bonds, syndication is often organised as a
fixed-price reoffering. First, the syndicate banks collect information on potential demand from investors. The syndicate and the issuer then fix a price at which the banks buy the issue from the issuer and another, possibly slightly higher price at which the syndicate members agree to sell the securities on to investors. After a specified period of time, the syndicate dissolves and the banks are allowed to sell the remaining securities at a lower price. An alternative to fixed-price reoffering is the pot deal. In a pot deal, a range of possible issue prices are fixed and the final issue price is then set on the basis of firm investor orders collected in one common book (“pot”) and negotiations between the syndicate and the issuer. In the case of pot deals, the price risk is usually borne by the issuer.
Syndication does not rely very much on automated electronic procedures. Contacts between syndicate members and potential investors are often based on phone calls or face-to-face meetings. However, it appears that dedicated electronic communication systems are increasingly being used for the exchange of information between syndicate members and the issuer.33 Electronic communication may be used in particular for book building, i.e. the collection of firm orders (or at least indications of interest) from investors in a central book.
Other less often used primary market procedures include exchange offerings and private placements. In an exchange offering, the issuer offers to owners of “old” securities (that are maturing or that are off-the-run, i.e. no longer traded very much) to exchange them for newly issued securities at a fixed swap rate. Private placements are typically initiated by an investor rather than the issuer. The investor may contact a bank to indicate the desire to buy securities with certain general characteristic. The bank would then contact potential issuers and any
32 Syndication where the issuer bears the placement risk is called syndication on a best-effort basis and is, as indicated, very rare.
33 An example is IssueNet (formally ICMA Match), an electronic communication service between fixed income syndicate desks.

35ECB
The euro bonds and derivatives marketsJune 2007
issuer willing to issue securities to the specific investor could then start price negotiations directly with the issuer or through the agent bank.
It appears increasingly common for securities to be sold on primary markets in several tranches (tap sales), so the outstanding amount of the security increases over time. Euro area government bond tap securities are typically sold via auction. However, if the initial tranche of the tap is issued through syndication, then syndication is also sometimes used to issue further tranches of the same security. The price at which previously issued fungible securities are traded in the secondary market is used as a reference point for the issue price of further tranches.
SECONDARY MARKETS European secondary securities markets34 have been characterised by a strong trend towards electronic trading, fostered by advances in communication technology and competition between trading platforms, resulting in low trading fees in recent years. According to a survey by the Securities Industry and Financial Markets Association (SIFMA), sell-side firms (i.e. brokers and dealers) reported that 29% of their trades were executed electronically, up from 22% in 2005. The share of electronic trading is expected to increase to 40% in 2007.
Electronic trading systems can be organised in many different ways. Inter-dealer electronic bond markets are either order-driven or quote-driven, whereby quote-driven systems dominate (see Table 12). In an order-driven system, all participants can enter (limited and/or unlimited) buy and sell orders into a central order book which can be viewed by all participants. The system executes trades according to certain rules on the basis of the content of the order book. Quote-driven systems distinguish two types of participant. Market makers quote buy and sell prices, typically in inter-dealer markets, continuously during the trading day. Other participants trade exclusively with market makers, by accepting a quoted price from the
market maker. The number of market makers may be limited, but some quote-driven systems allow all participants to act as market makers, i.e. to quote buy and sell prices. Some order-driven systems authorise certain participants to act as liquidity providers, i.e. to quote buy and sell prices.
The main inter-dealer electronic trading systems are the various trading platforms of MTS Group and, at some distance behind, eSpeed and BrokerTec/ICAP.35 MTS Group comprises several trading platforms utilising the same technology. These are EuroMTS and several domestic trading platforms. EuroMTS is a platform for euro-denominated government and quasi-government bonds with an outstanding amount of at least €5 billion. The majority of bonds traded on EuroMTS are issued by the respective euro area government, but issues from other countries, including non EU emerging market countries like Brazil are also traded. Domestic bonds, mostly government issues, are traded on the respective domestic MTS markets.36 There are now domestic MTS platforms in almost all euro area countries and in a few other EU (e.g. Poland) and non-EU countries (e.g. Israel since 2006).
Dealer-to-customer trading platforms are typically organised as quote-driven systems. Some of them are operated by large banks as single dealer-to-customer platforms, i.e. the operating bank acts as the only market maker and is a party, either the seller or the buyer, in each trade. An example is Autobahn Electronic Trading, a system operated by Deutsche Bank on Bloomberg. However, the bulk of dealer-to-
34 Debt securities can be traded on secondary markets in different forms. This section focuses on cash trading of debt securities. Section 2.3 discusses trading of debt securities as underlying assets in derivative trading. Repo trading as a form of secured money market trading is analysed in for example the Euro Money Market Study of the ECB. Other forms of bond trading are basis trading (the purchase (sale) of securities and simultaneous sale (purchase) of futures contracts on the same securities) and spread trading (the purchase of one security and simultaneous sale of another related security).
35 BrokerTec/ICAP is however a major platform for European government debt repos.
36 Bond with an outstanding amount of €5 billion or more are typically traded on EuroMTS and the domestic MTS platform.
2 TRAD ING AND POST TRAD ING
INFRASTRUCTURE
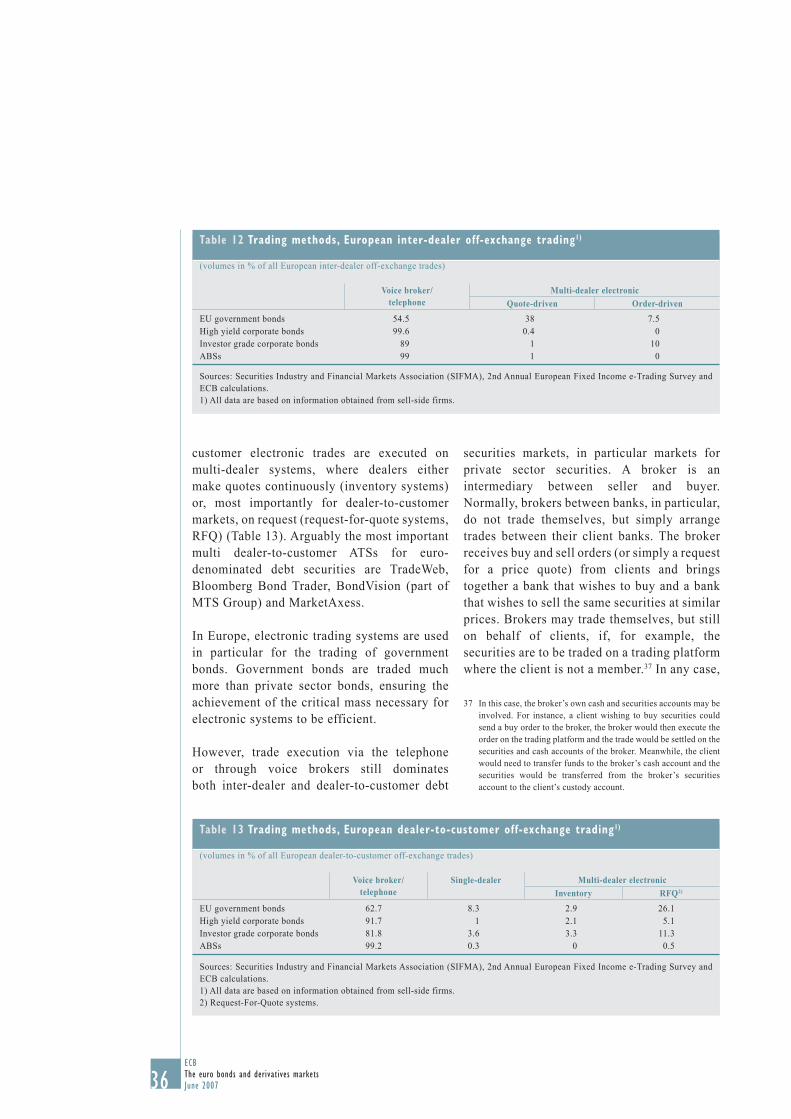
36ECBThe euro bonds and derivatives marketsJune 2007
customer electronic trades are executed on multi-dealer systems, where dealers either make quotes continuously (inventory systems) or, most importantly for dealer-to-customer markets, on request (request-for-quote systems, RFQ) (Table 13). Arguably the most important multi dealer-to-customer ATSs for euro-denominated debt securities are TradeWeb, Bloomberg Bond Trader, BondVision (part of MTS Group) and MarketAxess.
In Europe, electronic trading systems are used in particular for the trading of government bonds. Government bonds are traded much more than private sector bonds, ensuring the achievement of the critical mass necessary for electronic systems to be efficient.
However, trade execution via the telephone or through voice brokers still dominates both inter-dealer and dealer-to-customer debt
Table 12 Trading methods, European inter-dealer off-exchange trading1)
(volumes in % of all European inter-dealer off-exchange trades)
Sources: Securities Industry and Financial Markets Association (SIFMA), 2nd Annual European Fixed Income e-Trading Survey and ECB calculations.1) All data are based on information obtained from sell-side firms.
Voice broker/telephone
Multi-dealer electronic
Quote-driven Order-driven
EU government bonds 54.5 38 7.5High yield corporate bonds 99.6 0.4 0Investor grade corporate bonds 89 1 10ABSs 99 1 0
Table 13 Trading methods, European dealer-to-customer off-exchange trading1)
(volumes in % of all European dealer-to-customer off-exchange trades)
Sources: Securities Industry and Financial Markets Association (SIFMA), 2nd Annual European Fixed Income e-Trading Survey and ECB calculations.1) All data are based on information obtained from sell-side firms.2) Request-For-Quote systems.
Voice broker/telephone
Single-dealer Multi-dealer electronic
Inventory RFQ2)
EU government bonds 62.7 8.3 2.9 26.1High yield corporate bonds 91.7 1 2.1 5.1Investor grade corporate bonds 81.8 3.6 3.3 11.3ABSs 99.2 0.3 0 0.5
securities markets, in particular markets for private sector securities. A broker is an intermediary between seller and buyer. Normally, brokers between banks, in particular, do not trade themselves, but simply arrange trades between their client banks. The broker receives buy and sell orders (or simply a request for a price quote) from clients and brings together a bank that wishes to buy and a bank that wishes to sell the same securities at similar prices. Brokers may trade themselves, but still on behalf of clients, if, for example, the securities are to be traded on a trading platform where the client is not a member.37 In any case,
37 In this case, the broker’s own cash and securities accounts may be involved. For instance, a client wishing to buy securities could send a buy order to the broker, the broker would then execute the order on the trading platform and the trade would be settled on the securities and cash accounts of the broker. Meanwhile, the client would need to transfer funds to the broker’s cash account and the securities would be transferred from the broker’s securities account to the client’s custody account.

37ECB
The euro bonds and derivatives marketsJune 2007
brokers buy securities only if they can sell them on immediately or almost immediately. Their income is generated from brokerage fees charged to buying and selling clients. Voice brokers receive client orders (or requests for price quotes) by phone (or fax or email) rather than through electronic trading systems. Price quotes from a voice broker may, however, be posted to clients through an electronic system.
The share of trades in European private sector bonds executed on exchanges is almost negligible, whereas European government bonds are traded on exchanges to an extent. However, the SIFMA survey indicates that no more than 12% of government bond transactions of sell-side firms are on-exchange. Because sell-side firms cannot distinguish between inter-dealer and dealer-to-customer trades when trades are executed on an exchange, Tables 9a and 9b only cover off-exchange activities.38
From a regulatory point of view, secondary securities markets can be divided into regulated and non-regulated markets. Regulated markets are markets that fulfil a set of regulatory requirements specified in the Investment Services Directive.39 For example, they have to be recognised as regulated markets by their home Member State, comply with any regulation issued or approved by the competent regulatory authority and fulfil specific reporting and transparency requirements. A list of all regulated markets can be found on the European Commission’s websites.40 The Annex provides an overview of all regulated markets that are located in the euro area and offer secondary market trading in debt securities. While a few regulated markets are still organised as open outcry (trading floor based) or telephone based systems, most regulated markets are now operated fully electronically.
However, the strong increase in electronic trading activities in the past few years might mainly be a result of the introduction of non-regulated markets based on electronic trading systems (so-called “alternative trading systems”
Table 14 Trading of debt securities on euro area trading platforms1), cash market turnover(2005 annual trading volumes; single-counted; in EUR millions)
Sources: Federation of European Securities Exchanges, ECB Blue Book, internet, operating companies. Data on EuroMTS and domestic MTS markets are from the MTS publication “The European Bond Market: A Single Market with Unique Segments, Edition III – 2006”.1) Excluding purely phone-based markets.
Wiener Börse 343Euronext (BE, FR, PT, NL) 142,436Helsinki Securities Exchange 13Deutsche Börse AG 307,538Other German Securities Exchanges 258,292Eurex Bonds 136,272Athens Stock Exchange 40Bank of Greece (HDAT) 729,000Irish Stock Exchange 25,595Borsa Italiana 124,484TLX S.p.A. 13,305Bourse de Luxembourg 1,957Four Spanish Stock Exchanges 93,600SENAF 231,000EuroMTS 302,940MTS Austria 32,115MTS Belgium 178,213MTS Finland 57,003MTS France 212,811MTS Germany 143,271MTS Greece 100,441MTS Ireland 5,538MTS Italy 1,595,838MTS Netherlands 79,673MTS Portugal 146,690MTS Spain 101,415
or ATSs) which have been set up in recent years and increasingly compete with regulated markets. For many ATSs data on trading activities are not readily available. However, arguably the most important ATSs for euro area cash bond trading are, indeed, the non-regulated
38 For the SIFMA survey, an exchange is defined as “a marketplace in which bonds or their derivatives are traded. The securities traded are listed on the exchange which is regulated and generally among other things guarantees settlement. There is no distinction made between dealers or investors. Access to the exchange is generally open to the public via brokers. Market making occurs but on a voluntary basis. For the purposes of this survey, the term “Exchange” does NOT include regulated markets such as MTS Italy or MTS Portugal as access on those markets is restricted to dealers or banks.”
39 Directive 2004/39/EC of the European Parliament and the Council of 21 April 2004 on markets in financial instruments (MiFID) will replace the Investment Services Directive on 1 November 2007, see also Chapter 4.
40 See http://ec.europa.eu/internal_market/securities/isd/index_en.htm
2 TRAD ING AND POST TRAD ING
INFRASTRUCTURE

38ECBThe euro bonds and derivatives marketsJune 2007
trading platforms of the MTS Group. Trading volumes for the year 2005 of regulated euro area platforms and regulated or non-regulated euro area MTS markets are shown in Table 14.
2.1.2 POST-TRADING ARRANGEMENTS FOR DEBT SECURITIES
The introduction of the euro in combination with other factors initiated the process of consolidation of post-trading infrastructures in the euro area. However, consolidation has mainly taken place domestically and only to a limited extent at EU level. As a consequence, the post-trading infrastructures at cross-border level remain largely fragmented, complex and, therefore, costly. In the recent years, authorities and market participants have taken actions aimed at fostering integration of and competition in the euro post-trading infrastructures.
Post-trading infrastructures comprise in particular central counterparty clearing houses (CCPs) and securities settlement systems (SSSs). As illustrated in Chart 13, information on a securities transaction – executed on a regulated market or over the counter (OTC) - either goes directly to the SSS in which the transaction is to be settled; or is first routed to a CCP and only after CCP clearing is submitted for settlement to the SSS.
Chart 13 Post-trading infrastructure
CCP
Exchange
SSS
OTC
Clearing
Settlement
Trading
CCPs offer a range of post-trading services such as netting and novation. Netting refers to the calculation of a single net position for each CCP member and instrument.41 In the novation process, the CCP interposes itself as the buyer to every seller and as the seller to every buyer. The contractual relationship between a buyer and a seller is replaced by two new contracts, one between the buyer and the CCP, the other one between the seller and the CCP, such that the buyer buys from the CCP and the seller sells to the CCP.42
The intervention of the CCP has three main advantages. First, netting increases liquidity in the market as it reduces the number of settlement transfers and thus the associated risks and
41 If, for example, a clearing member first bought 100 shares of company X at a total price of €1,000 and later sold 50 shares of the same company at a total price of €600, then the member’s net position is an obligation to pay €400 and a right to receive 50 shares.
42 In most jurisdictions the legal concept that enables a CCP to become the counterparty is either novation or open offer. Through novation the original contract between the buyer and seller is extinguished and replaced by two new contracts, one between the CCP and the buyer and the other between the CCP and the seller. In an open offer system a CCP is automatically and immediately interposed in a transaction at the moment the buyer and seller agree on the terms. Indeed, in an open offer system, if all pre-agreed conditions are met, there is never a contractual relationship between the buyer and seller. Both novation and open offer give market participants legal certainty that a CCP is obligated to effect settlement if the legal framework is supportive of the method used.

39ECB
The euro bonds and derivatives marketsJune 2007
operational costs. Second, novation transfers to the CCP the management of counterparty risk (i.e. the risk that one party’s trading counterparty cannot fulfil its obligation from a trade), as the CCP becomes the single trading counterparty to all its members. To mitigate its own exposure to counterparty risk, the CCP implements rigorous risk control measures, such as membership requirements, margin calls and guarantee funds. Third, novation allows anonymity of counterparties to be maintained in the post-trading processing, as trading parties no longer need to know with which counterparty they were originally trading.43
Traditionally, CCPs have provided services relating to derivatives and equities traded on an exchange. More recently, their use in bond markets and for OTC transactions has become more common. However, CCPs have not been set up for every financial instrument in every euro area domestic market.
Where no CCP exists, matching services are traditionally provided by exchanges or SSSs, while netting and clearing services are often provided by SSSs.
SSSs are provided by central securities depositories (CSDs) or international central securities depositories (ICSDs). An (international) central securities depository (I)CSD is a facility (or an institution) for holding securities, which enables securities transactions to be processed by book entry. Physical securities may be immobilised by the depository or securities may be dematerialised (i.e. so that they exist only as electronic records). In addition to safekeeping, (I)CSDs may provide matching, clearing and settlement. CSDs also perform a notary function, i.e. the registration of ownership of securities on a legal record. CSDs were originally organised on a national basis. They were responsible for the settlement of securities traded in their respective national markets.
The euro area inherited the market infrastructures of its member countries. As a result, the euro
area market infrastructure was highly fragmented at the time that the single currency was introduced. The introduction of the euro and the resulting elimination of exchange rate risks, in combination with other factors such as technological advances, initiated the process of consolidation of post-trading infrastructures in the euro area. However, consolidation has mainly taken place domestically and only to a limited extent at EU level. As a consequence, the post-trading infrastructures at cross-border level remain largely fragmented, complex and, therefore, costly.
In recent years, authorities and market participants have taken action aimed at fostering integration and competition in euro market infrastructures and enhancing the interoperability and efficiency of post-trading infrastructures:
– The two Giovannini reports, published in 2001 and 2003, identified 15 barriers as the source of inefficiencies in the post-trading sector and developed a coherent strategy for their removal.
– In 2001 the Joint Working Group created by the ESCB and the Committee on European Securities Regulators (CESR) began defining common European standards for securities clearing and settlement based on the CPSS-IOSCO (Committee on Payment and Settlement Systems – International Organisation of Securities Commissions) recommendations.
– In 2004 the European Commission adopted a Communication on the need for EU level action to improve clearing and settlement in the European Union. Consequently, it set up the Clearing and Settlement Advisory and Monitoring Expert Group (CESAME), composed of high level representatives of various private and
43 Without the intervention of a CCP, after any anonymous trade execution, the trading platform would disclose to each trader the respective counterparty in order enable them to instruct the relevant SSS for the trade settlement.
2 TRAD ING AND POST TRAD ING
INFRASTRUCTURE

40ECBThe euro bonds and derivatives marketsJune 2007
public sector bodies involved in the clearing and settlement process with the mandate to advise the Commission on the coordination of public and private strategies and policies for the integration of European securities clearing and settlement systems and the removal of the “Giovannini barriers”. In 2005 two other expert groups on clearing and settlement were set up – the Legal Certainty Group (LCG) and the Fiscal Compliance (FISCO) – to deal, respectively, with legal certainty issues and fiscal compliance issues relating to the integration of EU securities clearing and settlement systems.
– In November 2006 the “Code of Conduct” (CoC) was signed by the members of the three main industry associations.44 The CoC addresses transparency of prices and services, access and interoperability, unbundling of services and accounting separation. Its purpose is to foster competition and efficiency in the fields of trading, clearing, and settlement. While the CoC is initially limited to cash equities, it is expected that it will be extended over time to other financial instruments, such as debt securities.
In the following two sub-sections, the current post-trading infrastructure for debt securities is described, i.e. CCPs and SSSs operated by (I)CSDs involved in the clearing and settlement of transactions in euro-denominated debt securities.
CENTRAL COUNTERPARTY CLEARING HOUSES45
In the euro area there are five CCPs providing services related to debt securities.46 These are: CCP.A (based in Austria), Cassa di Compensazione e Garanzia (CC&G) (based in Italy), MEFFCLEAR47 (based in Spain), Eurex Clearing AG (based in Germany) and LCH.Clearnet SA (based in France).
The first three CCPs are vertically integrated with the respective domestic exchanges and CSDs. They all provide services related to debt
securities transactions for the respective domestic exchange. CC&G and MEFFCLEAR also clear OTC trades in debt securities, while in Austria OTC trades in debt securities are not cleared by a CCP, but by the Austrian CSD (i.e. OeKB).48
Eurex Clearing AG provides services related to German debt securities transactions conducted on the Eurex Bond market. Trades can then be settled either in Clearstream Frankfurt, Clearstream Luxembourg, Euroclear Bank or, outside the European Union, in the Swiss CSD (i.e. SIS).
LCH.Clearnet SA (i.e. the former Clearnet) is horizontally integrated with LCH.Clearnet Ltd, the former London Clearing House, in the LCH.Clearnet Group Limited. The two CCPs are subsidiaries of LCH.Clearnet Group Limited, which is owned by users, the Euronext group and Euroclear group.
LCH.Clearnet SA provides CCP services for French, Belgian, Dutch and Portuguese debt securities traded on the Euronext exchanges or OTC (including trades on MTS France). Trades in these debt securities, once they have been
44 Federation of European Securities Exchanges (FESE), European Association of Central Counterparty Clearing Houses (EACH) and European Central Securities Depositories Association (ECSDA).
45 The presentation below omits figures on the volume and value of transactions which are cleared by CCPs, as available statistics do not distinguish between trades by type of asset. Aggregate figures could indeed be misleading for the purpose of the current study focusing on debt securities, as such securities are largely traded OTC, while the bulk of CCP activities result from on-exchange trades, which instead largely relate to equities. Furthermore, in this field figures are collected without a common methodology, which makes data hard to comparable with each other. The Eurosystem/ESCB has recently developed a common statistical framework for CCPs, which is currently under implementation. More accurate and comparable statistics will be available as from June 2007.
46 The other two euro area CCPs (MEFF in Spain and ADECH in Greece) deal only with equities and/or derivatives. At the EU level, there is only one other independent CCP, LCH.Clearnet Ltd (based in the UK), which also deals with debt securities (see below). The Stockholm Stock Exchange (SSE), based in Sweden, also acts as a CCP, but only for derivatives.
47 MEFFCLEAR deals only with debt securities.48 The Austrian CSD, OeKB, also provides clearing and settlement
services for trades on Deutsche Börse’s Xetra Frankfurt that can be settled on cash and securities accounts held with OeKB (via Custody Clearing Link Deutschland – CCLD).
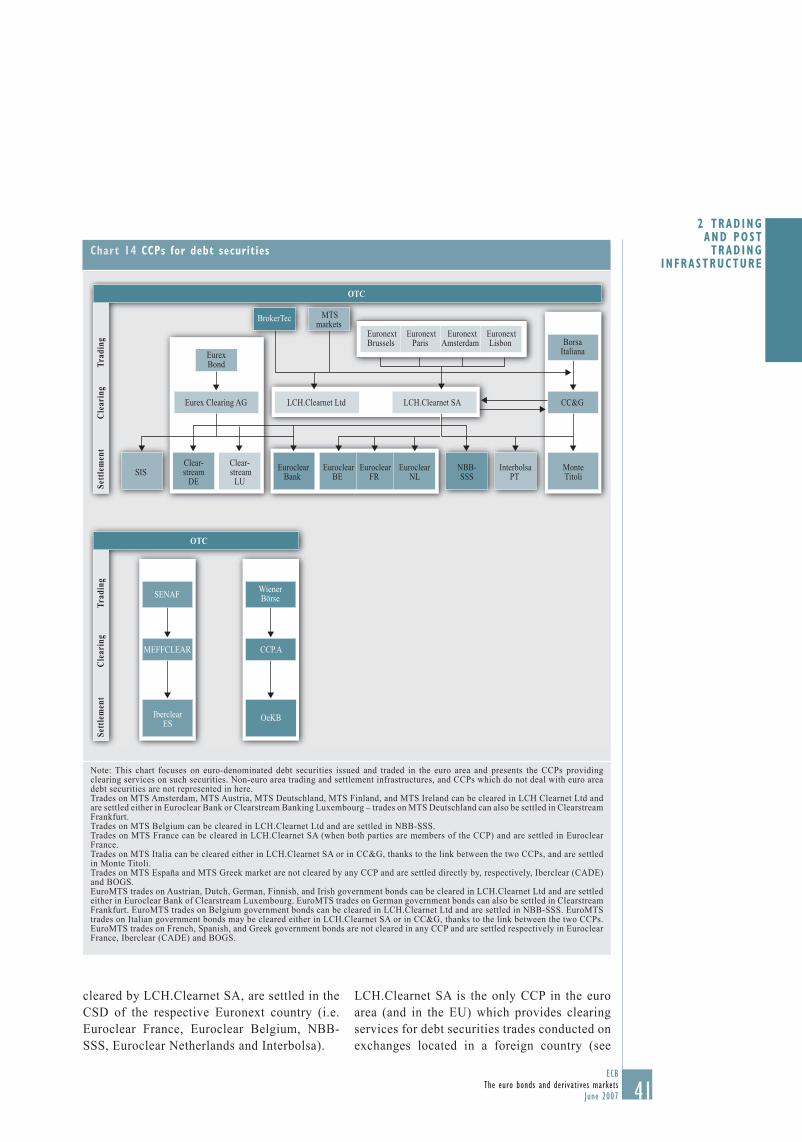
41ECB
The euro bonds and derivatives marketsJune 2007
Chart 14 CCPs for debt securities
Note: This chart focuses on euro-denominated debt securities issued and traded in the euro area and presents the CCPs providing clearing services on such securities. Non-euro area trading and settlement infrastructures, and CCPs which do not deal with euro area debt securities are not represented in here. Trades on MTS Amsterdam, MTS Austria, MTS Deutschland, MTS Finland, and MTS Ireland can be cleared in LCH Clearnet Ltd and are settled either in Euroclear Bank or Clearstream Banking Luxembourg – trades on MTS Deutschland can also be settled in Clearstream Frankfurt. Trades on MTS Belgium can be cleared in LCH.Clearnet Ltd and are settled in NBB-SSS. Trades on MTS France can be cleared in LCH.Clearnet SA (when both parties are members of the CCP) and are settled in Euroclear France. Trades on MTS Italia can be cleared either in LCH.Clearnet SA or in CC&G, thanks to the link between the two CCPs, and are settled in Monte Titoli. Trades on MTS España and MTS Greek market are not cleared by any CCP and are settled directly by, respectively, Iberclear (CADE) and BOGS. EuroMTS trades on Austrian, Dutch, German, Finnish, and Irish government bonds can be cleared in LCH.Clearnet Ltd and are settled either in Euroclear Bank of Clearstream Luxembourg. EuroMTS trades on German government bonds can also be settled in Clearstream Frankfurt. EuroMTS trades on Belgium government bonds can be cleared in LCH.Clearnet Ltd and are settled in NBB-SSS. EuroMTS trades on Italian government bonds may be cleared either in LCH.Clearnet SA or in CC&G, thanks to the link between the two CCPs. EuroMTS trades on French, Spanish, and Greek government bonds are not cleared in any CCP and are settled respectively in Euroclear France, Iberclear (CADE) and BOGS.
MonteTitoli
InterbolsaPT
NBB-SSS
EuroclearBE
EuroclearFR
EuroclearNL
EuroclearBank
Clear-stream
DE
Clear- stream
LUSIS
OTC
OTC
LCH.Clearnet Ltd
Settl
emen
t
BorsaItaliana
CC&G
IberclearES
SENAF
MEFFCLEAR
OeKB
WienerBörse
CCP.A
MTSmarkets BrokerTec
EuronextBrussels
EuronextParis
EuronextAmsterdam
EuronextLisbon
LCH.Clearnet SA
EurexBond
Eurex Clearing AG
Trad
ing
Clea
ring
Se
ttlem
ent
Tr
adin
gCl
eari
ng
cleared by LCH.Clearnet SA, are settled in the CSD of the respective Euronext country (i.e. Euroclear France, Euroclear Belgium, NBB-SSS, Euroclear Netherlands and Interbolsa).
LCH.Clearnet SA is the only CCP in the euro area (and in the EU) which provides clearing services for debt securities trades conducted on exchanges located in a foreign country (see
2 TRAD ING AND POST TRAD ING
INFRASTRUCTURE

42ECBThe euro bonds and derivatives marketsJune 2007
Chart 14). This regional integration has been triggered by the merger of the Euronext group exchanges, following which LCH.Clearnet SA took over the activities of the French, Belgian, Dutch and Portuguese CCPs owned by the merging exchanges.
In addition, the UK-based LCH.Clearnet Ltd (besides clearing trades in equities, derivatives and energy commodities conducted on the London markets)49 provides (through Repoclear) clearing services for OTC repo and cash trades in European government and international bonds, including trades on some MTS markets (namely: MTS Amsterdam, MTS Austria, MTS Belgium, MTS Deutschland, MTS Finland, MTS Ireland and EuroMTS) and BrokerTec. Trades cleared by LCH.Clearnet Ltd are generally settled in one of the two ICSDs (i.e. Clearstream Luxembourg or Euroclear Bank), although German government bonds can also be settled in the German CSD (i.e. Clearstream Frankfurt), and Belgian government bonds are settled in the Belgian CSD (i.e. NBB-SSS).
Moreover, CCPs may also deal with trades in debt securities deposited in “unlinked” CSDs (i.e. a CSD with which the CCP does not have a direct account) through the network of links between CSDs (see section below). For example, both Eurex Clearing AG and LCH.Clearnet Ltd provide services related to debt securities deposited in the Finnish CSD (namely, APK) through the link between the latter and Clearstream Frankfurt (with which both CCPs have accounts).
The link between the LCH.Clearnet SA and CC&G represents a further step towards the integration of the European post-trading infrastructure for debt securities. This bi-directional link covers transactions in Italian government bonds conducted on MTS Italy, Euro MTS and BrokerTec. The two CCPs participate in each other’s clearing systems under an ad hoc membership category. Thanks to this cross-participation, transactions can also be cleared when the traders are not participating in the same CCP. Italian government bonds are
then settled in the Italian CSD (i.e. Monte Titoli), with which both CCPs have securities accounts.
All in all, the European clearing infrastructure for debt securities is still fragmented. The integration process is progressing, although rather slowly. No true pan-European CCP has emerged and the successful examples of integration are limited to either the consolidation of the CCPs of the Euronext markets into LCH.Clearnet SA, or the interoperability provided by the link between LCH.Clearnet SA and CC&G (available for Italian government bonds), and, with regards to OTC transactions in European Government bonds, the direct participation of Eurex Clearing and LCH.Clearnet Ltd in various (I)CSDs.
SECURITIES SETTLEMENT SYSTEMSIn the euro area there are 18 CSDs and 2 ICSDs (Euroclear Bank, based in Belgium, and Clearstream Banking Luxembourg, based in Luxembourg) which provide SSSs for debt securities. Table 15 below shows key figures related to the settlement activity of the euro area CSDs.
The multiplicity of CSDs is a result of the national segmentation of European capital markets prior to the introduction of the common currency.
At national level, market infrastructure rationalisation led to the consolidation of CSDs operating in the same country but in different segments of the market (public debt, equities and corporate debt), such as in France and Italy.50
Consequently, today there is one national CSD per country, with the exception of four countries.
49 Namely, the London Stock Exchange (LSE), virt-x, Euronext.LIFFE, LME, ICE Futures and EDX.
50 In France the CSD for Treasury bills and short-term instruments managed by Banque de France was transferred to the other private national CSD (the former Sicovam, now renamed Euroclear France). In Italy the CSD for government bonds managed by Banca d’Italia was merged with the private national CSD, Monte Titoli.

43ECB
The euro bonds and derivatives marketsJune 2007
Table 15 Euro area CSDs in figures1) – debt securities segment (end 2005)
Source: ECB “Payment and Securities Settlement Systems in the European Union and in the Acceding Countries – Addendum incorporating 2005 data”, Blue Book December 2006.1) Figures on debt securities settlement also include debt derivatives transactions, as current statistics do not distinguish between securities transfers due to trades on the cash market and derivatives trades.2) Number of participants does not include CSDs. The number of CSDs participating in another CSD reflects the number of links.3) Custody figures may also refer to non-euro denominated debt securities (bonds and short-term papers). This is particularly relevant in the case of ICSDs and links to non-euro area CSDs.4) Settlement figures refer to transactions with payments denominated in euro and free-of-payment transactions (which may then include transfers of non-euro denominated debt securities).5) Volume figures below one thousand have been rounded to 0.6) SCL Barcelona, SCL Bilbao, SCL Valencia.7) The high value of settlement activity in Euroclear France is partly related to the collateralisation via repo of monetary policy and intraday credit operations with Banque de France.
CSDs Country Participants2) Value under custody3) Settlement4)
domestic foreign EUR millions volume in thousand5) value in EUR millions
OeKB AT 80 31 188,986 n.a. n.a.NBB-SSS BE 71 20 292,813 266 5,145,106Euroclear Belgium BE 62 14 819 n.a. n.a.Euroclear Bank BE 34 1,446 6,597,650 15,414 122,080,948Clearstream Frankfurt DE 246 113 3,353,829 3,714 26,444,789Iberclear ES 224 37 790,936 2,087 76,664,457SCL Regional Systems6) ES 61 1 13,638 39 86,453APK FI 30 6 72,620 18 146,638Euroclear France7) FR 131 22 1,878,257 6,326 155,825,158BOGS GR 79 13 174,613 400 6,536,549CSD SA GR 117 0 106 0 39,689NTMA IE 6 0 64 0 20Monte Titoli IT 346 5 1,675,267 19,849 63,473,894Clearstream Luxembourg LU 115 1,080 3,208,953 5,939 22,364,540Euroclear Netherlands NL 39 5 333,393 n.a. n.a.Interbolsa PT 36 2 89,755 50 17,555SITEME PT 44 1 16,027 1 84,130KDD SI 54 0 7,014 28 10,776
In Belgium, Greece and Portugal there are two national CSDs, which serve separate segments of the market. In each case one of the two national CSDs is managed by the national central bank and deals with either government debt securities (NBB-SSS in Belgium and BOGS in Greece) or with short-term papers (SITEME in Portugal). In Spain the national CSD, created through the merger of the two former national CSDs (SCLV and CADE), co-exists with three regional CSDs (SCL Barcelona, SCL Bilbao and SCL Valencia).
Only in Ireland has the rationalisation of the market infrastructure resulted in the entrusting of other EU CSDs with the custody and settlement function for domestic securities. As a result, Irish government bonds are currently
held in one ICSD (Euroclear Bank), while Irish corporate debt securities (and equities) are held in the UK-based CSD (CREST) and the Irish CSD deals exclusively with Irish Treasury Notes.
At the EU level, several mergers and acquisitions have taken place in past years, which have led to the emergence of three European regional groups, i.e. Euroclear (including the Brussels-based ICSD and the French, Belgian and Dutch CSDs, as well as the UK CSD), Clearstream (including the Luxembourg-based ICSD and the German CSD) and the Nordic CSD (NCSD, including the Finnish and Swedish CSDs). In the latter two cases, the CSD group is integrated in a vertical structure with stock exchange(s) and a CCP. The consolidation of several CSDs
2 TRAD ING AND POST TRAD ING
INFRASTRUCTURE
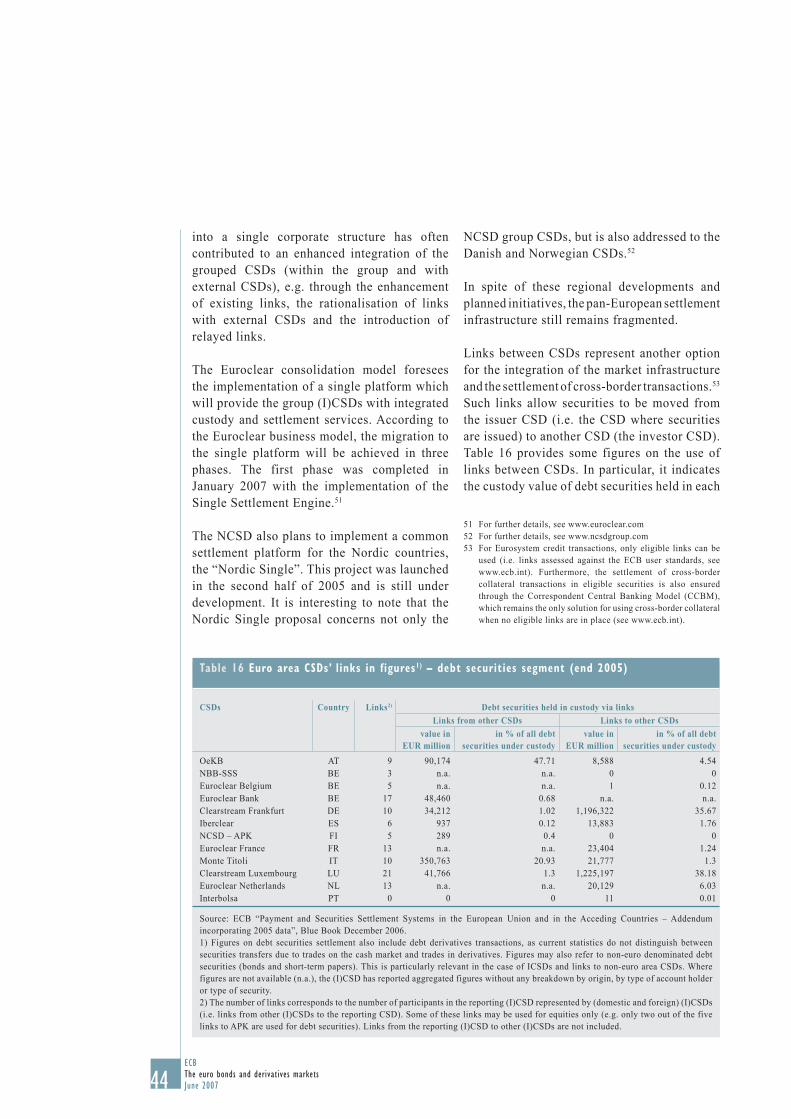
44ECBThe euro bonds and derivatives marketsJune 2007
into a single corporate structure has often contributed to an enhanced integration of the grouped CSDs (within the group and with external CSDs), e.g. through the enhancement of existing links, the rationalisation of links with external CSDs and the introduction of relayed links.
The Euroclear consolidation model foresees the implementation of a single platform which will provide the group (I)CSDs with integrated custody and settlement services. According to the Euroclear business model, the migration to the single platform will be achieved in three phases. The first phase was completed in January 2007 with the implementation of the Single Settlement Engine.51
The NCSD also plans to implement a common settlement platform for the Nordic countries, the “Nordic Single”. This project was launched in the second half of 2005 and is still under development. It is interesting to note that the Nordic Single proposal concerns not only the
Table 16 Euro area CSDs’ links in figures1) – debt securities segment (end 2005)
Source: ECB “Payment and Securities Settlement Systems in the European Union and in the Acceding Countries – Addendum incorporating 2005 data”, Blue Book December 2006.1) Figures on debt securities settlement also include debt derivatives transactions, as current statistics do not distinguish between securities transfers due to trades on the cash market and trades in derivatives. Figures may also refer to non-euro denominated debt securities (bonds and short-term papers). This is particularly relevant in the case of ICSDs and links to non-euro area CSDs. Where figures are not available (n.a.), the (I)CSD has reported aggregated figures without any breakdown by origin, by type of account holder or type of security.2) The number of links corresponds to the number of participants in the reporting (I)CSD represented by (domestic and foreign) (I)CSDs (i.e. links from other (I)CSDs to the reporting CSD). Some of these links may be used for equities only (e.g. only two out of the five links to APK are used for debt securities). Links from the reporting (I)CSD to other (I)CSDs are not included.
CSDs Country Links2) Debt securities held in custody via links
Links from other CSDs Links to other CSDs
value in EUR million
in % of all debt securities under custody
value in EUR million
in % of all debt securities under custody
OeKB AT 9 90,174 47.71 8,588 4.54NBB-SSS BE 3 n.a. n.a. 0 0Euroclear Belgium BE 5 n.a. n.a. 1 0.12Euroclear Bank BE 17 48,460 0.68 n.a. n.a.Clearstream Frankfurt DE 10 34,212 1.02 1,196,322 35.67Iberclear ES 6 937 0.12 13,883 1.76NCSD – APK FI 5 289 0.4 0 0Euroclear France FR 13 n.a. n.a. 23,404 1.24Monte Titoli IT 10 350,763 20.93 21,777 1.3Clearstream Luxembourg LU 21 41,766 1.3 1,225,197 38.18Euroclear Netherlands NL 13 n.a. n.a. 20,129 6.03Interbolsa PT 0 0 0 11 0.01
NCSD group CSDs, but is also addressed to the Danish and Norwegian CSDs.52
In spite of these regional developments and planned initiatives, the pan-European settlement infrastructure still remains fragmented.
Links between CSDs represent another option for the integration of the market infrastructure and the settlement of cross-border transactions.53 Such links allow securities to be moved from the issuer CSD (i.e. the CSD where securities are issued) to another CSD (the investor CSD). Table 16 provides some figures on the use of links between CSDs. In particular, it indicates the custody value of debt securities held in each
51 For further details, see www.euroclear.com52 For further details, see www.ncsdgroup.com 53 For Eurosystem credit transactions, only eligible links can be
used (i.e. links assessed against the ECB user standards, see www.ecb.int). Furthermore, the settlement of cross-border collateral transactions in eligible securities is also ensured through the Correspondent Central Banking Model (CCBM), which remains the only solution for using cross-border collateral when no eligible links are in place (see www.ecb.int).

45ECB
The euro bonds and derivatives marketsJune 2007
CSD on the account of another CSD (direct links from another CSD to the reporting CSD), of debt securities held on the account of each CSD with another CSD or custodian bank54
(direct and indirect links from the reporting CSD to other CSDs) and their share of total debt securities held in custody.55
However, some CSDs remain virtually unlinked (e.g. the SCL Regional Systems (ES), BOGS (GR), CSD SA (GR), NTMA (IE), SITEME (PT), KDD (SI)), and in these cases the cross-border transfer of securities relies exclusively on the use of custodian services.
Conscious of the need for further integration in market infrastructures, in July 2006 the Eurosystem announced that it was evaluating opportunities to provide efficient settlement services for securities transactions in central bank money, exploiting the benefits of the implementation of the TARGET2 payment system. The Eurosystem then explored in cooperation with central securities depositories and other market participants, the setting up of a new service – called TARGET2-Securities – for securities settlement in the euro area.
The objective of this project is to allow the harmonised settlement of securities transactions in euro which are settled in central bank money. Synergies for the market with other facilities operated by the Eurosystem will be sought, in particular TARGET2-Securities will be developed and operated on the TARGET2 platform. The implementation of such a facility, which would be fully owned and operated by the Eurosystem, would allow large cost savings as a result of the high level of technical harmonisation that this facility would entail for all market participants and would represent a major step towards a single Eurosystem interface with the market.
In March 2007, based on the analysis of a blueprint describing the TARGET2-Securities concept and a feasibility study, the Governing Council ECB concluded that it is feasible to implement TARGET2-Securities and decided
to go ahead with the next phase of the project (namely the definition of user requirements on the basis of market contributions). The Governing Council will then decide on the subsequent development phase by early 2008.56
2.2 INFRASTRUCTURE FOR CREDIT DERIVATIVES
Electronic trading platforms clearly dominate the trading landscape for credit derivatives, not least since the growth in importance of standardised multi-name CDSs. Competition between electronic trading platforms for credit derivatives has been growing more intense recently.
Following the rapid growth of this market segment, market players and financial authorities have become increasingly concerned with the lack of automated and harmonised post-trading processes for credit derivatives. As a consequence, and in response to market demand, markets have initiated the automation of post-trading procedures to increase efficiency and safety for credit derivatives.
2.2.1 TRADING INFRASTRUCTURE FOR CREDIT DERIVATIVES
As credit derivatives are relatively new products with remarkably high growth rates, they have been traded electronically throughout most of their history. Anecdotal evidence suggests that around 80% of European CDSs are now traded electronically (including telephone negotiations with subsequent electronic trade execution). GFI and Creditex appear to be the main
54 Custodian banks are intermediaries which provide investors with custody, clearing and settlement services in their local market. Some have their own internal infrastructure allowing them to clear and settle transactions in-house (internal clearing /settlement) when both counterparties of a trade hold accounts with the same custodian bank. This avoids having to forward the instructions directly to the local clearing and settlement systems
55 Custody figures on links from other CSDs and to other CSDs are not directly comparable as links to other CSDs includes indirect links via custodian banks, while links from other CSD refers only to direct links.
56 For further details, see www.ecb.int
2 TRAD ING AND POST TRAD ING
INFRASTRUCTURE

46ECBThe euro bonds and derivatives marketsJune 2007
electronic inter-dealer execution platforms for CDSs. GFI Group Inc. (GFIG) is an inter-dealer broker specialising in over-the-counter derivatives products and related securities. Creditex is an order-driven inter-dealer e-trading platform for credit derivatives. Both platforms are operated as non-regulated markets. In the dealer-to-customer business, MarketAxess and TradeWeb have been offering CDS trading opportunities and corporate bond trading (see Section 2.1.1). MTS Group recently announced that it will start offering electronic trading of CDSs on its EuroCredit MTS platform. Similarly, Eurex introduced futures contracts on iTraxx Europe indices in March 2007. Inter-dealer CDS markets appear to be dominated by a few large internationally active banks, and the majority of trades take place across borders.
Electronic trading has been increasing in importance since the advent of standardised multi-name CDSs and the introduction of the CDX and the iTraxx index families (see Section 1.2). The iTraxx indices of European reference obligations are sufficiently traded now that enough turnover can be generated to make electronic trading very attractive. The plans of major electronic platforms like Eurex and MTS to enter the CDS market shows that competition between platforms is increasing.
2.2.2 POST-TRADING INFRASTRUCTURE FOR CREDIT DERIVATIVES
Trades in credit derivatives are typically concluded OTC on a global market. Currently, no EU CCP provides services related to credit derivatives, including credit default swaps.57 EU (I)CSDs are only involved in the settlement of compensations on credit default swaps58 due on the occurrence of credit event on the reference entities, provided that i) the traders opted for “physical settlement mechanism”, and ii) debt securities deposited in those (I)CSDs are used as “deliverable” obligations.59 Consequently, no EU securities market infrastructure is involved in the credit derivatives transaction post-trading processing, consisting inter alia of providing automated
affirmation, matching, confirmation, legal execution, cash management, termination and portfolio reconciliation.
To support the recent exponential growth of this market, since 2003 a number of vendors and regulated prime brokers/dealers have been providing post-trading services related to credit derivatives, also playing a crucial intermediation role between buy-side clients (hedge funds, asset managers, pension funds and their executing dealers).
Following the rapid growth of this market segment, market players and financial authorities (e.g. prudential supervisors and central banks) have become increasingly concerned with the lack of infrastructure and the lack of automated, harmonised post-trading processes for credit derivatives.60
In response to the market demand for infrastructure, and in addition to market solutions for the automation and efficiency of post trading services, the US-based Depository Trust & Clearing Corporation (DTCC) announced on 14 November 2006 the launch of its Trade Information Warehouse (the “warehouse”), creating a new type of global, centralised infrastructure for the post-trading processing of credit default swaps. As a global infrastructure, the warehouse also deals with euro-denominated credit derivatives.
57 E.g. LCH.Clearnet Ltd has offered services for OTC interest rate swaps via Swapclear CCP since 1998, but it has not entered the field of credit default swaps.
58 For a definition of credit default swaps and cash settlement versus physical settlement, see Chapter 1, Section 1.2.
59 In such a case, the delivery of the debt securities is usually performed as a DVP settlement from the protection buyer to the protection seller, whereby the price is set at the nominal value, instead of the market value.
60 Major market players identified their main concerns in the report entitled “Toward Greater Financial Stability: A Private Sector Perspective” released by the Counterparty Risk Management Policy Group II (CRMPG II) in July 2005 (for further details see www.crmpolicygroup.org). The Committee on Payment and Settlement Systems (CPSS), which groups the central banks of the G-10 countries, published a report on new developments in clearing and settlement arrangements for OTC derivatives in mid-March 2007 as follow-up to a similar report published in 1998 by CPSS and the Committee on the Global Financial System (CGFS).

47ECB
The euro bonds and derivatives marketsJune 2007
61 Deriv/SERV was launched in April 2004 as a matching service to automate the confirmation and legal execution of credit default swaps and was used to confirm 80% of credit default swaps during 2006.
62 The same development took place with respect to other on-exchange traded derivatives, e.g. equity derivatives.
63 To be more precise, Eurex options are options on government bond futures.
64 To be precise, Eurex options are options on German government bond futures.
The warehouse consists of two components: 1) a trade database containing the “official legal record” of all contracts eligible for automated Deriv/SERV61 confirmation; and 2) a central support infrastructure that automates and standardises post-trade processes (such as payments, notional adjustments and contract term changes) over the lifecycle of a contract.
The warehouse largely replicates some of the services of a CCP (e.g. matching, confirmation and some clearing) without offering netting, novation, credit risk mitigation and default management.
The warehouse is initially intended to support credit derivatives, and then be extended to other OTC derivatives products (depending on market demand and input from the senior group of 19 leading dealers working with DTCC in guiding the initiative).
While the industry has welcomed these developments, it remains concerned that existing and future vendors, CCPs fulfilling the CPSS-IOSCO Recommendations for CCPs and payment systems fulfilling the Core Principles for Systemically Important Payment Systems, and any other post-trading service providers may not be able to connect to the trade warehouse. The recent CPSS report on “clearing and settlement arrangements for OTC derivatives” noted that trade information warehouse, CCPs and other post-trading infrastructures, should ensure open access to their systems from other systems and service providers and should achieve interoperability.
2.3 INFRASTRUCTURE FOR FUTURES AND OPTIONS ON DEBT SECURITIES
Today futures and options on euro-denominated debt securities are virtually exclusively traded on Eurex, whereby trading activities have been strongly increasing over the past four to five years. Central counterparties play a crucial role in clearing on-exchange derivative trades. Their clearing activities mitigate counterparty risk and increase post-trading efficiency.
2.3.1 TRADING INFRASTRUCTURE FOR OPTIONS AND FUTURES ON DEBT SECURITIES
Options and futures on debt securities have been traded on derivatives exchanges for a long time. Until the early 1990s they were mainly traded on trading floors of derivatives exchanges. Within a few years, however, trading moved to electronic platforms, in particular in Europe.62
Today, options and futures on euro-denominated debt securities are virtually exclusively traded on Eurex.63 All Eurex bond derivatives are options and futures on German government bonds.64 This development might be very much related to the introduction of the euro. As they are denominated in the same currency, yields on bonds issued by different euro area governments are very similar. Accordingly, derivatives on German government bonds can be used to hedge positions in any euro area government bonds. Trading activities can therefore be concentrated on German government bond derivatives alone.
Table 17 indicates a strong increase in derivatives trading activities between 2002 and 2006. Trading in futures has increased by 65% and trading in options by 162%, although from a significantly lower level. Futures are by far the most actively traded derivatives.
Table 17 Trading of options and futures on euro government bonds, Eurex market turnover(daily average1); in EUR billions)
Source: Eurex.1) 2006 daily average refers to 1 January 2006 to 4 December 2006.
2002 2003 2004 2005 2006
Futures 176 226 228 269 291Options 13 22 23 27 34
2 TRAD ING AND POST TRAD ING
INFRASTRUCTURE

48ECBThe euro bonds and derivatives marketsJune 2007
It has been noted that the market for euro-denominated government bonds is similar to the market for US dollar denominated bonds in terms of outstanding amounts, but much smaller in terms of trading activities. One possible explanation is the very active market for futures and options on euro government bonds. Trading futures on bonds is a close substitute for trading the bonds themselves. For example, a speculator who believes that bond prices are going to move up can either buy the bonds or a futures contract on the bonds. As markets for euro government bond futures appear to be very liquid, traders of European fixed income products may prefer trading futures contracts rather than bonds when they are trading for the purpose of speculation.
2.3.2 POST-TRADING INFRASTRUCTURE FOR OPTIONS AND FUTURES ON DEBT SECURITIES
For derivative markets, the clearing function plays a predominant role in the post-trading chain. Usually, traders on derivative markets offset their positions on the derivatives’ underlying assets before the derivative maturity (i.e. the settlement date) by undertaking an offsetting derivatives transaction – often with another counterparty. The netting and clearing of these interconnected transactions is therefore crucial. This often leads to simple cash payments (from net debtors to net creditors) without any securities settlement. When CCP services are provided, daily payments are also involved, in accordance with the margin calls required by the CCP, for each day from the trade date until the delivery date.
Settlement of the derivatives’ underlying assets is involved only in those cases where traders’ (net) exposures/positions on underlying assets remain uncovered. Upon the maturity of the respective derivative contract, underlying assets are settled from the net sellers to net buyers.65
In the case of exchange-traded debt derivatives, the derivatives’ underlying assets consist of debt securities, the settlement infrastructure of
which is described in section 2.1.2. This section will, therefore, focus on CCPs which provide services related to exchange-traded debt derivatives.
In the euro area there are six CCPs which deal with exchange-traded derivatives (CCP.A in Austria, LCH.Clearnet SA in France, Eurex Clearing in Germany, MEFF in Spain, ETESEP in Greece, CC&G in Italy)66. However, only two of them, namely MEFF and Eurex Clearing AG, deal with exchange-traded euro-denominated debt derivatives traded on the respective group’s derivative exchange.67
MEFF provides services related to fixed income derivatives trades concluded on MEFF Renta Fija (MEFF RT), the official Spanish exchange for financial futures and options on debt securities (i.e. Spanish government bonds). The cash settlement takes place in the RTGS system of the Banco de España. Eurex Clearing AG provides CCP services for fixed income derivatives trades concluded on Eurex – i.e. futures and option on German Government bonds (and Swiss bonds). The cash settlement takes place in the RTGS system of the Deutsche Bundesbank (and of the Schweizerische Nationalbank, SNB).
65 In some cases, market condition may lead to concentration of settlement of a benchmark debt securities on the maturity date of the respective derivatives contract. This may trigger liquidity tension that, if not supported by adequate services (e.g. securities lending), may result in high level of settlement failures.
66 At the EU level, there is only one other independent CCP, LCH.Clearnet Ltd (based in UK), which also deals with equities, index and interest rates derivatives traded on Euronext.LIFFE, including France, Belgian, Dutch and Portuguese derivatives. In addition, the Stockholm Stock Exchange (SSE), based in Sweden, also acts as a CCP for derivatives traded on the NOREX exchanges, including Finnish derivatives.
67 No other EU derivatives exchange provides trading in euro-denominated debt derivatives. Indeed, on all other EU derivatives exchanges only equity, equity index, interest rate and currency derivatives or non-euro denominated debt derivatives are traded.
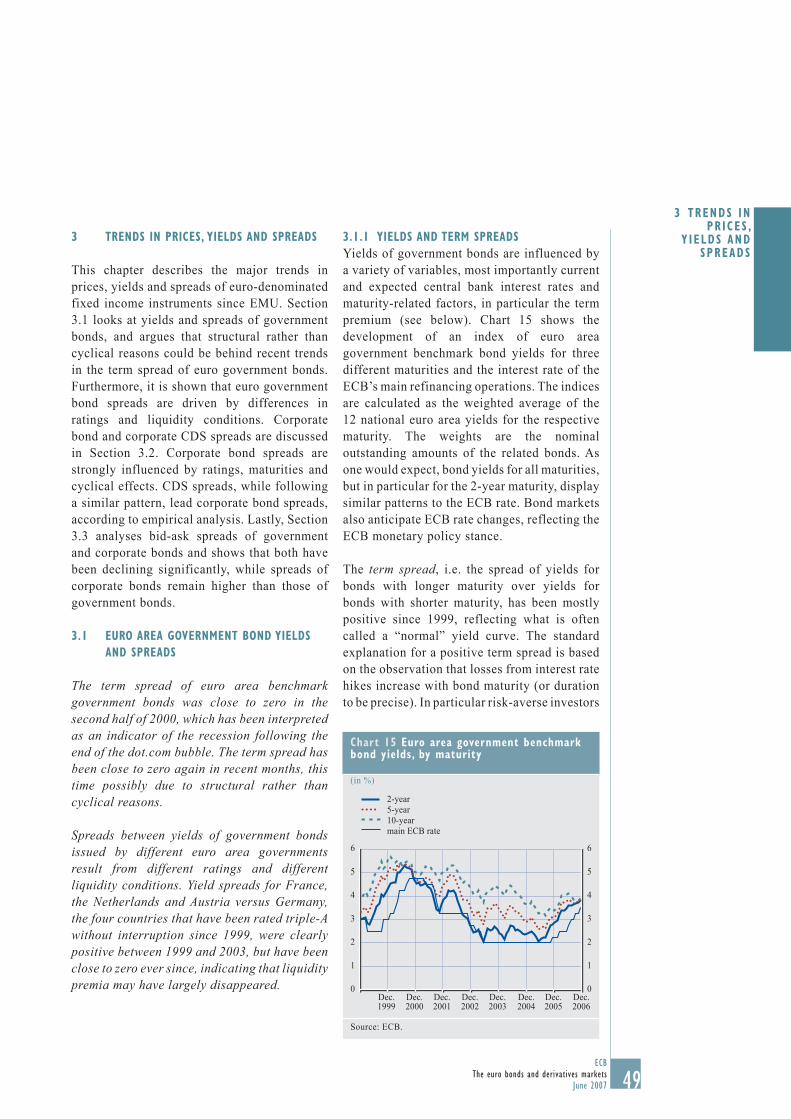
49ECB
The euro bonds and derivatives marketsJune 2007
3 TRENDS IN PRICES, YIELDS AND SPREADS
This chapter describes the major trends in prices, yields and spreads of euro-denominated fixed income instruments since EMU. Section 3.1 looks at yields and spreads of government bonds, and argues that structural rather than cyclical reasons could be behind recent trends in the term spread of euro government bonds. Furthermore, it is shown that euro government bond spreads are driven by differences in ratings and liquidity conditions. Corporate bond and corporate CDS spreads are discussed in Section 3.2. Corporate bond spreads are strongly influenced by ratings, maturities and cyclical effects. CDS spreads, while following a similar pattern, lead corporate bond spreads, according to empirical analysis. Lastly, Section 3.3 analyses bid-ask spreads of government and corporate bonds and shows that both have been declining significantly, while spreads of corporate bonds remain higher than those of government bonds.
3.1 EURO AREA GOVERNMENT BOND YIELDS AND SPREADS
The term spread of euro area benchmark government bonds was close to zero in the second half of 2000, which has been interpreted as an indicator of the recession following the end of the dot.com bubble. The term spread has been close to zero again in recent months, this time possibly due to structural rather than cyclical reasons.
Spreads between yields of government bonds issued by different euro area governments result from different ratings and different liquidity conditions. Yield spreads for France, the Netherlands and Austria versus Germany, the four countries that have been rated triple-A without interruption since 1999, were clearly positive between 1999 and 2003, but have been close to zero ever since, indicating that liquidity premia may have largely disappeared.
3.1.1 YIELDS AND TERM SPREADSYields of government bonds are influenced by a variety of variables, most importantly current and expected central bank interest rates and maturity-related factors, in particular the term premium (see below). Chart 15 shows the development of an index of euro area government benchmark bond yields for three different maturities and the interest rate of the ECB’s main refinancing operations. The indices are calculated as the weighted average of the 12 national euro area yields for the respective maturity. The weights are the nominal outstanding amounts of the related bonds. As one would expect, bond yields for all maturities, but in particular for the 2-year maturity, display similar patterns to the ECB rate. Bond markets also anticipate ECB rate changes, reflecting the ECB monetary policy stance.
The term spread, i.e. the spread of yields for bonds with longer maturity over yields for bonds with shorter maturity, has been mostly positive since 1999, reflecting what is often called a “normal” yield curve. The standard explanation for a positive term spread is based on the observation that losses from interest rate hikes increase with bond maturity (or duration to be precise). In particular risk-averse investors
Chart 15 Euro area government benchmark bond yields, by maturity
(in %)
Source: ECB.
2-year5-year10-yearmain ECB rate
Dec.1999
Dec.2000
Dec.2001
Dec.2002
Dec.2003
Dec.2004
Dec.2005
Dec.2006
0
1
2
3
4
5
6
0
1
2
3
4
5
6
3 TRENDS IN PR ICES ,
Y IELDS AND SPREADS

50ECBThe euro bonds and derivatives marketsJune 2007
and investors who cannot easily hedge interest rate risk will therefore demand a risk premium for investments in long-term bonds. This risk premium, commonly referred to as the term premium, is one component of the term spread. It leads to a positive term spread even when markets expect increasing and decreasing interest rates to be equally likely.
However, the term spread, measured as the spread of the yields of 10-year over 2-year euro area government bonds, has been changing over time with peaks in mid 1999 and mid 2004, while it was low in 2000 and has been low again towards the end of 2006 (Chart 16).
The term spread is widely seen as a reflection of market expectations of future short-term interest rates, in particular central bank rates. A low or, even more so, a negative term spread often indicates that markets expect central bank rate cuts. Suppose that 10-year and 2-year bonds currently return the same annualised yields and investors expect interests to go down. A typical investor with a ten-year investment horizon would then prefer to buy 10-year bonds rather than two-year bonds as the latter strategy would require him to reinvest after two years into bonds with presumably lower annual yields. Prices of ten-year bonds would accordingly increase and the term spread goes down.
In general, central banks tend to cut rates when the economic outlook deteriorates, as inflationary pressures often reduce during a downturn. A low or negative term spread has therefore also been seen as an indicator of markets expecting a downturn. Indeed, the reduction in term spreads in 2000 was closely followed by the start of an economic slowdown. However, it should also be noted that factors other than expectations of lower central bank rates may be responsible for a low term spread. For example, the term spread varies with the term premium, as explained above. Empirical analysis suggests that the term premium has been particularly low around the end of 2006.68 Another explanation for the currently very low term spread may be an institutionally driven increase in demand for long-term bonds, for example from pension funds. This would increase prices, lower yields of long-term bonds and reduce term spreads. However, a recent report by the Committee of the Global Financial System (CGFS) of the Bank for International Settlements found that the impact of pension fund assets on term spreads has been modest in the euro area and more significant only in the UK.69 Lastly, in a “hunt for yields” during times of still relatively low interest rates, some investors may be ready to invest in longer-term bonds to get a few more basis points, implying higher demand and lower yields for bonds with a long period to maturity.
3.1.2 YIELD SPREADS ACROSS EURO AREA GOVERNMENT BONDS
Other important factors that influence government bond yields are the credit risk and the liquidity risk to which investors are exposed when they invest in a bond. Credit risk refers to the risk that an issuer will default on its payment obligations or that its credit rating will be downgraded. Rating agencies like Moody’s, S&P and Fitch try to indicate an issuer’s credit
Chart 16 Spread of 10-year over 2-year euro area government benchmark bond yields
(in basis points)
Source: ECB.
Dec.1999
Dec.2000
Dec.2001
Dec.2002
Dec.2003
Dec.2004
Dec.2005
Dec.2006
020406080
100120140160180200
020406080100120140160180200
68 See ECB Monthly Bulletin, December 2006, Box 3. For further detailed analysis, see also ECB Monthly Bulletin, April 2005, Box 2; and ECB Monthly Bulletin, April 2007, Box 3.
69 “Institutional investors, global savings and asset allocation”, CGFS Paper No 27, February 2007.
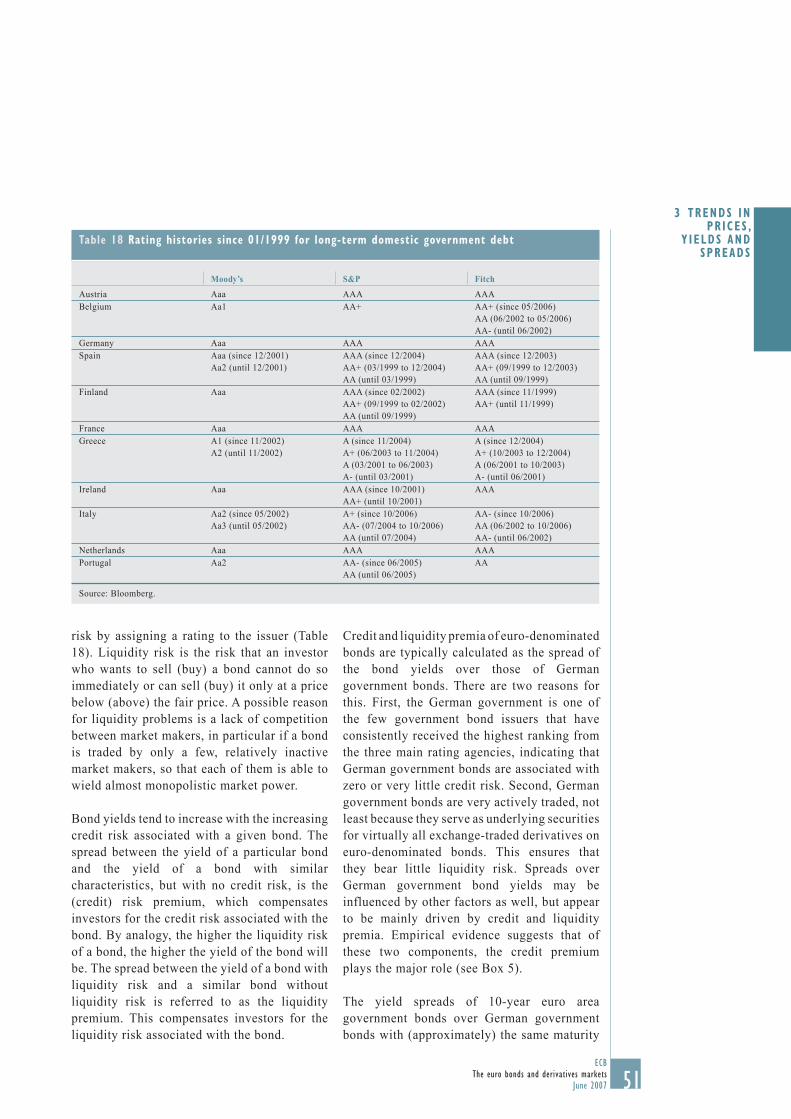
51ECB
The euro bonds and derivatives marketsJune 2007
risk by assigning a rating to the issuer (Table 18). Liquidity risk is the risk that an investor who wants to sell (buy) a bond cannot do so immediately or can sell (buy) it only at a price below (above) the fair price. A possible reason for liquidity problems is a lack of competition between market makers, in particular if a bond is traded by only a few, relatively inactive market makers, so that each of them is able to wield almost monopolistic market power.
Bond yields tend to increase with the increasing credit risk associated with a given bond. The spread between the yield of a particular bond and the yield of a bond with similar characteristics, but with no credit risk, is the (credit) risk premium, which compensates investors for the credit risk associated with the bond. By analogy, the higher the liquidity risk of a bond, the higher the yield of the bond will be. The spread between the yield of a bond with liquidity risk and a similar bond without liquidity risk is referred to as the liquidity premium. This compensates investors for the liquidity risk associated with the bond.
Credit and liquidity premia of euro-denominated bonds are typically calculated as the spread of the bond yields over those of German government bonds. There are two reasons for this. First, the German government is one of the few government bond issuers that have consistently received the highest ranking from the three main rating agencies, indicating that German government bonds are associated with zero or very little credit risk. Second, German government bonds are very actively traded, not least because they serve as underlying securities for virtually all exchange-traded derivatives on euro-denominated bonds. This ensures that they bear little liquidity risk. Spreads over German government bond yields may be influenced by other factors as well, but appear to be mainly driven by credit and liquidity premia. Empirical evidence suggests that of these two components, the credit premium plays the major role (see Box 5).
The yield spreads of 10-year euro area government bonds over German government bonds with (approximately) the same maturity
Table 18 Rating histories since 01/1999 for long-term domestic government debt
Source: Bloomberg.
Moody’s S&P Fitch
Austria Aaa AAA AAABelgium Aa1 AA+ AA+ (since 05/2006)
AA (06/2002 to 05/2006)AA- (until 06/2002)
Germany Aaa AAA AAASpain Aaa (since 12/2001)
Aa2 (until 12/2001)AAA (since 12/2004)AA+ (03/1999 to 12/2004)AA (until 03/1999)
AAA (since 12/2003)AA+ (09/1999 to 12/2003)AA (until 09/1999)
Finland Aaa AAA (since 02/2002)AA+ (09/1999 to 02/2002)AA (until 09/1999)
AAA (since 11/1999)AA+ (until 11/1999)
France Aaa AAA AAAGreece A1 (since 11/2002)
A2 (until 11/2002)A (since 11/2004)A+ (06/2003 to 11/2004)A (03/2001 to 06/2003)A- (until 03/2001)
A (since 12/2004)A+ (10/2003 to 12/2004)A (06/2001 to 10/2003)A- (until 06/2001)
Ireland Aaa AAA (since 10/2001)AA+ (until 10/2001)
AAA
Italy Aa2 (since 05/2002)Aa3 (until 05/2002)
A+ (since 10/2006)AA- (07/2004 to 10/2006)AA (until 07/2004)
AA- (since 10/2006)AA (06/2002 to 10/2006)AA- (until 06/2002)
Netherlands Aaa AAA AAAPortugal Aa2 AA- (since 06/2005)
AA (until 06/2005)AA
3 TRENDS IN PR ICES ,
Y IELDS AND SPREADS

52ECBThe euro bonds and derivatives marketsJune 2007
are depicted in Chart 17. For most countries, spreads decreased between 1999 and 2003 and have been low (below 10 basis points) or, in particular for Finland, even slightly negative since 2003. Notable exceptions are Italy, Greece and Portugal. For these countries, spreads have increased again somewhat in recent years. All three countries were downgraded in 2004 or 2006 (see Table 18), indicating a strong relation between rating and yield spreads. In many cases, spreads had already widened in anticipation of the official announcement of the downgrading.
With respect to liquidity premia, it is particularly interesting to note the trend in yield spreads of the three other countries that have been rated triple-A without interruption since 1999. Yield
spreads of France and the Netherlands stood around 15 basis points between 1999 and 2003. Austrian spreads reached levels above 30 basis points before 2003. These spreads might have been mainly the result of positive liquidity premia. Since 2003, however, yields spreads have been close to zero, indicating that liquidity premia may have largely disappeared. An important reason for the improved liquidity conditions in these countries relates to the introduction of the euro, as this fostered financial integration and thus allowed investors to better diversify bond portfolios across euro area countries. This may have made euro area government bond markets more attractive, thus increasing trading volumes and reducing liquidity premia accordingly.
Chart 17 10-year euro area government bond1) yields: spreads over German government bonds
(in basis points)
Sources: Bloomberg, ECB calculations.1) Bloomberg Generic Government Bonds.
-20-10
0102030405060
-20-100102030405060
FranceBelgiumItalyFinlandGreece
29.01.1999
31.01.2000
31.01.2001
31.01.2002
31.01.2003
30.01.2004
31.01.2005
31.01.2006
Netherlands Spain Austria Ireland Portugal
29.01.1999
31.01.2000
31.01.2001
31.01.2002
31.01.2003
30.01.2004
31.01.2005
31.01.2006
-20
-10
0
10
20
30
40
50
-20
-10
0
10
20
30
40
50
Box 5
DETERMINANTS OF SPREADS IN THE EURO AREA GOVERNMENT BOND MARKET
Since 1999 interest rate spreads of euro area government bond markets vis-à-vis the benchmark have been declining, reaching record low levels in recent years. This has prompted some critics to argue that the euro and the ongoing process of financial integration have eliminated the capacity of financial markets to distinguish the quality of fiscal policies.

53ECB
The euro bonds and derivatives marketsJune 2007
In theory, the spread between two assets with the same cash flow should be zero only if the assets have identical risk-return characteristics. In the context of euro area government bond markets, spreads may arise because of differences in liquidity and default risks.1 Financial integration – by improving the overall efficiency of financial markets – contributes to a more accurate pricing of these risks. Therefore, to the extent that market discipline is exerted via default risk premia, financial integration reinforces any market-driven disciplinary effect, rather than being an obstacle to it.
The available empirical evidence is supportive of the fact that both liquidity and default risks are still priced in the euro area government bond market, and therefore that neither the euro nor the ongoing process of financial integration have eliminated market discipline. Chart A reports the spreads of a selected sample of euro area government bonds, together with the level of short-term interest rates. Two facts emerge. First, countries with lower rating (such as Italy and Greece) pay, on average, higher yields. Second, spreads co-move strongly with the level of short-term interest rates.
The first fact is consistent with risk-averse behaviour. Lower rated government bonds are characterised by a greater risk of default relative to the German benchmark. Risk-averse investors will therefore demand a risk premium to hold these bonds as compensation for the extra default risk they are bearing.2 All else being equal, this implies that lower rated bonds command higher spreads.
As for the second fact, when interest rates are low, investors will have greater incentives to take on risk, in order to improve the expected return on their investment (see Rajan 2006 for a discussion of how this behaviour may result from the structure of incentives of investment managers).3 If investors increasingly take on more liquidity and credit risks in the government bond market when interest rates are low, demand for relatively risky bonds will increase with the result that spreads will be compressed, thus generating a positive correlation between interest rates and spreads.
By using panel regression techniques, Manganelli and Wolswijk (2007)4 decomposed euro area government bond spreads into liquidity and credit premium components. This was accomplished by regressing spreads on the ECB main refinancing operation rate and dummies capturing the sovereign rating:
s MRO D MRO D MROc t c AAA t AA c tAA
t A c tA
t c t, , , ,...= + ⋅ + ⋅ ⋅ + + ⋅ ⋅ +++β γ γ γ ε
where sc,t denotes the spread at time t of a 10-year government bond in country c relative to the German 10-year government bond yield, βc is a country fixed effect coefficient, MROt is the main refinancing operations minimum bid rate at time t, Dc,t
AA+,…,Dc,tA are the rating dummies
for country c at time t.5
1 Other technical factors – such as differences in taxation, or in issuance, clearing and settlement procedures – may also contribute to the determination of spreads.
2 In principle, positive spreads would also be demanded by risk-neutral investors, in order to equalise expected returns in the presence of different risks of default. However, the probabilities of default associated with euro area government bonds are so small that it would not be possible to explain the size of the spreads without assuming risk aversion.
3 Rajan, R. (2006), “Has finance made the world riskier?”, European Financial Management, Vol. 12, No. 4, pp. 499-533.4 Manganelli, S. and G. Wolswijk, “Market discipline, financial integration and fiscal rule: What drives spreads in the euro area
government bond market?”,, ECB Working Paper No. 745.5 The ratings in the sample are AA+, AA, AA-, A+ and A while AAA is used as the reference. The source is Standard & Poor’s.
3 TRENDS IN PR ICES ,
Y IELDS AND SPREADS

54ECBThe euro bonds and derivatives marketsJune 2007
Liquidity risk premia are identified via AAA non-benchmark bonds and are given by L^Pt = γ̂AAA · MROt . Since these bonds have the same credit risk as the German ones, their spreads should contain no credit risk premium. Credit risk premia, on the other hand, are identified via the rating dummies and can be estimated, for a bond rated AA+, as
C^Pt
AA+
= γ̂AA+ Dc,tAA+ · MROt
and similarly for the other ratings. The country fixed effect coefficients βc may capture other technical factors driving spreads, such as differences in taxation regimes or issuance procedures.
Chart B reports the estimated liquidity and credit risk premia associated with the different rating categories. It shows not only that credit risk is still priced, but also that it helps explain a larger portion of the spread than liquidity risk. These results provide evidence that spreads in the euro area government bond market reflect both the level of short-term interest rates, and the quality of national fiscal policies.
Chart A Spreads of 10-year bonds over German benchmark
Chart B Decomposition of time-varying risk premia (basis points)
0
10
20
30
40
50
60
70
Jan.1999
Jan.2000
Jan.2001
Jan.2002
Jan.2003
Jan.2004
Jan.2005
Jan.2006
00.51.01.52.02.53.03.54.04.55.0
FR (AAA)BE (AA+)IT (AA)GR (A)MRO (right-hand scale)
Jan.1999
Jan.2000
Jan.2001
Jan.2002
Jan.2003
Jan.2004
Jan.2005
Jan.2006
Liquidity PremiumCredit Premium (AA)Credit Premium (AA-)Credit Premium (A)
0
10
20
30
40
0
10
20
30
40
Source: Data Stream. Source: Data Stream.
3.2 EURO CORPORATE BOND SPREADS AND CORPORATE CDS SPREADS
Corporate bond spreads reflect the rating as well as the maturity of the bond. Lower rated bonds have higher spreads. Longer term bonds typically display higher spreads, although this relationship does not hold consistently over time. Corporate bond spreads increase in times of pessimistic economic outlook. CDS spreads follow a similar pattern. However, empirical
research suggests that CDS spreads lead corporate bond spreads and not vice versa.
Spreads of corporate bond yields over AAA-rated government bond yields mainly reflect the perceived credit risk that results from an investment in corporate bonds. In particular, they increase when the corporate outlook deteriorates. For example, spreads were high during the years 2001 and 2002 when economic growth was low, but decreased significantly in

55ECB
The euro bonds and derivatives marketsJune 2007
2003 and have been at a relatively low level ever since.
Corporate bond spreads are invariably higher for bonds of lower rated issuers than for bonds of higher rated issuers (see Chart 18). Triple-B rated euro area bonds, for example, reached average spreads above 250 basis points during the economic downturn in 2002, while A-rated bonds remained below 150 basis points and triple-A rated bonds below 65 basis points. Spreads of lower rated corporate bonds also appear to be somewhat more volatile with sharp peaks during times of pessimistic economic outlook and quickly declining spreads when the outlook improves. There are at least two possible explanations for this. Most importantly, the default probabilities of lower rated corporate issuers may be more closely linked to the business cycle than the default probabilities of higher rated corporations. In addition, bond spreads widen when bonds become less liquid. Liquidity is another important factor that influences corporate bond spreads. During recessions, lower rated corporate bonds may suffer and might be traded less actively, thus
reducing their liquidity. This would translate into higher spreads to compensate investors for higher liquidity risks.
Spreads across all rating classes declined between early 2003 and early 2005 when the corporate outlook improved significantly. A relatively sharp increase occurred in spring 2005, marking the impact of the “correlation crisis” on corporate bond spreads (see below in this section). Spreads decreased shortly after, but remained at levels slightly above those of 2004 and early 2005. The increase in spreads in May and early June 2006 reflected market fears about inflation and about an interest rate hike by the US Federal Reserve Bank.
Chart 19 plots the spreads of AA corporate bonds over AAA government bonds with similar time to maturity for various maturity classes. The time to maturity has a clear impact on corporate bond spreads, as longer term bonds are typically characterised by a higher spread. However, Chart 19 illustrates that this relationship did not hold consistently over time. For example, in 2003 spreads of 5 to
Chart 18 Option-adjusted spreads of corporate bonds over AAA government bonds1), denominated in euro(in basis points, by rating class)
Source: Merrill Lynch.1) Spreads are based on the weighted average spreads of the constituents of an index of 7 to 10 year corporate bonds of the respective rating class. Spreads are adjusted for the effect of embedded options (e.g. callable and putable bonds).
0
50
100
150
200
250
300
0
50
100
150
200
250
300
AAAAAABBB
31.01.1999
31.01.2000
31.01.2001
31.01.2002
31.01.2003
31.01.2004
31.01.2005
31.01.2006
Chart 19 Option-adjusted spreads of AA corporate bonds over AAA government bonds1), denominated in euro(in basis points, by maturity class)
Source: Merrill Lynch.1) Spreads are based on the weighted average spreads of the constituents of an index of AA-rated corporate bonds of the respective maturity class. Spreads are adjusted for the effect of embedded options (e.g. callable and putable bonds).
1-3 years3-5 years5-7 years7-10 years
31.01.1999
31.01.2000
31.01.2001
31.01.2002
31.01.2003
31.01.2004
31.01.2005
31.01.2006
0102030405060708090
100
0102030405060708090100
3 TRENDS IN PR ICES ,
Y IELDS AND SPREADS

56ECBThe euro bonds and derivatives marketsJune 2007
7-year bonds were slightly higher than those of 7 to 10-year bonds. This may be somewhat surprising, since, of course, the probability that an issuer will default before a bond matures increases with the length of time to maturity. A possible explanation is that the losses from a temporary failure of a bond issuer to fulfil payment obligations to bond holders may be worse in the case of a bond with a short remaining life because the temporary failure to pay may affect not only coupon payments, but also redemption payments. Another explanation refers to different liquidity premia across maturity classes that may also vary over time. In particular 10-year bonds are traded relatively actively so their liquidity premia may be lower than those of bonds with shorter maturities. Finally, the composition of the yield indices displayed in Chart 19 may play a role. At times when, for example, the 5 to 7-year index is mainly composed of 7-year bonds, which are at the peak of their risk of being downgraded, the index yield may have an upward bias.
As explained in Box 6, CDS spreads seem to lead corporate bond spreads.70 It is therefore also of interest to analyse CDS spread developments. The European benchmark iTraxx CDS index, iTraxx Europe, is shown in Chart 20 for the five-year and ten-year maturities. The iTraxx Europe comprises the 125 most liquid investment grade European corporate reference entities. Each reference entity is equally weighted. A buyer of protection against the iTraxx Europe pays quarterly a premium to the protection seller until the maturity of the contract.71 When a credit event on one reference entity occurs, then the protection seller pays the initial notional amount of the CDS contract (as it was negotiated by the buyer and the seller) divided by 125 to the protection buyer, and the protection buyer delivers to the seller a deliverable obligation issued by the reference entity with a nominal amount equal to the initial notional amount divided by 125. Finally, the notional amount is reduced by the initial notional amount divided by 125.
The composition of the iTraxx list of reference entities is updated every six months (on 20 March and on 20 September) and a new iTraxx CDS starts being traded. For instance, the new iTraxx series launched on 20 March matures on 20 June plus the length of maturity of the contract (currently three, five, seven and ten years). The iTraxx series launched on 20 September matures on 20 December plus the length of maturity. In principle, each iTraxx CDS is traded until maturity, so that positions can be closed at any time via a counter trade. However, the liquidity of an old iTraxx CDS typically reduces significantly when a new series is launched, and traders often try to close positions in an old iTraxx CDS before trading in the new series begins. Chart 20 therefore only shows the spread of each of the six iTraxx series from when the index was introduced in 2004 up to the date of the launch of the respective new series.
Chart 20 illustrates that the spread of the old iTraxx is usually slightly lower than that of the new one on the day the new one is launched. The new series has a longer period to maturity on that day, so the protection it offers is of greater value.72 For the same reason the ten-year iTraxx has a higher spread than the five-year iTraxx.
In the last few months in particular spreads have gone down, indicating that markets currently perceive credit events as relatively unlikely and/or recovery rates as high. An interesting episode, referred to as the “correlation crisis”, occurred in spring 2005, when spreads suddenly increased for a short
70 As explained in Chapter 1, the CDS spread refers to the amount of the regular premium payment that the protection buyer makes to the protection seller of a CDS, in percent of the notional amount of the CDS.
71 The premium is calculated as the notional value of the iTraxx CDS on the day of the premium payment, multiplied by the contractual CDS spread, multiplied by the number of days since the last premium payment divided by 360.
72 However, the composition of the new iTraxx typically does not fully coincide with the composition of the old iTraxx, so the credit quality of the new may be higher than that of the old iTraxx, possible leading to lower spreads for the new index.

57ECB
The euro bonds and derivatives marketsJune 2007
period of time and fell again shortly after, almost back to previous levels.
Prior to May 2005 CDS index tranches on the iTraxx Europe (and the US dollar equivalent in the CDX index family) were growing increasingly popular in what was labelled the correlation market. In a CDS index tranche the protection seller makes compensation payments to the protection buyer only if the losses in the underlying portfolio of reference entities, i.e. the iTraxx Europe, are between an attachment point a and a detachment point d. CDS index tranches with a=0% and d=3% are referred to as equity tranches, those characterised by a=3% and d=6% are called mezzanine tranches and other contracts are called senior and super-senior tranches. Selling protection on equity tranches is particularly attractive for traders who believe that the correlation of losses within the iTraxx portfolio is high, because in that case it is likely that either no losses or heavy losses are incurred. Before May 2005 standard models used in correlation markets suggested relatively high correlations. As a consequence, many players sold equity tranche protection and bought mezzanine tranche protection to “hedge” their position. On 5 May 2005 the rating agency S&P downgraded General Motors and Ford to below investment grade. These rating changes caught markets by surprise,
resulting in exceptional hikes in CDS spreads. Once market participants had adjusted to the idea that the correlation was significantly smaller than thought before the correlation crisis, spreads returned to moderate levels. However, spreads of equity index tranches remained well above the pre-crisis levels, while spreads of mezzanine index tranches fell below their levels before the crisis started.73
Chart 20 iTraxx Europe spreads
(in basis points)
Source: International Index Corporation.Note: Line segments with different colours refer to different iTraxx series: Series 1 to Series 6 (from left to right).
21.06.
21.08.
21.10.
21.12.
21.10.
21.12.
21.02.
21.04.
21.06.
21.08.
21.10.
21.12.
21.02.
21.04.
21.06.
21.08.
0102030405060708090
0102030405060708090
iTraxx Europe 10Y
iTraxx Europe 5Y
2004 2005 2006
73 See Ammar Kherraz, “The May 2005 correlation crisis: Did the models really fail”, 19 June 2006.
Box 6
RECENT DEVELOPMENTS IN THE CDS MARKET AND THE CDS-BOND BASIS
The market for credit default swaps (CDSs) has experienced explosive growth in the past few years (see Section 1.2). The notional value of all outstanding CDSs is now estimated to be three times greater than the cash corporate bond market worldwide. CDSs are credit derivatives which allow credit risks to be separated from the underlying securities and to be traded separately. Due to high liquidity, low transaction costs and the standardisation of contracts, CDSs have established themselves as the easiest way to transfer credit risk.
Theoretically, the CDS spread should equal the corporate bond yield minus the risk-free interest rate to ensure that arbitrage opportunities do not exist. Suppose for example that the CDS spread is lower. In the simplest case, where the bond trades at par, an investor could raise the par value of the bond at the risk-free rate, buy the bond and buy protection against the credit
3 TRENDS IN PR ICES ,
Y IELDS AND SPREADS

58ECBThe euro bonds and derivatives marketsJune 2007
risk of the corporate issuer through a CDS. If no credit event occurs, then the investor receives the bond yield minus the risk-free rate minus the CDS spread (i.e. a positive amount) periodically until maturity of the CDS. At maturity, the investor receives the par value of the bond and repays his loan with it. If a credit event occurs, then the investor again receives the bond yield minus the risk-free rate minus the CDS spread periodically until the credit event. At the credit event, the investor delivers the bond to the protection seller, receives the par value of the bond from the protection seller and repays his loan with it.
An implicit assumption in this example is that characteristics of corporate bond and CDS markets are comparable and that CDS and bond spreads are solely determined by credit risk. However, there are many differences between the two markets. In general, bond yields are also affected by issuance volume and yield volatility, whereas CDSs contain only a negligible illiquidity premium and allow the taking of long or short positions in credit risks without any major restrictions. However, shorting (corporate) bonds is often subject to restrictions. On the other hand, CDSs also include a cheapest to deliver option, whereas bonds might include implicit options. Therefore, CDS and bond spreads are typically not exactly the same (see Chart B). In the following, the evolution of the difference between CDS and bond spreads, dubbed the CDS-bond basis, will be addressed. It will be argued that beyond the general differences between CDS and bond markets, synthetic securitisation has been a key driver of CDS spreads and the CDS-bond basis in recent months. Moreover, an empirical analysis assessing which of both markets is leading the other with respect to price discovery will be presented.
As a result of growing liquidity in the CDS market, synthetic collateralised debt obligations (CDOs), which are funded by CDS contracts as opposed to cash bonds, have grown enormously over the last two years, doubling their issuance volume between 2004 and 2006. CDOs are securities backed by a pool of bonds, loans and other assets. Synthetic CDOs replicate cash flow CDOs using CDSs, thereby providing credit protection without the need to acquire cash assets. The growth in the synthetic CDO market has been fostered by the fact that new investors, rating agencies and investment banks have all embraced this new asset class. Due to historically low default rates, investors now seem comfortable taking on more structured credit risk. The
Chart A CDS and bond spreads1)
Sources: Bloomberg; own calculations.1) Average of selected euro-denominated CDS and bond (asset swap) spreads.
Chart B CDS-bond basis
(in bps)
Sources: Bloomberg; own calculations.
2003 2004 2005 2006-8
-4
0
4
8
12
-4
0
4
8
12
-82003 2004 2005 2006
102030405060708090
100
102030405060708090100
CDS spreadsbond spreads

59ECB
The euro bonds and derivatives marketsJune 2007
various tranches of CDOs disperse risk to investors according to their return objectives and risk tolerances.
Strong issuance of synthetic CDOs is associated with high volumes of credit protection selling, thereby exerting downward pressure on CDS spreads. In recent months CDS spreads have tended to fall more than corporate bond spreads, which might at least partially be a result of market pressure from issuers of structured instruments. As a consequence, the CDS-bond basis has moved into negative territory (see Chart B).
Many investors might exploit this phenomenon by buying corporate bonds and then buying CDSs that allow them to protect themselves against the default risk on the bonds. Since the cost of protection afforded by CDSs is less than the credit risk priced into the bonds, this turns out to be a profitable strategy. Moreover, given the current situation, such negative basis trades might provide additional advantages when credit spreads widen again. If CDSs lead bond markets with respect to the pricing of credit risk, the additional value of the bought protection will exceed the losses on the bonds when credit spreads widen. An investor can make additional profits if he sells his protection and his corporate bonds after CDS spreads have increased, but before corporate bond spreads have increased.
To what extent price discovery takes place in both markets has been empirically analysed in several studies. This assessment is also most important when comparing market efficiency in both markets. Most of these studies have found that CDSs tend to lead bond markets in many credit markets, in particular in the United States.1
The purpose of conducting an assessment is to determine whether CDSs have a price leadership over bonds for euro-denominated credit markets and whether price leadership has changed over time. For this purpose an assessment presented in the Euro Bond Market Study 2004 was updated and extended. The analysis is based on daily quotes of CDS contracts with five-year maturity and the bonds of 22 enterprises from 1 January 2003 to 20 December 2006. To calculate matching bond yields at a constant residual maturity of five years, a weighted interpolation of the asset swap spreads of several bonds of the same issuer was conducted for each point in time. The dataset is divided into two sub-samples, 2003 to 2004 and 2005 to 2006, in order to compare estimation results over time.
For each entity the relationship between the corresponding CDS and bond spreads is estimated by a vector error correction model:
∆ ∆p p p pCDS t CDS t CS t ii
p
CDS t i ii
, , , ,( )= − − + +− −=
−=
∑λ α α β δ1 1 0 1 1 11
11
pp
CS t i tp∑ − +∆ , ε1 (1)
∆ ∆p p p pCS t CDS t CS t ii
p
CDS t i ii
p
, , , ,( )= − − + +− −=
−=
∑λ α α β δ2 1 0 1 1 21
21
∑∑ − +∆pCS t i t, ε2 (2)
1 See R. Blanco, S. Brennan and I.W. March (2005), “An Empirical Analysis of the Dynamic Relationship between Investment-Grade Bonds and Credit Default Swaps”, Journal of Finance 60 (5), L. Norden and M. Weber (2004), “The Comovement of Credit Default Swap, Bond and Stock Markets: An Empirical Analysis”, Center for Financial Studies, Working Paper 2004/20, and H. Zhu (2004), “An Empirical Comparison of Credit Spreads between the Bond Market and the Credit Default Swap Market”, BIS Working Paper 160.
3 TRENDS IN PR ICES ,
Y IELDS AND SPREADS

60ECBThe euro bonds and derivatives marketsJune 2007
where pCDS denotes CDS spreads and pCS bond spreads, respectively. This model assesses the long-term relationship between CDS and bond spreads (the equation in parentheses) as well as short-term dynamics. The coefficients λ1 and λ2 measure the speed at which the CDS and bond spreads move back to equilibrium following a deviation from the long-term relationship between the two markets. A significant negative coefficient λ1 suggests that CDS spreads move later than bond spreads, i.e. follow the bond spreads in order to re-establish the equilibrium relationship between the two markets. Conversely, a significantly positive coefficient λ2 indicates that bond spreads follow CDS spreads to re-establish the equilibrium relationship.
The Granger and Gonzalo measure GG = λ2 / (λ2 – λ1) can be used to better illustrate the contribution of both markets to price discovery. A GG < 0.5 means that price discovery occurs mainly in the bond market, whereas with a GG > 0.5, the CDS market leads the bond market. Our estimates show an average GG of 0.77 for the 2003/2004 sample and a GG of 0.80 for the 2005/2006 sample. Consequently, according to our results, the CDS market is leading the bond market and price leadership of the CDS market slightly advanced between 2003/2004 and 2005/2006.
3.3 BOND BID-ASK SPREADS
Liquidity conditions for euro-denominated bonds have improved in recent years owing to stronger competition between different market makers and different trading platforms, and possibly also as a result of cyclical developments. Average quoted bid-ask spreads of corporate bonds fell from 0.38% of midquotes in 2003 to 0.24% in 2006, while spreads of government bonds declined from about 0.08% in 2003 to 0.05% in 2006. Corporate bonds continue to have higher spreads as the corporate bond markets are relatively fragmented and expose market makers to higher inventory risks.
An important aspect of bond markets is liquidity. A market is liquid if it allows market participants to trade at low trading costs. Kyle (1985)74 identifies three dimensions of liquidity:
– Tightness: a market is tight if buying a portfolio of assets that is small enough to have no impact on prices and selling this portfolio immediately after is not expensive. Tightness in essence refers to low bid-ask spreads.
– Depth: a market is deep if only large buy or sell orders can have an impact on prices. Thus, deep markets can easily absorb new buy and sell orders.
– Resiliency: a market is resilient if market prices reflect fundamental values and, in particular, quickly return to fundamental values after shocks.
This section focuses on the first dimension of liquidity and looks at bid-ask spreads in government and corporate bond markets. The data used in this section have been made available by International Index Company (IIC), the provider of the iTraxx index family for CDSs and the iBoxx index family for bonds. For the calculation of the iBoxx indices, IIC receives daily data on individual iBoxx bonds from a group of major bond market makers. In particular, the market makers report quoted bid and ask prices for each bond. IIC has provided the best quoted bid and the best quoted ask price for each bond and each day since 2003.
The calculation of bid-ask spreads follows Biais, Declerck, Dow, Portes and von Thadden (2006).75 These authors used the IIC data for a very similar analysis, but did not include government bonds. They also excluded 2006
74 A. S. Kyle (1985), “Continuous Auctions and Insider Trading”, Econometrica 53, 1315-1336.
75 B. Biais, F. Declerck, J. Dow, R. Portes and E.-L. von Thadden (2006), “European corporate bond markets: transparency, liquidity, efficiency”, Centre for Economic Policy Research (CEPR).

61ECB
The euro bonds and derivatives marketsJune 2007
data as they finalised their work before the end of 2006. The quoted spread of bond i on day t is defined as Si,t = (Ai,t – Bi,t )/Mi,t, where Ai,t is the best quoted ask price, Bi,t is the best quoted bid price and Mi,t is the midquote, i.e. Mi,t = (Ai,t + Bi,t)/2. Spreads are thus expressed in percent of the midquote.
Chart 21 shows average (unweighted) spreads for corporate and government bonds for the years 2003 to 2006. Bid-ask spreads were much higher for corporate bonds than for government bonds. Spreads of corporate bonds ranged from 0.38% in 2003 to 0.24% in 2006, while spreads of government bonds varied from about 0.08% in 2003 to 0.05% in 2006. An important reason relates to the number and the size of bonds in these markets. There are fewer but much larger government bonds than corporate bonds, so trading activities in government bond markets are concentrated on a relatively low number of ISIN codes. This translates into lower costs for market makers due to economies of scale and greater competition between market makers in government bond markets. Lastly, as corporate bond yields and prices are more volatile than government bond yields, market makers are exposed to higher inventory risks on corporate
bond markets for which they require compensation in the form of higher spreads. Inventory risk is the risk that bond prices will decrease while the market maker holds the bonds in inventory without perfectly hedging price risks.
Chart 21 also shows a strong trend towards lower bid-ask spreads in both market segments. Average spreads of iBoxx bonds have declined consistently. This trend may be based on structural reasons, in particular increasing competition between different market makers and between different trading platforms. Owing to the strong trend towards electronic trading platforms (see Chapter 2), customers can now easily compare quotes of market makers and route orders to different trading platforms at low costs.
However, cyclical effects may also partially explain the trend towards tighter bid-ask spreads of corporate bonds. The economic outlook has been increasingly stable since 2003, implying lower corporate bond yield volatility and thus lower inventory risk for market makers. Higher corporate bond bid-ask
Chart 21 Average quoted iBoxx bond bid-ask spreads1)
(in % of midquote)
Source: International Index Corporation.1) Bid-ask spread defined as the difference between bid price and ask price, reported in percent of the mid point between bid price and ask price (midquote).
government bondscorporate bonds
2003 2004 2005 20060.00
0.05
0.10
0.15
0.20
0.25
0.30
0.35
0.40
0.00
0.05
0.10
0.15
0.20
0.25
0.30
0.35
0.40
Chart 22 Quoted iBoxx corporate bond bid-ask spreads by period to maturity
(in % of midquote)
Source: International Index Corporation.
2003200420052006
0.00
0.20
0.40
0.60
0.80
1.00
1.20
1.40
1.60
0.00
0.20
0.40
0.60
0.80
1.00
1.20
1.40
1.60
below 1 year 1 to 5 years 5 to 15 years above 15 years
3 TRENDS IN PR ICES ,
Y IELDS AND SPREADS
62ECBThe euro bonds and derivatives marketsJune 2007
spreads may therefore return in the wake of deteriorating economic conditions.
Individual bid-ask spreads depend very much on the remaining time to maturity of the bond as Chart 22 indicates for corporate bonds. The reason again relates to the inventory risk of market makers. As prices of bonds with a longer time to maturity are more sensitive to interest rate changes, they are on average more risky. More importantly, for all four maturity classes shown in Chart 22, spreads decreased continuously year-by-year from 2003 to 2006. (The only exception was a slight increase in average spreads between 2005 and 2006 in the segment of bonds with remaining life of more than 15 years.) This confirms that the trend towards lower bid-ask spreads is not driven by a shift towards shorter maturities.

63ECB
The euro bonds and derivatives marketsJune 2007
76 Regulation (EC) No 1606/2002 of the European Parliament and of the Council of 19 July 2002 on the application of international accounting standards.
77 Directive 2003/6/EC of the European Parliament and of the Council of 28 January 2003 on insider dealing and market manipulation.
4 REGULATORY DEVELOPMENTS
Several regulatory initiatives have been started in recent years with the aim of creating a single market in financial services across the EU. These initiatives may have an impact on markets for euro-denominated bonds and related derivatives, although several of the measures focus on equity markets and it needs to be assessed whether their scope should be extended to bond markets as well.
This chapter describes the most important set of rules governing euro debt markets. Most of them are pieces of EU legislation enacted under the auspices of the European Commission’s Financial Services Action Plan (FSAP). In the field of clearing and settlement, however, an industry code of conduct rather than EU legislation has been put in place.
For debt instruments the most important issues relate to financial information available to investors (information concerning the issuer and the debt instrument itself), rules relating to trading and distribution, the framework for investment in debt instruments by institutional investors, rules relating to using debt securities as collateral and rules relating to clearing and settlement. Some of these sets of rules do not yet or only partly cover debt securities or derivatives. Because of their relevance, however, to the issues mentioned and because the scope of these rules might change they are briefly assessed here. The most important measures of relevance for European debt markets that have so far been taken are the following:
PROSPECTUS DIRECTIVE The objective of the Directive 2003/71/EC on prospectuses of 4 November 2003 (the Prospectus Directive) is to harmonise requirements for the drawing up, approval and distribution of the prospectus to be published when securities are offered to the public or admitted to trading on a regulated market within the EU. This Directive is aimed at making it simpler and more cost efficient to
raise capital throughout the EU on the basis of home Member State control (i.e. approval is only needed from the regulatory authority in one Member State). At the same time it also has to be ensured that investors receive clear and comprehensive information wherever they are located in the EU. Together with the IAS Regulation76, the Market Abuse Directive77 and the Transparency Directive mentioned below, the Prospectus Directive forms part of the common financial disclosure regime across the EU for issuers of listed securities. As well as shares, the Prospectus Directive also applies to debt securities. However, it does not cover, for example, government bonds or bonds of public international bodies, or debt securities under a certain issue volume or continuous or repeat issues under certain conditions.
TRANSPARENCY DIRECTIVE The Transparency Directive of 31 December 2004 (Directive 2004/109/EC on the harmonisation of transparency requirements in relation to information about issuers whose securities are admitted to trading on a regulated market) aims to harmonise and to raise the quality of information available to investors on the performance and financial position of companies, and thereby to contribute to better investor protection. In addition to listed shares, it covers listed debt securities, which include bonds and other forms of transferable securitised debt, but it does not cover, for example, convertible bonds or short-term commercial papers. It requires issuers of debt securities to provide half-yearly financial reports. In addition, they also have the obligation to ensure that all holders of debt securities ranking pari passu are given equal treatment and that they have all the facilities and information to exercise their rights, including voting through electronic means. Like other financial services
4 REGULATORY DEVELOPMENTS

64ECBThe euro bonds and derivatives marketsJune 2007
directives, the Transparency Directive provides for home Member State control.
DIRECTIVE ON MARKETS IN FINANCIAL INSTRUMENTS (MIFID) Directive 2004/39/EC on markets in financial instruments of 21 April 2004 (MiFID) is the successor to the former Investment Services Directive and is partly relevant to debt instruments as well. The Directive’s stated objective is to provide for harmonisation needed to offer investors a high level of protection and to allow investment firms to provide services throughout the EU on the basis of home country supervision. A core element of the legislation is to enhance investor protection through the regulation of the business of investment firms, including “best execution” duties, and a comprehensive pre and post-trade transparency regime. The Directive also put in place a common framework of rules between regulated markets, multilateral trading facilities (MTFs) and “systematic internalisers” (i.e. investment firms that allow the internal matching of customers‘ purchase and sale orders). Whilst the Directive foresees that Member States may decide to apply the pre and post-trade transparency requirements to financial instruments other than shares, the Directive itself only covers shares. The question of whether the requirements of the Directive should also be extended to debt instruments and derivatives is still outstanding. The Commission is required to present a report to the European Parliament on this issue by the end of 2007. In addition to the transparency provisions, the MiFID also deals with the authorisation and operating conditions for investment firms, with requirements relating to regulated markets and with issues around co-operation between the competent authorities in different Member States.
DIRECTIVE ON UNDERTAKINGS FOR COLLECTIVE INVESTMENT IN TRANSFERABLE SECURITIES (UCITS) Directive 1985/611/EC of 20 December 1985 on the coordination of laws, regulations and administrative provisions relating to
undertakings for collective investment in transferable securities (the “UCITS Directive”) has been amended several times. It is a crucial piece of legislation for the European fund management industry. It sets out the conditions for the authorisation of investment companies and their obligations, including requirements relating to their investment policies. In particular, it specifies that UCITS-compliant investment companies are allowed to operate in all EU Member States if they received authorisation in one Member State. The Directive is relevant to debt markets to the extent that it sets out the type of derivatives and debt instruments that investment funds can invest in, and their conditions. In the case of OTC derivatives, for instance, the Directive requires that such derivatives are subject to reliable valuation and can be sold at any time at fair value, whilst the counterparties need to be institutions subject to prudential supervision.
COLLATERAL DIRECTIVE Directive 2002/47/EC on financial collateral arrangements of 6 June 2002 (the “Collateral Directive”) has contributed significantly to the cross-border use of securities as collateral, including debt securities. Before the Collateral Directive, the legal landscape within the European Union relating to cross-border use of collateral in wholesale financial markets was very fragmented. With the abolition of different administrative requirements and with the harmonisation of related civil and insolvency law rules the Collateral Directive aimed to create legal certainty by, among other things:
– providing that the only perfection requirement which national law may impose in respect of financial collateral should be that the financial collateral is – directly or indirectly – under the control of the collateral taker (and no other formal act);
– providing clarity and protection with respect to some insolvency provisions that could otherwise invalidate the provision of collateral in certain cases;

65ECB
The euro bonds and derivatives marketsJune 2007
– providing for the right of use of the collateral by the collateral taker;
– clarifying and harmonising the conflict of law rules applicable to the cross-border use of book entry securities as collateral and providing for the lex rei sitae rule; and
– abolishing the various formalities with respect to the enforcement of collateral.
In the course of 2006 and 2007 a revision of the Collateral Directive is taking place. One issue being considered is the extension of the scope of the Collateral Directive to credit claims. It is expected that this step would enhance the cross-border use of credit claims as collateral.
CLEARING AND SETTLEMENT CODE OF CONDUCTThe field of clearing and settlement is somewhat different from other areas relevant to debt and equity markets as instead of a directive or other EU legislation an industry code of conduct was adopted. The code of conduct that was agreed in November 2006 represents industry self-regulation in the field of post-trade clearing and settlement. At present it only covers equities, although the understanding is that over the longer term the extension of the code to debt and derivatives will also be considered. Individual firms can, of course, choose to extend this code of conduct from the beginning to other asset classes as well. It is also expected that more detailed rules on access and interoperability will be implemented. The objective is to create greater price transparency, more competition and lower costs. (See Chapter 2 for more information.)
As it is clear from the above, a lot was achieved regarding the harmonisation of the legal framework relating to euro debt markets. At the same time, it can also be noted that several of the measures are aimed at the equity markets, and an assessment needs to be made as to whether the scope should also be extended to debt and derivatives products. It also remains to be seen to what extent industry self-regulation
can be an answer to certain issues instead of legislation. Given that several of the measures taken within the framework of the FSAP are quite recent, it will be some time before the first conclusions can be drawn about the effectiveness of the rules.
4 REGULATORY DEVELOPMENTS

66ECBThe euro bonds and derivatives marketsJune 2007
OPERATORS OF REGULATED MARKETS IN THE EURO AREA
Austria: Wiener BörseWiener Börse operates two regulated markets (Official Market and Semi-Official Market). Debt securities (government and non-government bonds) are traded on both markets. Trading takes place exclusively electronically.
Belgium: Securities Regulation Fund (Fonds des Rentes)The Securities Regulation Fund operates the regulated off-exchange market for linear bonds, split securities and Treasury certificates of the Belgian State. This market comprises trading through different channels: telephone-based OTC transactions by dealers appointed by the Belgian Treasury, MTS Belgium, EuroMTS, BrokerTec, TradeWeb and BondVision. Electronic platforms account for approximately 40% of trading activities on this regulated off-exchange market.
Belgium: Euronext BrusselsEuronext Brussels, part of Euronext Group, operates two regulated markets (Eurolist and Trading Facility). All securities, including debt securities, are traded exclusively electronically.
Finland: Helsinki Securities ExchangeHelsinki Securities Exchange, part of OMX Group, offers trading in debt securities in four market segments (Main List, I List, NM List and Pre List) which are all regulated markets. Trading takes place exclusively electronically.
France: Euronext ParisEuronext Paris, part of Euronext Group, operates one regulated cash market (Eurolist). All securities, including debt securities, are traded exclusively electronically.
Germany: Deutsche Börse AGDeutsche Börse AG, part of Deutsche Börse Group, operates two regulated markets (Official Market and Regulated Market). Debt securities on these markets are traded mainly on the trading floor of the Frankfurt Stock Exchange.
Germany: Other German securities exchangesOther operators of German regulated markets, including markets for debt securities, are Börse Berlin-Bremen, Börse Düsseldorf, Hanseatische Wertpapierbörse Hamburg, Niedersächsische Börse Hannover, Bayerische Börse and Börse Stuttgart.
Germany: Eurex Frankfurt AGEurex Frankfurt AG, part of Deutsche Börse Group, operates Eurex Bonds, a regulated market for debt securities. Trading takes place exclusively electronically.
Greece: Athens Stock ExchangeThe Athens Stock Exchange operates one regulated market on which debt securities are traded (Securities Market). All securities, including debt securities, are traded exclusively electronically.
Greece: Bank of GreeceThe Bank of Greece operates the HDAT bond market, a regulated market for Greek public debt securities. Trading takes place exclusively electronically.
Ireland: Irish Stock ExchangeThe Irish Stock Exchange operates one regulated market (Official List) on which debt securities are listed. Trading takes place OTC between member firms and has to be reported to the Irish Stock Exchange. (Trading data refer to all trades reported to the Irish Stock Exchange.)
Italy: Borsa ItalianaBorsa Italiana operates two regulated markets on which debt securities (other than convertible bonds) are traded (MOT and EuroMOT). Trading takes place exclusively electronically.
Italy: MTS S.p.A. MTS S.p.A. operates two regulated markets for debt securities (MTS Italy for inter-dealer trading of government bonds, and BondVision for dealer-to-customer trading of government bonds and, since January 2006, corporate bonds via Internet). Trading takes place exclusively electronically.
ANNEX

67ECB
The euro bonds and derivatives marketsJune 2007
Italy: TLX S.p.A. TLX S.p.A. operates one regulated market on which debt securities are traded (TLX). Trading takes place exclusively electronically.
Luxembourg: Bourse de Luxembourg Bourse de Luxembourg operates one regulated market (Official Market). Debt securities account for the bulk of trading activities. Trading takes place exclusively electronically.
Netherlands: Euronext AmsterdamEuronext Amsterdam, part of Euronext Group, operates one regulated cash market (Eurolist). Trades may be executed outside the electronic trading system, but then have to be reported to Euronext Amsterdam. (Trading data refer to all trades executed on or reported to Euronext Amsterdam.)
Portugal: Euronext LisbonEuronext Lisbon, part of Euronext Group, operates one regulated market on which debt securities are traded (Eurolist).
Portugal: MTS Portugal MTS Portugal operates one regulated market (MEDIP). Securities traded on this market are public debt securities. Trading takes place exclusively electronically.
Spain: Four Spanish stock exchanges The four Spanish stock exchanges (Barcelona, Bilbao, Madrid, Valencia) operate regulated markets. All four are part of the BME Group. Debt securities are traded electronically and in an open outcry session.
Spain: Public Debt Book-Entry MarketThe Spanish Public Debt Book-Entry Market is a regulated market that comprises two national electronic trading platforms, SENAF (part of the BME Group) and MTS Spain, and two European electronic trading platforms, Brokertec and EuroMTS.
Spain: AIAF The AIAF, part of the BME Group, is the regulated market for Spanish non-government
debt securities. It is an inter-dealer telephone market in which members negotiate trades bilaterally and report them subsequently for publication.
ANNEX

68ECBThe euro bonds and derivatives marketsJune 2007
GLOSSARY
Alternative trading systems (ATSs): systems that offer means of trading other than established exchanges. They operate electronically (lowering transaction costs) and focus on services that are not always provided by established exchanges (e.g. central limit order book, after hours trading or direct access for institutional investors).
Arbitrage: profiting from differences in prices of different asset portfolios with the same payoffs or of the same asset traded in two or more markets.
Asset-backed securities (ABS): bonds which are generated through a securitisation process by “special purpose vehicles” in order to transform illiquid assets of a certain corporation (the “originator”) into transferable securities. ABSs are issued in several tranches with different credit quality.
Benchmark: value used as a reference or means of comparison for measuring the performance of an investment.
Benchmarking: basing the investment allocation on an industry standard and/or on a fixed securities index.
Bid-ask spread: differential prevailing in the market between the bid price and the offered price.
Bond rating: ranking of a bond’s quality in terms of default risk. Bonds are rated from a high of AAA (highly unlikely to default) to a low of D (issuer already in default).
Central counterparty: an entity which interposes itself as the buyer to every seller and as the seller to every buyer of a specified set of contracts.
Central securities depository (CSD): a facility for holding securities which enables securities transactions to be processed by book entry. Physical securities can be immobilised by the depository or securities may be dematerialised (i.e. so that they exist only as electronic records). In addition to safekeeping, a central securities depository may incorporate comparison, clearing and settlement functions.
Collateralised debt obligation (CDO): a structured debt security backed by a portfolio of assets.
Confirmation/matching: the process of ensuring that the two counterparties agree with regard to the terms of the transaction – price, asset(s), value dates, settlement data, including relevant account numbers – before the payment and transfer orders are sent for settlement.
Corporate bond spread: difference between the interest rate of fixed income instruments issued by corporations and the rates of debt obligations without default risk.
Counterparty: the opposite party in a financial transaction.
Covered bond: bonds secured by a pool of cover assets on the issuer’s balance sheet. The cover assets are typically mortgage loans or loans to the public sector, i.e. assets with a very low credit

69ECB
The euro bonds and derivatives marketsJune 2007
risk. In contrast to asset-backed securities, covered bonds are first and foremost claims of the bond holders against the issuing MFI.
Credit default swap: credit derivative transaction in which the buyer of protection can insure himself against default by a particular issuer for a specific period by paying a periodic premium to the protection seller.
Credit derivative: an OTC derivative designed to transfer credit risk from one party to another.
Credit event: an event that affects the payments on a credit derivative according to the credit derivatives agreement. Typical credit events are bankruptcy, failure to pay or restructuring (of payment obligations) of a reference entity.
Credit linked note (CLN): debt security which is fully paid back only if an agreed credit event has not occurred, otherwise the repayment is reduced by the agreed contingent payment.
Debt security: certificates that are sold by a specific issuer to raise funds and that represent a promise of this issuer to make payments (e.g. interest and redemption payments) to the holders of the certificates according to an ex ante defined scheme. They are typically characterised by a nominal value (or face value) that represents the indebtedness of the issuers and by a maturity date, the date of the last payment to be made by the issuer. The payment scheme refers to the nominal value and the maturity date of the security. In the case of a straight bond, for example, the payment scheme simply specifies that the issuer shall at regular intervals, e.g. once a year, until maturity make a payment equal to a fixed percentage (the nominal interest rate) of the nominal amount and, in addition, shall pay the nominal amount on the maturity date. The scheme may provide for payments that depend on certain conditions, which are typically out of the control of the issuer (inflation indexed securities, floating rate securities, asset-backed securities). The scheme may also leave to a limited extent the timing and amounts of payments to the discretion of the issuer (e.g. callable bonds). Debt securities are generally transferable from one investor to another.
Delivery versus payment (DVP) system: mechanism in an exchange-for-value settlement system which ensures that the final transfer of assets (securities or other financial instruments) occurs if, and only if, the final transfer of another asset (or other assets) occurs.
Disintermediation: the investment in or borrowing from financial markets directly, without the use of financial intermediaries such as banks.
Electronic trading: in broad terms, this refers to any use of electronic means of sending (buy and sell) orders to the market where their automated execution is performed.
EMU: Economic and Monetary Union.
European System of Central Banks (ESCB): the European Central Bank and the national central banks of the EU Member States.
Eurosystem: the European Central Bank and the national central banks of the EU Member States which have adopted the euro.
GLOSSARY

70ECBThe euro bonds and derivatives marketsJune 2007
Financial Services Action Plan (FSAP): elaborated and adopted by the European Commission in 1999, the action plan was endorsed by the Lisbon European Council in March 2000, which set a deadline for its implementation of 2005 at the latest. Its purpose is to improve the single market in financial services in order to reap the full benefits of the euro. The action plan suggests indicative priorities and time-scales for legislative and other measures to tackle three strategic objectives, namely ensuring a single market for wholesale financial services, open and secure retail markets and state-of-the-art prudential supervision rules.
Floating rate instrument: financial instrument for which the coupon is periodically reset relative to a reference index to reflect changes in short or medium-term market interest rates.
Future: agreement to buy or sell a specific amount of a commodity or financial instrument at a particular price on a stipulated future date. Futures are standardised financial instruments traded on a derivatives exchange. The derivatives exchange defines the characteristics of the contracts that can be traded on it. The main characteristics of a futures contract on debt securities are the underlying debt securities (together with their nominal value) and the delivery date. The futures contract stipulates that on the delivery date, the seller of the contract has to deliver the underlying securities in exchange for the contract price. On the delivery date the buyer also has to pay the contract price and receives the underlying securities. If the futures contract is cash settled, then the seller does not deliver the underlying securities, but pays the market value of the underlying securities. The contract price is set when the buyer buys the contract from the seller and results from demand and supply. But it is paid only on the delivery date.
Hedging: strategy to offset investment risk.
iBoxx indices: indices covering investment grade fixed income issues in euro and pound sterling. Prices for all bonds used in the index calculation are provided by a selection of investment banks.
Inflation indexed government bond: debt security issued by the general government, the coupon payments and principal of which are linked to a specific Consumer Price Index.
International Securities Identification Number (ISIN): unique international identification code assigned to securities issued in financial markets.
Investment grade bonds: bonds rated at least BBB.
International central securities depository (ICSD): a central securities depository which clears and settles international securities or cross-border transactions in domestic securities.
Inventory risk: the risk that bond prices will decrease while the market maker holds the bonds in inventory without perfectly hedging price risks.
Liquidity risk: the risk that an investor who wants to sell (buy) a bond cannot do so immediately or can sell (buy) it only at a price below (above) the fair one.
Liquid (market): the three aspects of liquidity are tightness in bid-ask spreads, depth and resiliency. It is characterised by the ability to transact in a market without significantly moving prices.

71ECB
The euro bonds and derivatives marketsJune 2007
Market maker: dealer committed to quoting buy and sell prices within a market (sometimes used to refer to anybody who provides quotes).
Monetary financial institutions (MFIs): financial institutions forming the money-issuing sector of the euro area. They include the ECB, the NCBs of the euro area countries, and credit institutions and money market funds located in the euro area.
Netting: the process of offsetting cash or securities positions. Through netting, the gross positions are reduced. This is particularly true for the cash side, as all cash is fungible, this is not necessarily true for assets.
OECD: Organisation for Economic Cooperation and Development.
Option: an option is a financial instrument which gives the owner the right, but not the obligation, to buy or sell a specific underlying asset (e.g. a bond or a stock) at a predetermined price (the strike or exercise price) on or up to a certain future date (the exercise or maturity date). A call option gives the holder the right to purchase the underlying asset at an agreed exercise price, whereas a put option gives the holder the right to sell it at an agreed exercise price.
OTC (over-the-counter): bilateral transactions not conducted on a formal exchange.
Primary dealer: selected institution authorised to buy and sell original issuance of government securities in direct dealing with the Treasury.
Primary market: market for new issues of securities.
Quote-driven market: usually a decentralised market where a class of participants, possibly market makers, post bid and offer quotes, often indicative, with prices being determined through bilateral negotiation.
Real-time gross settlement (RTGS) system: a settlement system in which processing and settlement take place on an order-by-order basis (without netting) in real time (continuously).
Redemption payments: the return of an investor’s principal in a security, such as a bond.
Reference entities: typical reference entities are corporations and (emerging market) governments.
Regulated markets: markets that fulfil a set of regulatory requirements specified in the Investment Services Directive. For example, they have to be recognised as regulated markets by their home Member State, comply with any regulation issued or approved by the competent regulatory authority and fulfil specific reporting and transparency requirements.
Residential mortgage-backed securities (RMBS): securities backed by a pool of mortgages.
Secondary market: exchanges and over-the-counter markets where securities are bought and sold subsequent to the original issuance, which took place in the primary market.
Securitisation: the process of aggregating similar instruments, such as credit portfolios or catastrophe risks, and marketing them to investors as a negotiable security.
GLOSSARY

72ECBThe euro bonds and derivatives marketsJune 2007
Special purpose vehicle (SPV): an entity set up for the purpose of securitisation, typically by the originator. It issues securities backed by the pool of assets (i.e. asset-backed securities) and transfers the funds raised through selling the securities to the originator as a payment for the asset pool.
Synthetic securitisation: in a synthetic securitisation process, the ownership in the asset pool is not transferred to the SPV, but remains on the balance sheet of the originator. The risks associated with the asset pool are nevertheless transferred to the SPV by means of a credit derivative.
Settlement: completion of a transaction by exchange of instruments and funds.
Synthetic collateralised debt obligation: redistributes the risk inherent in a portfolio of CDSs across a number of tranches that have a strict seniority ordering.
True sale: in a traditional “true sale” securitisation process, the originator transfers the ownership of a pool of assets to another entity, the special purpose vehicle (SPV).

73ECB
The euro bonds and derivatives marketsJune 2007
LIST OF DRAFTERS
Martin Beck (Deutsche Bundesbank)
Dirk Bullmann (ECB)
Giampiero Carlá (ECB)
Otto Heinz (ECB)
Jung-Duk Lichtenberger (ECB)
Simone Manganelli (ECB)
Thibaut Moyer (Banque de France)
Chryssa Papathanassiou (ECB)
Marc Rubens (National Bank of Belgium)
Jens Tapking (ECB)
L I ST OF DRAFTERS

THE EURO BONDS AND DER IVAT IVES MARKETS
JUNE 2007
EURO
PEAN
CEN
TRAL
BAN
KTH
E EU
RO B
ON
DS
AND
DER
IVAT
IVE
MAR
KET
S JU
NE
2007