The International Migration of Healthcare...
27
The International Migration of Healthcare Professionals and the Supply of Educated Individuals Left Behind 1 Paolo Abarcar 2 Mathematica Policy Research Caroline Theoharides 3 Amherst College This draft: February 17, 2017 The migration of skilled professionals, particularly of healthcare workers, is often cited as a key concern for many developing countries because of its potential to deplete the number of skilled workers from the local economy. In contrast, the recruitment abroad of skilled migrants might increase the returns to education, leading to human capital formation. We estimate the effect of skilled migration on educational investment in the country of origin by exploiting the aggressive nurse recruitment policies and subsequent visa restrictions employed by the United States in the 2000s. Using a new administrative dataset combining the universe of permanent migrant departures from the Philippines with the universe of institution-level tertiary enrollment and graduation, we show that enrollment and graduation in nursing programs increased in response to demand from abroad for nurses. The increase in nursing enrollment and graduation during the period was much larger than the increase in nurse migration. However, similar sized decreases in enrollment in other skilled fields suggest that while migration affected field of study and increased the supply of health professionals, it did not spur new students to obtain tertiary education. JEL: O15, F22, J61 1 We thank the Commission on Filipinos Overseas (CFO) and the Philippine Commission on Higher Education (CHED) for access to the data: Secretary Imelda Nicolas, Rodrigo V. Garcia, and Allan Dennis T. Pulma from the CFO; Gregorio Atienza, Aiza Dilidili, and Napoleon K. Juanillo from CHED were invaluable in compiling these databases. We are especially grateful to Dean Yang, Jeffrey Smith, Achyuta Adhvaryhu, and Brian Jacob for their comments and helpful advice. 2 1100 1st Street NE, Washington, DC 20002. Email: [email protected]. 3 Converse Hall, Amherst, MA 01002. Email: [email protected].
-
Upload
vuongkhuong -
Category
Documents
-
view
221 -
download
3
Transcript of The International Migration of Healthcare...

The International Migration of Healthcare Professionals and the Supply of Educated Individuals Left Behind1
Paolo Abarcar2 Mathematica Policy Research
Caroline Theoharides3
Amherst College
This draft: February 17, 2017
The migration of skilled professionals, particularly of healthcare workers, is often cited as a key concern for many developing countries because of its potential to deplete the number of skilled workers from the local economy. In contrast, the recruitment abroad of skilled migrants might increase the returns to education, leading to human capital formation. We estimate the effect of skilled migration on educational investment in the country of origin by exploiting the aggressive nurse recruitment policies and subsequent visa restrictions employed by the United States in the 2000s. Using a new administrative dataset combining the universe of permanent migrant departures from the Philippines with the universe of institution-level tertiary enrollment and graduation, we show that enrollment and graduation in nursing programs increased in response to demand from abroad for nurses. The increase in nursing enrollment and graduation during the period was much larger than the increase in nurse migration. However, similar sized decreases in enrollment in other skilled fields suggest that while migration affected field of study and increased the supply of health professionals, it did not spur new students to obtain tertiary education. JEL: O15, F22, J61
1 We thank the Commission on Filipinos Overseas (CFO) and the Philippine Commission on Higher Education (CHED) for access to the data: Secretary Imelda Nicolas, Rodrigo V. Garcia, and Allan Dennis T. Pulma from the CFO; Gregorio Atienza, Aiza Dilidili, and Napoleon K. Juanillo from CHED were invaluable in compiling these databases. We are especially grateful to Dean Yang, Jeffrey Smith, Achyuta Adhvaryhu, and Brian Jacob for their comments and helpful advice. 2 1100 1st Street NE, Washington, DC 20002. Email: [email protected]. 3 Converse Hall, Amherst, MA 01002. Email: [email protected].

I. Introduction While international labor migration provides many benefits to developing countries (Clemens, 2011; Yang, 2008), many consider the migration of skilled professionals to be a chief concern. Policymakers worry that as receiving countries recruit workers from abroad, origin countries lose talent that their education systems paid to train. At the center of these concerns is the migration of healthcare professionals. As rich countries increasingly address workforce shortages by recruiting doctors and nurses from abroad, a popular view is that this hurts poor countries by causing a scarcity of healthcare professionals, leading to poor health outcomes in these places. The consequences are deemed so grave that in 2012, members of the WHO adopted a nonbinding Global Code of Practice in the International Recruitment of Health Personnel discouraging active recruitment from developing countries (Clemens 2013). Destination countries have responded by banning recruitment from certain countries. In this paper, we identify the effect of nurse migration from the Philippines on tertiary enrollment and degree receipt by exploiting changes in demand for nurses due to United States migration policy. In 2000, the US dramatically expanded the availability of visas for nurse migrants and their families, and then in 2007, imposed restrictions on the number of visas for foreign nurses. We exploit the fact that not all geographic areas of the Philippines were affected equally by this change. Due to the importance of migrant networks as a determinant of international migration (Munshi, 2003; Theoharides, 2016), the changes in demand for nurse migrants had a larger effect on provinces that specialized in sending nurses abroad. We first employ a simple difference-in-difference methodology and then use an event study methodology to explicitly measure the effect of the policy changes on enrollment and graduation in the Philippines. We utilize an original administrative dataset on all permanent migrant departures from the Philippines from 1990 to 2014 to calculate migration demand. We combine this dataset with administrative information on all tertiary level enrollment and graduation in the country. We find that tertiary enrollment and graduation in nursing programs increased in response to greater opportunities to work abroad, during the period when visas were made easily available to nurses, while enrollment and graduation in other tertiary programs declined. The effects appear to offset each other, suggesting that individuals who previously would have enrolled in other degree programs chose to enroll in nursing in response to increased demand. In addition, graduation from nursing programs responded with a lag, consistent with the investment in education taking several years. The magnitude of the increase in nursing degrees was such that not all of the additional nurses migrated. In response to reductions in availability of visas for nurses, nursing enrollment and graduation also declined. Our paper makes several of contributions to both the academic and policy literatures on migration. First, our results are consistent with models of human capital formation where high prospective returns to skill in foreign countries lead to skill acquisition at home (Stark et al. 1997 and Mountford 1997). Recent empirical work finds support for such models in countries like Nepal and Fiji. Shrestha (2016), for instance, argues that the recruitment of Nepalese men into the British Army raised educational attainment. Chand and Clemens (2008) exploit political shocks in Fiji to demonstrate that mass departures by Indo-Fijians subsequently led this group to

invest more heavily into education. Our results contribute to the literature on brain drain by testing such models using a more prominent flow of migrants (healthcare workers) from the Philippines, one of the world’s largest senders of migrants. Docquier and Marfouk (2006) point out that research examining such a flow is critical since the supply of tertiary schooling may not respond as easily to the demand for education in a specialized but large occupation. Second, our results add to the broader academic literature on the effects of migration on origin countries. In particular, our results show that increases in demand for migrants lead changes in educational investment, similar to the findings of Dinkelman and Mariotti (2016) in the context of low-skilled African migration and Theoharides (2016) in the context of temporary migration and secondary school enrollment. By examining the effects of nurse migration on tertiary enrollment, we provide evidence for the brain drain and brain gain debate in the context in which it is most commonly debated. Finally, in terms of policy, our results imply that, despite concerns of brain drain, the number of nurses in the Philippines increased as a result of the policy change. The results provide evidence against the usual refrain about the brain drain of medical professionals: that when these workers leave, their domestic numbers decrease, and it is difficult to replace them. We demonstrate why it might not be useful to assume that the stock of healthcare workers in migrant-sending countries is fixed. At least in this case, the supply of medical professionals responded to demand from employers abroad. Our findings lend support for well-designed partnerships between sending and receiving countries that can in principle facilitate both human capital accumulation and migration. The remainder of the paper is outlined as follows. Section II discusses background on nurse migration from the Philippines and discusses changes in US migration policy that led to increased demand for Filipino nurses. Section III presents the data. Section IV outlines the empirical strategy, while Section V presents the results. Section VI concludes. II. Background A. The Philippines and Nurse Migration With over 11% of its population living abroad, the Philippines is one of the largest migrant-sending countries in the world and also the world’s largest supplier of nurses. Filipino nurses make up the single largest group of foreign-born nurses serving in OECD countries (OECD, 2007). Around 3,000 to 8,000 nurses leave the country each year on permanent visas. If anywhere, the country is where we should expect to find a shortage of nurses. Indeed, Filipino policymakers expected as much when nurse migration suddenly picked up in the early 2000s. “Sadly, this is no longer brain drain, but more appropriately, brain hemorrhage of our nurses,” remarked the former minister of health, Dr. Jaime Galvez-Tan. “Very soon, the Philippines will be bled dry of nurses.” (Asia Times, 2003).
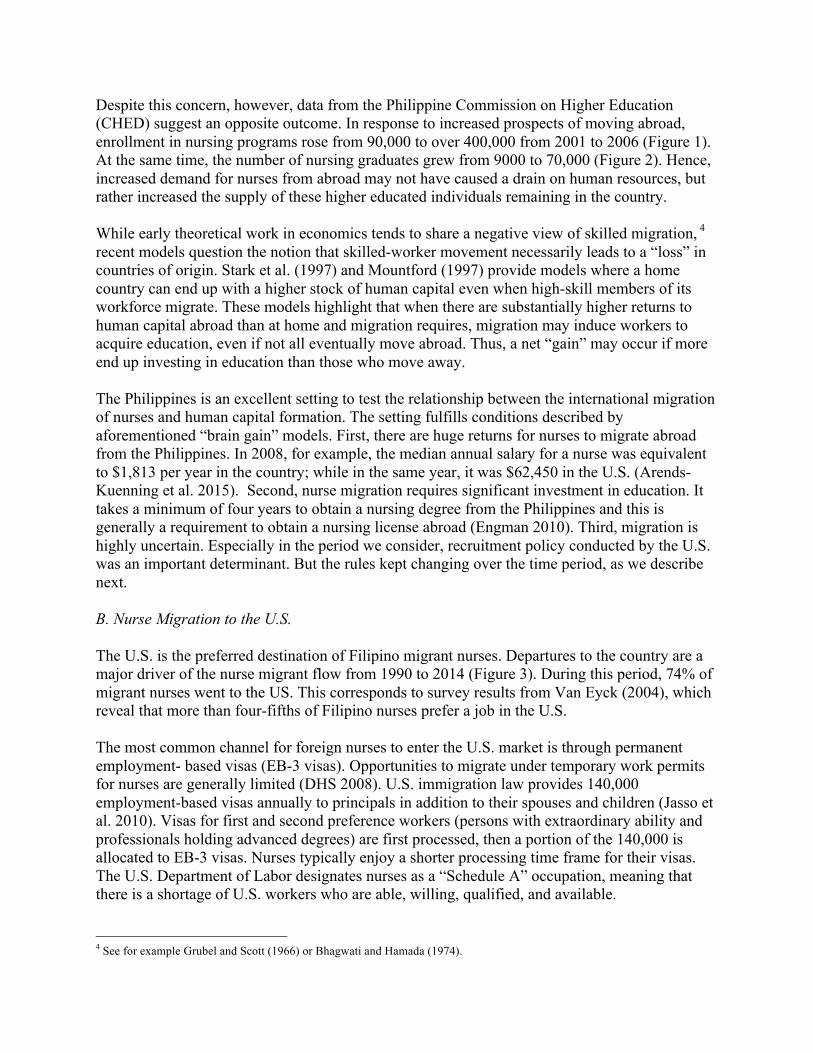
Despite this concern, however, data from the Philippine Commission on Higher Education (CHED) suggest an opposite outcome. In response to increased prospects of moving abroad, enrollment in nursing programs rose from 90,000 to over 400,000 from 2001 to 2006 (Figure 1). At the same time, the number of nursing graduates grew from 9000 to 70,000 (Figure 2). Hence, increased demand for nurses from abroad may not have caused a drain on human resources, but rather increased the supply of these higher educated individuals remaining in the country. While early theoretical work in economics tends to share a negative view of skilled migration, 4 recent models question the notion that skilled-worker movement necessarily leads to a “loss” in countries of origin. Stark et al. (1997) and Mountford (1997) provide models where a home country can end up with a higher stock of human capital even when high-skill members of its workforce migrate. These models highlight that when there are substantially higher returns to human capital abroad than at home and migration requires, migration may induce workers to acquire education, even if not all eventually move abroad. Thus, a net “gain” may occur if more end up investing in education than those who move away. The Philippines is an excellent setting to test the relationship between the international migration of nurses and human capital formation. The setting fulfills conditions described by aforementioned “brain gain” models. First, there are huge returns for nurses to migrate abroad from the Philippines. In 2008, for example, the median annual salary for a nurse was equivalent to $1,813 per year in the country; while in the same year, it was $62,450 in the U.S. (Arends-Kuenning et al. 2015). Second, nurse migration requires significant investment in education. It takes a minimum of four years to obtain a nursing degree from the Philippines and this is generally a requirement to obtain a nursing license abroad (Engman 2010). Third, migration is highly uncertain. Especially in the period we consider, recruitment policy conducted by the U.S. was an important determinant. But the rules kept changing over the time period, as we describe next. B. Nurse Migration to the U.S. The U.S. is the preferred destination of Filipino migrant nurses. Departures to the country are a major driver of the nurse migrant flow from 1990 to 2014 (Figure 3). During this period, 74% of migrant nurses went to the US. This corresponds to survey results from Van Eyck (2004), which reveal that more than four-fifths of Filipino nurses prefer a job in the U.S. The most common channel for foreign nurses to enter the U.S. market is through permanent employment- based visas (EB-3 visas). Opportunities to migrate under temporary work permits for nurses are generally limited (DHS 2008). U.S. immigration law provides 140,000 employment-based visas annually to principals in addition to their spouses and children (Jasso et al. 2010). Visas for first and second preference workers (persons with extraordinary ability and professionals holding advanced degrees) are first processed, then a portion of the 140,000 is allocated to EB-3 visas. Nurses typically enjoy a shorter processing time frame for their visas. The U.S. Department of Labor designates nurses as a “Schedule A” occupation, meaning that there is a shortage of U.S. workers who are able, willing, qualified, and available. 4 See for example Grubel and Scott (1966) or Bhagwati and Hamada (1974).

It is by no means, however, easy to migrate to the U.S. as a nurse from the Philippines. First, visas are usually unavailable. Immigration rules stipulate that individuals born in any given country may not be allocated more than 7 percent of the total number of immigrant visas per fiscal year. Since visa applications from the Philippines far exceed the 7 percent per-country limit, waiting times span years. Second, those wishing to migrate as a nurse must pass a battery of tests (Aiken 2007). All nurses take the National Council Licensure Examination (NCLEX) to practice as a registered nurse in the U.S. Applicants need to demonstrate that their education was at the postsecondary level. Moreover, foreign trained nurses must pass an English Proficiency Test (TOEFL). Several changes in U.S. immigration policy affected nurse migration from the Philippines in the 2000s. The American Competiveness in the 21st Century Act of 2000 (AC21) modified law to loosen per country limits in visa allocations. AC21 excused per country limits when part of the 140,000 employment-based visas would go unused. This immediately benefitted oversubscribed countries like China, Mexico, India, and the Philippines. The rule change cut down on waiting times and allowed visas to be issued immediately to individuals from these places. Further, AC21 recaptured 130,137 visas, which had been unused in 1999–2000, and made them available for employment-based visa applications (Jasso et al. 2010). In addition, in 2005 the Real ID Act made 50,000 unused visas from 2001-2004 available, allocating them to Schedule A occupations. The U.S. also decided to immediately issue permanent visas to children and spouses of nurses (Engman 2010). The combination of these policies led to the rise of nurse migration from the Philippines from 2000 to 2006 in Figure 3. It was an exceptional period, where there were minimal wait times for a visa. Then, in February 2007, the period of easy migration of nurses to the U.S. suddenly came to an end. Processing of Schedule A visas stopped. Unused visa numbers were completely exhausted. Visa Bulletins from the USCIS stopped listing Schedule A as a separate visa category. As a result, in 2006, there were 5,290 employer-sponsored visas for nurses that were processed from the Philippines; in 2007, this dropped to 815 and has continued to be that low.5 Other migration streams to the U.S. were unaffected by these changes. We exploit these sudden changes in visa availability for nurses in our analysis to look at the effect of visa expansion and restriction on migration and education. We argue that the changes in available visas were plausibly exogenous. That chances to migrate to the U.S. would increase and then abruptly drop in February 2007 would have been difficult to predict for individuals in the Philippines. Because of the complexity of US immigration rules, it would have been difficult for immigration officers, let alone individuals in the Philippines, to predict the decline in visa availability (Jasso et al., 2010). As the USCIS Ombudsman (2007) reported to Congress in an annual report: “Exactly how many employment-based green card applications does the agency have pending? USCIS still cannot answer that question today with certainty.” III. Data
5 The recent uptick in nurse migration from 2009 onwards in Figure 3 is due to Canada.

We utilize a new and unique administrative data on all permanent migrant departures from the Philippines from 1990 to 2014. The data are from the Commission on Filipinos Overseas (CFO), a government agency responsible for registering emigrants and strengthening the ties of the diaspora with the homeland. All emigrants who plan to move abroad on a permanent immigrant visa are required to register with the CFO before leaving. The CFO data contain rich information on every individual who has left for abroad on a permanent visa. The data include demographic information as well as information on place of birth, usual address, country of destination, education, course of study, and profession, among other things. To our knowledge, this is the first dataset of its kind, and as a result, we are able to accurately measure skilled migration and track the outflow of all nurses. The use of origin-country administrative data to analyze high-skill migration already represents an improvement in understanding the effect of skilled migration. Past studies typically rely on changes in the stock of educated individuals living abroad to estimate skilled migration from a country. Such calculations may overstate “brain drain” from a country if many individuals acquire education after they migrate. Ozden and Philipps (2015), for example, show that almost half of African-born doctors were trained outside of their birth country. Our administrative data allows us to accurately measure the number of skilled professionals leaving each Philippine province annually. We calculate province-level migration rates for nurses and the rest of the migrant population using the CFO dataset. To do this, we aggregate departures in each province-year and divide by the working aged (18-60) population in each province. We define nurses as those who have obtained a nursing degree or whose usual work is as a professional nurse. Panel 1 of Table 1 presents summary statistics. The average province-level migration rate is 0.076% while the nurse migration rate is 0.005% of the working aged population. We obtained administrative data on tertiary enrollment and graduation from 1990 to 2013 from the Commission on Higher Education (CHED). The data include school-level information on the number of enrollees and graduates in an academic year, as well as numbers disaggregated by program of study. Thus, to complement our data on migration, we have information on all enrollments and graduations in the various disciplines around the country. We aggregate numbers at the province-level and calculate rates of enrollment and graduation for nurses and other disciplines by dividing by the college-aged population (18-21) in each province. Panels B and C in Table 1 present the results. The average province-level enrollment rate is 20.9%, while the rate of enrollment in nursing programs represent 1.5% of the college-aged population. The average total and nurse graduation rates in an academic year are 3.6% and 0.36% of the province population, respectively. IV. Empirical Strategy To get a sense of how nurse migration in general is correlated with education over time, we first estimate a simple difference in difference framework, exploiting geographic variation in nurse migration rates from 1990 to 2013. We estimate the following basic regression equation:

!!" = !! + !!!"#$%&'!"!! + !! + !! + !!!"#$! + !!" (1)
where !!" is the enrollment or graduation rate for a nursing degree in province ! in year ! in the Philippines. !"#$%&'!"!! is the fraction of nurse migrants out of the total working age population who departed for abroad from province ! in year ! − 1.6 Province fixed effects, !!, and year fixed effects, !!, account for province-specific and year-specific omitted variables, respectively. !!!"#$! are province-specific linear times trends, which remove province-specific unobservables that are trending linearly over time. We estimate equation (1) using OLS and cluster standard errors at the province level. The coefficient of interest is !! which gives the effect of nurse migration on human capital accumulation, given a number of identifying assumptions. Two primary issues challenge the interpretation of !! as a causal effect: reverse causation and omitted variables bias. First, high provincial enrollment into nursing may cause nurse migration, rather than the other way around. For example, firms abroad might recruit workers from provinces that produce a large number of nurses. Second, province-year specific omitted variables and province-specific omitted variables that are trending non-linearly could lead to bias. For instance, increasing economic growth in a given province may lead to increases in education and outmigration, thus causing !! to be biased upward. To address these concerns, we next exploit the exogenous policy changes that occurred in 2000 and 2007 that expanded and restricted nurse migration to the U.S. respectively. As described earlier, the policy changes were sudden and severely expanded and then limited the option of many Filipino nurses and their families to migrate to the U.S. Provincial nursing enrollments in the Philippines could not have plausibly caused this restriction. Hence, this strategy assuages concerns about reverse causation that are present in the estimation of equation (1). We exploit the idea that provinces that usually have a larger flow of nurse migrants to the U.S. should be disproportionally affected by the rule change compared to provinces that usually have a smaller flow of nurse migrants. This point will become more apparent in our analysis but is justified by the importance of historical flows and migrant networks as determinants of international migration (Munshi 2003; Theoharides 2016). We identify a province as a high migration province if it had an above median nurse migration rate to the U.S. in a base year, 1990. Table 2 lists the top 20 provinces using this measure. Note that the inclusion of several provinces in this list is unsurprising, given the history of Filipino migration to the U.S. Ilocos Sur, Ilocos Norte, La Union, Pangasinan are places where mass emigration of Filipinos to the U.S. first took place as a result of recruitment from Hawaiian sugar plantations in the early 1900s. Zambales, Pampanga, and Tarlac are where the U.S. established military bases at the end of World War II. These places are traditional migrant sending provinces to the U.S.7 6 Since the school year starts in June in the Philippines, the relevant migration rate to consider in making decisions to enroll in school is the past year’s migration rate (t-1). 7 For a fuller discussion of the history of these areas with respect to the U.S, see Scalabrini Migration Center (2011).
Formally, we estimate the following “event-study” equation:
!!" = !!!!!"""
!"#ℎ!,!""#!!! + !! + !! + !!" (2)
where !!! is a binary variable equal to one if the year of observation t equals the specific year, τ, and zero otherwise. !!! is interacted with !"#ℎ!,! an indicator for high migration province. We omit the interaction term in 1999 (the year prior to the first policy change) in order to identify the model. All other variables are defined as in equation 1. Standard errors are clustered at the province level. We estimate the effect of the policy changes on migration rates and educational outcomes, !!". The !! thus capture the precise timing of differential changes in outcomes for high nurse migration provinces relative to the omitted year, 1999. The !! after 1999 provide the effect of visa expansion on enrollment and graduation, while the !! after 2006 provide the effect of visa restriction. We estimate equation (2) from 1992 to 2013. The key identifying assumption of the model is that, in the absence of policy changes, areas with high nurse migration to the U.S. in the base year should not have experienced different trends in outcomes in 2000 and later. The !! prior to 1999 provide evidence on whether this assumption holds. Prior to 1999, it should be true that high migration provinces were not experiencing different trends in outcomes relative to low migration areas, for the equation to estimate the effect of visa expansion and restriction. Finally, we estimate a restricted version of the event-study equation, to pool the effects of the policy changes in the years after: !!" = !! + !!(!"#$2000 ∗ !"#ℎ!,!""#) + !!(!"#$2007 ∗ !"#ℎ!,!""#) + !! + !! + !!" (3)
where !"#$2000 is a dummy variable equal to one in the year 2000 and after, while !"#$2007 is a dummy variable equal to one for 2007 and later. Prior differences between high nursing provinces and low nursing provinces are removed by the inclusion of province fixed effects. Thus, !! estimates the pooled effect of expanding the availability of nursing visas to the US in 2000 for provinces with high baseline flows of nurse migrants, while !! provides the pooled effect of suddenly restricting the flow of nurse migrants in the U.S in 2007. An advantage of this approach is that we are be able to summarize the effects of the policy changes in the years after they occurred.
Once again, the identifying assumptions for !! and !! to provide causal estimates of the effect of changes in demand for nurses is that in the absence of the policy changes, trends in outcomes in provinces with high nurse migration rates in the base year (“treatment provinces”) should follow the same trend as outcomes in other provinces (“control provinces”) in the absence of the policy changes. In our analysis, we formally test this parallel trends assumption and show that there is no differential trending, suggesting that the identifying assumption should be valid. V. Results A. Simple Difference-in-Difference Results

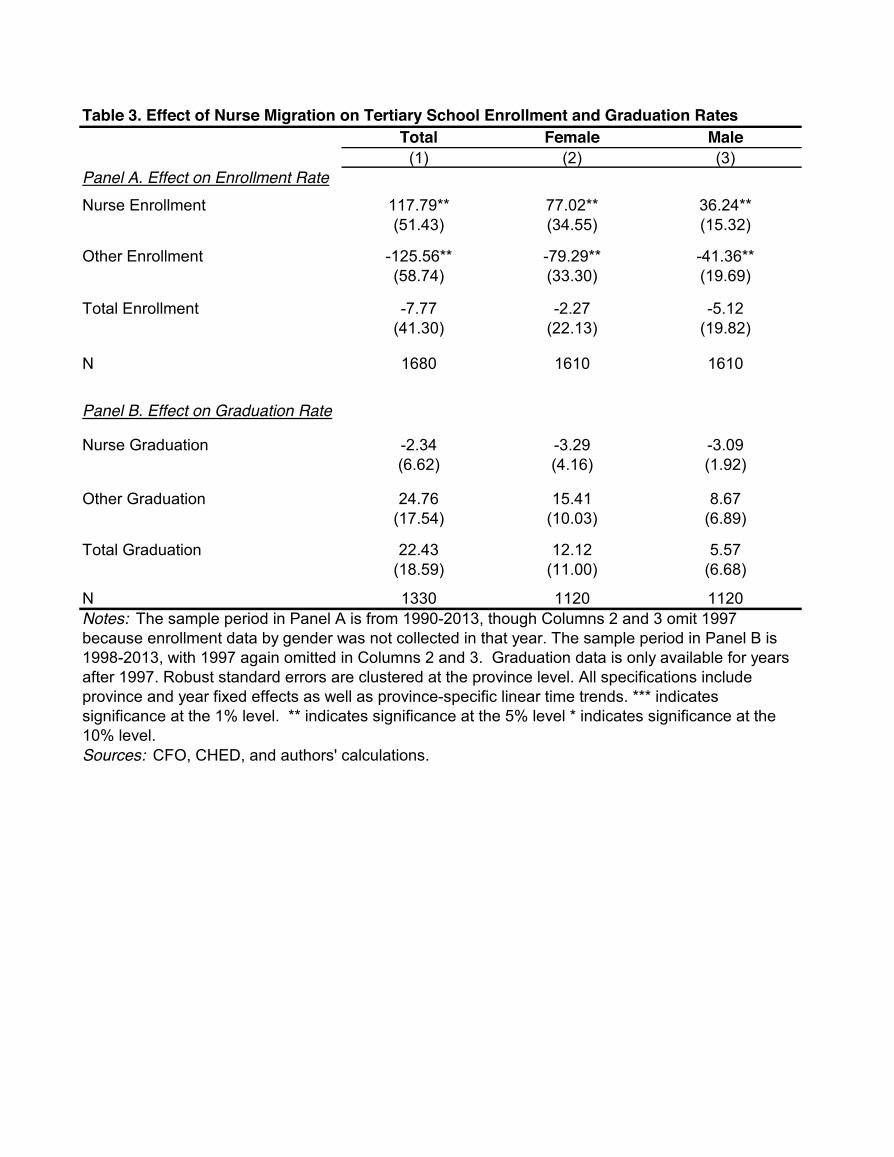
To determine the effect of nurse migration on tertiary school enrollment and graduation rates in general, we first estimate a basic difference-in-difference model as outlined in equation (1). In Table 3, Panel A we find a positive and statistically significant relationship between nurse migration and enrollment in nursing programs. A one percentage point increase in the nurse migration rate is associated with 117.8 percentage point increase in nurse enrollment. To interpret the results, it is important to consider the magnitude of a 1 percentage point increase in the nurse migration rate. Recall from Table 1 that the average nurse migration rate across provinces is quite low (0.005%). As a result, an increase of one percentage point is unrealistic. To scale the results, we calculated the average year-to-year percentage point change in nurse migration over our sample (0.0009 percentage points). Thus, considering a 0.0009 percentage points increase in migration, enrollment increases by 0.11 percentage points (=0.0009*117.8). This represents a 7.2% increase in enrollment out of an average enrollment of 1.52% in nursing programs. This positive and statistically significant effect holds for both females and males (columns 2 and 3), and female and male enrollment in nursing programs increased by 6.1% and 7.4% respectively. The increase in enrollment in nursing programs could be driven either by new enrollment or by students shifting disciplines in tertiary school. The latter does not represent human capital accumulation so it is important to verify whether additional enrollment arises simply from students changing disciplines. One way to empirically test for this is to look at whether nurse migration decreases enrollment in other disciplines. Row 2 of Table 3 shows that in response to an average year-to-year change in migration, other tertiary enrollment decreased by 0.11 percentage points (0.58%). The magnitude of this result is almost identical to the increase in nursing enrollment. This suggests that the increases in nursing enrollment were directly offset by decreases in other disciplines, and that in response to increases in demand for nurses, tertiary students in the Philippines are choosing alternative majors. Consistent with this conclusion, the effect of nurse migration on total enrollment is small in magnitude and is not statistically significantly different from zero. Panel B in Table 3 shows that nurse migration had no effect on graduation rates in nursing, other disciplines, or overall. This may, however, simply reflect the importance of lags in the effect of nurse migration on tertiary graduation. After all, graduating from college takes around 4 years. To further investigate this, we present results regressing nurse enrollment and graduation rates on 4 years of lags of the nurse migration rate in Table 4. We find that nurse migration is associated with increased enrollment immediately, though the effects on enrollment get larger over time. Increased nurse migration also has positive effects on graduation from nursing programs but mostly 3 to 4 years down the line. This is consistent with education being a long investment, and those students who enroll immediately in response to increased nurse migration actually graduate 4 years later. Subject to the caveats of reverse causation and omitted variable bias, these results provide preliminary evidence about the relationship between international migration and human capital formation. In the next section, we focus particularly on the events in 2000 and 2007 to better

identify the effect of migration on human capital investment. B. Event Study Results To address concerns about endogeneity in our previous results, we exploit two policy changes that first expanded visa availability for nurses to the U.S. and then dramatically restricted these visas. To establish the first stage of the policy, we first estimate the effect of the policies on the migration rate of nurses to the U.S. If there is not an effect on US nurse migration, we would not expect nursing enrollment and graduation to change in response. Figure 4 presents estimates of !! in equation (2) for nurse migration to the U.S. For presentation purposes, we multiply the migration rate by 100 so that the estimated effects are in percentage points. We find that while nurse migration to the U.S. does not display a statistically significant trend in years prior to 1999, nurse migration starts to increase in high migration provinces relative to other provinces in 2000, right after visas were made available. Consequently, in 2007, the nurse migration rate suddenly drops at the same time visas run out. These results are consistent with the story that changes in migration policy did affect the provinces specializing in sending migrant nurses to the U.S. Meanwhile, we find that enrollment rates in these provinces responded positively and negatively following the policy shocks in 2000 and 2007, respectively. In Figure 4, we present estimates of !! for enrollment in nursing. All estimates of !! for 1998 or earlier are close to zero, implying that high migration provinces were not already experiencing a trend in enrollment. However, estimates of !! start becoming positive in 2000. The effect peaks in 2006 then starts to decrease gradually to zero after, at the onset of visa restrictions. At the same time, we find some evidence that changes in enrollment in nursing were counteracted by changes in enrollment in other disciplines. Estimates of !! for other enrollment show that high nurse migration provinces experienced a drop in other enrollment when nursing enrollment picked up in 2000 (although it does seem that high nursing migration provinces usually have relatively lower other enrollment rates to begin with). Similar to our results in the difference-in-difference analysis, this suggests that while migration increased the supply of nurses, it did so by changing the fields of study of new students. The corresponding event study analysis for graduation rates are presented in Figure 5 and reflect the pattern of effects found for enrollment. We find that there were large increases in nurse graduation after international demand for nurses increased in 2000 for high migration provinces, but the effect manifests several years after visas were made available, consistent with the time it takes to finish tertiary school. Nurse graduations decreased as well after 2007 with a lag. At the same time, we fail to find any statistically significant effects for other graduations during the period. While the event study model is helpful in understanding the timing of effects, we estimate a restricted version in order to quantify the magnitude of effects arising from the policy changes. Again, the idea is to estimate the pooled effect of expanding the availability of nursing visas to the US in 2000 for the years 2000 to 2006 and the pooled effect of suddenly restricting the flow

of nurse migrants in 2007 for the years after. Correspondingly, we estimate !! and !! of equation (3) and display results in Table 5. Column 1 of Table 5 shows that in response to the expansion of nursing visas, there was a statistically significant increase in nurse migration to the U.S. Specifically, high nurse migration provinces experienced a 0.0042 percentage points increase in nurse migration compared to other provinces after the visa expansion. This was a large shock given that the mean of the U.S. nurse migration rate was 0.0019% in 1999, the period immediately before visas were made available. This means that nurse migration provinces experienced a 221% increase in demand for nurses abroad. Similarly, we estimate that the drop in nursing migration was as large as 89% when visas were restricted in 2007. We calculate the effect of these changes on tertiary enrollment. The results are shown in Columns 2 to 4 of Table 5, and show a similar pattern to the results presented thus far. Specifically, we find that the visa expansion and contraction in 2000 and 2007 led to a 1.86 percentage point relative increase in nursing enrollment in high migration provinces and a 0.74 percentage point decrease in nursing enrollment. These correspond to a 346% increase in nursing enrollment and 154% decrease, respectively, from a baseline of 0.54% in 1999. On the other hand, enrollment in other programs declined. We estimate that in response to the visa expansion for nurses, enrollment in other disciplines declined by 2.06 percentage points, which is of a similar magnitude to the increase in nurse enrollment. On net, we find no effects on total tertiary enrollment. This set of results suggests that the supply of nurses in high migration provinces remained highly elastic with respect to demand despite large shocks over the study period. The increase in nursing enrollment however was accompanied by a similar sized decrease in other enrollment, suggesting that international migration did not spur new students to obtain tertiary education but affected the field of study of students. C. Robustness Checks As discussed earlier, one concern with our estimation strategy is differential trending in the outcome variables by high versus low migration provinces. To formally test our identifying assumption of parallel trends, we estimate the following equation:
∆!!" = !! + !!!"#ℎ!,!""# + !! + !!" (4) where t is the sample period before the policy change in 2000 (1992-1999), ∆!!" is the change in the province-level outcome variable in province p between time t and time t-1. For our identifying assumption to be valid, we should not reject the null hypothesis that !! is equal to zero. We run this test on all the outcome variables we use in Table 5. The results are shown in Row 3 of Table 5s. In Columns 1, 3, and 4, we cannot reject the null hypothesis that !! is equal to zero. In Column 2, we find a statistically significant negative pre-trend. While such a statistically significant pre-trend is not ideal, it is important to note two key considerations. First, the magnitude of the pre-trend is much smaller than the main point estimate.

As such, it is unlikely that this pre-trend drives the entire effect of the policy, especially given that the main effect is 14 times larger than the pre-trend. Second, the pre-trend has the opposite sign of the main effect. Thus, this should bias us against finding a positive impact of the visa expansion on nursing enrollment. In addition to checking for pre-trends, we conduct a number of additional robustness checks in Table 6. Panel B adds province-specific linear time trends to the results. The inclusion of province-specific linear time trends removes concerns that differences in provinces at baseline could lead to differential trending in variables related to the outcome variable. A similar pattern emerges as in the main results: the visa expansion increased US nurse migration and nursing enrollment, while the contraction reduced nurse migration and nursing enrollment. In Panel C, we show that the results are robust to the inclusion of population weights. In Panel D, we exclude Metro Manila, the capital province to ensure that such a large province is not driving the results. A similar pattern as in Panel A emerges. Finally, in Panel E, we use an alternative base year (1991) to calculate the baseline nursing migration rate. The results are robust to this change in base year. The estimation of equation (3) essentially designates provinces with high baseline nursing migration rates as the treatment group and provinces with low baseline nursing migration rates as the control group. Another concern is that provinces with low nurse migration at baseline may have high rates of other types of migration. If a policy change occurred in either 2000 or 2007 that altered demand for these other types of migrants, this could lead to bias in our estimates. For instance, suppose that in 2000 demand for engineers increased and engineers typically migrate from low nursing migration provinces. As a result of this expansion in demand for engineers, other tertiary enrollment may increase in response. Thus, the decline in other tertiary enrollment in high nursing provinces could simply be a result of comparing this to a control group where other enrollment was increasing. To test this, we plot the baseline nursing migration and other migration rates in Figure 6. The aforementioned concern would be a problem if high nursing migration provinces had low other migration, and low nursing migration provinces had high other migration. Figure 6 shows that this is not the case. Provinces that sent a large number of nurses at baseline also sent larger shares of other migrants. Thus, the negative effect on other enrollment does not appear to be driven by contamination of the control group. VI. Conclusion The migration of skilled professionals, particularly of healthcare workers, is often cited as a key concern for many developing countries due to its potential to deplete the number of skilled workers from the local economy. In contrast, the demand for skilled migrants may lead to human capital formation by increasing the returns to education. We estimate the causal effect of skilled migration on educational investment in the country of origin by exploiting the aggressive nurse recruitment policies and subsequent visa restrictions employed by the United States in the 2000s.

We show that enrollment in nursing programs in the Philippines accommodated the large and sudden demand for nurses from the U.S. The increase in nursing enrollment and graduation during the period was much larger than the increase in nurse migration. However, similar sized decreases in enrollment in other skilled fields suggest that while migration affected field of study and increased the supply of medical professionals, it did not spur new students to attend tertiary school. We make no claims that what happened in the context of the Philippines must apply everywhere else. In a way, the Philippines is a unique setting because of its history as a migrant-sending country. Nevertheless, we show that common assumptions about skilled migration need not apply in a setting where there is a huge volume of departures and people largely expect a “drain.” The supply of nurses responded and accommodated demand from abroad. Part of the reason many individuals were able to get nursing education during the period was because schools were rapidly able to accommodate increased demand from students to become nurses. The number of nursing programs around the country went from 435 in 2001 to 880 in 2010. In future work, we plan to further investigate this channel by looking at the effect of international migration not just on households, but also on the supply side of education: the creation of schools and other institutions supportive of human capital accumulation. International migration may also have an effect on the quality, not just quantity, of schools. This is a topic for which very little is known and an understanding is crucial in determining why migration may lead to human capital accumulation not just in the Philippines but in other settings as well. Our results provide support for well-designed partnerships regarding healthcare workers between receiving and sending countries. The cost of training nurses at migrant-sending countries is often a small fraction of the cost of training nurses at receiving countries, whereas nursing services are worth much more in receiving countries, at least in terms of pay (Clemens 2015). A well-designed partnership can, at least in principle, present a win-win situation by allowing receiving countries to subsidize training for workers in sending countries while facilitating the migration of some skilled workers.

14
References Arends-Kuenning, Mary, Alvaro Calara, and Stella Go. 2015. “International Migration Opportunities and Occupational Choice: A Case Study of Philippine Nurses 2002 to 2014.” Working Paper. Aiken, Linda. 2007. “US Nurse Labor Market Dynamics are Key to Global Nurse Sufficiency.” Health Services Research, 42(3): 1299-1320. Asia Times. 2003. “Nurse Exodus Plagues Philippines.” May 17, 2003 [Available at: http://www.atimes.com/atimes/Southeast_Asia/EE17Ae04.html, Accessed March 12, 2016]. Bhagwati, Jagdish, and Koichi Hamada. 1974. “The Brain Drain, International Integration of Markets for Professionals and Unemployment: a Theoretical Analysis,” Journal of Development Economics, 1: 19–42. Chand, Satish, and Michael Clemens. 2008. “Skilled Emigration and Skill Creation: A quasi-experiment.” Center for Global Development Working Paper 152. Clemens, Michael. 2013. “What do we Know About Skilled Migration and Development?” Policy Brief. Clemens, Michael. 2015. “Global Skill Partnerships: A Proposal for Technical Training in a Mobile World.” IZA Journal of Labor Policy, 4(1): 1-18. Dinkelman, Taryn and Martine Mariotti. 2016. “The Long Run Effect of Labor Migration on Human Capital Formation in Communities of Origin,” American Economi Journal: Applied Economics, 8(4): 1-35. Docquier, Frederic, and Abdeslam Marfouk. 2006. “International Migration by Educational Attainment (1990-2000)—Release 1.1” in International Migration, Remittances and Development., ed. Caglar Özden and Maurice Schiff. Palgrave Macmillan: New York. Engman, Michael. 2010. “A Tale of Three Markets: How Government Policy Creates Winners and Losers in the Philippine Health Sector.” Working Paper. Gruber, Herbert and Anthony Scott. 1966. “The International Flow of Human Capital.” The American Economic Review, 56: 268–274. Jasso, Guillermina, Vivek Wadhwa, Gary Gereffi, Ben Rissing, and Richard Freeman. 2010. International Migration Review, 44(2): 477-498. Mountford, Andrew. 1997. “Can a Brain Drain be Good for Growth in the Source Economy?” Journal of Development Economics, 53: 287–303.

15
Munshi, Kaivan. 2003. “Networks in the Modern Economy: Mexican Migrants in the U.S. Labor Market.” Quarterly Journal of Economics, 118(2): 549–599. Organization for Economic Cooperation and Development (OECD). 2007. “Immigrant Health Workers in OECD Countries in the Broader Context of Highly Skilled Migration.” International Migration Outlook, SOPEMI 2007 Edition. OECD Publishing: Paris. Özden, Caglar, and David Phillips. 2015. “What really is Brain Drain? Location of Birth, Education, and Migration Dynamics of African Doctors.” KNOMAD Working Paper 4. Scalabrini Migration Center. 2011. Minding the Gaps: Migration, Development and Governance in the Philippines. Manila, Philippines. Shrestha, Slesh A. 2016. “No Man Left Behind: Effects of Emigration Prospects on Educational and Labor Outcomes of Non-migrants.” Economic Journal. Stark, Oded, Christian Helmenstein, and Alexia Prskawetz. 1997. “A Brain Gain with a Brain Drain,” Economic Letters, 55: 227–234. Theoharides, Caroline. 2016. “Manila to Malaysia, Quezon to Qatar: International Migration and the Effects on Origin-Country Human Capital.” Working Paper. United States Citizenship and Immigration Services (USCIS) Ombudsman. 2007. Annual Report to Congress June 2007. Van Eyck, Kim. 2004. “Women and International Migration in the Health Sector.” Final Report of Public Services International’s Participatory Action Research 2003.

16
Figure 1: Enrollment in Tertiary Education by Discipline (1990-2013)
Source: CHED and authors’ calculations
Figure 2: Graduation in Tertiary Education by Discipline (1998-2013)
Source: CHED and authors’ calculations.

17
Figure 3: Number of Departures of Nurse and Other Migrants (1990-2014)
Notes: The red and green lines shows the total for nurse migrants to U.S. and non-U.S. countries (left vertical axis) while the blue dotted line shows the total for other migrants (right vertical axis). Source: CFO and authors’ calculations.

18
Figure 4: Impacts of Visa Expansion and Contraction on US Nurse Migration, Tertiary Nursing Enrollment, and Other Tertiary Enrollment

19
Figure 4: (Continued)
Notes: Each graph shows coefficients (95% confidence intervals) on interactions between the high migration province and year indicators. All specifications include province and year fixed effects. Interactions with the indicator for 1999 are omitted to identify the model. The estimation sample includes all provinces. Standard errors are clustered by province. The dotted lines represent visa expansion from AC21 in 2000 and the restriction on nursing visas in 2007. Sources: CHED, CFO, and authors’ calculations.

20
Figure 5: Impacts of Visa Expansion and Contraction on Tertiary Nursing Graduation, and Other Tertiary Graduation
Notes: Each graph shows coefficients (95% confidence intervals) on interactions between the high migration province and year indicators. All specifications include province and year fixed effects. Interactions with the indicator for 1999 are omitted to identify the model. The estimation sample includes all provinces. Standard errors are clustered by province. The dotted lines represent visa expansion from AC21 in 2000 and the restriction on nursing visas in 2007. Data on graduation rates are only available after 1997. Sources: CHED, CFO, and authors’ calculations.
21
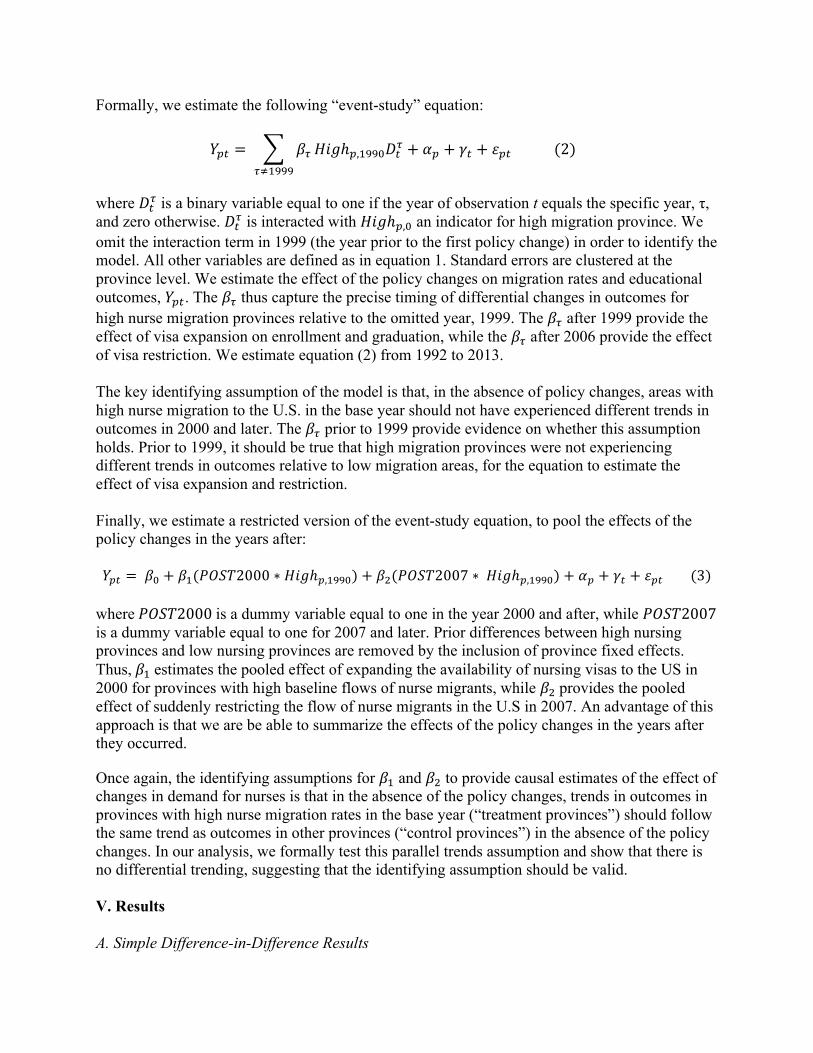
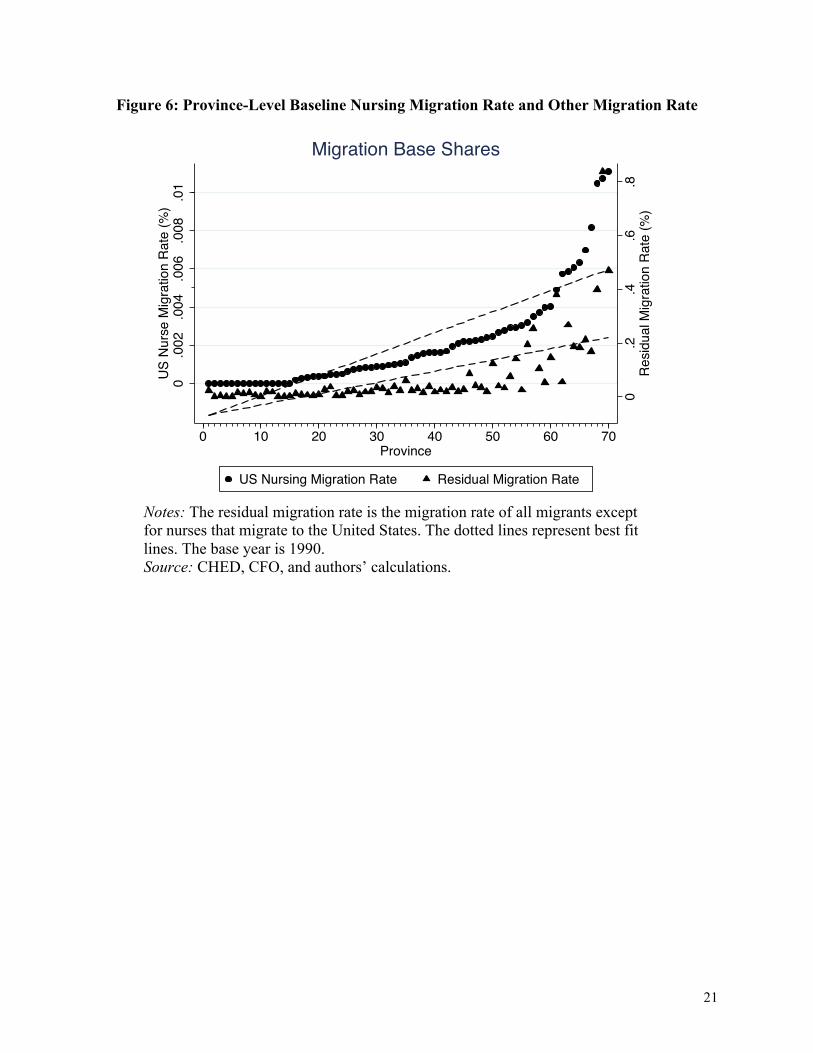
Figure 6: Province-Level Baseline Nursing Migration Rate and Other Migration Rate
Notes: The residual migration rate is the migration rate of all migrants except for nurses that migrate to the United States. The dotted lines represent best fit lines. The base year is 1990.
Source: CHED, CFO, and authors’ calculations.
0.2
.4.6
.8R
esid
ual M
igra
tion
Rat
e (%
)
0.0
02.0
04.0
06.0
08.0
1U
S N
urse
Mig
ratio
n R
ate
(%)
0 10 20 30 40 50 60 70Province
US Nursing Migration Rate Residual Migration Rate
Migration Base Shares

Mean Std. Dev. Min Max
Panel A. Migration Rate (%)Total Migration Rate 0.076 0.097 0 1.228Nurse Migration Rate 0.005 0.007 0 0.058Other Migration Rate 0.071 0.093 0 1.220
Panel B.Tertiary Enrollment Rates (%)Total Enrollment 20.889 12.119 0.106 91.430
Total Nurse 1.523 2.475 0 31.289 Female Nurse 1.131 1.751 0 21.531 Male Nurse 0.439 0.776 0 9.758
Total Other 19.367 10.812 0.106 80.936 Female Other 10.739 5.691 0.083 47.347 Male Other 8.653 5.245 0.007 34.702
Panel C. Tertiary Graduation Rates (%)Total 3.603 2.249 0 33.185
Total Nurse 0.335 0.528 0 4.741 Female Nurse 0.263 0.390 0 3.311 Male Nurse 0.105 0.180 0 1.792
Total Other 3.268 2.012 0 33.185 Female Other 1.984 1.192 0 21.580 Male Other 1.474 0.908 0 11.605
Table 1. Descriptive Statistics
Notes: The sample period is from 1990 to 2013. The unit of obserbation is the province-year. Data from 70 Philippine provinces are used based on 1990 geographic boundaries. Values are expressed as percentages. Enrollment and graduation rates are calculated using the population 18-21 as the denominator, while the migration rate uses the working aged population (18-60) as the denominator. N=1,680 Results by gender omit the year 1997 since data by gender were not collected during that year. Graduation rates are only calculated from 1998-2013 because it is only available in these years and N=1,330 in this truncated sample.Source: CHED, CFO, and authors' calculations.

Nurse Migration Rate to the U.S. in 1990
(% of province population aged 18-60)
1. Ilocos Norte 0.011092. Zambales 0.010733. Metro Manila 0.010494. Benguet 0.008155. Ilocos Sur 0.006986. Pangasinan 0.006327. La Union 0.006078. Cavite 0.005859. Iloilo 0.0057310. Pampanga 0.0049011. Tarlac 0.0040212. Nueva Vizcaya 0.0039813. Cebu 0.0037214. Bataan 0.0035015. Rizal 0.0031916. Aurora 0.0030217. Laguna 0.0029118. Nueva Ecija 0.0029119. Bohol 0.0027920. Aklan 0.00268
Table 2. List of Top 20 Nurse Migration Provinces to the USA
Source: CFO and authors' calculations.
Total Female Male(1) (2) (3)
Panel A. Effect on Enrollment RateNurse Enrollment 117.79** 77.02** 36.24**
(51.43) (34.55) (15.32)
Other Enrollment -125.56** -79.29** -41.36**(58.74) (33.30) (19.69)
Total Enrollment -7.77 -2.27 -5.12(41.30) (22.13) (19.82)
N 1680 1610 1610
Panel B. Effect on Graduation Rate
Nurse Graduation -2.34 -3.29 -3.09(6.62) (4.16) (1.92)
Other Graduation 24.76 15.41 8.67(17.54) (10.03) (6.89)
Total Graduation 22.43 12.12 5.57(18.59) (11.00) (6.68)
N 1330 1120 1120
Sources: CFO, CHED, and authors' calculations.
Table 3. Effect of Nurse Migration on Tertiary School Enrollment and Graduation Rates
Notes: The sample period in Panel A is from 1990-2013, though Columns 2 and 3 omit 1997 because enrollment data by gender was not collected in that year. The sample period in Panel B is 1998-2013, with 1997 again omitted in Columns 2 and 3. Graduation data is only available for years after 1997. Robust standard errors are clustered at the province level. All specifications include province and year fixed effects as well as province-specific linear time trends. *** indicates significance at the 1% level. ** indicates significance at the 5% level * indicates significance at the 10% level.

Total Female Male Total Female Male Total Female MalePanel A. Effect on Enrollment Rate (1) (2) (3) (4) (5) (6) (7) (8) (9)
Lag 1 81.82* 54.87* 25.50** -75.22 -49.84 -23.36 6.59 5.04 2.15(42.46) (27.94) (12.74) (54.52) (31.07) (20.47) (41.11) (22.40) (20.33)
Lag 2 69.44** 44.12** 21.80*** -85.06** -44.25* -37.95** -15.62 -0.13 -16.15(27.59) (19.73) (8.15) (38.00) (24.19) (16.71) (31.21) (16.96) (17.49)
Lag 3 104.05** 70.05** 36.19** -101.57*** -78.38*** -37.71*** 2.48 -8.33 -1.52(47.54) (33.57) (15.54) (30.40) (18.49) (13.06) (40.58) (26.54) (14.75)
Lag 4 155.16** 106.35** 52.46** -154.53** -103.46*** -45.46 0.63 2.89 7.00(70.43) (45.52) (23.45) (62.87) (37.73) (27.66) (41.16) (21.65) (22.88)
N 1540 1470 1470 1540 1470 1470 1540 1470 1470Panel B. Effect on Graduation Rate
Lag 1 -1.10 -0.86 -2.20 15.92 7.86 3.66 14.82 7.00 1.45(4.97) (2.92) (1.64) (17.72) (9.31) (7.28) (18.21) (9.89) (7.22)
Lag 2 -0.29 -2.17 -0.03 20.41 14.90 10.60 20.12 12.74 10.57(4.06) (3.32) (1.53) (13.14) (9.21) (6.61) (14.99) (10.55) (7.14)
Lag 3 10.76*** 7.73*** 2.22 -5.42 -1.25 -2.45 5.34 6.49 -0.23(3.45) (2.27) (1.49) (15.46) (11.28) (5.82) (14.82) (10.85) (5.97)
Lag 4 35.71*** 23.85*** 10.30*** -28.28* -21.21** -13.90** 7.43 2.63 -3.60(7.24) (5.29) (2.75) (15.14) (8.82) (5.87) (10.97) (6.41) (5.71)
N 1330 1120 1120 1330 1120 1120 1330 1120 1120
Sources: CFO, CHED, and authors' calculations.
Nursing Programs Other Programs All ProgramsTable 4. Effect of Lagged Migration on Tertiary Enrollment and Graduation Rates
Notes : Robust standard errors are clustered at the province level. All specifications include province and year fixed effects as well as province-specific linear time trends. *** indicates significance at the 1% level. ** indicates significance at the 5% level * indicates significance at the 10% level.

US Nurse Migration
Nurse Enrollment
Other Enrollment
Total Enrollment
(1) (2) (3) (4)Post 2000 x High 0.0042*** 1.8569*** -2.0660** -0.2091
(0.0009) (0.5065) (0.8877) (0.8258)
Post 2007 x High -0.0017* -0.7386*** -0.2690 -1.0076(0.0008) (0.2614) (0.8041) (0.8867)
Check for Pre-Trends -0.0000 -0.1346*** 0.0633 -0.0713(0.0000) (0.0425) (0.1804) (0.1798)
Mean of Dependent Variable, 1998 0.0019 0.5360 24.82 25.35
N 1540 1540 1540 1540
Sources: CFO, CHED, and authors' calculations.
Table 5. Effect of US Visa Policy Changes
Notes: The sample period is from 1992-2013. Province and year fixed effects are included in all specifications. Robust standard errors are clustered at the provoince level. Post 2000 is a dummy variable equal to 1 in the year 2000 and after and 0 otherwise. Post 2007 is a dummy variable equal to 1 in the year 2007 and after and 0 otherwise. High is an indicator variable for high nurse migration province to the U.S. in the base year 1990. *** indicates significance at the 1% level. ** indicates significance at the 5% level * indicates significance at the 10% level.

US Nurse Migration Nurse Enrollment Other Enrollment Total Enrollment(1) (2) (3) (4)
Panel A. Main Results
Post 2000 x High 0.0042*** 1.8569*** -2.0660** -0.2091(0.0009) (0.5065) (0.8877) (0.8258)
Post 2007 x High -0.0017* -0.7386*** -0.2690 -1.0076(0.0008) (0.2614) (0.8041) (0.8867)
Check for Pre-Trends -0.0000 -0.1346*** 0.0633 -0.0713(0.0000) (0.0425) (0.1804) (0.1798)
Panel B. Plus Province-Specific Linear Time TrendsPost 2000 x High 0.0034*** 1.9209*** -1.5639 0.3570
(0.0009) (0.4615) (1.1920) (0.9435)Post 2007 x High -0.0023** -0.6866** 0.1389 -0.5477
(0.0009) (0.3357) (0.9937) (1.1502)
Check for Pre-Trends -0.0000 -0.1346*** 0.0633 -0.0713(0.0000) (0.0425) (0.1804) (0.1798)
Panel C. Plus Population WeightsPost 2000 x High 0.0049*** 1.8474*** -3.2141** -1.3667
(0.0012) (0.4767) (1.2542) (0.9655)Post 2007 x High -0.0027** -0.8550*** 0.1743 -0.6807
(0.0011) (0.3102) (0.6994) (0.8416)
Check for Pre-Trends -0.0002 -0.2132** 0.0636 -0.1496(0.0001) (0.0816) (0.1454) (0.1481)
Panel D. Without Highest Migration ProvincePost 2000 x High 0.0041*** 1.8160*** -1.9071** -0.0911
(0.0009) (0.5180) (0.8829) (0.8275)Post 2007 x High -0.0015* -0.7083*** -0.1995 -0.9078
(0.0009) (0.2659) (0.8081) (0.8900)
Check for Pre-Trends -0.0000 -0.1224*** 0.0621 -0.0603(0.0000) (0.0412) (0.1837) (0.1826)
Panel E. 1991 Migrant BasePost 2000 x High 0.0051*** 2.3291*** -3.2257*** -0.8967
(0.0009) (0.4755) (0.8327) (0.8187)Post 2007 x High -0.0019** -0.9953*** -0.7327 -1.7280*
(0.0008) (0.2480) (0.7996) (0.8694)
Check for Pre-Trends -0.0001 -0.1909*** 0.1262 -0.0648(0.0000) (0.0392) (0.1799) (0.1798)
N 1540 1540 1540 1540
Sources: CFO, CHED, and authors' calculations.
Table 6. Robustness Checks for Effect of US Visa Policy Changes
Notes: The sample period is from 1992-2013, Province and year fixed effects are included in all specifications. Robust standard errors are clustered at the provoince level. Post 2000 is a dummy variable equal to 1 in the year 2000 and after and 0 otherwise. Post 2007 is a dummy variable equal to 1 in the year 2007 and after and 0 otherwise. High is an indicator variable for high nurse migration province to the U.S. in the base year 1990. *** indicates significance at the 1% level. ** indicates significance at the 5% level * indicates significance at the 10% level.