Ruixue Jia and Hongbin Li December 15,...
58
Access to Elite Education, Wage Premium, and Social Mobility: The Truth and Illusion of China’s College Entrance Exam * Ruixue Jia † and Hongbin Li ‡ December 15, 2016 Abstract This paper studies the returns to elite education and their implications on elite forma- tion and social mobility, exploiting an open elite education recruitment system – China’s College Entrance Exam. We conduct annual national surveys of around 40,000 college graduates during 2010-2015 to collect their performance at the entrance exam, job out- comes, and other individual characteristics. Exploiting a discontinuity in elite university eligibility around the cutoff scores, we find a sizable wage premium of elite education but elite education eligibility does not necessarily promise one’s entry into the elite class (measured by occupation, industry and other non-wage benefits). While elite education eligibility does improve one’s income rank, it does not alter the intergenerational link between parents’ status and children’s status. We also find that the wage premium is more consistent with the role of social networks and signaling than that of human capital. * We are grateful to the China Data Center of Tsinghua University and the 90 universities in the survey for their collaboration. We thank Aimee Chin, Julie Cullen, Joe Cummins, Esther Gehrke, Wei Huang, Craig Mcintosh, Karthik Muralidharan, Zhuan Pei, Molly Roberts and seminar/conference participants at Cornell, George Washington University, Harvard, NBER, University of Houston, Sam Houston State, Stanford, UC Riverside, UCSD for their comments. † School of Global Policy and Strategy, University of California, San Diego, and CIFAR, [email protected]. ‡ School of Economics and Management, Tsinghua University, and SIEPR, Stanford University, lihongbin- [email protected].
Transcript of Ruixue Jia and Hongbin Li December 15,...
Access to Elite Education, Wage Premium, and Social Mobility:
The Truth and Illusion of China’s College Entrance Exam∗
Ruixue Jia†and Hongbin Li‡
December 15, 2016
Abstract
This paper studies the returns to elite education and their implications on elite forma-
tion and social mobility, exploiting an open elite education recruitment system – China’s
College Entrance Exam. We conduct annual national surveys of around 40,000 college
graduates during 2010-2015 to collect their performance at the entrance exam, job out-
comes, and other individual characteristics. Exploiting a discontinuity in elite university
eligibility around the cutoff scores, we find a sizable wage premium of elite education
but elite education eligibility does not necessarily promise one’s entry into the elite class
(measured by occupation, industry and other non-wage benefits). While elite education
eligibility does improve one’s income rank, it does not alter the intergenerational link
between parents’ status and children’s status. We also find that the wage premium is
more consistent with the role of social networks and signaling than that of human capital.
∗We are grateful to the China Data Center of Tsinghua University and the 90 universities in the survey
for their collaboration. We thank Aimee Chin, Julie Cullen, Joe Cummins, Esther Gehrke, Wei Huang, Craig
Mcintosh, Karthik Muralidharan, Zhuan Pei, Molly Roberts and seminar/conference participants at Cornell,
George Washington University, Harvard, NBER, University of Houston, Sam Houston State, Stanford, UC
Riverside, UCSD for their comments.†School of Global Policy and Strategy, University of California, San Diego, and CIFAR, [email protected].‡School of Economics and Management, Tsinghua University, and SIEPR, Stanford University, lihongbin-

1 Introduction
Scholars have long argued that the circulation of elites plays a crucial role in determining
social order (Pareto 1916, Mosca 1939, Acemoglu and Robinson 2008, North, Wallis and
Weingast 2009). In modern societies, access to education, especially elite education, is be-
lieved to be one of the most important channels for elite formation and social mobility. The
works of Pierre Bourdieu emphasize how elite education contributes to the maintenance and
reproduction of class inequalities, which inspire a sociological literature on the social con-
sequences of elite education institutions (Bourdieu and Passeron 1977; Bourdieu 1988). In
economics, while there exists a burgeoning literature estimating the economic returns to se-
lective education (e.g., Dale and Krueger 2002, 2011; Black and Smith 2004; and Hoekstra
2009; Hastings, Neilson and Zimmerman 2013; Anelli 2016), few studies investigate how the
access to elite education affects elite formation and social mobility. In this paper, we not only
estimate the returns to elite education but also attempt to understand their implications on
elite formation and social mobility using a large-scale dataset we collected ourselves in China.
Every year, around 10 million students in China take the National College Entrance
Exam – the largest standardized test in the world – in order to get admitted by around 2,300
colleges of different tiers. The exam not only determines whether a young person will attend
a Chinese university, but also which one – attending an elite university is perceived to have
a crucial bearing on career prospects or to provide a ticket to the elite class (Wong 2012).
This perception is not without controversy: due to the importance of family background
for the labor market, some argue that it is illusion rather than reality that a better exam
performance can provide upward mobility and change one’s fate (Bregnbaek 2016).
The exam-based admission of Chinese colleges provides us a Regression Discontinuity
(RD) type laboratory to understand the role of elite education. We refer to elite universities
as those designated by the Chinese government as the first-tier universities across all provinces
in admission. Elite universities have a cutoff score, and students just above and below the
cutoff score are similar in most characteristics, but those above are eligible to apply to
elite universities. Thus, we could simply compare outcomes (income and other variables) of
students who are just below and above the cutoff score, which solves the typical empirical
issue that students entering better universities may be different in ability, family background
and other characteristics. We should note that even though the score is the main criterion,
it is possible that some students with scores below the cutoff get accepted with extra points
from minor criteria such as talents in art and sports. It is also possible that some with
scores above the cutoff do not go to elite universities since the final admission decision is also
affected by competition and students’ preference of majors and location (see Section 2 for
discussions). Hence, we have a fuzzy design with a discontinuity in elite university eligibility
1

around the cutoff scores.
Because there are no existing data we could draw on, for the purpose of our study, we
self-collected systematic data on exam performance and individual outcomes. During 2010-
2015, we designed and conducted annual surveys of college graduates, and collected a total
sample of 40,916 students from 90 universities.1 In our survey, we collected the students’
scores of the college entrance exam, their first job outcomes as well as detailed individual and
parental characteristics. With these data, we are able to examine outcomes of students with
scores close to the cutoffs for elite universities.
We find that elite education in China has a sizable return. Our baseline analysis focuses
on around 10,335 individuals within a bandwidth of 20 points (out of a maximum of 750
points from four subjects) around the elite university cutoff scores, which is close to the
optimal bandwidth (21) using the method by Imbens-Kalyanaraman (2011). There is indeed
a clear discontinuity around the cutoff: scores above the elite university cutoffs raise the
admission probability by about 16 percentage points, about 75% of the mean probability. In
contrast, there is no such pattern with respect to (fake) placebo cutoffs; neither is there any
discontinuity for our balance tests with all individual and family characteristics. Exam scores
above the cutoffs are associated with a wage premium of 150 RMB (USD 25) per month for a
fresh college graduate, which is around 6% of the median monthly wage (2,500 RMB). These
estimates together imply an IV estimate of the monthly wage premium of elite education of
1,000 RMB (USD 160), or about 40% of the median monthly wage. Our results are robust
to alternative bandwidths and specifications of the running function.2
It is worth pointing out that scoring above the cutoff not only changes the probability of
attending an elite university but also other dimensions regarding admission and college life. In
our context, the choices of majors and the relative ranking of students in their college classes
are particularly important. Within a university, different majors also have different admission
scores depending on their popularity. Students often face a tradeoff between universities and
majors, especially for those close to the cutoff. If they choose an elite university, they are less
likely to major in popular fields because, when it is their time to select, those majors may
have already been all taken by higher score students. Similarly, those just above the cutoffs
are likely to be the worse students within their college class. While these dimensions do not
affect the internal validity of our empirical strategy (i.e., the wage premium of elite education
is indeed a net outcome of different dimensions), they matter for the interpretation of our
estimate on wage premium, as one may be only interested in the effect of elite education given
everything else equal. When we control for major and relative class ranking in college, we
1We use “college” and “university” interchangeably throughout the paper.2For instance, Gelman and Imbens (2014) discuss why including higher-order polynomials might bias the
estimates.
2
find a marginally higher elite education wage premium. In other words, our baseline estimate
provides a conservative estimate of elite education premium.
Market income is only one measure of entering China’s elite class, and there are other
dimensions of being in the elite class that may not be easily monetized. Many of them are
associated with the provision of public goods or perks from government monopolies, such as
getting into the banking industry, finding a job in a state-owned enterprise, and obtaining
hukou (the right to live in a city and enjoy local public goods) of a well-funded municipal. We
also design questions to capture job characteristics beyond wage. We find that elite education
eligibility does not increase the probability of entering an elite occupation, elite industry, elite
ownership (where the elite status is defined by a realization-hope ratio in the data), living
in an elite city, obtaining hukou or any other non-marketized benefit; in contrast, parental
characteristics do. In sum, while the elite education eligibility is associated with a wage
premium, we find no evidence that it definitely implies one’s entry into the elite club, defined
by job characteristics.
A limitation of our study is that our survey design only allows us to investigate the wage
of the first job for fresh college graduates and it is unclear how important these initial wages
are later in life. To partially address this concern, we supplement our survey data with job
histories of around 300,000 individuals from a major recruitment platform and document the
importance of the first job for future outcomes.
How does elite education eligibility affect social mobility? The question has two dimen-
sions. The first is whether elite education eligibility can lift one from a low-income status
to a higher-income status. Not surprisingly, elite education eligibility increases wages and
mobility in this aspect. The second dimension regards whether elite education eligibility can
change the role family background (such as parental income) plays in determining the job
market success of a person.3 In theory, elite education eligibility can increase (or decrease)
intergenerational mobility if the children with poorer (or richer) parents enjoy higher returns.
Empirically, we find no evidence showing that the elite education eligibility alters intergen-
erational mobility, as the returns are neutral with respect to parental income (and parental
income rank). Moreover, the comparison between the impact of being above the elite college
cutoff score and that of having a rich parent helps us to better understand the degree of
mobility created by the exam system in the first dimension. For instance, for those students
from families of the top 20% income level, even if they are not eligible for elite education,
their probability of being in the top 20% income group is still higher than those eligible but
come from less wealthy families.
Finally, we examine why elite education has a wage premium and consider three expla-
3These two dimensions are similar to the definition of absolute mobility and relative mobility in Chetty etal. (2014).
3
nations: human capital, signaling, and social capital. Little empirical evidence exists to
disentangle them due to the challenge of measurement. Exploiting the richness of our survey
data, we proxy them using as many variables as possible. In particular, the existence of
national-level standardized tests in China allows us to have a reasonable proxy for human
capital accumulated in college, and we find no evidence supporting the importance of human
capital in explaining our findings. Instead, suggestive evidence appears consistent with the
role of social capital and signaling.
Our findings contribute to several literatures. First, they add to studies estimating the
economic returns to elite education (e.g., Dale and Krueger 2002, 2011; Black and Smith
2004; and Hoekstra 2009; Hastings, Neilson and Zimmerman 2013; Anelli 2016).4 We are
not the first one to use RD to estimate the returns of elite education.5 One advantage of
our survey is that we design questions to cover all information we need to study implications
on elite formation and social mobility and to shed light on mechanisms, thus providing new
perspectives to this literature on elite education. Our findings on intergenerational mobility
also add to the growing literature on intergenerational mobility in economics (e.g., Solon
1992; Chetty et al. 2014; Chen et al. 2015) and sociology (see Erikson and Goldthorpe
1992, 2002 for related studies). Although there is a caveat that we are studying a selected
group of people, in which everyone has college education, we believe our group of focus
provides a reasonable sample for the focus of whether the access to elite education alters
intergenerational mobility.
The College Entrance Exam is probably one of the most important institutions in China,
affecting the lives of hundreds of millions of families. A legacy of the imperial exam institution
that was used for over 1,300 years as an elite recruitment channel (Bai and Jia 2016), it gives
hope to the Chinese people, especially those not so well-off. Probably due to the lack of
data, there are not many economic accounts of such an important institution. To the best
of our knowledge, ours is the first to systematically study the labor market consequences of
the College Entrance Exam by collecting data on exam scores and exploiting the cutoffs in
recruitment. Our research design and data can be used to study other social and political
implications of elite education.
Section 2 discusses the background and the data. Section 3 reports the results on elite
university enrollment, after which Section 4 focuses on wage premium and other dimensions
of entry into the elite class. Section 5 centers on social mobility. Section 6 presents evidence
4In the context of China, the 2010 wave of the present data has been used in Li et al. (2012), where theycontrol for observables and also find a sizable wage premium of elite education. Our study exploits a differentempirical strategy that allows us to compare students with similar ability.
5Using a RD strategy, Hoekstra (2009) studies the returns of one elite state university in the US, Anelli(2016) on one elite college in Italy focused on economics/business and Zimmerman (2016) on two elite collegesin Chile. In particular, Zimmerman (2016) shows that elite peers play an important role in explaining theprobability of being a business elite.
4

on the mechanism for the wage premium. Section 7 concludes the paper.
2 Background and Data
2.1 Elite Universities in China
A total of around 2,300 colleges were registered in 2010 in China and the quality of these
colleges varies substantially.6 All of them recruit students based on the score of the National
College Entrance Exam, known as Gaokao in Chinese. They are categorized into four tiers
based on quality and those belonging to a higher tier are afforded priority in admitting
students. A university’s tier can differ across province. For instance, a very top university
belongs to the first-tier in all provinces whereas a middle-ranged university can be partially
regarded as first-tier in certain provinces. In this paper, elite universities refer to those
falling under the first tier in the recruitment process across all provinces. Out of all Chinese
universities, 96 universities belong to this category in our study period.7
Our definition of elite universities heavily overlaps two other definitions often used in the
literature (e.g., Carnoy et al. 2013): the so-called Project-211 universities (an abbreviation
of the top 100 universities in the 21st century) and the universities under the control of the
central government (111 in total).8 The advantage of using the national first-tier to define
elite universities is that they have clear cutoff scores. In recent years, due to college education
expansion in China, over 75% of exam-takers can get college education. However, only around
5% of exam-takers can get into these elite universities. This ratio also varies greatly across
provinces. The spatial inequality in access to elite education is an important issue but not
the focus of this study, since we would like to compare individuals similar to each other in
most dimensions including province of origin.
It is worth noting that most universities, including all elite universities and second-tier
universities (the focus of this study) are public. Private universities are not very developed
in China and the existing ones are of low quality. Related to their public nature, these
universities including both elite universities and second-tier universities charge similar tuition
fees, roughly RMB 5,000 a year (USD 750).9 Thus, in our study, we do not need to worry
about tuition fees. In addition, elite universities are of a similar size as non-elite universities
in our comparison group.
6See information from the Ministry of Eduction on different types of colleges: http://www.moe.edu.cn/
publicfiles/business/htmlfiles/moe/s4960/201012/113594.html7There are another 200 or so universities that are partially regarded as the first-tier in certain provinces.
We do not consider them as the elite group since there are no clear cutoffs and they are of less prestige.8For instance, there are 26 elite universities defined by the national first-tier criterion in our survey: 25 of
them belong to the Project-211 group and 21 are under the control of the central government.9The lowest-quality ones may charge a higher tuition fee for those who score low in the exam but want a
college degree, but they are not the focus of this study.
5
Another special institutional feature is that the graduation rates are very high across all
universities in China, with a mean over 95%.10 The college education system in China is
known for being “strict entrance, easy out”. So the probability in graduating varies little
between elite and non-elite universities.
What make elite universities distinct from other universities? They clearly have more
resources and support from the government. For instance, the Project 211 universities account
for only 5% in terms of the number of universities but 70% of all scientific research funds.11
Naturally, they also attract very different students and teachers. We will present several
university characteristics in our data.
2.2 The College Entrance Exam and Admission
The Admission Process In our study period, the admission process for most provinces
is as follows. All students take the exam in early June in their residence province, which
are written and graded by education authorities in their own province. Then, based on the
distribution of the scores and provincial quotas assigned by the Ministry of Education, each
province announces a cutoff score for each layer and each track (social or natural science).
With information of the cutoff scores, and also knowing their own scores, students fill their
college preferences for each layer of universities (with universities and majors). Those above
the elite college cutoff scores are eligible to apply for elite universities. Finally, universities
take turn to recruit based on scores of the applicants. In equilibrium, the admission bars
(lowest admission scores) for different elite universities are different depending on their pop-
ularity among students and competition. First-tier universities do the recruiting first, and
only after all first-tier universities finish, the second-tier university start. Once a student is
admitted, he/she can either choose to go to this university, or decline it and give up admission
to any university for the year.
There are two minor variants of this process: students in Beijing and Shanghai fill the
applications before the exam takes place; students in a few provinces fill the applications after
the exam but before knowing their scores. In all these cases, the cutoff point is unknown
before the exam and determines the eligibility in recruitment. In addition, the admission
mechanism was transferring from the Boston Mechanism to one that is similar to the serial
dictatorship mechanism in this period. Again, the exam score is the primary criteria under
both mechanisms and the cutoff determines the eligibility. Thus, our empirical strategy is
valid despite these complexities.12 As discussed next, we will compare students around the
10The Beijing-based Mycos Institute estimated in 2011 that China’s college dropout rate is 3%, while theMinistry of Education said that year that the rate is 0.75%.
11See the information from the Ministry of Education: http://www.moe.edu.cn/moe_879/moe_207/moe_
235/moe_315/tnull_1469.html.12These variations can have different implications on matching quality. For example, Chen and Kesten
6

cutoff within a province-year-(social or natural science) track.
It is true that some high school students choose to go abroad for college. However, the
decision is usually made before the exam, partly to avoid the exam.13 Thus, the possibility
that those who fail the exam choose to go abroad and hence cannot be covered by our survey
is unlikely to be critical for our study.
Features that Matter for Our Research Design The exam system has two features
that are important for our research design.
(i) The scores are only comparable within province-year-track. First, during
2010-2015, 27 out of 31 provinces (except for Jiangsu, Zhejiang, Shanghai and Hainan) use
a scale of 0-750 points based on four subjects,14 while the other four provinces use different
scales. Second, the exam papers are written and graded by each province and a point in
the score in different provinces means differently. Finally, and importantly, the cutoff points
vary greatly across provinces, reflecting spatial inequality in access to elite education. Since
we are interested in comparing individuals similar in all other dimensions except for exam
scores, we will compare students within the same province. We collect the cutoff scores for
each province-year-track from a website specialized for the exam: Gaokao.com. The cutoff
score of elite universities for the 27 provinces using a scale of 0-750 points has a median of
540.
In our analysis, we will control for province-year-track fixed effects. This takes care of
the four provinces using other exam scales. Our results are also robust to excluding them in
the analysis.
(ii) Our regression-discontinuity is fuzzy. It is possible that some students with
scores below the cutoff get accepted, due to extra scores from other characteristics such as
being an ethnic minority, being a child of a military martyr, or having talents in sports, music
and math etc. These extra scores are orthogonal to the actual scores from the exam.
It is also possible that some students with scores above the cutoff do not get into an elite
university, mainly due to competitiveness of the exam cohort or personal choices. Some who
apply to the first-tier may not be accepted due to competitiveness of their exam cohort and
(2016) provides an interesting theoretical analysis on the serial dictatorship mechanism. But these variantsare not essential for our research question, as long as students around the cutoff are comparable for a givenmechanism.
13See a report on “Applicants say they want to avoid the stress of studying for Chinese college entranceexam”: http://www.chinadaily.com.cn/china/2013-06/07/content_16580626.htm
14For students in the natural science track, the four subjects are Chinese (with a maximum of 150 points),Mathematics (with a maximum of 150 points), a foreign language (mostly English, with a maximum of150 points) and a combined subject of Physics, Chemistry and Biology (with a maximum of 110, 100, 90respectively). For students in the social science track, the four subjects are Chinese (with a maximum of 150points), Mathematics (with a maximum of 150 points), a foreign language (mostly English, with a maximumof 150 points) and a combined subject of Political Sciences, History and Geography (with a maximum of 100,100, 100 respectively).
7
have to go to a non-elite university (that recruits after the first-tier). This is another reason
we would like to compare within province-year-track, which controls for competitiveness of
an exam cohort. Some who are eligible may choose not to apply due to personal choices.
For instance, there is a tradeoff between major and university, especially for those around
the cutoff score. Within a university, different majors also have different admission scores
depending on their popularity. In recent years, economics (including finance and business),
management and law are popular and hence more competitive in recruitment. If students
with scores just at or slightly above the cutoff choose an elite university, they are less likely
to major in popular fields because, when it is their time to select, those majors may have
already been all taken by higher score students. Such argument also applies to preferences
for other things such as location of the university.
We will consider these tradeoffs such as major, university location and relative ranking
of students within college class in our analysis.
2.3 Chinese College Student Surveys (2010-2015)
The main challenge is to collect individual exam performance and link it to labor market
outcomes. We designed and conducted an annual survey of college graduates for this purpose.
Survey Design and Implementation The data that we use are derived from six waves
(2010-2015) of the Chinese College Student Survey (CCSS), conducted by the China Data
Center of Tsinghua University directed by one of the authors. We randomly selected 100
universities out of all universities in China by stratifying it according to locations (Beijing,
Shanghai, Tianjin, Northeastern China, Eastern China, Central China, and Western China)
and tiers of colleges.15 We used the number of students as weight for each college, meaning
that colleges with more students are more likely to be selected. For the purpose our study, we
oversampled elite colleges in order to get enough students near the elite school cutoff points.
Due to budget and management capacity, the survey was rolled out gradually with the
number of selected colleges listed in Appendix Table A1. The target was to have all 100
colleges participate in 2013. In practice, 65 colleges participated that year. Due to an
unexpected budgetary cut since 2014, the survey became voluntary, and only those who are
willing and can afford the survey (less than 20 colleges) did it in 2014 and 2015. Across the
six years of survey, 90 colleges out of the 100 participated in at least one of the years.
For each college, we trained a clerk in the student registration office, who helped us to
randomly select a sample of students from the full roaster (population) of the graduating
class. The survey was carried out in May and June each year during 2010-2015. In each of
15In the sampling process, we separate these three metropolises (Beijing, Shanghai, and Tianjin) from therest of China because these cities have an extremely large concentration of colleges, especially top universities.
8

the participating colleges, we appointed two to three survey administrators, who normally
are in charge of registration and teaching. Every year, we trained these survey administrators
from all over the country in Beijing with several days of intensive meetings. The survey in
each college was administered as such. The administrators gathered all sampled students in
a big classroom and let them fill in our paper survey form individually and anonymously.
Students were told at the beginning that these surveys are for research to understand job
market for college graduates, and none of their individual information is disclosed to any
party. These filled forms were then coded and mailed to our Beijing office for data entry and
cleaning.
Gathering all sampled students in one location and time for each university contributes to
a relatively high response rate. For the first year (2010), we targeted on selecting 400 students
per college and a college on average collected a sample of 319 students, and our target was
cut down to 200 in 2011-2013 due to the rising cost of the survey. For the last two years in
2014 and 2015, participating colleges agreed to survey 400 students in each college.16 Across
six sounds, the response rates for the elite universities and the rest are 71.5% and 76.9%
respectively and the difference is not statistically significant. These six rounds of survey
give us a sample of 40,916 students in their graduating year. Among them, 34,733 reported
complete information on their College Entrance Exam scores and the provinces where they
took the exam.
Appendix Figure A1(a) plots the spatial distribution of the 90 colleges by province. As
expected, we surveyed more colleges from more developed regions such as Beijing and Shang-
hai where there are more colleges. Their students come from all provinces across China.
Appendix Figure A1(b) plots the number of students with exam scores by the provinces
where they took the exam. Note that our strategy is not affected by the selection of colleges
(see discussion below on selection and measurement concerns).
We designed the questionnaire collaboratively with experts in other disciplines (sociology
and education). One of our aims in the surveys is to gather systematic data on individual
performance at the College Entrance Exam and link it with labor market outcomes. Thus,
we have detailed information on both. We also collected information on family background
and college activities.
Selection and Measurement Concerns We would like to be clear about sample selection
and measurement issues in the survey. Our data on students are not a random sample of all
Chinese college students for two reasons. First, we intentionally over-sampled elite colleges
to capture enough students with elite education. In our sample, 26 out of the 90 universities
16Most of these volunteering colleges intended to collect a sample that is large enough to conduct someanalysis of their own colleges.
9
belong to the elite tier, in contrast to 5% for the population. Second, due to the nature of
voluntary participation for the survey, we do not have 100% compliance from colleges and
students. Note that we do not need a random sample of all college students in our study.
For our analysis, the identification assumption is that those around the cutoff scores are
comparable in all dimensions before entering colleges except for their exam scores. We will
check whether this is the case in the data.
Misreporting and in particular over-reporting exam scores is possible. However, this
concern is unlikely to be critical for our study. Conceptually, we are focusing on exam scores
close to cutoff scores for the elite universities. It is unclear why one would like to misreport
performance just around the cutoff. We expect the concern of misreporting to matter more
for the very low and very high scores, which are not our focus. Empirically, we also examine
the density of reported exam scores. Moreover, a clear discontinuity in the first stage (on
how exam scores affect the probability of getting elite education) around the cutoff is also
reassuring. For instance, Battistin et al. (2009) show that a fuzzy design can still be applied
to identify the causal effect when the first stage discontinuity exists despite the presence of
measurement error in the assignment variable for a subset of observations.
Misreporting of wages is also possible. We exclude 5% of the data (2.5% in both tails
of the wage distribution) in our baseline. The results are robust to keeping all the data or
excluding slightly different percent of the tail sample.
University Characteristics in Our Survey Appendix Table A2 presents several uni-
versity characteristics in our survey. Consistent with the discussion above, elite universities
are slightly smaller in terms of the number of students but the difference is not significant.
Elite universities clearly have more foreign students and a much larger share of students from
other provinces – consistent with the fact that they attract talents from outside their own
regions.
As expected, there is a big difference in terms of students’ exam scores. The median score
for the elite group is 590 whereas that for the non-elite group is 491. Moreover, the median
first-job wage is about 35% higher for the elite university graduates.
Data on the College Entrance Exam Scores We collected information on the total
exam score and the score for each subject. Figure 1(a) plots the distribution of the difference
between the reported total scores and the actual cutoffs for elite universities, where the
cutoffs are defined for each province-year-track. The density is weighted by the sampling
weight of universities. Among the 40 thousand graduating students in our surveys, 10,335
of them falls into the 20-point bandwidth centered at the cutoff score. We will use this 20-
point bandwidth (roughly 5 points per subject), close to the optimal bandwidth from the
10
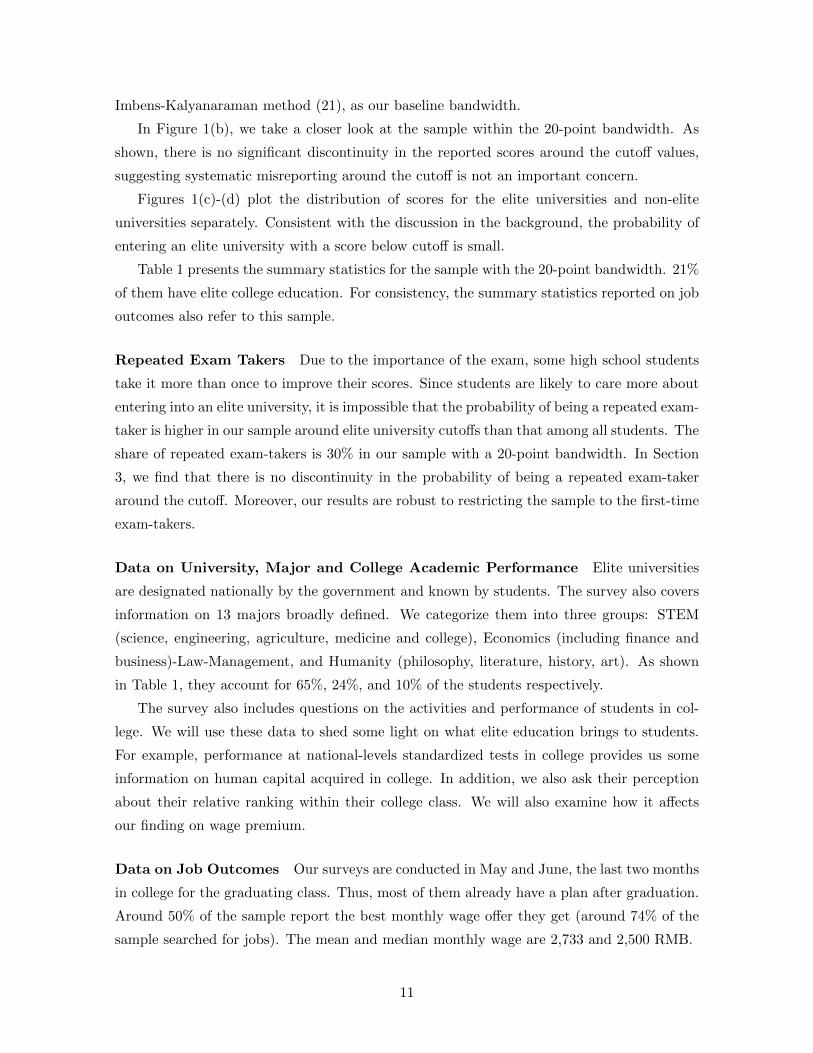
Imbens-Kalyanaraman method (21), as our baseline bandwidth.
In Figure 1(b), we take a closer look at the sample within the 20-point bandwidth. As
shown, there is no significant discontinuity in the reported scores around the cutoff values,
suggesting systematic misreporting around the cutoff is not an important concern.
Figures 1(c)-(d) plot the distribution of scores for the elite universities and non-elite
universities separately. Consistent with the discussion in the background, the probability of
entering an elite university with a score below cutoff is small.
Table 1 presents the summary statistics for the sample with the 20-point bandwidth. 21%
of them have elite college education. For consistency, the summary statistics reported on job
outcomes also refer to this sample.
Repeated Exam Takers Due to the importance of the exam, some high school students
take it more than once to improve their scores. Since students are likely to care more about
entering into an elite university, it is impossible that the probability of being a repeated exam-
taker is higher in our sample around elite university cutoffs than that among all students. The
share of repeated exam-takers is 30% in our sample with a 20-point bandwidth. In Section
3, we find that there is no discontinuity in the probability of being a repeated exam-taker
around the cutoff. Moreover, our results are robust to restricting the sample to the first-time
exam-takers.
Data on University, Major and College Academic Performance Elite universities
are designated nationally by the government and known by students. The survey also covers
information on 13 majors broadly defined. We categorize them into three groups: STEM
(science, engineering, agriculture, medicine and college), Economics (including finance and
business)-Law-Management, and Humanity (philosophy, literature, history, art). As shown
in Table 1, they account for 65%, 24%, and 10% of the students respectively.
The survey also includes questions on the activities and performance of students in col-
lege. We will use these data to shed some light on what elite education brings to students.
For example, performance at national-levels standardized tests in college provides us some
information on human capital acquired in college. In addition, we also ask their perception
about their relative ranking within their college class. We will also examine how it affects
our finding on wage premium.
Data on Job Outcomes Our surveys are conducted in May and June, the last two months
in college for the graduating class. Thus, most of them already have a plan after graduation.
Around 50% of the sample report the best monthly wage offer they get (around 74% of the
sample searched for jobs). The mean and median monthly wage are 2,733 and 2,500 RMB.
11

We ask detailed information on job location, industry, occupation, and employer owner-
ship, which will be used to understand what drive the wage premium. Column (2) of Table
A3 presents the distributions of occupation and industry. As shown, the top two occupations
are professionals (49%) and clerks (28%); the top two industries are manufacturing (including
construction and mining, 25%) and IT broadly defined (15%, including information, computer
and software industry).
A limitation of our survey is that we cannot track an individual once he or she is on
the labor market. However, the importance of the first job in lifetime earnings has been
documented by recent studies using administrative data. For instance, Carr and Wiemers
(2016) show a large rank-rank correlation between the first-job wage and that in the future
career. No similar administrative data with job histories are available in China. We collect
job histories of around 300,000 individuals with wages from a major job search platform
(zhaopin.com) and examine the importance of the first job for the future outcomes in terms
of wages and elite status of the industry, occupation and ownership.
Data on Parental Characteristics Our survey covers detailed personal and family char-
acteristics including age, gender, residency, parents’ economic and political status etc. We
will check whether students are similar in these characteristics around the cutoffs.
With information on parents, we are also able to link parents’ income and occupation (or
industry and ownership) with children’s income and occupation (or industry and ownership).
We expect to see intergenerational links in income and occupation status. Our interest is to
examine whether this intergenerational link gets altered by the exam performance (and elite
education). Related to the literature on intergenerational mobility, we employ both a rank-
rank strategy (examining how the parent income rank affect child wage rank) and a log-log
strategy (estimating the correlation between log parental income and log child income).
3 Exam Scores and Access to Elite Education
3.1 The Impact on Access to Elite University
To examine how an individual’s exam score affects elite university enrollment, we use the
following specification:
EliteUnivi,p,y,tr = αE1(Scorei ≥ Cutp,y,tr)+θ1f(Scorei−Cutp,y,tr)+θ2f(Scorei−Cutp,y,tr)×1
+ λp,y,tr + εi,p,y,tr, (1)
where EliteUnivi,p,y,tr is a dummy indicating whether individual i in province p, year y and
(natural or social science) track tr attends an elite university. Scorei indicates individual i’s
12
exam score. The cutoff score for elite universities (Cutp,y,tr) varies by province-year-track.
The running variable in our analysis is (Scorei −Cutp,y,tr), namely the distance between
a student’s score and the cutoff score. f(Scorei − Cutp,y,tr) is a function to take the effect
of the running variable into consideration. To make sure our results are not driven by
certain functional form of f , we employ both the local linear non-parametric method and the
parametric method by including the linear-interaction or quadratic-interaction terms between
(Scorei − Cutp,y,tr) and 1(Scorei ≥ Cutp,y,tr).
When using the parametric method, we can control for province-year-track fixed effects
(λp,y,tr). All standard errors are clustered at the university level in the presented results and
they are also robust to clustering standard errors at the province level or the score level.
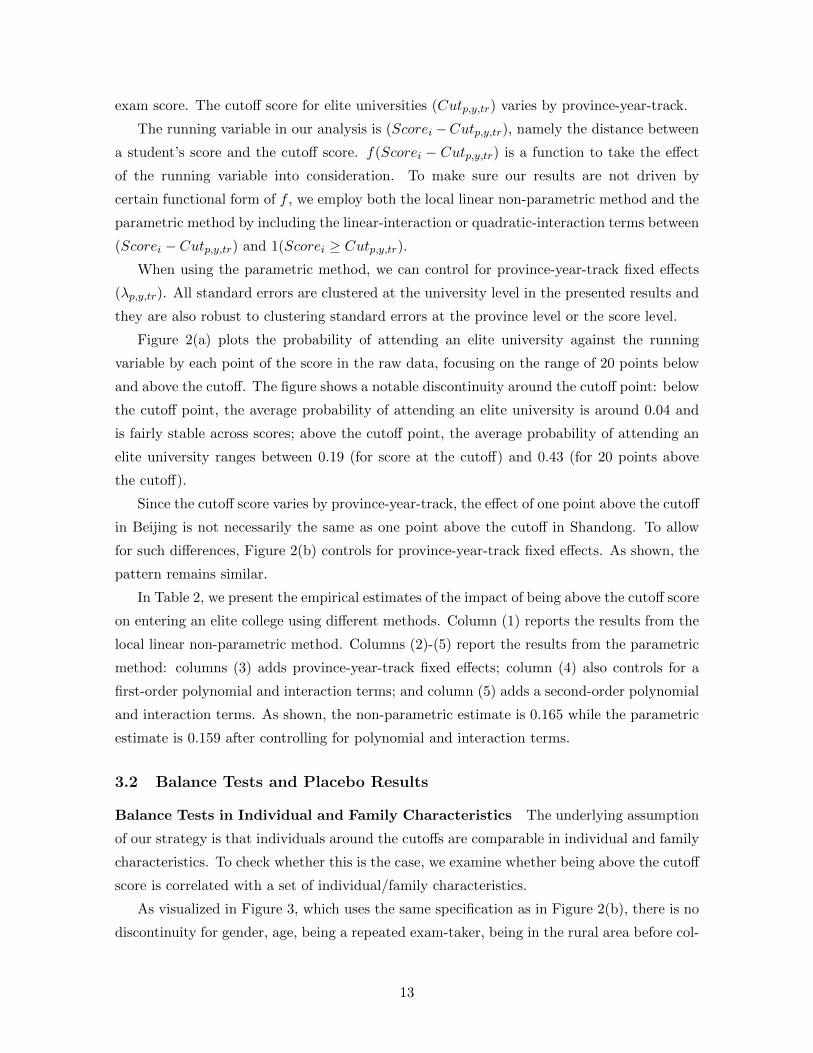
Figure 2(a) plots the probability of attending an elite university against the running
variable by each point of the score in the raw data, focusing on the range of 20 points below
and above the cutoff. The figure shows a notable discontinuity around the cutoff point: below
the cutoff point, the average probability of attending an elite university is around 0.04 and
is fairly stable across scores; above the cutoff point, the average probability of attending an
elite university ranges between 0.19 (for score at the cutoff) and 0.43 (for 20 points above
the cutoff).
Since the cutoff score varies by province-year-track, the effect of one point above the cutoff
in Beijing is not necessarily the same as one point above the cutoff in Shandong. To allow
for such differences, Figure 2(b) controls for province-year-track fixed effects. As shown, the
pattern remains similar.
In Table 2, we present the empirical estimates of the impact of being above the cutoff score
on entering an elite college using different methods. Column (1) reports the results from the
local linear non-parametric method. Columns (2)-(5) report the results from the parametric
method: columns (3) adds province-year-track fixed effects; column (4) also controls for a
first-order polynomial and interaction terms; and column (5) adds a second-order polynomial
and interaction terms. As shown, the non-parametric estimate is 0.165 while the parametric
estimate is 0.159 after controlling for polynomial and interaction terms.
3.2 Balance Tests and Placebo Results
Balance Tests in Individual and Family Characteristics The underlying assumption
of our strategy is that individuals around the cutoffs are comparable in individual and family
characteristics. To check whether this is the case, we examine whether being above the cutoff
score is correlated with a set of individual/family characteristics.
As visualized in Figure 3, which uses the same specification as in Figure 2(b), there is no
discontinuity for gender, age, being a repeated exam-taker, being in the rural area before col-
13

lege or father’s/mother’s income. We also conduct the same balance test for other attributes
including whether father/mother has a college degree, and whether father/mother is a Com-
munist Party member. Results presented in Appendix Table A4(a) show no discontinuity
around the cutoff for these characteristics.
Results Using Placebo Cutoffs The sharp discontinuity at the cutoff and the smoothness
at other points in Figure 2 already suggest that misreporting around the cutoff is unlikely to
be critical for our findings. Instead of the actual cutoff values, we conduct placebo tests using
values 5-points above and below the cutoffs. This test not only speaks to the validity of the
cutoffs, but also examines the importance of measurement error: if there is a systematic bias
of the reported scores, we would expect to see a similar effect with respect to these placebo
levels close to the actual cutoff values.
Results presented in Table 3 suggest that these placebo cutoff points do not consistently
generate discontinuity. Columns (1)-(3) present the results using the values 5-points above the
actual cutoffs whereas columns (4)-(6) present the results using the values 5-points below the
actual cutoffs. As shown, although the coefficient for the cutoff-plus-5 dummy is significant
when we control for the linear function of the running variable, the size of the coefficient
is small and it becomes negative an insignificant once we control for a quadratic function.
Overall, there is no similar discontinuity as robustly estimated for all models using the actual
cutoff score. These results validate our empirical strategy and also suggest that misreporting
about the cutoff is unlikely to be an important concern.
3.3 The Impacts on Majors and Others
As explained in the background, being above cutoff makes a student eligible to apply to
an elite university but he or she still needs to compete with other eligible students in the
admission process. As a result, a student faces tradeoffs such as the choice of university vs.
major, and which province to go to college. We examine three important factors that might
also affect wages.
Majors, University Location, and Perceived Ranking within College Class Those
slightly above the cutoff are in the worst position for the selection of majors in the recruitment
process of elite universities, while those below the cutoff are in the best position for non-elite
universities. This implies that they are likely to sort into different majors. For instance,
Economics-Management majors are known to be popular in recent years. Those above the
cutoff but are ranked lowest among elite university applicants are be less likely to get into
these majors.
14

On average, the probabilities of majoring in Economics-Management-Law for those above
the cutoff and below the cutoff are 21% and 26% respectively. Appendix Figure A2 (a)-(c)
plots the difference in the probability of majoring in Economics-Management-Law, STEM
and Humanity. The figures suggest that being above the cutoff is less likely to major in
Economics-Management-Law, which are the most popular majors in recent years. Columns
(1)-(6) of Table 4 show that the difference is not always precisely estimated.
Appendix Figure A2(d) plots the difference in the probability of attending an university
out of one’s home province. It suggests that being above the cutoff increases the probability
of attending an university out of one’s home province. This pattern is confirmed by the esti-
mations results in columns (7)-(8) of Table 4: being above the cutoff increases the probability
of attending a university out of home province by 0.07, around 20% of the mean (0.34). This
finding is consistent with fact elite universities are often located beyond one’s home province.
It is conceivable that the students who are just above the cutoff are likely to be worse
in terms of academic performance in their class, and this academic ranking might adversely
affect their job outcomes. In the survey, we ask about the perceived ranking within college
class by the students. There is a systematic upward bias in perception: over 46% of the
students claim to be the top 20% in their class whereas only 5% claim to be the bottom 20%
in their class. Even with the bias, there is a systematic difference around the cutoff: those
above the cutoff are less (or more) likely to perceive themselves as the top 20% (or bottom
20%) in class (shown in Figure A2 and columns (9)-(10) of Table 4).
We will consider how these factors affect our findings on wage premium in the next Section.
Conceptually, both major and class ranking are likely to bias our estimate of the return to
elite university education downward. Thus, the effect of elite education is likely to be larger
once we consider majors and relatively ranking. This is indeed what we find.
3.4 Results by Individual Characteristics
Is it possible that conditional on elite education eligibility, the probability of attending an
elite universities differ by individual characteristics? Such heterogeneity might arise for two
reasons. The first is the fairness of the recruitment process and the second is personal
choices. To this end, we check whether the response for these tradeoffs differ greatly with
individual characteristics such as gender, rural residence and family income. Specifically, we
examine how the interactions of 1(Scorei ≥ Cutp,y,tr) and individual characteristics affect
the probabilities of getting into an elite university, majoring in Economics-Management-Law,
going to an university out of one’s home province, and being the bottom 20% in college class.
As shown in Appendix Table A.5, we find no significant heterogeneity conditional on elite
education eligibility, showing that elite education eligibility is the most important criterion
15

in elite education recruitment. The possible tradeoff between elite education and other di-
mensions in Section 3.3 does not differ greatly across individuals. Given these results, it is
reasonable to start with investigating the average effect of elite education on labor market
outcomes.
4 Wage Premium and Other Dimensions of Elite Formation
In this section, we first examine the impact on wages. The finding provides the estimate
on elite university wage premium in China and speaks to existing studies on the returns to
elite education. Then, we come to other dimensions of elite formation that are important in
the Chinese context but may not be captured by wage per se. The latter can help us better
understand the implications of elite education.
4.1 Estimating the Wage Premium
We first estimate the reduced-form impact of being above the cutoff score of elite universities
on the best wage offer for the first job as well as evaluate the wage premium of elite educa-
tion. Then, we discuss the implications on elite formation of our finding and document the
importance of the first-job for future jobs. Before presenting the results on wages, we discuss
who choose to work after graduation.
Who Choose to Work? In our data, around 74% of the graduating cohorts have ever
searched for a job. Among those who searched for a job, 74% got at least one offer. As a
result, we have wage information for around half of our sample.
How does being above the cutoff affects the choice to work? We asked the students’
post-graduation plan in the survey. As shown in columns (1)-(8) of Table A6, those above
the cutoff are weakly less likely to work after graduation (4% less likely). This difference
is not explained by doing graduate study (with a mean of 19%)17 or going abroad (with a
mean of 3%). Instead, it is explained by the category of “unclear plan”. One explanation is
that those above the cutoff may have more options or higher reservation wages. Relatedly,
column (9) shows that those above the cutoff are weakly less likely to search for a job (4%
less likely). Column (10) shows that there is no significant difference in the probability of
getting an offer conditional on job search.
17The relationship between enrolling in elite university and going to graduate school is ambiguous. Onthe one hand, those from a non-elite university may be more likely to pursue a graduate degree in an eliteuniversity to improve their job prospects. On the other hand, it is easier for those from an elite university tocontinue their graduate studies within the same university. Empirically, we find no discountability in going tograduate schools around the elite university cutoff.
16
Thus, on the extensive margin, we find that those above the cutoff are slightly less likely
to search for a job. To check whether the selection is critical for our comparison around the
cutoff, we conduct another set of balance tests by restricting the sample to those who have
jobs. These results are presented in panel (b) of Appendix Table A4. Similar to the balance
tests in panel (a) for all the individuals within a 20-point bandwidth, the individuals are
comparable in all nine dimensions. Our results below focus on the sample with wage offers.
The Reduced-form and IV Estimates The reduced-form specification for wages is as
follows:
(ln)Wagei,p,y,tr = αW 1(Scorei ≥ Cutp,y,tr)+θ1f(Scorei−Cutp,y,tr)+θ2f(Scorei−Cutp,y,tr)×1
+ λp,y,tr + εi,p,y,tr, (2)
where the variables are defined in the same way as in equation (1).
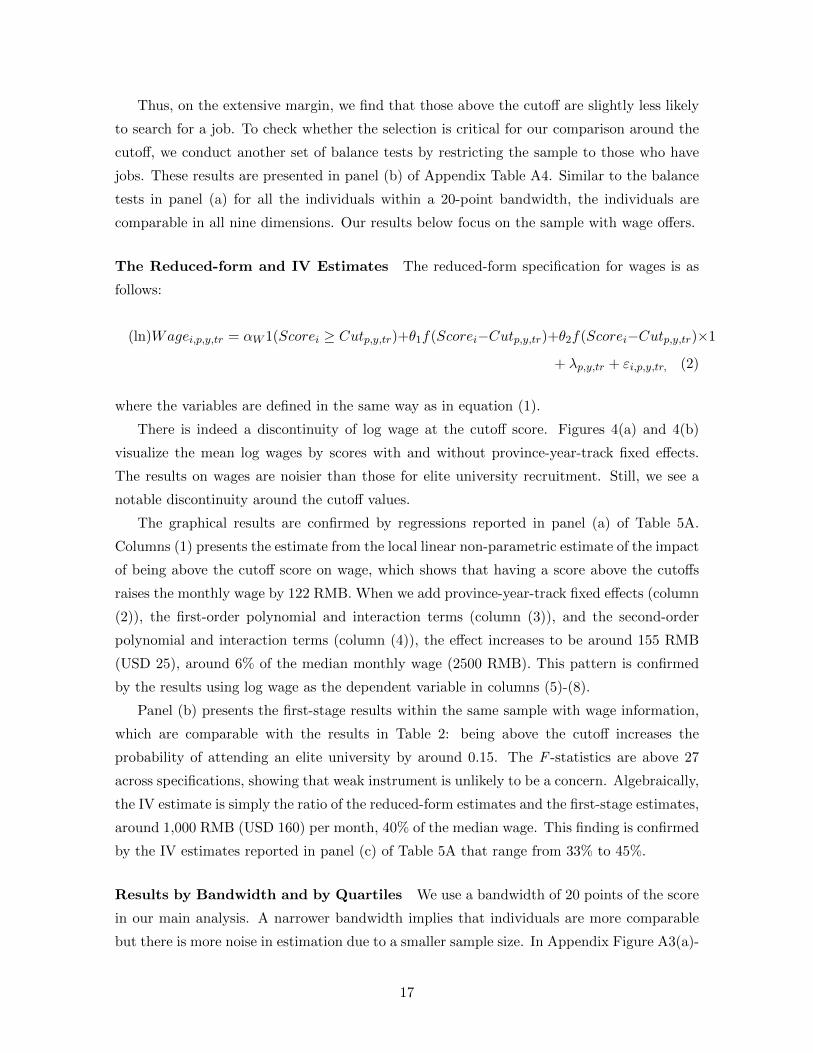
There is indeed a discontinuity of log wage at the cutoff score. Figures 4(a) and 4(b)
visualize the mean log wages by scores with and without province-year-track fixed effects.
The results on wages are noisier than those for elite university recruitment. Still, we see a
notable discontinuity around the cutoff values.
The graphical results are confirmed by regressions reported in panel (a) of Table 5A.
Columns (1) presents the estimate from the local linear non-parametric estimate of the impact
of being above the cutoff score on wage, which shows that having a score above the cutoffs
raises the monthly wage by 122 RMB. When we add province-year-track fixed effects (column
(2)), the first-order polynomial and interaction terms (column (3)), and the second-order
polynomial and interaction terms (column (4)), the effect increases to be around 155 RMB
(USD 25), around 6% of the median monthly wage (2500 RMB). This pattern is confirmed
by the results using log wage as the dependent variable in columns (5)-(8).
Panel (b) presents the first-stage results within the same sample with wage information,
which are comparable with the results in Table 2: being above the cutoff increases the
probability of attending an elite university by around 0.15. The F -statistics are above 27
across specifications, showing that weak instrument is unlikely to be a concern. Algebraically,
the IV estimate is simply the ratio of the reduced-form estimates and the first-stage estimates,
around 1,000 RMB (USD 160) per month, 40% of the median wage. This finding is confirmed
by the IV estimates reported in panel (c) of Table 5A that range from 33% to 45%.
Results by Bandwidth and by Quartiles We use a bandwidth of 20 points of the score
in our main analysis. A narrower bandwidth implies that individuals are more comparable
but there is more noise in estimation due to a smaller sample size. In Appendix Figure A3(a)-
17

(b), we plot the first-stage and the reduced-form estimates using different bandwidths ranging
from 5 (roughly 1.25 points per subject) to 40 points (10 points per subject), controlling for
province-year-track fixed effects and a quadratic polynomial and interaction terms. As shown,
the estimates are close to the baseline estimates, suggesting that our findings are not driven
by the IK-optimal bandwidth used in the baseline estimations.
We further check the impacts across the wage distribution. Appendix Figure A4 plots
the reduced-form results. While the estimates are lower at the tails, the impact is similar
across a large part of the distribution (from the 30th to the 80th percentiles). This result
shows that our finding on the wage premium is not driven by a very limited part of the wage
distribution.
The Impacts of Major, University Location and Relative Ranking To see how our
finding on wage premium is affected by other changes incurred by scoring above the cutoff
point as discussed in Section 3.3, we include 13 major fixed effects, 26 university location-
province fixed effects and five relative ranking within class fixed effects in the estimation of
equation (2).
Columns (2) and (4) of Table 5B show that including the major and ranking fixed effects
only marginally increases the baseline finding. This is consistent with the fact that those
above the cutoff have disadvantages in the choice of major and class ranking. Column (3)
shows that including university location marginally decreases the baseline finding, because
elite universities are more likely to be located in better developed provinces. Column (5) fur-
ther shows that our baseline findings increase marginally after we control for these additional
variables.
Finally, column (6) presents the results after including university fixed effects. Now, the
effect on wage premium disappears. This finding confirms that the wage premium reflects an
effect of universities.
4.2 Other Dimensions of Elite Formation
In the context of China, market income is only one measure of entering the elite class.
There are other important dimensions of being in the elite class that may not be easily
monetized, many of which are associated with the provision of public goods or perks from
government monopolies, such as getting into the banking industry, finding a job in a state-
owned enterprise, and obtaining hukou (the right to live in a city and enjoy local public goods)
of a well-funded municipal. To investigate these dimensions, we investigate both whether elite
education eligibility affects the entry into elite occupation/industry/ownership and whether
it affects non-wage benefits associated with the job.
18

For simplicity, we focus on the reduced-form results where the estimates can be interpreted
as the impact of elite education eligibility (defined as scoring above the cutoff). To get a sense
of the (IV) impact of elite education, one can divide the estimates by the first-stage effect
(around 0.15). Given a strong first stage shown in Table 5A, if the reduced-form estimate is
insignificant, it mechanically follows that the IV estimate is insignificant.
Elite Occupation, Industry and Ownership What is the elite occupation, industry
and ownership in China? Ex ante, we could define elite occupation, industry and ownership
by the general perception in China. For instance, a job in management is perceived as an
elite occupation; banking is known as an elite industry; and government-related industries are
commonly considered as elite industries. Other than these seemingly arbitrary definitions,
our data in fact allow us to statistically capture these perceptions.
In our survey, we not only asked the actual industry, occupation, and employer ownership
of the first job offers, but also asked students to report their perceived ideal industry, occu-
pation, and employer ownership (summarized in column (3) of Table A3). We call the ratio
of the realized job over the ideal job as the realization-hope ratio, which gives us a useful
measure of the elite status. For instance, if a lot of people hope to work in an industry but
very few can reach it, this industry is likely to be in the elite club.
The pattern documented from our data is actually consistent with the general perception
in China. For instance, occupations like managerial positions (in both public or private
organizations), business owners, and military/police, have a realization-hope ratio around
0.1-0.2. In contrast, clerks and skilled workers have a realization-hope ratio above 4. We
define the formal group as elite occupations. Similarly, government-related industries have
a realization-hope ratio of 0.13; the finance industry and the education-culture industry
have a ratio around 0.4-0.6. In contrast, mining/manufacturing/construction industries and
wholesale/retail have a ratio around 2. Thus, government-related and finance are reasonable
elite industries. As expected, state and foreign ownerships are elite ownerships. They have a
realization-hope ratio of 0.65, in contrast to a ratio of 2.4 for the private ownership.
With this definition, we examine how elite education eligibility affects the entry into elite
occupation, industry, and ownership. Columns (1)-(3) of Table 6A show that elite education
eligibility does not increase the probability of entering into these occupations. Similarly for
elite industries and ownership in columns (4)-(8), we find no evidence that elite education
eligibility increases the probability of entering these industries or ownerships.
Later in Section 5 on intergenerational mobility, we show that, in stark contrast, parental
elite status (defined the same way) does have a strong influence on the entry into these
occupations, industries and ownerships.
19

Non-Wage Benefits Another measure of elite class is the non-wage benefits on the job.
For instance, the hukou status is an important social indicator for big cities because hukou is
associated with access to public goods such as education, health care, pension etc. Another
example is that some privileged jobs may get more housing-subsidy, which is important given
the rising housing price in China.
Results reported in Appendix Table 6B show that elite education eligibility does not
bring more job-related benefits. We examine whether the job provides a local hukou status,
whether the job provides housing-subsidy and insurance, and whether the job is located in
major metropolitan cities (Beijing/Tianjin/Shanghai), and we find no impact on any of these
benefits.
Together with the results on occupation, industry and ownership, these findings suggest
that while elite education eligibility increases wages, it does not promise more benefits in
other dimensions important for the elite class. Section 5 provides more related discussion
when we compare the influence of family background with that of exam performance.
4.3 The Importance of the First Job
Our survey only allows us to link exam performance to first-job outcomes. However, it does
not allow us to trace the students once they are on the labor market. To investigate the
importance of the first-job, we collect the job histories of 304,021 individuals from a major
online recruitment platform (zhaopin.com). Individuals there report their monthly wage for
each job they have ever had by five categories (1 for below 1000 RMB, 2 for 1000-2000 RMB,
3 for 2001-4000 RMB, 4 for 4001-6000 RMB, and 5 for 6000 RMB and above) and information
on industry, occupation and employer’s ownership. With this information, we can examine
the correlation between first job characteristics with future job outcomes. Specifically, we
focus on the sample of individuals who have four-year college education and employ the
following specification:
Jobi,u,t = α1Jobi,u,1 +α2Jobi,u,1 ×EliteUniu + λu + γXi,t + γ′Xi,t ×EliteUniu + εi,u,t, (3)
where Jobi,u,t indicates the out of individual i who graduated from university u in t years
after the start of the first job and Jobi,u,1 is the characteristics of the first job. We also
take into consideration a few basic characteristics such as university fixed effects (λu) and
individuals’ age and gender and allow their impacts to vary with elite universities.
The characteristics of the first job is strongly correlated with those in the future years.
Columns (1) (and (2)) of Table A7 report the correlation between the first job wage rank
and the wage rank 1-5 years (and 6-10 years) after the start of the first job. Columns (3)-(8)
present the correlations in terms of elite industry, occupation, and ownership. In all cases,
20
the correlations are large and significant. For instance, if one starts in an elite industry, the
probabilities for him or her to stay in an elite industry in the next 1-5 or 6-10 years are 0.61
and 0.47. Therefore, these results suggest that our findings on the first job also matter for
the future. The correlation appears stronger for those from elite universities in terms of wage
rank. But we find no systematic difference between those from elite universities and the rest
in terms of industry, occupation and ownership.
These results suggest that our findings on the first job are also likely to matter for the
future. Of course, these results are not causal since we do not have exogenous variation in
the first job and elite education for this analysis.
5 The Impact on Social Mobility
5.1 Two Dimensions of the Question
How does elite education eligibility affect social mobility? This question has two dimensions.
The first is whether access to elite education lifts one from a low socioeconomic status to
a higher socioeconomic status. Our previous findings already suggest the answer: access to
elite education increases wage income and also the rank across income distribution.
The second dimension of this question is less unclear: does elite education eligibility
attenuate or strengthen intergenerational mobility? If one believes that elite education in
China levels the playing field and decreases the influence of parental influence, one would
expect to see an attenuation effects. Instead, the Bourdieu (1988) approach may suggest an
strengthening effect where elite education is exploited to strengthen the influence of parental
income.
Appendix Figure A5 illustrates the two theoretical possibilities, where the x-axis indicates
parental income rank and the y-xis indicates expected child’s income rank. In both cases,
being above the elite college cutoff increases the intercept, indicating a positive mobility in the
first dimension. The change in slopes captures the second dimension: being above the cutoff
decreases the intergeenerational slope and hence increases the intergenerational mobility in
case (a) and vise versa in case (b).
Below, we examine the pattern in the two dimensions in the data. We measure socioeco-
nomic status in terms of income and other important job-related status such as occupation,
industry, and ownership. Following the literature, we use both the rank-rank (e.g., Chetty
et al. 2014) and log-log specifications (e.g., Solon 1992) when examining income mobility.
Again, we focus on the reduced-form estimates, and an insignificant reduced-form estimate
implies an insignificant IV estimate, given a strong first stage in Table 5A.
21

5.2 Income Mobility
We first use a rank-rank approach by dividing parental income into five quintiles and rank it
from 1 to 5, with 1 meaning the lowest 20% in the parental income distribution in the whole
sample while 5 the top 20%. The median annual parental income for the top 20% is around
135,000 RMB, more than 10 folds of that for the bottom 20% group (around 9,000 RMB).
Similarly, we divide child wage into five quintiles and rank it from 1 to 5. Then, we employ
a log-log approach as an additional check.
The correlation between parental income rank and child wage rank, corr(Child Rank,
Parent Rank), captures the intergenerational mobility. Comparing the correlation for stu-
dents above the elite university cutoff and that below can capture the role of elite education
eligibility in altering intergenerational mobility.
Nonparametric Description Before presenting the estimation results, we first present
in Figure 5(a) a nonparametric description for students above and below the cutoff score
separately. For each value (1 to 5) of the parental rank in the x-axis, we plot the mean of
child rank using the same subsample as in the wage premium estimation (i.e., a bandwidth
of 20 points).
Some interesting patterns appear in Figure 5(a). First of all, as expected, there is a strong
and positive correlation between parental rank and child rank for both groups. Moreover,
the correlations are similar for the two groups, with a slope around 0.2 for both groups. The
difference lies in the intercept: the group above the cutoff has a higher intercept (around 0.25
higher). In other words, having a score above the cutoff helps an individual to move up in
the wage ladder by 0.25 quintile and this level-up effect is the same across parental income
rank groups. These results suggest that the correlation between parental rank and child rank
is not altered by scoring above the cutoff point of elite universities.
The importance of parental income rank relative to scoring high in affecting child wage
rank also suggests that the role of elite education eligibility in promoting mobility is limited.
For instance, for those from the top 20% parental income families, even if they have scores
below the cutoff, their average wage rank is still higher than that of all those above the cutoff
but from families in the other four income groups. To further shed light on the magnitude, we
plot the average probability of getting the top 20% wage for children by parental income ranks
in Figure 5(b). It shows that being above the cutoffs increases the probability of becoming
the top 20% wage earnings among college graduates across all parental ranks. However,
once again, for those from the top 20% families, even if they score below the cutoff, their
probability of earning the top 20% wage is higher than that of those above the cutoff but
from less wealthy families.
22

Regression Results We can use the following specification to quantify the pattern:
ChildRanki,p,y,tr = β11(Scorei ≥ Cutp,y,tr) × ParentRank + β2ParentRank + β31
θ1f(Scorei − Cutp,y,tr) + θ2f(Scorei − Cutp,y,tr) × 1 + λp,y,tr + εi,p,y,tr, (4)
where β3 (together with β1) captures the level effect of being above the cutoff on Child’s
wage rank, β2 (together with β1) measures the intergenerational link of income rank, and β1
captures the difference in the correlation between parental rank and child rank.
There is indeed a strong intergenerational correlation between parental income rank and
child wage rank, as shown by results reported in Table 7A. Column (1) shows that the
correlation between parental rank and child rank is around 0.18. Even though the magnitude
is meaningful, one cannot assume that it captures the broad intergenerational mobility in
China: we are studying a selected sample where even those blow the cutoffs attended a
university.
Column (2) adds the impact of elite education eligibility (0.34). The magnitude of the
impact of elite education eligibility is comparable to that of an increase in parental income
by about 1.8 quintiles. This impact is sizable but it is not large enough to lift a child from
an bottom 20% family to a top 20% wage group.
Elite education eligibility does not change the intergenerational correlation, as the coeffi-
cient for the interaction term of above cutoff and parental rank is not statistically significant
in column (3). Column (4) add province-year-track fixed effects and quadratic polynomial
interactions. As expected, the correlation between parental rank and child rank becomes
smaller. The main result on the interaction effect remains small and insignificant. These
estimation results confirm the nonparametric pattern in Figure 5: the wage premium of elite
education eligibility does not vary much with respect to parental income rank; or put differ-
ently, elite education eligibility does not alter the intergenerational mobility measured by the
correlation between parental income rank and child income rank.
In addition to the rank-rank approach, we also employ a log-log approach by replacing
ChildRank with lnWage, and ParentRank with lnParentIncome. The log-log estimation
results presented in columns (5)-(8) of Table 7A are consistent with the rank-rank results
discussed earlier. The correlation between log parent income and log child wage in a sim-
ple regression (column (5)) is around 0.07, and being above the cutoff is associated with a
wage premium but does not change the intergenerational wage correlation (column (7)). The
impact of being above the cutoff is comparable to that of 1.4-units increase in log parental
income. When we add province-year-track fixed effects and quadratic polynomial interactions
in column (8), the results are very similar except that the intergenerational correlation de-
ceases. Thus, the results from log-log specification imply the same pattern as in the rank-rank
23

specification.
5.3 Occupation/Industry/Ownership Mobility
We also examine the intergenerational links in terms of elite occupation, industry, and own-
ership status (defined in Section 2). Once again, results reported in Table 7B illustrate the
importance of parental background in determining the job outcomes of children. As shown,
the parental status is significantly correlated with child status in all three dimensions. The
impact of parental background is large compared with mean probability: having a parent
working in an elite occupation, industry, and ownership increases the probability of enter-
ing the elite occupation, industry, and ownership by around 33%, 64% and 24% respectively
(columns (1),(4),(7) of Table 7B). These are larger than the mobility in terms of income found
earlier. Similar to the results using income, elite education eligibility does not change the
intergenerational correlations in these job-related characteristics. As shown, the interaction
term is insignificant throughout Table 7B, meaning that elite education eligibility does not
change intergenerational mobility.
Together with the findings in Section 4, these results help us to better understand the
degree of mobility created by elite education eligibility. Elite education eligibility does have
a sizable impact on wage income, which is roughly comparable to that of an increase in
parental income by one quintile (around 1.5-2 folds increase in parental income). However,
no evidence suggests that it increases the probability of entering an elite occupation, elite
industry, or a state-owned enterprise, living in an elite city, obtaining hukou or any other
non-marketized benefit; in contrast, parental characteristics do.
The finding that the wage premium is neutral with respect to parental income illustrates
both the limitation and the merit of the exam system. It is an illusion to assume that the
influence of family background is attenuated by elite education eligibility. However, it is
also too pessimistic to think that the elite status only gets strengthened by the access to
elite education. The exam system is better in promoting social mobility than an alternative
system that creates scenario (b) in Figure A5.
6 Understanding the Mechanism
In this section, we explore potential mechanisms through which elite education has a wage
premium. In theory, there are typically three explanations: human capital (e.g., Becker
1993), social capital (e.g., Bourdieu and Passeron 1977), and signaling (e.g., Arrow 1973;
Spence 1973). As expected, it is challenging to really pin down each mechanism, our humble
attempt is to use as many proxies as possible and see which mechanisms are more consistent
with data.
24
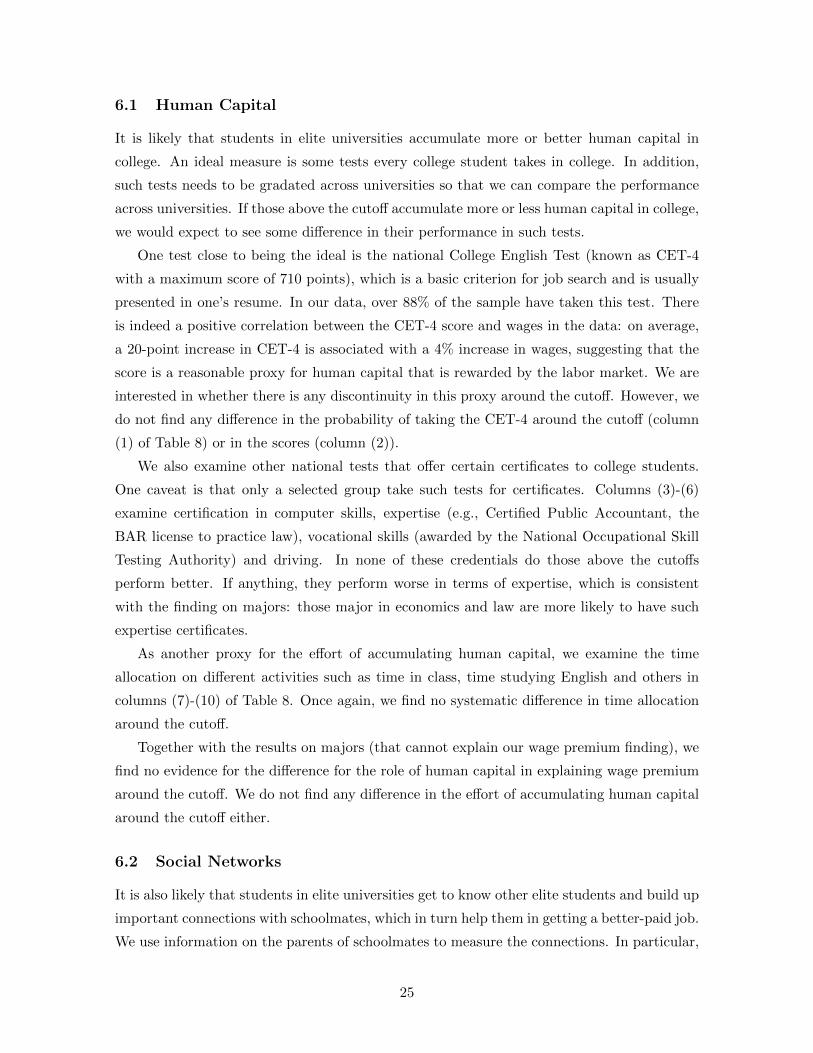
6.1 Human Capital
It is likely that students in elite universities accumulate more or better human capital in
college. An ideal measure is some tests every college student takes in college. In addition,
such tests needs to be gradated across universities so that we can compare the performance
across universities. If those above the cutoff accumulate more or less human capital in college,
we would expect to see some difference in their performance in such tests.
One test close to being the ideal is the national College English Test (known as CET-4
with a maximum score of 710 points), which is a basic criterion for job search and is usually
presented in one’s resume. In our data, over 88% of the sample have taken this test. There
is indeed a positive correlation between the CET-4 score and wages in the data: on average,
a 20-point increase in CET-4 is associated with a 4% increase in wages, suggesting that the
score is a reasonable proxy for human capital that is rewarded by the labor market. We are
interested in whether there is any discontinuity in this proxy around the cutoff. However, we
do not find any difference in the probability of taking the CET-4 around the cutoff (column
(1) of Table 8) or in the scores (column (2)).
We also examine other national tests that offer certain certificates to college students.
One caveat is that only a selected group take such tests for certificates. Columns (3)-(6)
examine certification in computer skills, expertise (e.g., Certified Public Accountant, the
BAR license to practice law), vocational skills (awarded by the National Occupational Skill
Testing Authority) and driving. In none of these credentials do those above the cutoffs
perform better. If anything, they perform worse in terms of expertise, which is consistent
with the finding on majors: those major in economics and law are more likely to have such
expertise certificates.
As another proxy for the effort of accumulating human capital, we examine the time
allocation on different activities such as time in class, time studying English and others in
columns (7)-(10) of Table 8. Once again, we find no systematic difference in time allocation
around the cutoff.
Together with the results on majors (that cannot explain our wage premium finding), we
find no evidence for the difference for the role of human capital in explaining wage premium
around the cutoff. We do not find any difference in the effort of accumulating human capital
around the cutoff either.
6.2 Social Networks
It is also likely that students in elite universities get to know other elite students and build up
important connections with schoolmates, which in turn help them in getting a better-paid job.
We use information on the parents of schoolmates to measure the connections. In particular,
25

for each individual, we first examine whether elite education eligibility is associated with
a higher share of schoolmates (excluding oneself) with parents in the Communist Party or
with college degree. Then, we check whether such shares correlate with wages. The share is
standardized to facilitate interpretation.
Elite education eligibility is indeed associated with a higher share of schoolmates (exclud-
ing oneself) with parents in the Communist Party or with college degree, reported in (1)-(2)
of Table 9. A higher share of schoolmates with parents in the Communist Party is associated
with a higher wage (column (4)) and the correlation is robust to controlling for one’s own
parental background (column (5)). A similar pattern exists for schoolmates with parents
with college degree (columns (6)-(7)).
The baseline finding (column (3)) decreases by about 12% once the two measures are
included. This is likely to be a lower bound of the impact of social networks – there are other
dimensions of networks unmeasured.
6.3 Signaling
While we have some relatively good proxies for human capital and social networks, it is almost
impossible to have tangible measures of signaling in observational data. Here, we provide
some suggestive evidence using information on job search.
Job Search Channels In the survey, we ask the job search channels one employs to
find a job. This information is useful to understand which factors are important in job
search. Students employ multiple channels: off-campus/on-campus job fairs, information
from teachers, job search websites or informal social networks.
Table 10A reports the impacts of elite education eligibility on different job search channels.
Among these channels, the only significant difference is that those above cutoff are more
likely to make use of on-campus job fairs (column (3)). The finding is consistent with an
interpretation of signaling: the reputation of universities attract more employers to campus.
Meanwhile, on-campus job fairs may indicate alumni networks, which we cannot measure
directly.
Discrimination in Job Search Our survey questions on various types of perceived dis-
crimination can also shed light on the mechanism. We asked in the survey yes/no questions
on whether students have experienced discrimination in terms of gender, hukou, accent and
physical appearance in job searching. Meanwhile, we also asked an open question for them to
describe any type of discrimination they have encountered. Around 10% of students answered
this open question. Among them, the top three types of discrimination are the university
rank or type of degree (36%), major (14%), and lack of experience (6%).
26
We examine whether being above the cutoff score affects different types of discrimination.
Columns (1)-(4) of Table 10 show that there is no significant difference in terms of gender,
hukou, accent or physical appearance. When coming to the answers to the open question,
we have a much smaller sample and do not have precisely estimated coefficients. Neverthe-
less, column (6) shows that students eligible for elite education are much less likely to feel
discriminated regarding university rank or degree. Once again, this finding shows that the
reputation of the university is important for the labor market.
Taken together, these results suggest that the wage premium is unlikely to be explained
by the role of human capital and that networks within universities and the reputation of
universities are important in explaining the wage premium. The “strict entrance, easy out”
in the college entrance-graduation system mentioned in the background is important for
understanding these findings. Due to the strict entrance rule, it is reasonable for employers
to infer information on students’ unobserved characteristics based on the tier of universities.
It may also partly explain our finding on the lack of human capital accumulation around
the cutoff. Almost everyone in college is promised graduation. As a result, students are not
strongly motivated to learn more for graduation.
7 Conclusion
The College Entrance Exam in China is often considered as a test that determines the course
of life. It also provides an ideal laboratory to examine the role of elite education. Yet little
is known whether a better exam performance really changes a young person’s fate. In this
study, we endeavor to collect systematic data on exam performance and link it to the access
to elite education as well as labor market outcomes. We document that the exam system
does play an important role in elite university recruitment: there exists a clear discontinuity
in the probability of entering elite university around the cutoff scores. The discontinuity
also matters for the job market outcomes in terms of wages. However, the impact of elite
education (eligibility) on elite formation and intergenerational mobility seems limited. We
find no evidence that it entails one’s entry into the elite occupation or industry. It does not
alter the influence of family background either.
Our findings make a useful contribution to the growing literature on elite education.
Besides estimating the returns, our study contributes to understanding how the access to
elite education affects elite formation and social mobility, which also opens new avenues of
research on other elite education institutions. They also uncover the relative importance of
elite education eligibility and family background in determining wages and other outcomes –
a central, yet understudied issue in Chinese labor market.
27

References
[1] Acemoglu, Daron, and James A. Robinson (2008), “Persistence of Power, Elites and
Institutions”, American Economic Review, American Economic Review, 98(1): 267-293.
[2] Anelli, Massimo (2016), “Returns to Elite College Education: a Quasi-Experimental Anal-
ysis”, Bocconi University, mimeo.
[3] Arcidiacono, Peter and Mike Lovenheim (2016), “Affirmative Action and the Quality-Fit
Tradeoff”, Journal of Economic Literature 54(1), 3-51.
[4] Arrow, Kenneth (1973), “Higher Education as a Filter”, Journal of Public Economics
2(3): 193-216.
[5] Bai, Ying, and Ruixue Jia (2016), “Elite Recruitment and Political Stability: The Impact
of the Abolition of China’s Civil Service Exam,” Econometrica 84(2): 677-733.
[6] Becker, Gary (1993), Human Capital: A Theoretical and Empirical Approach with Special
References to Education, Chicago: University of Chicago.
[7] Battistin, Erich, Agar Brugiavini, Enrico Rettore, and Guglielmo Weber (2009), “The
Retirement Consumption Puzzle: Evidence from a Regression Discontinuity Approach,”
American Economic Review 99(5): 2209-2226.
[8] Black, Dan A., and Jeffrey A. Smith (2004), “How Robust is the Evidence on the Effects
of College Quality? Evidence from Matching,” Journal of Econometrics 121(1): 99-124.
[9] Bourdieu, Pierre (1988), The State Nobility: Elite Schools in the Field of Power, Stanford
University Press.
[10] Bourdieu, Pierre, and Jean-Claude Passeron (1977), Reproduction in Education, Society
and Culture, Sage Publications.
[11] Bregnbaek, Susanne (2016), Fragile Elite: The Dilemmas of China’s Top University
Students, Stanford University Press.
[12] Carnoy, M., Loyalka, P., Dobryakova, M., Dossani, R., Froumin, I., Kuhns, K., Tilak, J.
and Wang, R., (2013), University Expansion in a Changing Global Economy: Triumph of
the BRICs? Stanford University Press.
[13] Carr, Michael and Emily E. Wiemers (2016), “The Decline in Lifetime Earnings Mobility
in the U.S.: Evidence from Survey-Linked Administrative Data”, Mimeo.
[14] Chen, Yan, and Onur Kesten (2016), “Chinese College Admissions and School Choice
Reforms: A Theoretical Analysis,” Journal of Political Economy, forthcoming.
[15] Chen Yuyu, Suresh Naidu, and Tinghua Yu (2015), “Intergenerational Mobility and
Institutional Change in 20th Century China”, Explorations in Economic History 58: 44-
73.
[16] Chetty, Raj, Nathaniel Hendren, Patrick Kline and Emmanuel Saez (2014), “Where is
the land of Opportunity? The Geography of Intergenerational Mobility in the United
States,” Quarterly Journal of Economics 129(4): 1553-1623.
[17] Dale, Stacy and Alan Krueger (2002), “Estimating the Payoff to Attending a More Selec-
tive College: An Application of Selection on Observables and Unobservables,” Quarterly
28

Journal of Economics 117(4): 1491-1527.
[18] Dale, Stacy and Alan Krueger (2011), “Estimating the Return to College Selectivity
over the Career using Administrative Earnings Data,” NBER Working Paper #17159.
[19] Erikson, Robert, and John H. Goldthorpe (1992), The Constant Flux: A Study of Class
Mobility in Industrial Societies, Oxford University Press.
[20] Erikson, Robert, and John H. Goldthorpe (2002), “Intergenerational Inequality: A So-
ciological Perspective,” Journal of Economic Perspectives 16 (3): 31-44.
[21] Gelman, Andrew. and Gudio Imbens (2014), “Why High-Order Polynomials Should Not
Be Used in Regression Discontinuity Designs,” NBER Working Paper #20405.
[22] Hastings, Justine, Christopher Neilson, and Seth Zimmerman (2013), “Are Some Degrees
Worth More than Others? Evidence from College Admission Cutoffs in Chile,” NBER
Working Paper 19241
[23] Hoekstra, Mark (2009), “The Effect of Attending the Flagship State University on Earn-
ings: A Discontinuity-Based Approach,” Review of Economics and Statistics 91 (4): 717-
724.
[24] Hoxby, Caroline (2009), “The Changing Selectivity of American Colleges,” Journal of
Economic Perspectives 23(4): 95-118.
[25] Imbens, Guido, and Karthik Kalyanaraman (2011), “Optimal Bandwidth Choice for the
Regression Discontinuity Estimation,” Review of Economic Studies: rdr043.
[26] Li, Hongbin, Lingsheng Meng, Xinzheng Shi and Binzhen Wu (2012), “Does Attending
Elite Colleges Pay in China”, Journal of Comparative Economics, 40: 78-88.
[27] Mosca, Gaetano (1939), The Ruling Class, New York, NY: McGraw-Hill.
[28] North, Douglass C., John Joseph Wallis, and Barry R. Weingast (2009), Violence and
Social Orders, Cambridge: Cambridge University Press.
[29] Solon, Gary (1992), “Intergenerational Income Mobility in the United States,” American
Economic Review 82 (3): 393-408.
[30] Pareto, Vilfredo (1916),The Mind and Society, New York: Harcourt, Brace & Company
(translated in 1935).
[31] Spence, Michael (1973), “Job Market Signaling,” Quarterly Journal of Economics 87(3):
355-374.
[32] Wong, Edward (2012), “Test That Can Determine the Course of Life Gets
a Closer Examination”, http://www.nytimes.com/2012/07/01/world/asia/
burden-of-chinas-college-entrance-test-sets-off-wide-debate.html?_r=0
[33] Zimmerman, Seth (2016), “Making Top Managers: The Role of Elite Universities and
Elite Peers,” mimeo, University of Chicago.
29

Figure 1: The Distribution of Exam Scores in the Survey Data
(a) The Whole Sample (b) Within the 20-point Bandwidth
(c) Elite Universities (d) Non-elite Universities
Notes: Figure (a) plots the distribution of exam scores in our survey data. Figure (b) takes a closer look at the 20-point bandwidth and shows that there is no significantdiscontinuity at the elite university cutoff line. Figures (c) and (d) plot the distribution of exam scores for elite universities and non-elite universities respectively. Since weintentionally oversampled elite schools, the density and frequency are weighted by the sampling weight of schools. Note that the scores are not necessarily comparable acrossprovince-year-track. We make comparison within province-year-track in our analysis.
30

Figure 2: Exam Scores and Elite (the First-Tier) University Enrollment
(a) Pattern from the Raw Data (b) Pattern after Isolating Province-Year-Track FEs
Notes: This figure plots the probability of attending an elite university by distance to the cutoff scores (that vary by province-year-track). Figure (a) is based on raw data and
Figure (b) controls for province-year-track FEs. They show a notable discontinuity in the enrollment probability around the cutoff value.
31

Figure 3: Balance Tests of Individual and Family Characteristics (More in Appendix Table A.3)
(a) Male (b) Age (c) Repeated Exam Takers
(d) Rural (e) Ln Father’s Income (f) Ln Mother’s Income
Notes: This figure shows that there is no similar discontinuity in many individual characteristics around the cutoff. Province-year-track FEs are controlled for in these figures.
The patterns are similar without these FEs. Appendix A.4 presents more related results.
32

Figure 4: Elite Education and Wage Premium
(a) Pattern from the Raw Data (b) Pattern after Isolating Province-Year-Track FEs
Notes: This figure plots the mean log wages by distance to the cutoff scores (that vary by province-year-track). Panel (a) is based on raw data and panel (b) controls for
province-year-track FEs. They show a notable discountability around the cutoff.
33
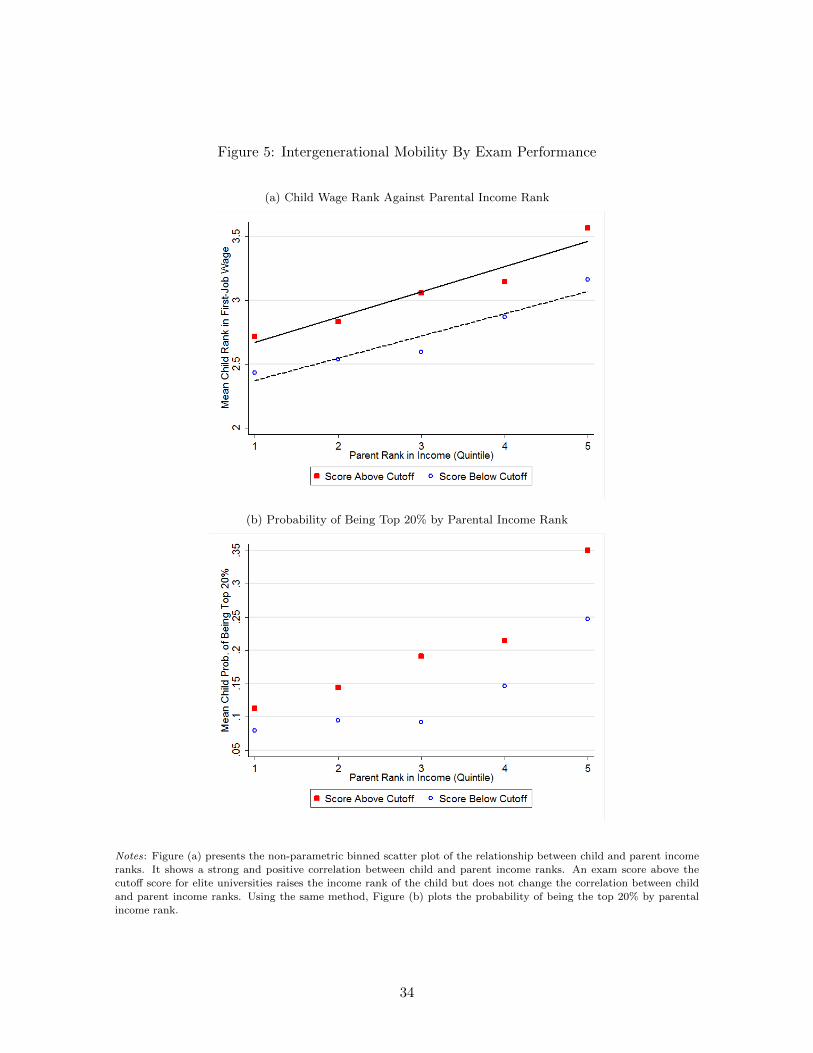
Figure 5: Intergenerational Mobility By Exam Performance
(a) Child Wage Rank Against Parental Income Rank
(b) Probability of Being Top 20% by Parental Income Rank
Notes: Figure (a) presents the non-parametric binned scatter plot of the relationship between child and parent income
ranks. It shows a strong and positive correlation between child and parent income ranks. An exam score above the
cutoff score for elite universities raises the income rank of the child but does not change the correlation between child
and parent income ranks. Using the same method, Figure (b) plots the probability of being the top 20% by parental
income rank.
34
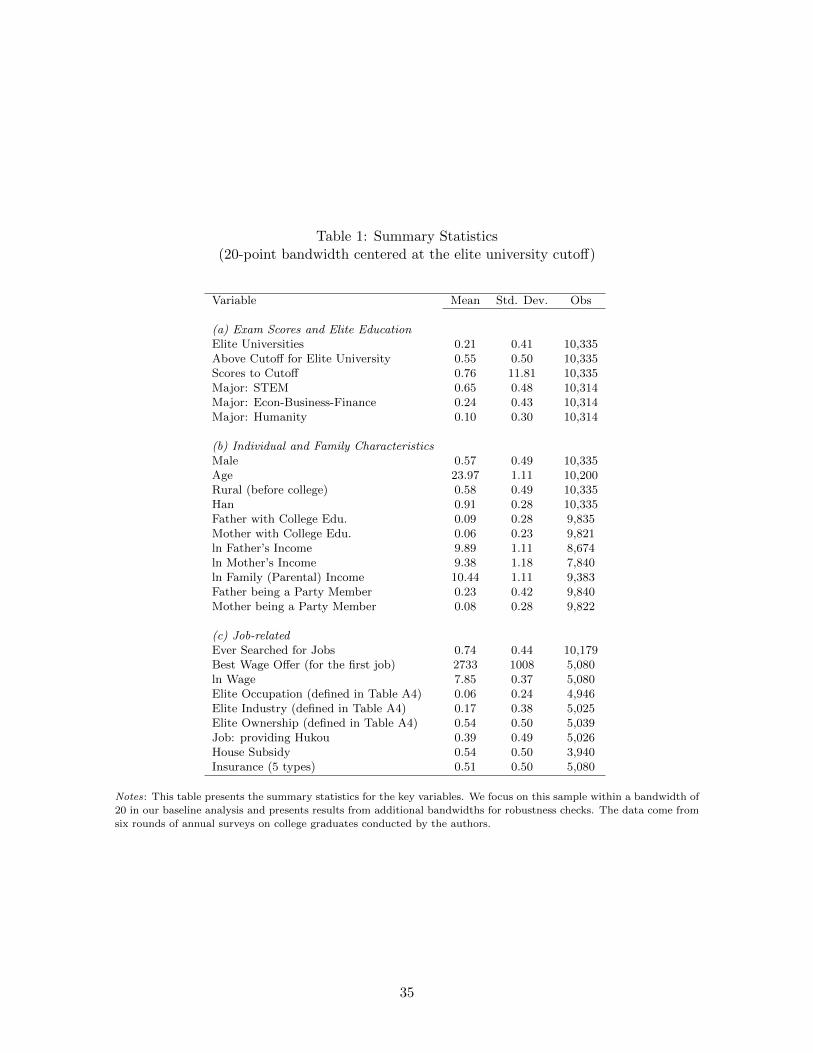
Table 1: Summary Statistics(20-point bandwidth centered at the elite university cutoff)
Variable Mean Std. Dev. Obs
(a) Exam Scores and Elite EducationElite Universities 0.21 0.41 10,335Above Cutoff for Elite University 0.55 0.50 10,335Scores to Cutoff 0.76 11.81 10,335Major: STEM 0.65 0.48 10,314Major: Econ-Business-Finance 0.24 0.43 10,314Major: Humanity 0.10 0.30 10,314
(b) Individual and Family CharacteristicsMale 0.57 0.49 10,335Age 23.97 1.11 10,200Rural (before college) 0.58 0.49 10,335Han 0.91 0.28 10,335Father with College Edu. 0.09 0.28 9,835Mother with College Edu. 0.06 0.23 9,821ln Father’s Income 9.89 1.11 8,674ln Mother’s Income 9.38 1.18 7,840ln Family (Parental) Income 10.44 1.11 9,383Father being a Party Member 0.23 0.42 9,840Mother being a Party Member 0.08 0.28 9,822
(c) Job-relatedEver Searched for Jobs 0.74 0.44 10,179Best Wage Offer (for the first job) 2733 1008 5,080ln Wage 7.85 0.37 5,080Elite Occupation (defined in Table A4) 0.06 0.24 4,946Elite Industry (defined in Table A4) 0.17 0.38 5,025Elite Ownership (defined in Table A4) 0.54 0.50 5,039Job: providing Hukou 0.39 0.49 5,026House Subsidy 0.54 0.50 3,940Insurance (5 types) 0.51 0.50 5,080
Notes: This table presents the summary statistics for the key variables. We focus on this sample within a bandwidth of
20 in our baseline analysis and presents results from additional bandwidths for robustness checks. The data come from
six rounds of annual surveys on college graduates conducted by the authors.
35
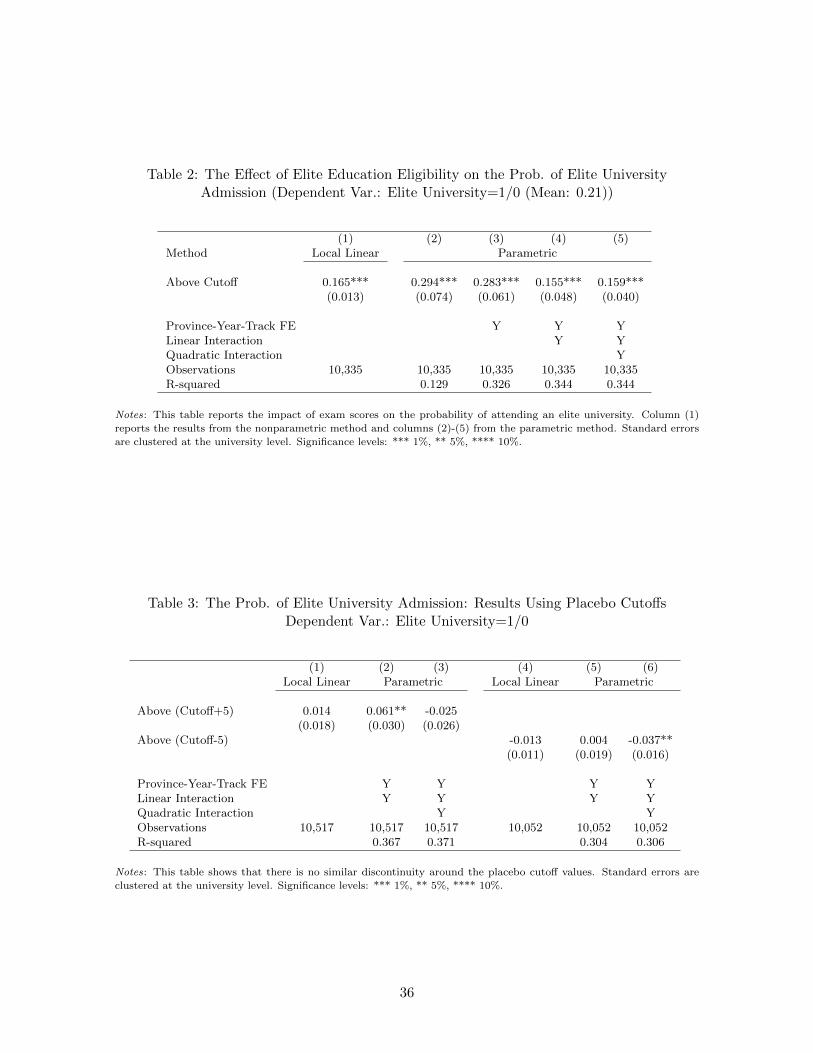
Table 2: The Effect of Elite Education Eligibility on the Prob. of Elite UniversityAdmission (Dependent Var.: Elite University=1/0 (Mean: 0.21))
(1) (2) (3) (4) (5)Method Local Linear Parametric
Above Cutoff 0.165*** 0.294*** 0.283*** 0.155*** 0.159***(0.013) (0.074) (0.061) (0.048) (0.040)
Province-Year-Track FE Y Y YLinear Interaction Y YQuadratic Interaction YObservations 10,335 10,335 10,335 10,335 10,335R-squared 0.129 0.326 0.344 0.344
Notes: This table reports the impact of exam scores on the probability of attending an elite university. Column (1)
reports the results from the nonparametric method and columns (2)-(5) from the parametric method. Standard errors
are clustered at the university level. Significance levels: *** 1%, ** 5%, **** 10%.
Table 3: The Prob. of Elite University Admission: Results Using Placebo CutoffsDependent Var.: Elite University=1/0
(1) (2) (3) (4) (5) (6)Local Linear Parametric Local Linear Parametric
Above (Cutoff+5) 0.014 0.061** -0.025(0.018) (0.030) (0.026)
Above (Cutoff-5) -0.013 0.004 -0.037**(0.011) (0.019) (0.016)
Province-Year-Track FE Y Y Y YLinear Interaction Y Y Y YQuadratic Interaction Y YObservations 10,517 10,517 10,517 10,052 10,052 10,052R-squared 0.367 0.371 0.304 0.306
Notes: This table shows that there is no similar discontinuity around the placebo cutoff values. Standard errors are
clustered at the university level. Significance levels: *** 1%, ** 5%, **** 10%.
36

Table 4: The Effect of Elite Education Eligibility on Major, Univ. Location and Relative Ranking in College
(1) (2) (3) (4) (5) (6) (7) (8) (9) (10)Major
Econ-Manage.-LawMajorSTEM
MajorHumanity
University locationOut of Home Province
Reported to bebtm 20% in college class
Mean 0.24 0.65 0.10 0.34 0.06Method Local Linear Parametric Local Parametric Local Parametric Local Parametric Local Parametric
Above Cutoff -0.034* -0.041 -0.006 0.025 0.040*** 0.018 0.079*** 0.071** 0.033*** 0.047***(0.018) (0.029) (0.020) (0.029) (0.013) (0.012) (0.020) (0.032) (0.010) (0.015)
Province-Year-Track FE Y Y Y Y YLinear Interaction Y Y Y Y YQuadratic Interaction Y Y Y Y YObservations 10,314 10,314 10,314 10,314 10,314 10,314 10,335 10,335 10,059 10,059R-squared 0.240 0.515 0.322 0.524 0.053
Notes: This table shows that those above the cutoff are (i) weakly less likely to major in Econ-Management-Law, (ii) more likely to attend an university out of one’s home
province, and (iii) are more likely to perceive themselves at the bottom 20% in college class. We will examine how these factors affect our finding on wage premium. Standard
errors are clustered at the university level. Significance levels: *** 1%, ** 5%, **** 10%.
37
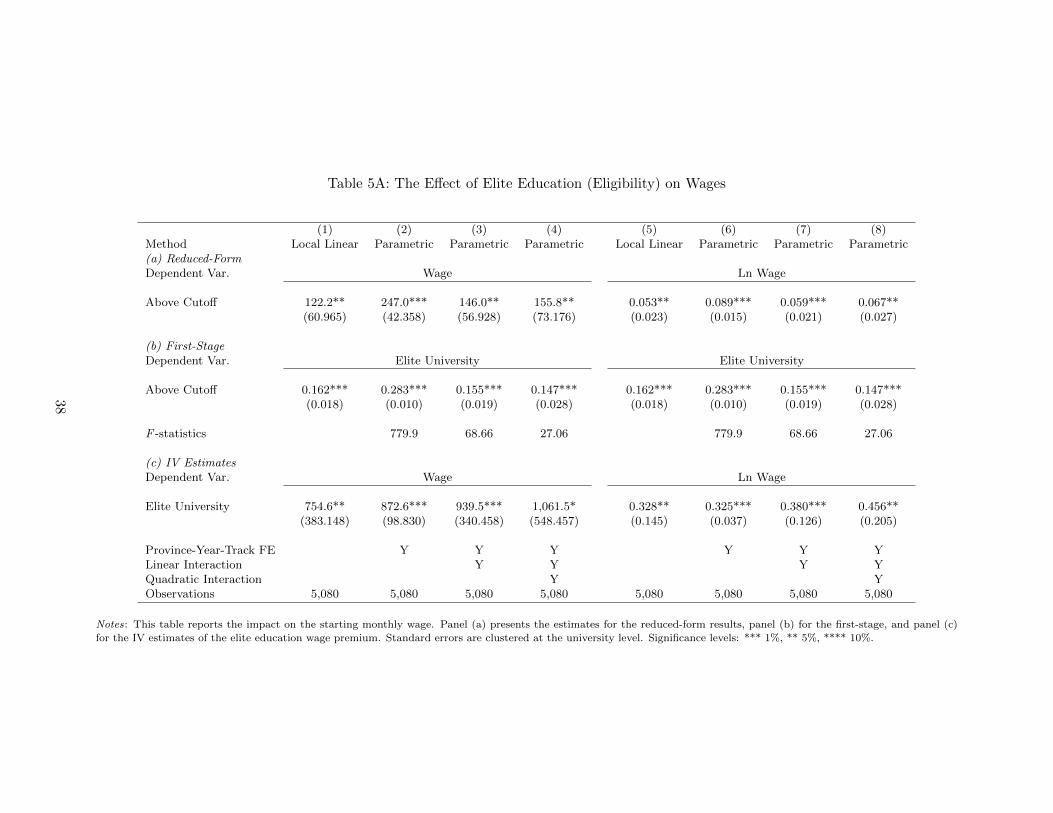
Table 5A: The Effect of Elite Education (Eligibility) on Wages
(1) (2) (3) (4) (5) (6) (7) (8)Method Local Linear Parametric Parametric Parametric Local Linear Parametric Parametric Parametric(a) Reduced-FormDependent Var. Wage Ln Wage
Above Cutoff 122.2** 247.0*** 146.0** 155.8** 0.053** 0.089*** 0.059*** 0.067**(60.965) (42.358) (56.928) (73.176) (0.023) (0.015) (0.021) (0.027)
(b) First-StageDependent Var. Elite University Elite University
Above Cutoff 0.162*** 0.283*** 0.155*** 0.147*** 0.162*** 0.283*** 0.155*** 0.147***(0.018) (0.010) (0.019) (0.028) (0.018) (0.010) (0.019) (0.028)
F -statistics 779.9 68.66 27.06 779.9 68.66 27.06
(c) IV EstimatesDependent Var. Wage Ln Wage
Elite University 754.6** 872.6*** 939.5*** 1,061.5* 0.328** 0.325*** 0.380*** 0.456**(383.148) (98.830) (340.458) (548.457) (0.145) (0.037) (0.126) (0.205)
Province-Year-Track FE Y Y Y Y Y YLinear Interaction Y Y Y YQuadratic Interaction Y YObservations 5,080 5,080 5,080 5,080 5,080 5,080 5,080 5,080
Notes: This table reports the impact on the starting monthly wage. Panel (a) presents the estimates for the reduced-form results, panel (b) for the first-stage, and panel (c)
for the IV estimates of the elite education wage premium. Standard errors are clustered at the university level. Significance levels: *** 1%, ** 5%, **** 10%.
38

Table 5B: The Effect of Elite Education Eligibility on Wages: Including Other DimensionsDependent Var.: ln Wage
(1) (2) (3) (4) (5) (6)Major FEs (13) Y YUniv. Province FEs (26) Y YCollege Class Rank FEs (5) Y YUniversity FEs (82) Y
Above Cutoff 0.067** 0.070** 0.059** 0.082*** 0.075*** 0.029(0.027) (0.027) (0.027) (0.026) (0.027) (0.026)
Province-Year-Track FE Y Y Y Y Y YLinear Interaction Y Y Y Y Y YQuadratic Interaction Y Y Y Y Y YObservations 5,078 5,075 5,080 4,994 4,991 5,080R-squared 0.273 0.290 0.290 0.275 0.309 0.320
Notes: This table shows that including majors and relative ranking in college marginally increases our baseline finding,
consistent with the fact that those just above the cutoffs are worse compared with their peers. Standard errors are
clustered at the university level. Significance levels: *** 1%, ** 5%, **** 10%.
39
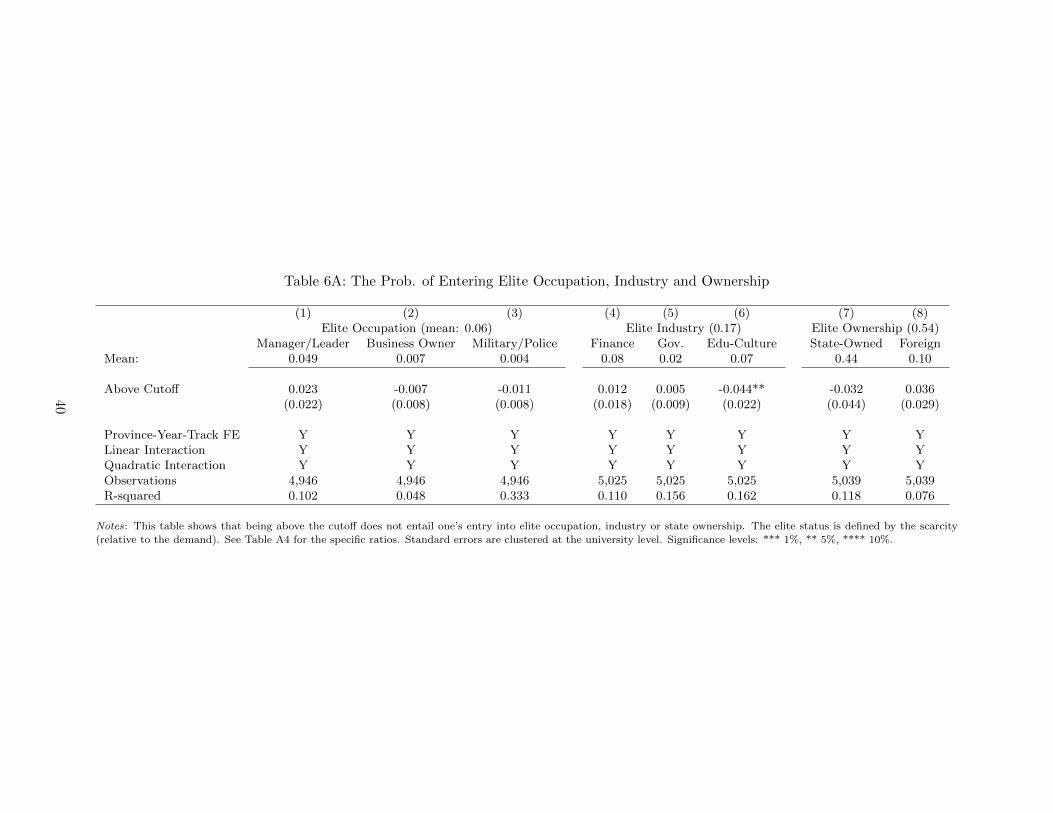
Table 6A: The Prob. of Entering Elite Occupation, Industry and Ownership
(1) (2) (3) (4) (5) (6) (7) (8)Elite Occupation (mean: 0.06) Elite Industry (0.17) Elite Ownership (0.54)
Manager/Leader Business Owner Military/Police Finance Gov. Edu-Culture State-Owned ForeignMean: 0.049 0.007 0.004 0.08 0.02 0.07 0.44 0.10
Above Cutoff 0.023 -0.007 -0.011 0.012 0.005 -0.044** -0.032 0.036(0.022) (0.008) (0.008) (0.018) (0.009) (0.022) (0.044) (0.029)
Province-Year-Track FE Y Y Y Y Y Y Y YLinear Interaction Y Y Y Y Y Y Y YQuadratic Interaction Y Y Y Y Y Y Y YObservations 4,946 4,946 4,946 5,025 5,025 5,025 5,039 5,039R-squared 0.102 0.048 0.333 0.110 0.156 0.162 0.118 0.076
Notes: This table shows that being above the cutoff does not entail one’s entry into elite occupation, industry or state ownership. The elite status is defined by the scarcity
(relative to the demand). See Table A4 for the specific ratios. Standard errors are clustered at the university level. Significance levels: *** 1%, ** 5%, **** 10%.
40

Table 6B: The Probability of Enjoying Job-related Non-Wage Benefits
(1) (2) (3) (4) (5) (6) (7) (8)Provide Hukou Housing subsidy 5-type Insurance Beijing/Tianjin/Shanghai
Mean 0.39 0.54 0.51 0.19Local Parametric Local Parametric Local Parametric Local Parametric
Above Cutoff -0.029 0.029 -0.025 -0.039 0.045 0.048 -0.040 -0.027(0.030) (0.057) (0.035) (0.057) (0.031) (0.040) (0.025) (0.029)
Province-Year-Track FE Y Y Y YLinear Interaction Y Y Y YQuadratic Interaction Y Y Y YObservations 5,026 5,026 3,940 3,940 5,080 5,080 4,888 4,888R-squared 0.182 0.094 0.295 0.515
Notes: This table reports the results on non-wage benefits around the cutoffs, where we find no discontinuity. This is consistent with the fact that such benefits are often
associated with occupation or industry. Standard errors are clustered at the university level. Significance levels: *** 1%, ** 5%, **** 10%.
41
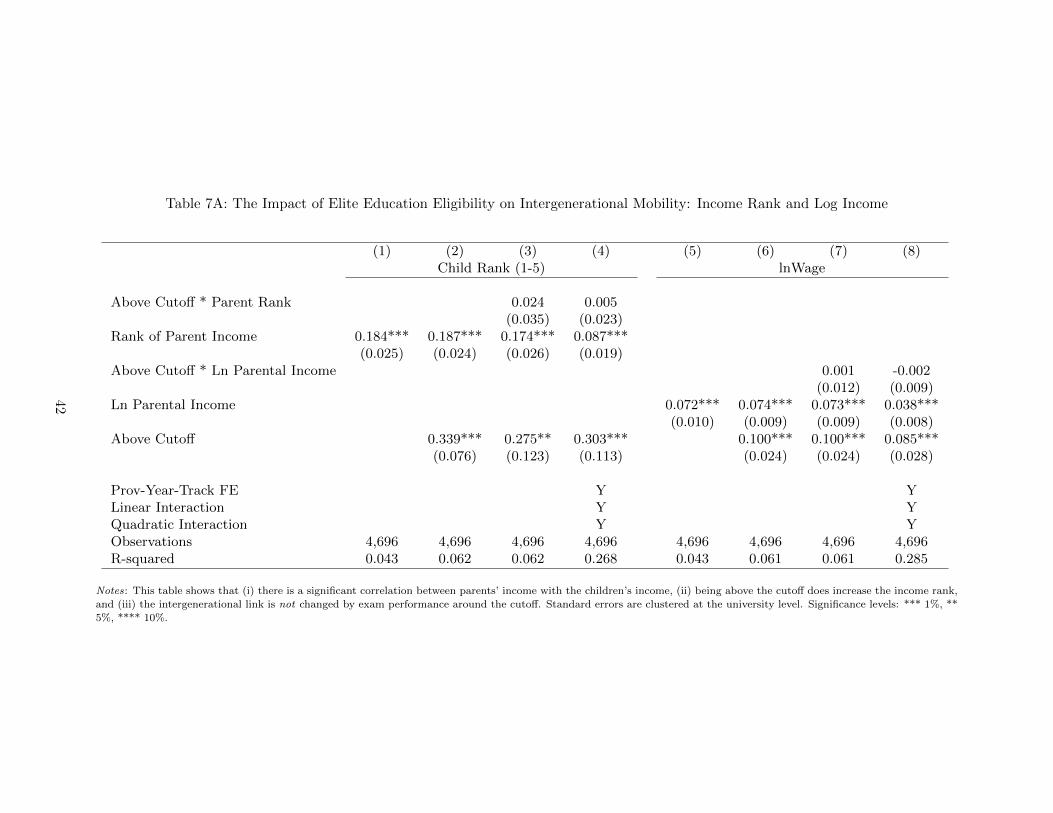
Table 7A: The Impact of Elite Education Eligibility on Intergenerational Mobility: Income Rank and Log Income
(1) (2) (3) (4) (5) (6) (7) (8)Child Rank (1-5) lnWage
Above Cutoff * Parent Rank 0.024 0.005(0.035) (0.023)
Rank of Parent Income 0.184*** 0.187*** 0.174*** 0.087***(0.025) (0.024) (0.026) (0.019)
Above Cutoff * Ln Parental Income 0.001 -0.002(0.012) (0.009)
Ln Parental Income 0.072*** 0.074*** 0.073*** 0.038***(0.010) (0.009) (0.009) (0.008)
Above Cutoff 0.339*** 0.275** 0.303*** 0.100*** 0.100*** 0.085***(0.076) (0.123) (0.113) (0.024) (0.024) (0.028)
Prov-Year-Track FE Y YLinear Interaction Y YQuadratic Interaction Y YObservations 4,696 4,696 4,696 4,696 4,696 4,696 4,696 4,696R-squared 0.043 0.062 0.062 0.268 0.043 0.061 0.061 0.285
Notes: This table shows that (i) there is a significant correlation between parents’ income with the children’s income, (ii) being above the cutoff does increase the income rank,
and (iii) the intergenerational link is not changed by exam performance around the cutoff. Standard errors are clustered at the university level. Significance levels: *** 1%, **
5%, **** 10%.
42

Table 7B: The Impact of Elite Education Eligibility on Intergenerational Mobility: Occupation, Industry and Ownership
(1) (2) (3) (4) (5) (6) (7) (8) (9)Elite Occupation Elite Industry Elite Ownership
Mean 0.06 0.17 0.54
Above Cutoff * Elite Parent (Occ) -0.004 0.005(0.018) (0.018)
Elite Parent (Occ) 0.020** 0.022 0.008(0.008) (0.014) (0.013)
Above Cutoff * Elite Parent (Industry) 0.019 0.003(0.046) (0.041)
Elite Parent (Industry) 0.109*** 0.099*** 0.073**(0.027) (0.037) (0.032)
Above Cutoff * Elite Parent (Ownership) -0.045 -0.014(0.037) (0.036)
Elite Parent (Ownership) 0.130*** 0.156*** 0.082***(0.023) (0.028) (0.029)
Above Cutoff -0.005 -0.004 0.003 -0.020 -0.023 -0.027 0.054* 0.065** 0.004(0.008) (0.008) (0.025) (0.022) (0.022) (0.027) (0.028) (0.030) (0.044)
Prov-Year-Track FEs Y Y YLinear Interaction Y Y YQuadratic interaction Y Y YObservations 4,946 4,946 4,946 5,025 5,025 5,025 5,039 5,039 5,039R-squared 0.001 0.001 0.112 0.011 0.011 0.207 0.011 0.016 0.122
Notes: This table shows that (i) there is a significant correlation between parents’ elite status with the children’s elite status; (ii) being above the cutoff does not promise an
elite industry, occupation or ownership, and (iii) the intergenerational link is not changed by exam performance around the cutoff. See Table A4 for the definition of elite status.
Standard errors are clustered at the university level. Significance levels: *** 1%, ** 5%, **** 10%.
43
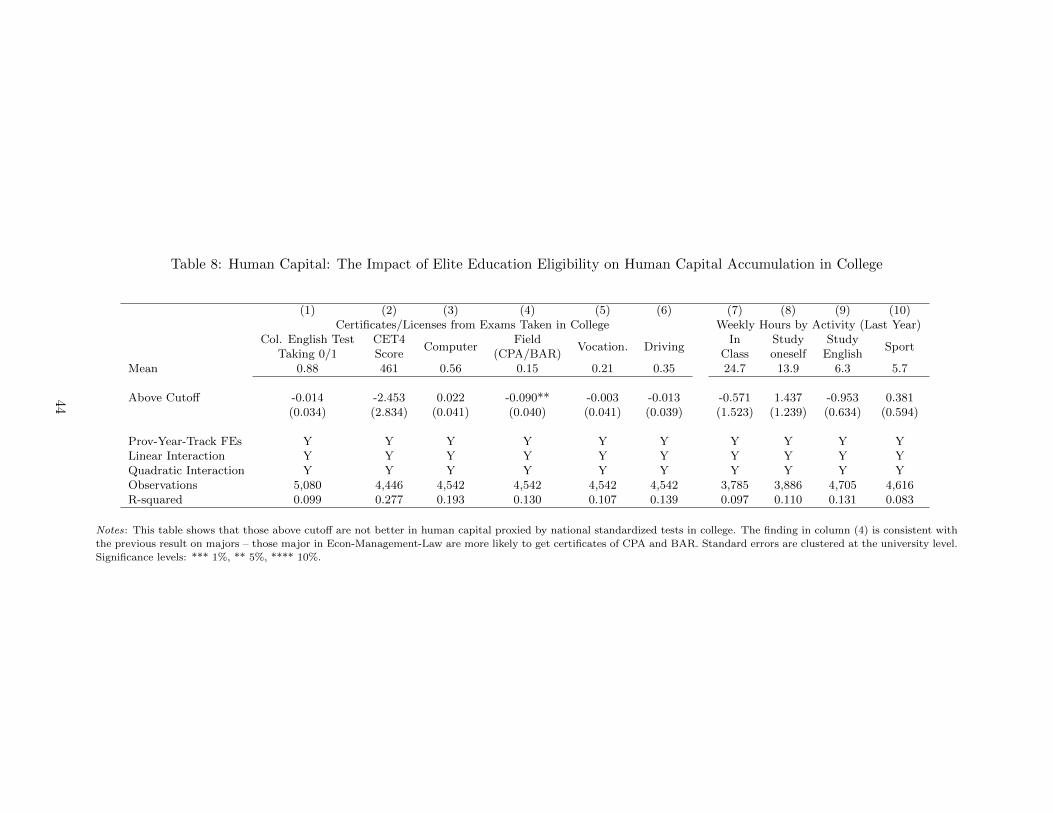
Table 8: Human Capital: The Impact of Elite Education Eligibility on Human Capital Accumulation in College
(1) (2) (3) (4) (5) (6) (7) (8) (9) (10)Certificates/Licenses from Exams Taken in College Weekly Hours by Activity (Last Year)
Col. English TestTaking 0/1
CET4Score
ComputerField
(CPA/BAR)Vocation. Driving
InClass
Studyoneself
StudyEnglish
Sport
Mean 0.88 461 0.56 0.15 0.21 0.35 24.7 13.9 6.3 5.7
Above Cutoff -0.014 -2.453 0.022 -0.090** -0.003 -0.013 -0.571 1.437 -0.953 0.381(0.034) (2.834) (0.041) (0.040) (0.041) (0.039) (1.523) (1.239) (0.634) (0.594)
Prov-Year-Track FEs Y Y Y Y Y Y Y Y Y YLinear Interaction Y Y Y Y Y Y Y Y Y YQuadratic Interaction Y Y Y Y Y Y Y Y Y YObservations 5,080 4,446 4,542 4,542 4,542 4,542 3,785 3,886 4,705 4,616R-squared 0.099 0.277 0.193 0.130 0.107 0.139 0.097 0.110 0.131 0.083
Notes: This table shows that those above cutoff are not better in human capital proxied by national standardized tests in college. The finding in column (4) is consistent with
the previous result on majors – those major in Econ-Management-Law are more likely to get certificates of CPA and BAR. Standard errors are clustered at the university level.
Significance levels: *** 1%, ** 5%, **** 10%.
44
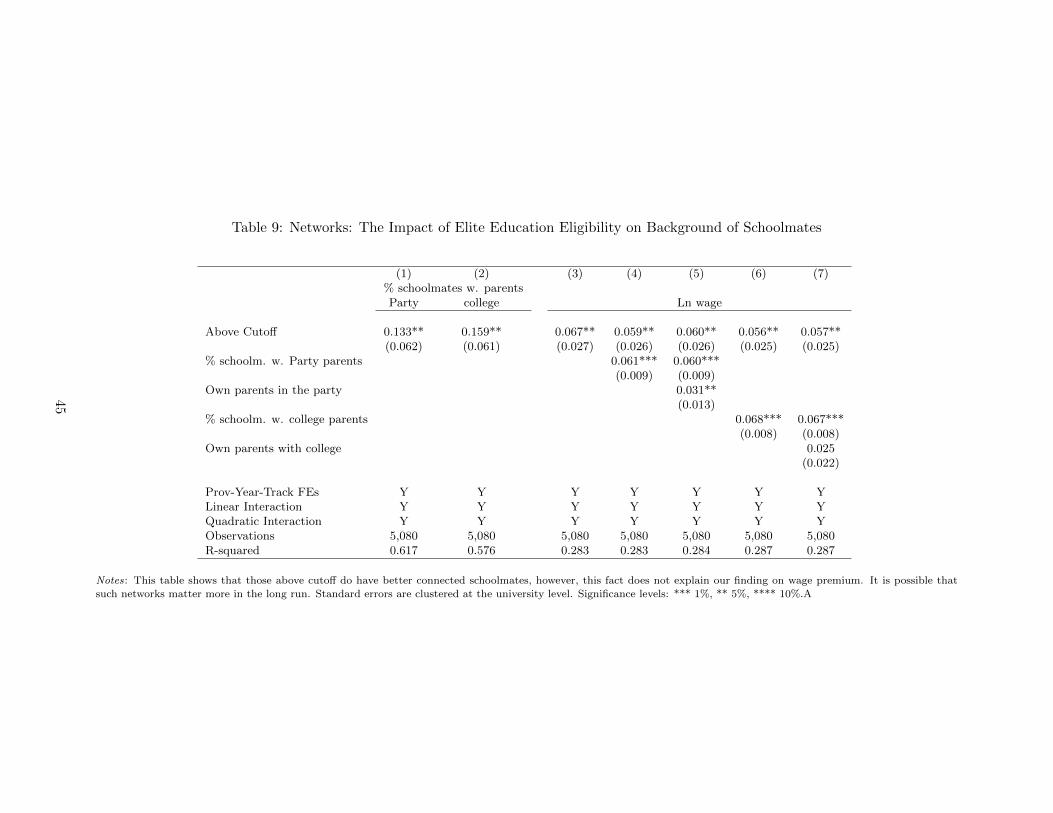
Table 9: Networks: The Impact of Elite Education Eligibility on Background of Schoolmates
(1) (2) (3) (4) (5) (6) (7)% schoolmates w. parentsParty college Ln wage
Above Cutoff 0.133** 0.159** 0.067** 0.059** 0.060** 0.056** 0.057**(0.062) (0.061) (0.027) (0.026) (0.026) (0.025) (0.025)
% schoolm. w. Party parents 0.061*** 0.060***(0.009) (0.009)
Own parents in the party 0.031**(0.013)
% schoolm. w. college parents 0.068*** 0.067***(0.008) (0.008)
Own parents with college 0.025(0.022)
Prov-Year-Track FEs Y Y Y Y Y Y YLinear Interaction Y Y Y Y Y Y YQuadratic Interaction Y Y Y Y Y Y YObservations 5,080 5,080 5,080 5,080 5,080 5,080 5,080R-squared 0.617 0.576 0.283 0.283 0.284 0.287 0.287
Notes: This table shows that those above cutoff do have better connected schoolmates, however, this fact does not explain our finding on wage premium. It is possible that
such networks matter more in the long run. Standard errors are clustered at the university level. Significance levels: *** 1%, ** 5%, **** 10%.A
45

Table 10A: Signaling/Networks: The Impact of Elite Education Eligibility on Job SearchChannels
(1) (2) (3) (4) (5)
Off-campus fairs Teacher On-campus fairs WebsitePersonalnetworks
Mean 0.41 0.57 0.77 0.57 0.26
Above Cutoff 0.022 0.041 0.061** 0.032 -0.019(0.051) (0.045) (0.025) (0.043) (0.040)
Prov-Year-Track FEs Y Y Y Y YLinear Interaction Y Y Y Y YQuadratic Interaction Y Y Y Y YObservations 5,063 5,063 5,063 5,065 5,063R-squared 0.096 0.080 0.148 0.117 0.078
Notes: This table presents the difference in the channels of job search around the cutoffs. There is no evidence that they
employ the networks channel more. We also find that those above the cutoff are more likely to get information from on
campus job affairs, consistent with the interpretation that the reputation of colleges attract employers. Standard errors
are clustered at the university level. Significance levels: *** 1%, ** 5%, **** 10%.
Table 10B: Signaling: The Impact of Elite Education Eligibility on Discrimination in JobSearch
(1) (2) (3) (4) (5) (6) (7) (8)Yes/No Question Open Question
Discrimination Gender Look Accent Rural Hukou University Major ExperienceMean 0.25 0.15 0.08 0.08 0.26 0.36 0.14 0.06
Above Cutoff 0.018 -0.021 -0.005 0.003 -0.029 -0.279 -0.045 0.054(0.038) (0.029) (0.028) (0.027) (0.034) (0.184) (0.126) (0.072)
Prov-Year-Track FEs Y Y Y Y Y Y Y YLinear Interaction Y Y Y Y Y Y Y YQuadratic Interaction Y Y Y Y Y Y Y YObservations 4,593 4,410 4,260 4,250 4,519 388 388 388R-squared 0.109 0.111 0.096 0.089 0.129 0.481 0.399 0.554
Notes: This table presents the results on reported discrimination in job searching around the cutoff. The place that
exhibits a large (but not very precisely estimated) discontinuity is discrimination of universities, which is also consistent
with the signaling effect of elite universities. Standard errors are clustered at the university level. Significance levels:
*** 1%, ** 5%, **** 10%.
46
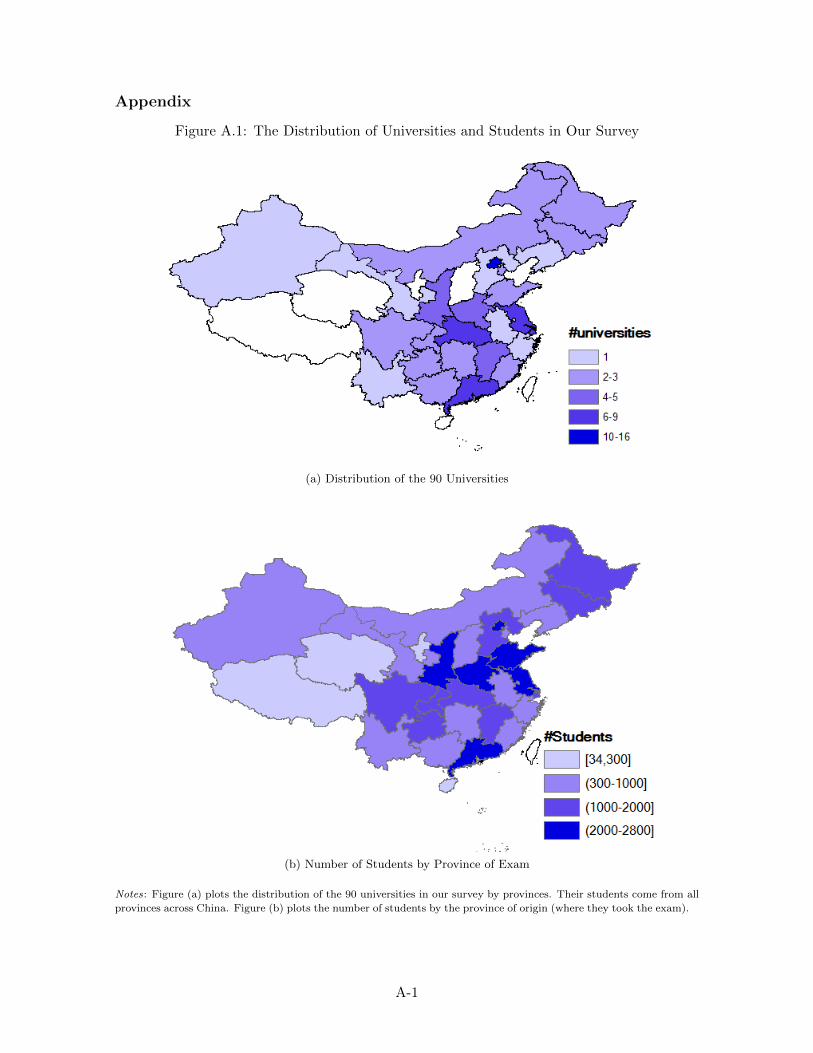
Appendix
Figure A.1: The Distribution of Universities and Students in Our Survey
(a) Distribution of the 90 Universities
(b) Number of Students by Province of Exam
Notes: Figure (a) plots the distribution of the 90 universities in our survey by provinces. Their students come from all
provinces across China. Figure (b) plots the number of students by the province of origin (where they took the exam).
A-1

Figure A.2: The Impacts on Major, Location and Relative Rank in College
(a) Major: Econ-Mangement-Law (b) Major: STEM (c) Major: Humanity
(d) University Out of Home Province (e) Perceived Ranking in College Class: btm 20 (f) Perceived Ranking in College Class: top 20
Notes: This figure plots the discountability pattern for major, university location and ranking in college class. The estimation results are presented in Table 4.
A-2
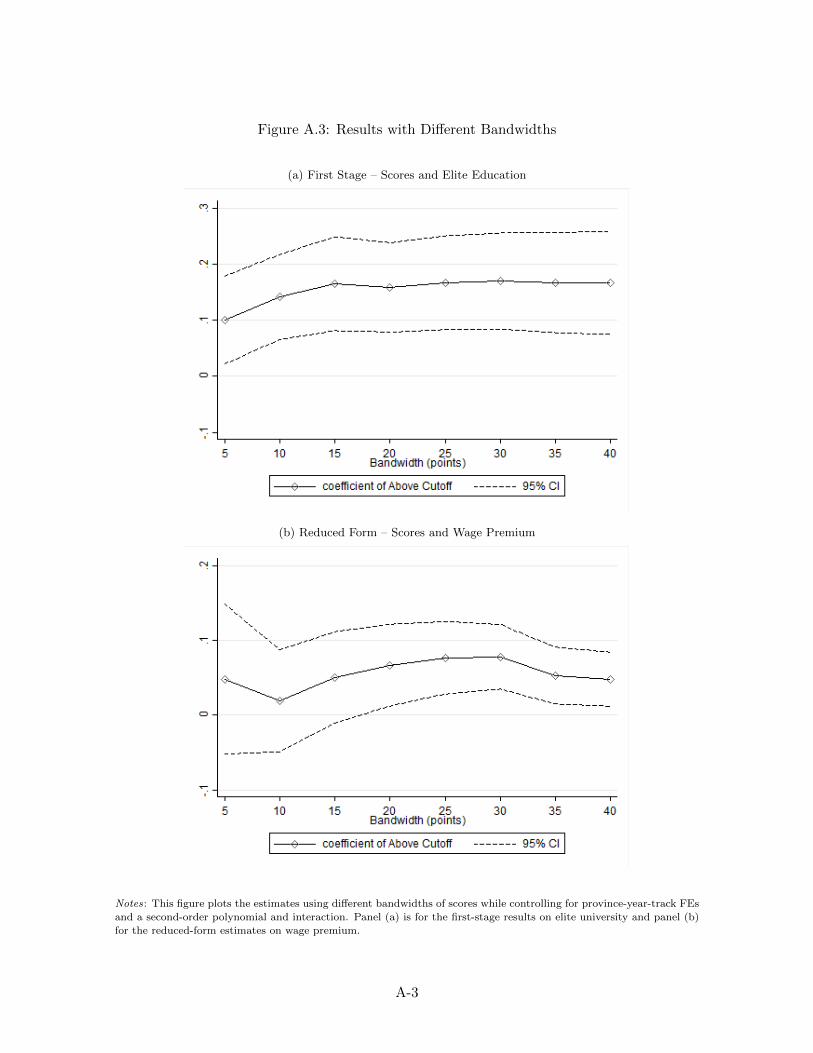
Figure A.3: Results with Different Bandwidths
(a) First Stage – Scores and Elite Education
(b) Reduced Form – Scores and Wage Premium
Notes: This figure plots the estimates using different bandwidths of scores while controlling for province-year-track FEs
and a second-order polynomial and interaction. Panel (a) is for the first-stage results on elite university and panel (b)
for the reduced-form estimates on wage premium.
A-3
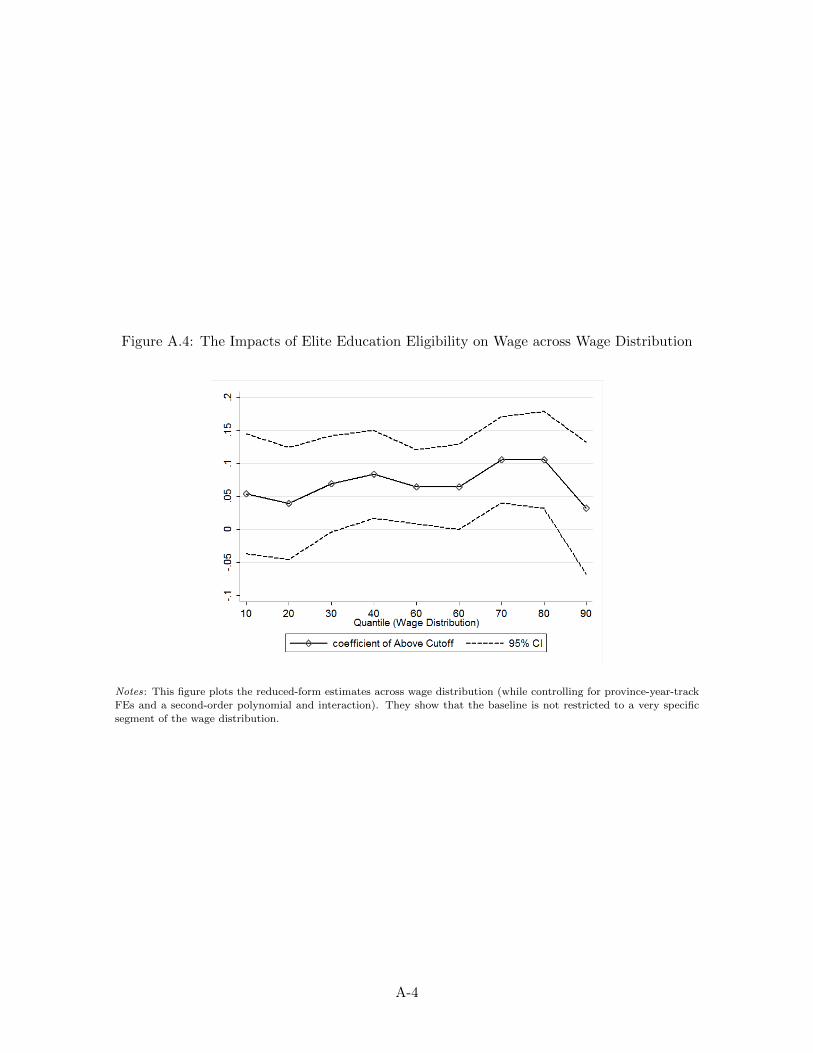
Figure A.4: The Impacts of Elite Education Eligibility on Wage across Wage Distribution
Notes: This figure plots the reduced-form estimates across wage distribution (while controlling for province-year-track
FEs and a second-order polynomial and interaction). They show that the baseline is not restricted to a very specific
segment of the wage distribution.
A-4
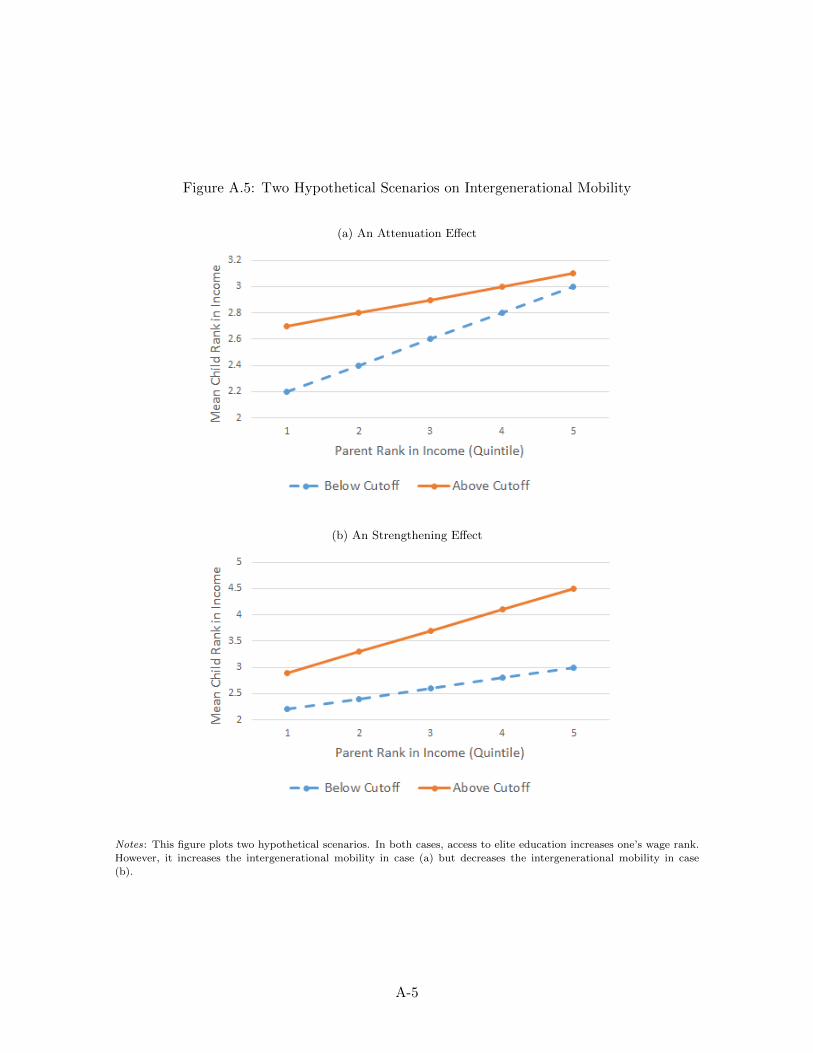
Figure A.5: Two Hypothetical Scenarios on Intergenerational Mobility
(a) An Attenuation Effect
(b) An Strengthening Effect
Notes: This figure plots two hypothetical scenarios. In both cases, access to elite education increases one’s wage rank.
However, it increases the intergenerational mobility in case (a) but decreases the intergenerational mobility in case
(b).
A-5

Table A.1: Roll-out of Surveys 2010-15
#Universities #Students Per University Total #Students2010 19 319 6,0602011 50 164 8,1762012 50 173 8,6502013 65 164 10,6792014 17 212 3,6072015 13 288 3,744Total 90 40,916
Notes: This table reports the number of universities and the number of students in survey year. The selection of schools,
however, is unlikely to affect our strategy exploring individual-level information on exam performance.
Table A.2: University Characteristics in Our Survey
(1) (2) (3)26 elite universities 64 non-elites Difference
# All students (Median) 19,380 18,655 724(9,712) (14,632) (3,270)
# Graduate students (Median) 4,733 4,598 135(2,418) (3,392) (769)
# Foreign students (Median) 590 182 408***(653) (344) (114)
Median Tuition 5,020 6,196 -1,176*(443) (3,444) (680)
Share of Students from Other Provinces 0.64 0.31 0.33***(0.24) (0.24) (0.05)
Median Exam Score 590 491 98***(26.3) (71.6) (14.5)
Median Wage 3,271 2,423 848***(818.6) (636.9) (161.8)
Notes: This table shows the difference between elite universities and non-elite universities in our survey. As discussed
in Section 2, the elite universities are public in China. They are not small in scale and do not charge higher tuition
fees. But they do have very different students.
A-6

Table A.3: More Results from Balance Tests
(1) (2) (3) (4) (5) (6) (7) (8) (9)
Male Age Repeated RuralLn(FatherIncome)
Ln(MotherIncome)
Ln(FamilyIncome)
ParentCollege Edu
ParentParty Mem.
(a) sample within a 20-point bandwidth, n=10,335
Above Cutoff -0.007 0.001 -0.035 0.014 0.031 0.038 0.023 -0.015 -0.004(0.029) (0.076) (0.033) (0.026) (0.067) (0.083) (0.060) (0.020) (0.024)
(b) sample within a 20-point bandwidth & with wage offers, n=5,080
Above Cutoff -0.028 -0.112 -0.011 0.000 0.089 0.130 0.070 -0.027 -0.036(0.042) (0.094) (0.044) (0.035) (0.084) (0.125) (0.068) (0.020) (0.035)
Prov-Year-Track FEs Y Y Y Y Y Y Y Y YLinear Interaction Y Y Y Y Y Y Y Y YQuadratic Interaction Y Y Y Y Y Y Y Y Y
Notes: This table reports more results from balance tests. There is no notable discontinuity in terms of observed individual characteristics and family background. Standard
errors are clustered at the university level. Significance levels: *** 1%, ** 5%, **** 10%.
A-7

Table A.4: Defining Elite Occupation, Industry, Ownership
(1) Share(%)realized job
(2) Share (%) hopingto get a job in:
(3)Realized/Hope
(a) Occupation1 Mid-senior management personnel 3.65 22.08 0.172 Junior management personnel 1.24 11.83 0.103 Clerks 28.43 7.07 4.024 Professional 49.26 37.21 1.325 Technical staff 2.36 1.67 1.416 Foreman / group leader in factories 0.987 Service personnel 4.08 1.53 2.678 Business Owner/Self-Employed 1.36 13.94 0.109 Skilled workers 6.65 1.51 4.4010 Manual workers 0.44 0.4 1.1011 Military / Police 0.4 2.3 0.1712 Others 1.14 0.48 2.38(b) Industry1 Ag, forestry, husbandry and fishery 2.51 2.23 1.132 Mining / Manufacturing / Construction 24.89 10.18 2.443 Electricity, gas and whose production and supply 5.08 4.32 1.184. Transport, storage and postal 3.99 2.11 1.895 Information, computer and software industry 15.45 11.35 1.366 Wholesale and retail trade 5.35 2.76 1.947 Accommodation and catering industry 1.98 2.25 0.888 Financial industry 9.17 14.08 0.659 Real estate 4.24 3.55 1.1910 Rental and business services 1.85 1.07 1.7311 Education 5.2 8.5 0.6112 Health industry 5.27 3.62 1.4613 Cultural, sports and entertainment 3.41 7.64 0.4514 Scientific and technical services 4.97 6.56 0.7615 Public Facilities Management 1.91 1.97 0.9716 Residents and other services 1.75 1.9 0.9217 Governments / public organizations 1.99 14.83 0.1318 Others 0.99 1.09 0.91(c) OwnershipState-owned 41.67 63.85 0.65Foreign-owned 10.78 16.26 0.66Private-owned 47.55 19.89 2.39
Notes: This table lists the occupation, industry and ownership in our survey. Those underscored are those occupa-
tion/industry/ownership in which many people hope to work but few manage to, which indicates the elite status. These
categories are also consistent with common understanding of China. We examine how they are affected by exam scores
in our analysis.
A-8

Table A.5: Response by Individual Characteristics
(1) (2) (3) (4) (5) (6) (7) (8) (9) (10) (11) (12)Elite University Major: econ-manage.-law Univ: out of home province Reported rank in college: btm 20%
Above Cutoff*Rural -0.018 0.014 0.015 0.001(0.033) (0.023) (0.019) (0.009)
Above Cut*Female 0.019 0.024 0.022 -0.009(0.024) (0.021) (0.021) (0.009)
Above*ln H Income 0.009 -0.005 -0.001 -0.004(0.017) (0.009) (0.009) (0.003)
Above Cutoff 0.169*** 0.151** 0.158*** -0.049 -0.051 -0.031 0.063** 0.062* 0.070** 0.047*** 0.052*** 0.049***(0.038) (0.053) (0.040) (0.034) (0.031) (0.026) (0.031) (0.035) (0.032) (0.016) (0.015) (0.014)
Rural -0.019 -0.015 -0.043*** -0.000(0.017) (0.015) (0.016) (0.007)
Female -0.013 0.035** -0.035** -0.059***(0.012) (0.017) (0.015) (0.007)
ln HH Income 0.011 0.026*** 0.009 0.003(0.009) (0.006) (0.007) (0.003)
Prov-Year-Track FE Y Y Y Y Y Y Y Y Y Y Y YLinear Interaction Y Y Y Y Y Y Y Y Y Y Y YQuadratic Interact. Y Y Y Y Y Y Y Y Y Y Y YObservations 10,335 10,335 9,383 10,314 10,314 9,363 10,335 10,335 9,383 10,059 10,059 9,154R-squared 0.345 0.344 0.340 0.240 0.243 0.244 0.525 0.525 0.527 0.053 0.069 0.058
Notes: This table shows there is no significant heterogeneity in choices once one is above the cutoff. Standard errors are clustered at the university level. Significance levels:
*** 1%, ** 5%, **** 10%.
A-9
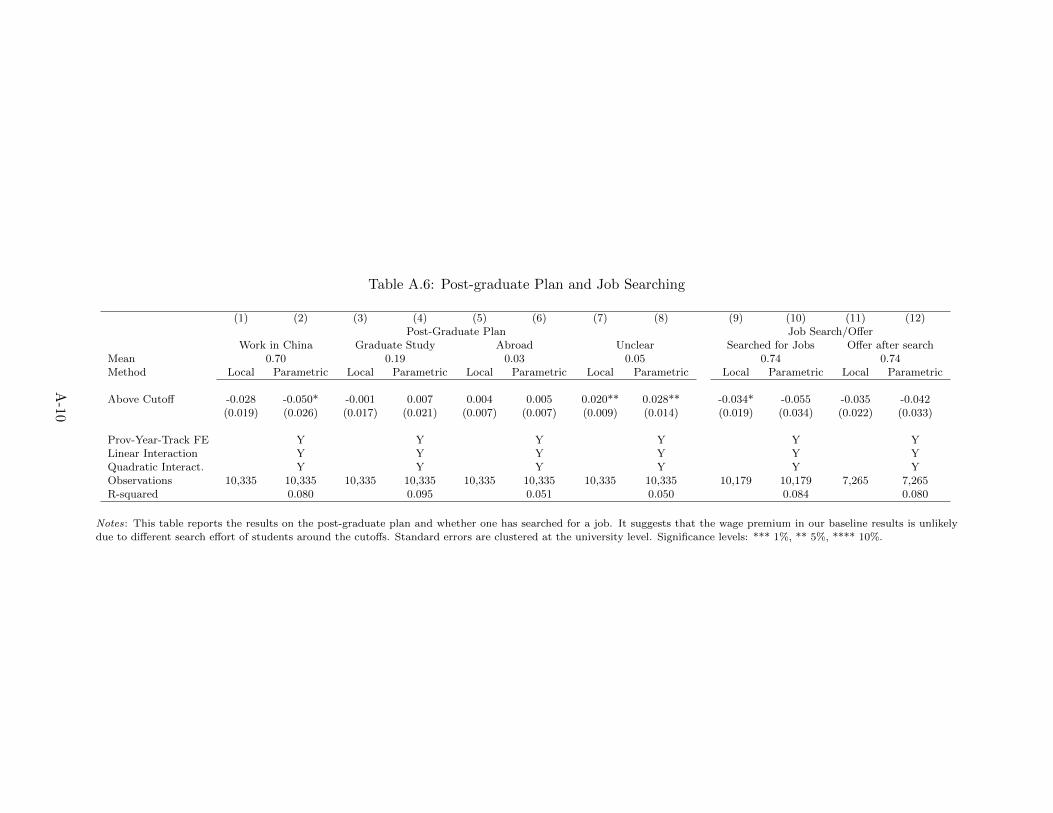
Table A.6: Post-graduate Plan and Job Searching
(1) (2) (3) (4) (5) (6) (7) (8) (9) (10) (11) (12)Post-Graduate Plan Job Search/Offer
Work in China Graduate Study Abroad Unclear Searched for Jobs Offer after searchMean 0.70 0.19 0.03 0.05 0.74 0.74Method Local Parametric Local Parametric Local Parametric Local Parametric Local Parametric Local Parametric
Above Cutoff -0.028 -0.050* -0.001 0.007 0.004 0.005 0.020** 0.028** -0.034* -0.055 -0.035 -0.042(0.019) (0.026) (0.017) (0.021) (0.007) (0.007) (0.009) (0.014) (0.019) (0.034) (0.022) (0.033)
Prov-Year-Track FE Y Y Y Y Y YLinear Interaction Y Y Y Y Y YQuadratic Interact. Y Y Y Y Y YObservations 10,335 10,335 10,335 10,335 10,335 10,335 10,335 10,335 10,179 10,179 7,265 7,265R-squared 0.080 0.095 0.051 0.050 0.084 0.080
Notes: This table reports the results on the post-graduate plan and whether one has searched for a job. It suggests that the wage premium in our baseline results is unlikely
due to different search effort of students around the cutoffs. Standard errors are clustered at the university level. Significance levels: *** 1%, ** 5%, **** 10%.
A-10

Table A.7: The Correlation between Wages for the First Job and the Future Jobs
(1) (2) (3) (4) (5) (6) (7) (8)Wage Rank Elite Industry Elite Occupation Elite Ownership
Years after post job 1-5 6-10 1-5 6-10 1-5 6-10 1-5 6-10
First Job 0.818*** 0.782*** 0.611*** 0.468*** 0.683*** 0.440*** 0.626*** 0.342***(0.004) (0.011) (0.005) (0.016) (0.005) (0.011) (0.004) (0.010)
First Job*Elite Uni. 0.041*** 0.054*** 0.000 -0.026 0.017** -0.034** 0.011 -0.008(0.006) (0.016) (0.009) (0.025) (0.008) (0.016) (0.008) (0.014)
Age, Age*Elite Y Y Y Y Y Y Y YSex, Sex*Elite Y Y Y Y Y Y Y YUniversity FEs Y Y Y Y Y Y Y YObservations 146,897 28,058 146,897 28,058 146,897 28,058 146,897 28,058R-squared 0.657 0.525 0.451 0.375 0.454 0.326 0.447 0.258
Notes: This table shows that there is a strong correlation between the characteristics of the first job and the outcomes in the future. The data come from a major online job
search platform. Wages are reported in categories: 1 for below 1000 RMB, 2 for 1000-2000 RMB, 3 for 2001-4000 RMB, 4 for 4001-6000 RMB, and 5 for 6000 RMB and above.
Elite industry/occupation/ownership are defined the same way as in Table A3. Standard errors are clustered at the university level. Significance levels: *** 1%, ** 5%, ****
10%.
A-11