THE INFLUENCE OF TRADITIONAL ACCOUNTING AND … · Proceedings of The MFA Conference 2008 Parallel...
26
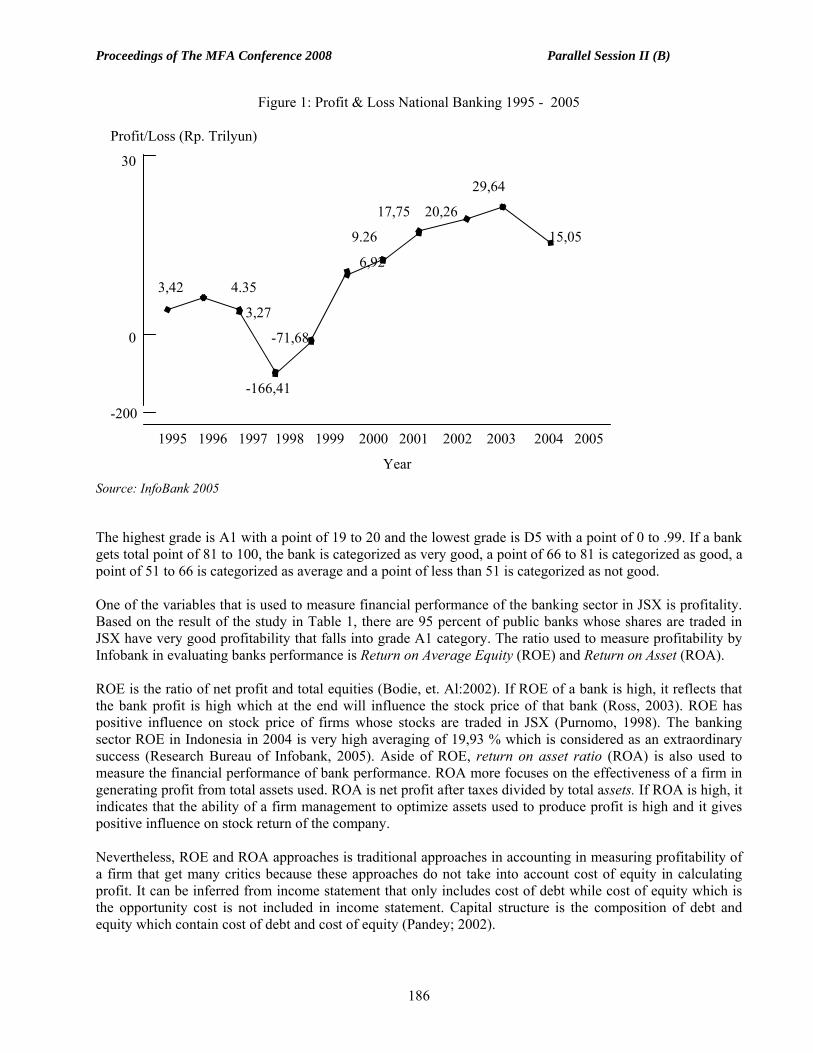
Proceedings of The MFA Conference 2008 Parallel Session II (B) THE INFLUENCE OF TRADITIONAL ACCOUNTING AND ECONOMIC VALUE ADDED APPROACHES ON STOCK RETURNS OF BANKS LISTED ON JAKARTA STOCK EXCHANGE (JSX) H. Taufik H. Isnurhadi Sriwijaya University, Palembang, Indonesia Marlina Widiyanti Universiti Kebangsaan Malaysia (PhD candidate) ABSTRACT This study attempts to investigate which of these two approaches: an accounting (ROE and ROA) or Economic Value Added (EVA) approach that has superior effect on the stock return of banks listed in Jakarta Stock Exchange (JSX) for a period of 2002 – 2005. To conduct this study, a purposive sampling method is employed. Of 25 firms in population, only 17 firms can be taken as samples. To analyze the data, a multiple regression is used to investigate the influence of the two approaches on the banks stock return. It was found that there was a significant influence of these two approaches on stock return. However, the statistical result shows that these two variables could only explain 27.9% of the variation in dependent variable namely stock return. Moreover, the statistical result reveals that EVA approach is superior to accounting (ROE and ROA) approach in influencing the listed banks stock return for the year 2002 – 2005. Since this study uses a sample that is limited to banking firms, future study is recommended to include stock returns from other sectors in JSX firms listed at The Jakarta Stock Ex influencing stock return. BACKGROUND Financial performance of national banks measured using profit (rentability) increase continuously after 1997 monetary crisis. The profitability increase is displayed in Figure 1. The highest profit record is broken when the banking sector profit reached Rp6.92 trillion in 2000 and Rp29.64 trillion in 2004 and dramatically plunged to Rp15.05 trillion. The source of the bank profit originated from loans, government bonds, federal bank certificates and share ownership (Infobank, 2006). The profits (rentability) of public banks whose shares are traded in JSX are categorized very well. The study by Infobank research department in 2005 showed that of 23 public banks only one bank that is considered not good. The result of the study is presented in Tabel 1. This valuation was conducted by Infobank Magazine research bureau based on nine rating evaluation criteria. The criteria are as follows: 1. Capital Adequacy Ratio 2. Non Performing Loan and PPAP 3. Profitability ( ROE and ROA ) 4. Liquidity ( LDR and loan growth) 5. Efficiency ( Net Interest Margin and operational cost and operational income) 185
Transcript of THE INFLUENCE OF TRADITIONAL ACCOUNTING AND … · Proceedings of The MFA Conference 2008 Parallel...
Proceedings of The MFA Conference 2008 Parallel Session II (B)
THE INFLUENCE OF TRADITIONAL ACCOUNTING AND ECONOMIC VALUE ADDED
APPROACHES ON STOCK RETURNS OF BANKS LISTED ON JAKARTA STOCK EXCHANGE (JSX)
H. Taufik H. Isnurhadi
Sriwijaya University, Palembang, Indonesia Marlina Widiyanti
Universiti Kebangsaan Malaysia (PhD candidate)
ABSTRACT This study attempts to investigate which of these two approaches: an accounting (ROE and ROA) or Economic Value Added (EVA) approach that has superior effect on the stock return of banks listed in Jakarta Stock Exchange (JSX) for a period of 2002 – 2005. To conduct this study, a purposive sampling method is employed. Of 25 firms in population, only 17 firms can be taken as samples. To analyze the data, a multiple regression is used to investigate the influence of the two approaches on the banks stock return. It was found that there was a significant influence of these two approaches on stock return. However, the statistical result shows that these two variables could only explain 27.9% of the variation in dependent variable namely stock return. Moreover, the statistical result reveals that EVA approach is superior to accounting (ROE and ROA) approach in influencing the listed banks stock return for the year 2002 – 2005. Since this study uses a sample that is limited to banking firms, future study is recommended to include stock returns from other sectors in JSX firms listed at The Jakarta Stock Ex influencing stock return. BACKGROUND Financial performance of national banks measured using profit (rentability) increase continuously after 1997 monetary crisis. The profitability increase is displayed in Figure 1. The highest profit record is broken when the banking sector profit reached Rp6.92 trillion in 2000 and Rp29.64 trillion in 2004 and dramatically plunged to Rp15.05 trillion. The source of the bank profit originated from loans, government bonds, federal bank certificates and share ownership (Infobank, 2006). The profits (rentability) of public banks whose shares are traded in JSX are categorized very well. The study by Infobank research department in 2005 showed that of 23 public banks only one bank that is considered not good. The result of the study is presented in Tabel 1. This valuation was conducted by Infobank Magazine research bureau based on nine rating evaluation criteria. The criteria are as follows:
1. Capital Adequacy Ratio 2. Non Performing Loan and PPAP 3. Profitability ( ROE and ROA ) 4. Liquidity ( LDR and loan growth) 5. Efficiency ( Net Interest Margin and operational cost and operational income)
185
Proceedings of The MFA Conference 2008 Parallel Session II (B)
Figure 1: Profit & Loss National Banking 1995 - 2005
Profit/Loss (Rp. Trilyun)
30
29,64
17,75 20,26
9.26 15,05
6,92
3,42 4.35
3,27
0 -71,68
-166,41
-200
1995 1996 1997 1998 1999 2000 2001 2002 2003 2004 2005
Year Source: InfoBank 2005
The highest grade is A1 with a point of 19 to 20 and the lowest grade is D5 with a point of 0 to .99. If a bank gets total point of 81 to 100, the bank is categorized as very good, a point of 66 to 81 is categorized as good, a point of 51 to 66 is categorized as average and a point of less than 51 is categorized as not good. One of the variables that is used to measure financial performance of the banking sector in JSX is profitality. Based on the result of the study in Table 1, there are 95 percent of public banks whose shares are traded in JSX have very good profitability that falls into grade A1 category. The ratio used to measure profitability by Infobank in evaluating banks performance is Return on Average Equity (ROE) and Return on Asset (ROA). ROE is the ratio of net profit and total equities (Bodie, et. Al:2002). If ROE of a bank is high, it reflects that the bank profit is high which at the end will influence the stock price of that bank (Ross, 2003). ROE has positive influence on stock price of firms whose stocks are traded in JSX (Purnomo, 1998). The banking sector ROE in Indonesia in 2004 is very high averaging of 19,93 % which is considered as an extraordinary success (Research Bureau of Infobank, 2005). Aside of ROE, return on asset ratio (ROA) is also used to measure the financial performance of bank performance. ROA more focuses on the effectiveness of a firm in generating profit from total assets used. ROA is net profit after taxes divided by total assets. If ROA is high, it indicates that the ability of a firm management to optimize assets used to produce profit is high and it gives positive influence on stock return of the company. Nevertheless, ROE and ROA approaches is traditional approaches in accounting in measuring profitability of a firm that get many critics because these approaches do not take into account cost of equity in calculating profit. It can be inferred from income statement that only includes cost of debt while cost of equity which is the opportunity cost is not included in income statement. Capital structure is the composition of debt and equity which contain cost of debt and cost of equity (Pandey; 2002).
186

Proceedings of The MFA Conference 2008 Parallel Session II (B)
Table 1: Financial Performance of Banks In Jakarta Stock Exchange (JSX) Notation No Bank Name
Capital Produc-tive
Assets
Rentability Likuidity Efficiency Total Value
Grade
1 2 3 4 5 6 7 8 9
10 11 12 13 14 15 16 17 18 19 20 21 22 23
Danamon Indonesia B. Rakyat Indonesia B. Buana Indonesia B.ArtaNiaga encana B. Niaga B. NISP B. Mayapada B. Swadesi B. Negara Indonesia B. Buana Putra B. Int. indonesia B. Permata B. Central Asia B. Nus. Parahyagan B.Victoria Intern B. Mega B. Panin B. Mandiri B. Eksekutif B. Lippo B. Inter-Pacific B. Kesawan B. Century
A1 A1 A1 A1 A4 A3 A3 A1 A2 A4 A1 A4 A1 A4 A3 A4 A1 A1 A3 A1 A1 A4 A4
A2 A2 A1 A2 A2 A1 A2 A2 A3 A2 A2 A2 A1 A1 A4 A1 C2 C1 C3 B4 C3 B1 C3
A1 A1 A1 A1 A1 A1 A1 A1 A1 A2 A1 A1 A1 A1 A1 A1 A1 A1 A3 A1 A1 C3 D5
A3 A2 A5 A3 A1 A2 B1 B3 B1 A5 B3 A5 B4 B1 B1 B4 A3 B1 A5 C2 A5 B1 C5
A1 A1 A1 A4 A2 A4 A1 A3 A2 A1 A3 A2 A3 A4 A3 A1 A1 A4t A1 A5 C5 C1 D4
95,80 95,36 93,57 93,33 92,98 92,16 90,62 89,55 89,19 88,77 88,27 87,87 87,71 86,76 86,48 86,16 85,52 79,83 77,64 7,59 68,10 61,75 30,50
Very Good Very Good Very Good Very Good Very Good Very Good Very Good Very Good Very Good Very Good Very Good Very Good Very Good Very Good Very Good Very Good Very Good Very Good Very Good Very Good
Very Good Good Bad
Source: InfoBank 2005 Steward (1990) introduced an approach to measure the firm financial performance. This approach is popularized as Economic Value Added (EVA). This approach does not only take into account cost of debt but also cost of equity. This approach considers that cost of equity is higher than cost of debt. EVA is an approach that measure the added value created by a firm by considering total cost of capital comprising cost of debt and cost of equity emerge from an investment activity. If EVA value is positive, it means the firm is able to create value which reflects the prosperity of shareholders. If a firm is able to create value, it is highly likely that it will be reflected in the stock price. On the other hand, if a firm is not able to create value, it is highly probable that it will have negative impact on the firm stock price. The price of the Coca Cola company before adopting EVA is about US$.4 per share but after adopting EVA the stock price soars to US$, 42 per share. Hence, EVA is an approach that takes into account not only cost of debt but also cost of equity in the financial statement of the company. A positive EVA means the company is able to create value but a negative EVA means the company does not create value. Looking back at the profit growth from 1998 to 2005 of banking sector after financial crisis of 1997, it showed astonishing performances and many banks got very good certification encouraging the authors to conduct a deep and further study. Two approaches are used in this study to look at how these two different approaches in measuring the financial statement in their relationship to the public banks stock returns in JSX and which of these two approaches have superior effect on stock returns. The purpose of the study is to investigate how traditional accounting and EVA approach influence stock return of public banks in JSX and to know which approaches are superior in affecting stock returns.
187

Proceedings of The MFA Conference 2008 Parallel Session II (B) LITERATURE REVIEW AND HYPOTHESIS Literature Review Stock return is very much influenced by fundamental and nonfundamental factors of a company. The fundamental factors, amongst others, are return on equity (ROE) and return on Asset (ROA). ROE is the return of book value to the owners of the company namely the ratio of net profit and equity (Weston et. al., 1995). On the other hand, ROA is merely a ratio of net profit after taxes and average total assets. This ratio describes how effective a company is able to use all the assets it owns in generating profits. The traditional accounting approaches of ROE and ROA are often used by investors in making decision in their investment policies. Considering that traditional accounting approach has many weaknesses such as not taking into account cost of equity, then economic value added (EVA) is introduced which take into account not only cost of debt but also cost of equity. EVA is introduced and popularized by Stern Steward Management Service, a prominent consulting firm in the US. Surya (2002) states that EVA is well known as economic profit that is, a profit that exceeds (less than) the minimum return that usually received by stockholders and creditors. A large number of managers consider that EVA approach stress on the firm value creation (Create Value). Stern Steward formulates EVA as follows:
EVA = NOPAT – (Total Cost Of Capital x Total Capital Invested) NOPAT = Net Operating profit After taxes
Total Cost Of Capital = Sum of Cost of Debt dan Cost of Equity Total Capital Invested = Total debt and Total Equity. As many theories have their assumptions, strengths and weaknesses so is EVA (Utama and Apriani, 2005). The very strength of EVA in measuring financial performance is that it very focuses on value creation of a firm that is very useful for shareholders. On the other hand, the weakness of EVA is it needs the estimation of cost of capital which is very difficult to accurately predict. Scientific study has been conducted to look at how traditional accounting and EVA approaches affect stock performance. Chen and Dodd (1997) study the relationship between EVA and stock return and comparing the financial performance from accounting perspective (accounting profit). The result reveals that the relationship between stock return and EVA is not as hebat as the promotion of EVA as the main mean in measuring financial performance, but EVA provides more information in the relationship with stock return compared to accounting profit. Woo Gon Kim (2006) discloses that EVA is not superior to other traditional approaches (earnings and cashflows) in creating market value of service firms in hospital sector. Other study comparing which financial performance is superior when measured by EVA and accounting measure in boosting shareholder value is conducted by Wet (2005). The result showed that accounting measures is much more dominant than EVA. Fernandez (2002) conducted a study about the comparison between EVA and other financial performance measures such as economic profit, earning after taxes, ROE and equity cash flow and interest rate increase on stock returns. The result showed that only interest rate increase had strong correlation with stock return. Furthermore, Ferguson, Rentzler and Yu (2005) studied the influence of EVA on stock performance of firms that adopted EVA. The result showed that the firms that adopted EVA are experienced in increasing stock performance but there was no evidence that adopting EVA could boost stock returns.
Hypothesis The hypothesis of this study is as follows:
Ho : EVA has a superior influence than ROE dan ROE on stock returns of companies whose stocks are traded in JSX.
H1 : EVA has no superior influence than ROE dan ROA on stock returns of companies whose stocks are traded in JSX.
188

Proceedings of The MFA Conference 2008 Parallel Session II (B) METHODOLOGY Data used in this study is secondary data. The data is procured from JSX Capital Directory and Infobank research Bureau. The data consist of financial statement of banking sector from 2002 to 2005, daily stock price and EVA firm value. The study is quantitative in nature in the form of causality and correlation to look at the influence of the two variables or the strength of the relationship of those two variables (Kuncoro, 2003). The population of this study is the banks whose stocks are traded in JSX for a period of 2002- 2005. The total population is 23 banks. Purposive sampling is adopted in this study. In choosing the sample, these criteria are employed: a). the companies that submit their financial statement for a period of 2002 – 2005. b). the stocks that are traded during a period of 2002 – 2005 Based on these criteria, 17 banks are chosen as a sample. Technique of Analysis To investigate the influence of EVA, ROE and ROA on stock return, Cross Sectional Regression Model is employed. The regression model is as follows: Yi = a + α1 X1,i, + β1 X2,I + δ1 X3,i, + ei
Where: Yi = stock average return for 2002 – 2005 X1,I = Banks’ EVA for 2002 -2005 X2,I, = Banks’ ROE for 2002 – 2005 X3,i, = Banks’ ROA for 2002 - 2005
α1 = EVA coefficient β1 = ROE coefficient δ1 = ROA coefficent a = a constant
RESULT AND DISCUSSION The data are subjected to test of classical assumption which is intended to verify that the data conform to the classical assumption in order to the result of regression model is valid. Then, the statistical results from the test is used in discussion. Classical Assumption Test:Multicollinierity Test Results Based on the Variance Inflation Factor (VIF) there is no multicollinierity amongst independent variables with VIF value above 10. Looking at the Durbin-Watson (DW) of 2.508, with 5 percent confident level, the table produces a value of 1.67. Because DW value is larger than upper limit (du) 1.67, it shows that autocorrelation does not occur. The result of heteroscedastisity test in the form of graph shows the is no regular pattern and the dots spread above and below ) in the Y axis, it reflects that heteroscedasticity does not occur. Looking at the histogram in the graph, it shows that the histogram mimics normal curve. Furthermore, the dots in normal graphic plot spread closely in the diagonal axis and follow the direction of the axis proving that the models fulfill the normality assumption
Regression Result The results of the test which consists of coefficient of determination, significance test and simultaneous test (F test) and significance of individual parameters (t-test) are presented in Table 2, Table 3 and Table 4.
189
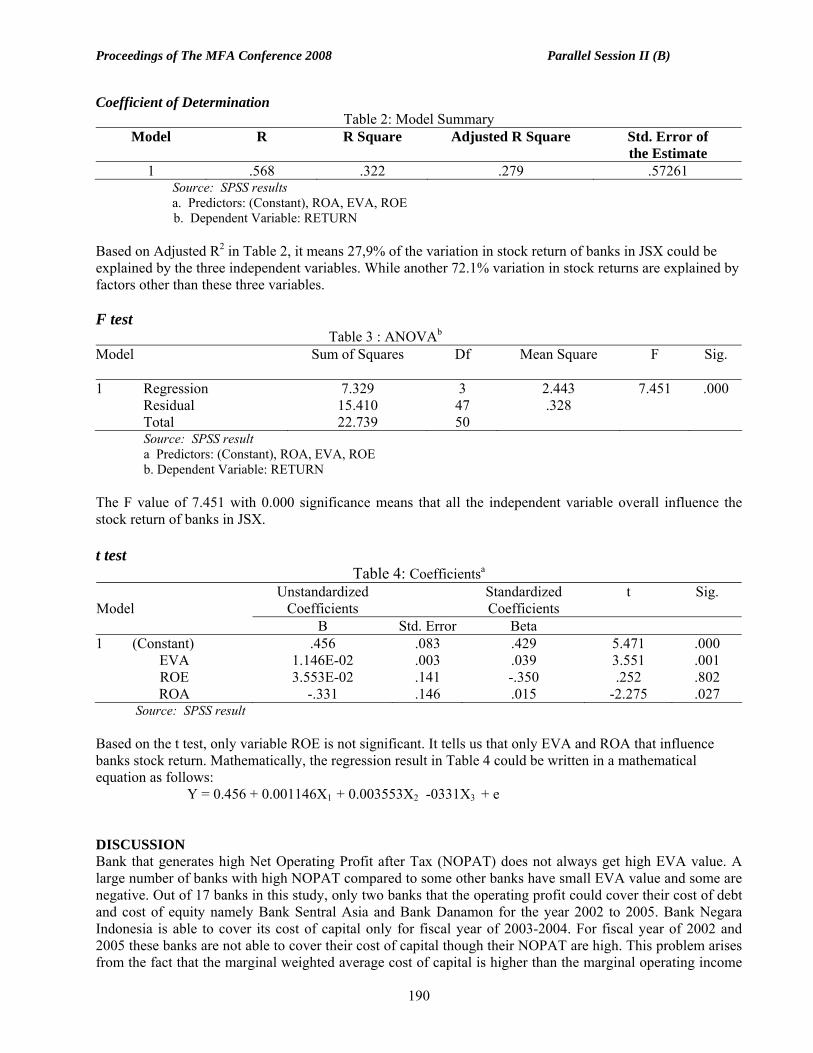
Proceedings of The MFA Conference 2008 Parallel Session II (B) Coefficient of Determination
Table 2: Model Summary Model R R Square Adjusted R Square Std. Error of
the Estimate 1 .568 .322 .279 .57261
Source: SPSS results a. Predictors: (Constant), ROA, EVA, ROE
b. Dependent Variable: RETURN Based on Adjusted R2 in Table 2, it means 27,9% of the variation in stock return of banks in JSX could be explained by the three independent variables. While another 72.1% variation in stock returns are explained by factors other than these three variables.
F test Table 3 : ANOVAb
Model
Sum of Squares Df Mean Square F Sig.
1 Regression Residual Total
7.329 15.410 22.739
3 47 50
2.443 .328
7.451 .000
Source: SPSS result a Predictors: (Constant), ROA, EVA, ROE b. Dependent Variable: RETURN
The F value of 7.451 with 0.000 significance means that all the independent variable overall influence the stock return of banks in JSX. t test
Table 4: Coefficientsa
Unstandardized Coefficients
Standardized Coefficients
t Sig. Model
B Std. Error Beta 1 (Constant)
EVA ROE ROA
.456 1.146E-02 3.553E-02
-.331
.083
.003
.141
.146
.429
.039 -.350 .015
5.471 3.551 .252
-2.275
.000
.001
.802
.027 Source: SPSS result Based on the t test, only variable ROE is not significant. It tells us that only EVA and ROA that influence banks stock return. Mathematically, the regression result in Table 4 could be written in a mathematical equation as follows: Y = 0.456 + 0.001146X1 + 0.003553X2 -0331X3 + e DISCUSSION Bank that generates high Net Operating Profit after Tax (NOPAT) does not always get high EVA value. A large number of banks with high NOPAT compared to some other banks have small EVA value and some are negative. Out of 17 banks in this study, only two banks that the operating profit could cover their cost of debt and cost of equity namely Bank Sentral Asia and Bank Danamon for the year 2002 to 2005. Bank Negara Indonesia is able to cover its cost of capital only for fiscal year of 2003-2004. For fiscal year of 2002 and 2005 these banks are not able to cover their cost of capital though their NOPAT are high. This problem arises from the fact that the marginal weighted average cost of capital is higher than the marginal operating income
190

Proceedings of The MFA Conference 2008 Parallel Session II (B) after taxes of the firms. The growth of return on equity (ROE) of banks on average increase in the period of 2002 –2004 but most of them experienced decreasing ROE significantly. Bank Buana , Bank sentral Asia, Bank Nusantara Parahyangan and Bank Negara Indonesia did not experience decreasing in ROE for 2005. This indicates that the banks ability to generate prosperity for their shareholders decrease. Furthermore, return on asset (ROA) of banking sector in 2002 – 2005 decrease continuously. Out of 17 banks in this study, there were 6 banks decreasing their ROA in the period of 2002-2004, while for a period of 2004-2005 there were 9 banks with decreasing ROA more than average of industry. This situation indicates that ability of most banks to optimize their assets to generate profit reduce dramatically. In another words, the efficiency and effectiveness assets of the assets to generate profit for the firms have not been optimal. Based on ANOVA test overall all the dependent variables EVA, ROE and ROA have significant impact on dependent variable (stock return). However, the ability of those three independent variables in explaining the variation of dependent variable is not large enough. It is only 27.9% while the other 72.1% is affected by other factors outside of these three independent variables. Principally, investors look at the high level of profit as good information that could be used in decision making process when they decide to buy or to sell the stocks. If we look at the banking sector growth of profit from 2002 to 2005, the profit growth is quite fantastic. However, it seems that the profit growth does not contribute much on the growth of ROE, ROA and EVA. In other words, there is no synchronization between the growth of profit and the growth of ROE, ROA and EVA at the banking sector from 2002 –2005 whereas as we know there is a strong relationship between the growth of profit with the growth of ROE, ROA and EVA. This situation is caused by the marginal profit growth that is lower than marginal asset, equity and weighted average cost of capital growths. This condition indicates that ability of banking sector in assets and capital use has not been optimal and it can be inferred from the Loan to Deposit Ratio (LDR) which is quite unsatisfactory as in the Table 1. On the other hand, the firms have not optimized the efficiency (see Table 1). This condition makes the effect of EVA, ROE and ROA on stock return weak because investors do not take into account these three factors in evaluating stock price. The finding of this study is in line with a study conducted by Firdaniaty (2006). The author found that most investors do not consider EVA as a benchmark in stock selection instead they look at other factors that are considered plays important role in stock valuation. Beside, EVA is used more in measuring efficiency of companies while stock price reflecting what will happen in the future. Stock price increases because of investors’ expectation toward the future not the past. This phenomenon cause the role of EVA in stock valuation is not dominant. Based on individual t (t test) only EVA and ROA have significant influence on stock return. The level of significance is 0.001 and 0.027 consecutively. On the other hand, ROE does not have impact on stock return with significant level of 0,802. From the regression equation we can see that the EVA beta value is larger than that of ROA. It tells us that EVA is a superior approach compared to traditional accounting approach. This finding is inconsistent with a study by Hartono and Cendrawati (1999) which found that ROA was superior to EVA in explaining the value of firm reflected in return on shares of companies whose stocks are included in the LQ 45 index in JSX. However, this study is consistent with the study by Yuswohady (2004) which found that EVA and Residual Income superior to Accounting Earning in explaining the firm value reflected in return on shares. Looking at these controversial findings, it is quite confusing which approach is better. It is a common perception amongst regulators, investors, and managers that the traditional accounting earning has inherent problem as a measurement mean in valuation of firm performance. Earning is not equal with cash flow; earning does not reflect company risk and does not take into account cost of equity and so many other weaknesses. EVA try to overcome the weaknesses of this traditional accounting approach though not all. Based on the finding of this study that EVA approach is superior to traditional accounting approach in influencing stock return of banking sector in JSX for a period of 2002 – 2005, the author recommend for other researchers and investors to consider EVA approach in stock valuation. Furthermore, for top management of the banking sector they have
191

Proceedings of The MFA Conference 2008 Parallel Session II (B) to pay attention on EVA approach because value creation is a matter that presents positive effect on their firm stock performances. CONCLUSION AND RECOMMENDATION EVA, ROE and ROA influence stock return of the banking sector whose stocks are traded in JSX for a period of 2002 – 2005. EVA is superior to ROE and ROA in affecting the stock return. Companies in the banking sector need to do efficiency in cost of capital or selecting a optimal capital structure and optimize the assets owned in order to suppress the cost of capital as low as possible which at the end will give positive impact on EVA, ROE and ROA of the firm. The management should adopt EVA because EVA could create a better corporate culture by building a mindset of managers that they have to realize and sensitive continuously creating value for the company. For future research the authors recommend to extend the sample beyond the banking sector. By including all sectors in JSX as a sample, it is expected that the result will be more comprehensive. Moreover, it is also recommended to use more variables in the model.
REFERENCE Bodie, Kane and Marcus, 2003, “Investment”, Fifth Edition, USA: Mc Graw-Hill. Chan, Shimin and James I. Dodd (1997), “Economic Value Added (EVA): An Emperical Examination of a New Corporate Performance Measure”, Journal of Management Issues, Vol IX, no. 3, p.318. Christinat, D., 1996, “All About EVA”, CFO. Ferguson, Robert, Joel Rentler and Susanna Yu (2005), ”Does Economic Value Added (EVA) Improve Stock Performance Profitability”, Journal of Applied Finance, p. 101. Fernandez, Pablo, 2002, “EVA, Economic Profit and Cash Value Added do No Measure Shareholder Value Creation”, Reasearch Paper of IESE University of Navarta, no. 453. Firdanianty, 2006.“Antara EVA dan Saham”, SWA 25/XX11,30 Nop –10 Des. Fortune, 1995, “Creating Stockholders Wealth”. Ghozali, Imam, 2001, “Aplikasi Analisis Multivariate Dengan Program SPSS”, Badan Penerbit Universitas Diponegoro. Gujarati, Damodar N, 2003, “Basic Economitric”, 4th E, McGraw-Hill New York Indonesian Capital Market Directory, 2006 InfoBank, 2006, No. 315, Vol XXVII, Juni Internet, http//.www. bi.co.id Jogianto dan Chendrawati, 1999, “ROA and EVA: An Comparative Emperical Study”, Gadjah mada International Journal Of Business. Jogiyanto, 2003, “Teori Portofolio dan Analisis Investasi”, BPFE –Yogyakarta. Kuncoro,Mudrajat, 2003, Metode Riset Untuk Bisnis dan Ekonomi, Bagaimana Meneliti dan Menganalisis Tesis, Jakarta: Penerbit Erlangga.. Pandey, 1997, Financial Management Delhi: Vikas Publishing Purnomo, Yogo, 1996, Keterkaitan Kinerja Keuanagn Dengan harga Saham di PT BEJ, Usahawan No. 12 tahun XXVII. Robert Fergusen, 2005 Journal of Applied Finance. P.101.. Ross,A.Stephen,et.Al, 2003, Corporate Finance, 6 th edition, USA:Mc Graw-Hill Singgih Santoso, 2004, Buku Latihan SPSS Statistik Parametrik, Elex Media Komputindo Gramedia, Jakarta. Steward, Using EVA for Performance Measurement and Financial Management in The New Economy,
Internet, WWW.Steward-eva.com. Surya, Alexande, 2002,Metodologi Perhitungan EVA, SWA.
192

Proceedings of The MFA Conference 2008 Parallel Session II (B) SWA, 2006 No. XXII Nopember – Desember. Utama, Sidharta dan Afriani, Cynthia, 2005, Praktek Corporate Governance dan Penciptaan Nilai
Perusahaan, Usahawan No 08 Utama, Sidharta, 2002, Mencermati Permainan EVA, SWA, 24 Okt- 4 Nop. Weston,Fred,et.Al, 1995, Manajemen Keuangan, Jakarta:Binarupa Aksara Woo Gon Kim, 2006, Journal of Hospitally & Tourisn Research . Vol 30. No.1. Wet JHVH de (2005),” EVA versus Traditional Accounting Measures of Performance as Drivers of Shareholder Value – A Comparative Analysis”, Maditari Accountancy Reasearch Vol. 13, No 2 ). 1- 16 Widayanto,Gatot,1993,. EVA Suatu Terobosan Baru Dalam Pengukuran Kinerja Keuangan, Usahawan No 12 Yuswohady, 2004. “ EVA vs Earning, SWA 23 / XII – 24 Nopember.
193

Proceedings of The MFA Conference 2008 Parallel Session II (B)
THE IMPACT OF REPRESENTATIVE HEURISTICS ON IPO AFTERMARKET DYNAMICS AND
PERFORMANCE
Chong Fen Nee Universiti Teknology MARA, Samarahan Campus
Ruhani Ali University Sains Malaysia
Zamri Ahmad Universiti Sains Malaysia
ABSTRACT This paper investigates the impact of representative heuristics and IPO quality on IPO’s immediate aftermarket dynamics and performance. A total of 132 samples are selected from the Main Board of Bursa Malaysia for analysis. Result shows that short-run IPO performance is significantly affected by the proxy of representative heuristics. For the aftermarket dynamics i.e. opening-day-spread and flipping activities, evidences support a positive impact of representative heuristics on opening-day-spread but not flipping activities. Among the variables representing IPO quality, market condition and size of offer are found to have predictive power over short-run return and flipping. Besides, subscription ratio and size of offer reported significant influence on opening-day-spread.
INTRODUCTION The IPO market is an integral part of the capital market, enabling companies to raise capital through the issuance and sale of shares. Over the past four decades, research interest on IPOs was generally concentrated on the short-run and long-run anomalies related to the performance. In terms of explaining the anomalous phenomena, the majority of the researches have adhered to the assumption that market is rational and hence, anomalies are due to intentional underpricing by the underwriters or the issuers. Not many researches have accessed IPO anomalous phenomena from the behavioural perspective. Besides that, the study on the impact of behavioural biases on aftermarket dynamics such as flipping activities and opening-day-spread is rarely found. Furthermore, the Malaysian market has an emerging market status and various studies have documented that Malaysian market do not follow random walk theory (Mat Nor, Lai and Hussin, 2002 and Husni, 2005). With the above scenario in mind, this study intends to shed some light on the existing gap by analyzing the initial IPO performance and aftermarket dynamics i.e. the flipping activities and opening-day spread from the behavioural aspect of representative heuristics. Representative heuristics is a famous behavioural bias which affects investors’ judgment under uncertainty. Shiller (2003) defines representative heuristics as a tendency for people to categorise events as typical or representative of a well-known class, and then, when making probability estimates, to overstress the importance of such a categorization, disregarding evidence about the underlying probabilities. Following Bayley, Lee and Walter (2006), mean initial return of the three most recently listed new listings are used as proxy to capture the association of representative heuristics with immediate aftermarket dynamics. Flipping activities is defined as the immediate sale of IPOs when the issue starts trading while opening-day spread refers to the diverse valuation of investors on IPOs on the immediate trading day. The rest of this paper is organized as follows. Following the introduction, related literature will be discussed in Section 2. Section 3 describes the data and methodology. Section 4 presents the empirical results and analysis. Lastly, Section 5 summarizes the results and concludes the study.
194

Proceedings of The MFA Conference 2008 Parallel Session II (B) LITERATURE REVIEW Research interest on IPOs is generally confined to the pricing performance in the aftermarket. Thus far, the Malaysia IPO market has consistently reported underpricing for the past four decades (Dowson, 1987; Yong, 1991; Isa and Ahmad, 1996; Leong, Vos and Tourani-Rad, 2000 and Ahmad-Zaluki, Campbell and Goodacre, 2007). Ex-ante factors such as operating history, market conditions and underwriter’s reputation have been documented by Beatty and Ritter (1986) among others for having predictive power on underpricing. Nevertheless, researchers from the behavioural finance paradigm like Shefrin and Statman (1993) and Shiller (2003) postulated that behavioural bias such as representative heuristics can influence the decision process of the stock market investors as well. The representative heuristics concept was first introduced by Tversky and Kahneman (1974). They characterized the concept of representative heuristics as follows:
Representativeness is an assessment of the degree of correspondence between a sample and a population, an instance and a category, an act and an actor, or more generally between an outcome and a model. (Tversky and Kahneman, 1983, pp 295-296).
Besides, Tversky and Kahneman (1983) also suggested that the most common method to demonstrate a variable influences a judgment is to establish a correlation between that particular variable and the judgment. Later, in a related article they clarify further that intuitive predictions or judgments under uncertainty are often based on the relation of similarity or representativeness between the evidence and possible outcomes. In other words, heuristics lead people to overestimate the probability and frequency of events that come easily to mind as they are more available in memory (Tversky and Kahneman (1996), Stracca (2004) called this phenomenon as an act to mis-perceive the laws of probability. He further posits that systematic heuristics can lead to blunders that plague economic agents. An example is price, which is often considered as ‘normal’ and ‘equilibrium’ by agents who might also have no idea of what ‘fair’ price always turn out to be inaccurate in future price development. In the stock market, representative heuristics can be a judgment bias or stereotype that can lead investors to judge a stock as a winner or loser and a market as bull or bear based on what has happened in the past few sequences without valuing the statistical probability of the outcome of these sequences. Furthermore, it could also lead investors to be more optimistic due to past gains and more pessimistic due to past losses. Shefrin and Statman (1993) contended that investors’ behaviour to overweight recent performance may be explained by the representative heuristics. Nevertheless, since this is a relatively new concept in finance, not many researches have been done in this area.
No doubt, heuristics allows individuals to make ‘quick’ decisions as it involves ease of recall and cognitive shortcut. However, making decisions using heuristics can be dangerous because not all information relevant to the decision is carefully considered. Of course ‘correct decisions’ are made in some cases but it can also results in common mistakes known as biases and fallacies.
On the other hand, there has been an increasing interest in studying investors’ aftermarket trading dynamics such as flipping activities, particularly in the United States. The behaviour to flip new listings in the immediate aftermarket for a quick gain has provided liquidity to the IPOs’ initial aftermarket trading. However, excessive flipping is discouraged as it is detrimental to the performance of the new listings. In order to stabilize downward price pressure due to flipping particularly in weak offerings, underwriters in the U.S. market often play the role as the market maker. Among the stabilizing activities used are Green Shoe options and penalty bids (Ritter and Welch, 2002; Aggarwal, 2000; Fishe, 2002; Krigman, Shaw and Womack, 1999; Aggrawal, 2003).
195

Proceedings of The MFA Conference 2008 Parallel Session II (B) Bayley, Lee and Walter (2006) studied the cross-sectional explanations of IPO flipping in Australia. To capture how representative heuristics affects flipping activity, they used variables which represent equally-weighted underpricing for the most recent IPOs prior to the issuing of the firm’s prospectus date. They reported a positive relationship between investors’ decision to flip and the performances of the equally-weighted average of the most recent IPOs for both institutional and individual investors. DATA AND METHODOLOGY Samples for this study comprised of 132 IPOs listed on the main board between 1991 and 2003. Only samples with all the requisite information available are selected for analysis. Additionally the required data are drawn from the Securities Commission, Bursa Malaysia Research and Data Centre, Bank Negara Malaysia and relevant publications. Short – run performance (MAIR) is measured as the difference between offer and closing price at the end of the first trading day which is later adjusted for market returns. The aftermarket dynamics examined in this study are flipping activities and opening-day spread. Flipping activities is represented by flipping ratio. It is defined as the percentage of opening day trading volume divided by the number of shares offered on the first trading day (Miller and Reily, 1987 and Aggarwal, 2003). On the other hand, opening-day spread is defined as the difference between day high and day low. To capture the impact of representative heuristics on the short-run performance of new listings in Malaysia, following Bayley, Lee and Walter (2006), the average equally-weighted underpricing for the three most recent new issues listed prior to the firm’s listing date is used as proxy for representative heuristics (RH). Since investors’ judgments on new listings’ valuation can be associated with performance of the most recently offered new listings, therefore, this study hypothesizes a positive relationship between this proxy (RH) and the level of initial performance.
H1: There is a positive relationship between representative heuristics and new listings’ short-run return. Model 1 is developed to assess H1. Past researches by Beatty and Ritter (1986), Grinblatt and Hwang (1989) as well as Carter and Manaster (1990) contended that knowledge about IPO quality has an impact on aftermarket dynamics, therefore, ex-ante factors proxying IPO quality are included as controls in the model. Model 1: MAIR = α + β1RH – β2OH + β3SR + β4MktCon – β5LOGSizeOff - β6UR Dummy + β7Pre-Crisis Dummy +
β8Post-Crisis Dummy +ε Whereby: RH = Representative Heuristics. It is measured as the equally-weighted underpricing for the three most recent
new issues listed prior to the firm’s listing date (Bayley, Lee and Walter, 2006) OH = Operating history. It is defined as the length of existence of the company prior to new listing. SR = Subscription ratio. It is defined as the demand of a particular new listing. MktCon = Market Condition. It is calculated as the average market index return over one week prior to the
listing date. LOGSizeOff = Size of Offer. It is measured as the total number of shares floated in IPO multiplied by the
subscription price. A log-transformation is applied on this variable due to its positive skewness (Kautia, 2004).
UR Dummy = Quality of the lead underwriter. UR Dummy equals to ‘1’ for a prestigious underwriter and ‘0’ otherwise, in accordance with Bank Negara Malaysia’s rating.
Pre-crisis dummy = Period before the commencement of the Asian financial crisis in June 1997. Pre-crisis dummy equals to ‘1’ if new listings were listed before 1 June, 1997, otherwise equals to ‘0’.
196

Proceedings of The MFA Conference 2008 Parallel Session II (B) Post-crisis dummy = Period after the Asian financial crisis starting October, 1998. Post crisis dummy equals
to ‘1’ if new listings were listed after 30 September, 1998, otherwise equals to ‘0’.
To examine the association of representative heuristics with immediate aftermarket behaviour i.e. flipping ratio and opening-day-spread, mean initial return of the three most recently listed new listings (RH) are used to test the following hypotheses.
H2: Representative heuristics is positively associated with opening-day- spread. H3: Representative heuristics is positively associated with flipping ratio. Model 2 examines the predictive power of representative heuristics on the behaviour of assigning opening-day spread in the immediate aftermarket as stated in H2 while Model 3 investigates the impact of representative heuristics on flipping activity proposed by H3. The mathematical expression of Model 2 and 3 are presented below. Model 2: ODS = α – β1OH + β2MktCon + β3SR- β4LOGSizeOff – β5UR + β6RH + β7 Crisis Dummy + ε Model 3: FR = α - β1OH + β2MktCon + β3SR - β4LOGSizeOff - β5UR + β6RH+ β7 Crisis Dummy + ε All the measurements included in Model 2 and 3 are same as those stated in Model 1. A positive relationship is expected for RH and immediate aftermarket dynamics as investors can be driven to be more optimistic due to recent gain and more pessimistic due to pass losses. In fact, as mentioned earlier, Baylay, Lee and Walter (2006) reported a positive relationship between investors’ decision to flip and the performance of the equally weighted average of the most recent IPOs. For the ex-ante factors, variables with higher uncertainty usually resulted in a more diverse opinions and this phenomenon in turn leads to a higher aftermarket dynamics and vice versa. EMPIRICAL RESULTS AND ANALYSIS Empirical results of the impact of representative heuristics on IPO short-run return (MAIR), flipping activities and opening-day spread aftermarket dynamics are portrayed in Table 1, 2 and 3 respectively. Table 1: Cross-Sectional Regressions of the Impact of Representative Heuristics on Market Adjusted Initial
Return (MAIR) Variable Step1 Step 2 Control variables β t-stat β t-stat Operating history 0.001 0.226 -0.001 -0.131 Subscription ratio 0.003 1.350 0.003 1.116 Market condition 0.001 5.413** 0.001 2.633** LOG Size of offer -0.265 -2.415** -0.248 -2.474** Underwriter’s reputation Dummy 0.053 0.628 0.090 1.162 Pre-crisis Dummy 0.255 1.975 0.119 0.981 Post-crisis Dummy -0.104 -0.802 -0.055 -0.465 Model Primary Explanatory variables Representative Heuristics 0.410 5.005** F value 22.593** 26.735** R2 0.561 0.635 Adjusted R2 0.536 0.611 R2 change 0.561 0.074**
**Significant at 5% level (one-tail test).
197

Proceedings of The MFA Conference 2008 Parallel Session II (B) From Table 1, cross-sectional regression result of Model 1 provides evidence of a significant positive relationship between representative heuristics and MAIR after controlling for ex-ante and economic variables. With F value of 26.735 and R-square change of 0.074 which are significant at the 5% level, Hypothesis 1 has been supported. As for the control variables, market condition and LOG Size of Offer are significant predictors of MAIR. These results are consistent with Klymaz (2000). Based on the results, this study concludes that investors’ manifestation of representative heuristics based on the recent performance of prior new listings has significantly impacted the MAIR.
Table 2: Cross-Sectional Regressions of Representative Heuristics and Opening Day Spread Variable Dependent Variable: Opening-day-spread Step 1 Step 2 Independent variables β t-stat β t-stat Operating history 0.002 0.722 0.001 0.341 Market condition 0.001 0.829 4.9E-005 -0.239 Subscription ratio 0.007 3.653** 0.005** 2.918** LOG Size of offer 0.195 2.243** 0.189** 2.204** Underwriter’s reputation Dummy 0.002 0.031 0.012 0.179 Crisis Dummy -0.050 -0.693 -0.054 -0.759 Representative Heuristics 0.144 2.193** F value 8.260** 7.983** R2 0.284 0.311 Adjusted R2 0.250 0.272 R square Change 0.284** 0.027**
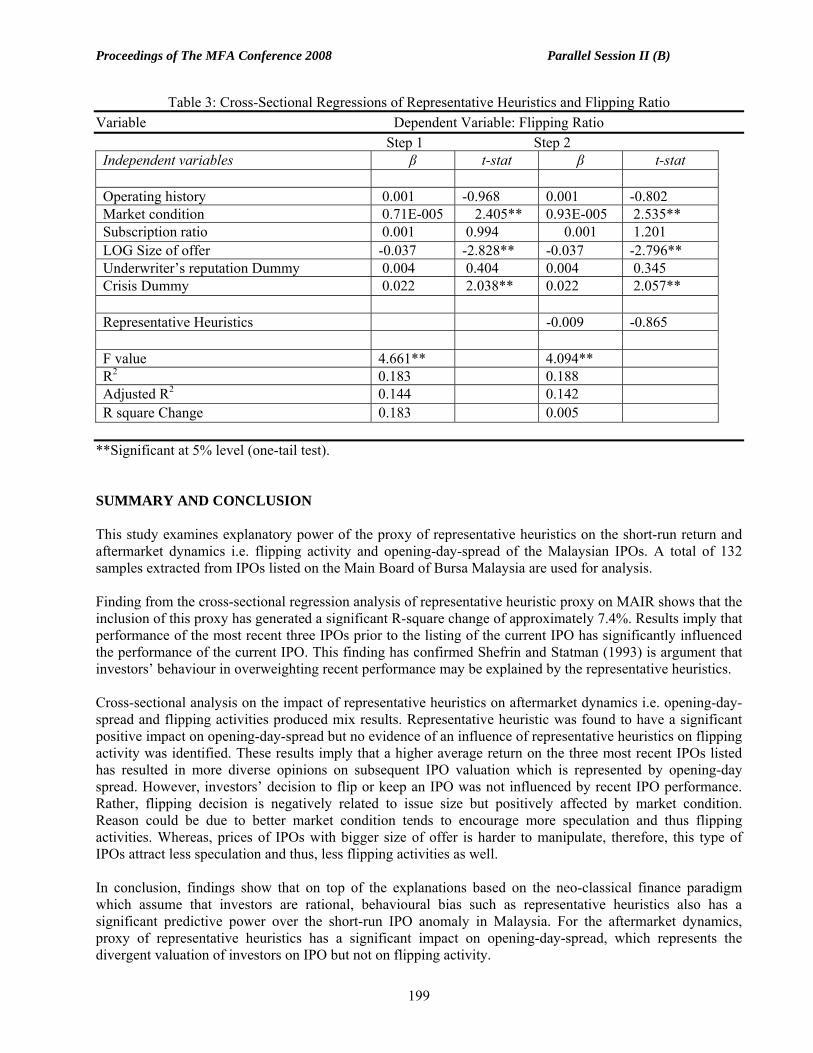
**Significant at 5% level. Referring to Table 2, cross-sectional regression analysis show that the proxy used for representative heuristics has a significant positive impact on investors’ decisions in assigning the highest or lowest price on the listing day. In other words, the higher the average underpricing of the previous three new listings, the higher is the opening-day spread. The model reports F value of 7.983 and R-square change of 0.027 which is significant at the 5% level. Among the controls, subscription ratio and LOG size of offer are found to be significantly related to opening-day spread. Based on the results in Table 2, this study concludes that representative heuristics has a significant impact on opening-day-spread. Table 3 presents findings of the cross-sectional regressions analysis for Model 3. Results show that model is significant at the 95% confidence interval with F value equals to 4.094. However, with an insignificant R square change at the 5% significance level, this study concludes that H3 which proposes that representative heuristics is positively associated with flipping ratio is not substantiated. This result is contradict to Baylay, Lee and Walter (2006)’s findings. Among the control variables, market condition, LOG size of offer and crisis dummy are found to have a significant impact on flipping ratio. Bigger size of offer was found to discourage flipping activities while a positive market condition encourage flipping activities. Furthermore, flipping activity is also significantly influenced by financial crisis.
198
Proceedings of The MFA Conference 2008 Parallel Session II (B)
Table 3: Cross-Sectional Regressions of Representative Heuristics and Flipping Ratio Variable Dependent Variable: Flipping Ratio Step 1 Step 2 Independent variables β t-stat β t-stat Operating history 0.001 -0.968 0.001 -0.802 Market condition 0.71E-005 2.405** 0.93E-005 2.535** Subscription ratio 0.001 0.994 0.001 1.201 LOG Size of offer -0.037 -2.828** -0.037 -2.796** Underwriter’s reputation Dummy 0.004 0.404 0.004 0.345 Crisis Dummy 0.022 2.038** 0.022 2.057** Representative Heuristics -0.009 -0.865 F value 4.661** 4.094** R2 0.183 0.188 Adjusted R2 0.144 0.142 R square Change 0.183 0.005
**Significant at 5% level (one-tail test). SUMMARY AND CONCLUSION This study examines explanatory power of the proxy of representative heuristics on the short-run return and aftermarket dynamics i.e. flipping activity and opening-day-spread of the Malaysian IPOs. A total of 132 samples extracted from IPOs listed on the Main Board of Bursa Malaysia are used for analysis. Finding from the cross-sectional regression analysis of representative heuristic proxy on MAIR shows that the inclusion of this proxy has generated a significant R-square change of approximately 7.4%. Results imply that performance of the most recent three IPOs prior to the listing of the current IPO has significantly influenced the performance of the current IPO. This finding has confirmed Shefrin and Statman (1993) is argument that investors’ behaviour in overweighting recent performance may be explained by the representative heuristics. Cross-sectional analysis on the impact of representative heuristics on aftermarket dynamics i.e. opening-day-spread and flipping activities produced mix results. Representative heuristic was found to have a significant positive impact on opening-day-spread but no evidence of an influence of representative heuristics on flipping activity was identified. These results imply that a higher average return on the three most recent IPOs listed has resulted in more diverse opinions on subsequent IPO valuation which is represented by opening-day spread. However, investors’ decision to flip or keep an IPO was not influenced by recent IPO performance. Rather, flipping decision is negatively related to issue size but positively affected by market condition. Reason could be due to better market condition tends to encourage more speculation and thus flipping activities. Whereas, prices of IPOs with bigger size of offer is harder to manipulate, therefore, this type of IPOs attract less speculation and thus, less flipping activities as well. In conclusion, findings show that on top of the explanations based on the neo-classical finance paradigm which assume that investors are rational, behavioural bias such as representative heuristics also has a significant predictive power over the short-run IPO anomaly in Malaysia. For the aftermarket dynamics, proxy of representative heuristics has a significant impact on opening-day-spread, which represents the divergent valuation of investors on IPO but not on flipping activity.
199

Proceedings of The MFA Conference 2008 Parallel Session II (B) REFERENCES Ahmad-Zaluki, N, Campbell, K. and Goodacre, A. (2007). The long run share price performance of
Malaysian initial public offerings (IPOs). Journal of Business Finance and Accounting, 34, 78 – 110. Aggarwal, R. (2000). Stabilization activities by underwriters after initial public offerings. The Journal of
Finance, 3, 1075-1103. Aggarwal, R. (2003). Allocation of initial public offerings and flipping activity. Journal of Financial
Economics, 68, 111-135. Bayley, L., Lee, P.J., & Walter, T.S., (2006) IPO Flipping in Australia: cross-sectional explanations. Pacific-
Basin Finance Journal, 14, 327-348. Beatty, R. P. & Ritter, J.R., (1986). Investment banking, reputation and the underpricing of initial public
offerings. Journal of Financial Economics, 15, 213 – 232. Carter, R., & Manaster, S. (1990). Initial public offerings and underwriter reputations. The Journal of
Finance, 45(4), 1045-1067. Dowson, S. M.(1987). Secondary market performance of initial public offers, Hong Kong, Singapore and
Malaysia. Journal of Business Finance and Accounting, 14, 67-76. Grinblatt, M. & C.Y. Hwang (1989). Signalling and Pricing of New Issues. The Journal of Finance, 44 (2),
393-420. Husni, T (2005). Price randomness, contrarians and momentum strategies: A study of return predictability in
the Malaysian Stock Exchange. Dissertation submitted to Universiti Sains Malaysia for PhD. Isa, M. and Ahmad, R. (1996). Performance of new issues on the Malaysia stock market; Malaysia
Journal of Economic Studies, 13 (2), 53-66. Kahneman, D, and Tversky, A. (1973). On the psychology of prediction. Psychology Review 80, 237-251. Kahneman, D., and Tversky, A. (1996). On the reality of cognitive illusions. Psychology Review, 103(3),
582-591. Kaustia, M. (2004). Market-wide impact of the disposition effect: Evidence from IPO trading volume.
Journal of Financial Markets, 7, 207-235. Klymaz, H (2000). The initial and aftermarket performance of IPOs in an emerging market: Evidence from
Istanbul Stock Exchange. Journal of Multinational Financial Management, 2(2), 213-227. Krigman, L., Shaw, W., & Womack, K. (1999). The Persistence of IPO mispricing and the predictive power
of flipping. The Journal of Finance, 54(3), 1015-1044. Leong, K., Vos, E. and Tourani-Rad, A. (2000). Malaysia IPOs performance pre-and post Asian crisis.
Presented at AMB AMRO International Conference on Initial Public Offerings, Amsterdam, 2-4 July, 2000.
Mat-Nor, F., Lai, M.M. and Hussin, A. M. (2002). Price randomness, fundamental factors, and stock market contrarian strategy: Further evidence on Malaysian stock market. Proceedings of the 4th Malaysian Finance Association, Penang, Malaysia.
Miller, R. E., & Reilly, F. K., (1987). An examination of mispricing, returns, and uncertainty for initial public offerings. Financial Management.16, 33-38.
Ritter, J.R (1998). Initial public offerings, Contemporary Finance Digest, 2(1), 5 – 30. Ritter J. R. and Welch, I. (2002). A review of IPO activity, pricing and allocation. Journal of Finance, 57 (4),
1795-1829. Securities Commission (2003). Policies and Guidelines on Issue / Offer of Securities. Kuala Lumpur:
Securities Commission of Malaysia. Shefrin, H and Statman, M.A. (1993). Behavioural aspects of the design and marketing of financial products.
Financial Management 22, 123-134. Shiller, R, J. (2003). From efficient markets theory to behavioural finance, Journal of Economics
Perspectives, 17 (1), 83-104. Stracca, L. (2004). Behavioural finance and asset prices: Where do we stand? Journal of Economic
Psychology 25, 373 – 405 Tversky, A. and Kahneman, D. (1974). Judgement under uncertainty: Heuristics and biases, Science
185,1124-1131. Yong, O. (1991). Performance of new issues of securities in Malaysia. The Malaysian Accountant, 3-6.
200
Proceedings of The MFA Conference 2008 Parallel Session II (B)
DIVIDEND ANNOUNCEMENTS AND STOCK MARKET REACTION IN KUALA LUMPUR
STOCK EXCHANGE
Mohamad Jais Universiti Malaysia Sarawak
Kenta Funaoka Japan Securities Research Institute
Azlan Zainol Abidin Universiti Utara Malaysia
ABSTRACT This paper presents "Dividend Announcements and Stock Market Reaction in Kuala Lumpur Stock Exchange." Using an event study approach, the evidence shows that dividend increase announcements are greeted positively by investors, while there are some evidences suggesting investors react negatively prior to dividend decrease announcements. The observations are then separated into the magnitude of dividend change and income change. This paper also separates the observations into government linked companies (GLCs) and non-GLCs. INTRODUCTION This paper examines the stock market reactions to announcements of dividend increases and decreases in Kuala Lumpur Stock Exchange. Prior researches in the developed market find that dividend changes and stock market reaction have a positive correlation. Dividend increase is considered as good news while dividend decreases as bad news. Two of the most discussed theories of dividend behavior are information signaling hypothesis and agency theory. The information-signaling hypothesis argues that since there is an information asymmetry between the management and shareholders, the only way for the management to signal future prospects is by changing the dividend payout. According to the agency problem perspective, when the management increases dividends, it reduces the possibility of the management misusing the firm’s free cash flow. Empirical evidence strongly supports this argument and thus, confirms the theory. The evidence in this study indicates that the stock market welcomes announcements of a dividend increase. The buy and hold abnormal return in 3 days surrounding the announcements is about 0.54 % and the return is even higher at 1.49% in 20 days period following the announcements. The positive reaction is similar after controlling the magnitude of the dividend changes. When the observations are further split into income-increase group and income-decrease group, the positive buy and hold abnormal return remain significant. On the dividend decrease announcements, the immediate buy and hold abnormal return shows the expected sign but not statistically significant. There are some evidences that suggest investors react negatively prior to the announcements. For observations that reduced the dividend level significantly than the previous year level, investors react negatively prior to the announcements. The observations are then separated into the government-linked companies (GLCs) and non-GLCs. The GLCs are chosen because it is an investment arm of the Malaysian government and their shares are actively traded in the stock market and the GLCs are also the favorite stock of foreign investors. Because GLCs have high growth potential and are monopolistic, studying them might give some insight into how the stock market reacts to dividend announcements.
201

Proceedings of The MFA Conference 2008 Parallel Session II (B)
LITERATURE REVIEW Dividend as the main method of distributing cash to shareholders has received considerable prior attention in the finance literature. Lintner (1956) suggests that firms prefer to smooth their dividend and reluctant to change their payout policy. The management is reluctant to cut dividend because it might send negative signal to investor and reluctant to increase payout for fear that it might not sustainable in the future. Following this, many empirical studies have been performed and concentrated on how the stock market reacts to the announcements. Almost all of the studies agree that dividend payout and stock market reaction move in the same direction1. That means stock market react positively on dividend increase announcement and negatively on dividend decrease announcement. Two of the most widely discussed hypotheses on the stock market behavior on dividend announcement are the information signaling hypothesis and the free cash flow hypothesis. Dividend signaling hypothesis developed by Bhattacharya (1979), Miller and Rock (1985) and John and Williams (1985) suggest that firms change their dividend payout to signal future performance. Since the management knows more about its firm than outsiders do, the only way for management to relay the information to the market is by changing their dividend payout pattern. Many empirical studies confirm the theory. For example, Aharony and Swary (1980) find that the market still reacts positively to the announcements even after controlling the contemporaneous earnings announcements. Asquith and Mullins (1986) investigated the first dividend announcement in the corporate history or dividend initiation after 10-year interval and find that the stock market reacts stronger to this type of extreme dividend announcements. Healy and Palepu (1988) find similar evidence on the firms that initiate and omit their dividend. The magnitude of negative stock market reaction is more severe on dividend omission firms. Employing more samples size, Michaely et al. (1995) and Robin (1998) reach to the similar conclusions. Docking and Koch (2005) find that stock market reaction to dividend announcement is sensitive to the direction or volatility of the stock market. Agency theory provides an alternative explanation of the market reaction to dividend announcements. Easterbrook (1984) and Jensen (1986) suggest that dividend act as discipline tool to the management. The distribution of free cash flow to shareholders reduces the agency conflict by making it less likely that the management will invest in an unprofitable business. According to this line of reasoning, the stock market reacts positively to announcements of a dividend increase. Alternatively, stock market reacts negatively to firms that reduce their dividend payout on the chance that the management might invest in an unprofitable business. Both hypotheses imply that the stock market should react in the same direction as dividends payment. If the market is efficient, then the subsequent operating performance should improve. However, the evidence on the subsequent performance is mixed2. These contradictory results suggest that the evidence so far on the post operating performance of dividend paying firms is inconclusive. The evidence presented so far on stock market reactions and two hypotheses described above were developed with reference to the U.S. market. A similar line of study was conducted on the European market. Lonie et al. (1996), McCluskey et al. (2006) and Travlos et al. (2001) look into the stock market reaction in the U.K., Irish and Cyprus market. They find similar evidence that stock markets react in the same direction as dividend changes and attribute the positive relationship to the information signaling hypothesis. In Japan, Fukuda (2000) finds that stock markets react positively to dividend increase and dividend initiation announcements.
1 Pettit (1972) is among the earlier paper that finds stock market treats dividend increase announcements positively and negatively on dividend decrease announcement. 2 For example, Grullon et al. (2005), Grullon and Michaely (2002), Benartzi et al. (1997), and DeAngelo et al.(1996) find the subsequent operating performance negatively related to the announcements, while Zhou and Ruland (2006), Arnott and Asness (2003), Nissim and Ziv (2001), Jagannathan et al. (2000) and Healy and Palepu (1988) conclude the signals are credible.
202

Proceedings of The MFA Conference 2008 Parallel Session II (B)
However the magnitude of the reaction is smaller than the studies of the developed market and the post operating performance of the firms contradicts the predictions of the theory. In contrast, Kato et al. (2002) find that the free cash flow hypothesis might explain the positive stock market reaction in Japan. Their results show that dividend increasing firms have the characteristics of the free cash flow hypothesis, such as higher earnings and lower debt ratio. The evidence from the free cash flow hypothesis, however, is opposite to what the theory predicts. They conclude that the reason for this is the close relationship between shareholders and management. The dividend signaling hypothesis and the free cash flow hypothesis might be applicable to the developed market such as in the U.S. markets or Japanese market because of diverse relationship between investors and management. In other words, the corporate governance structures in the U.S. market allow management more freedom to run the business. For this reason, the stock market may be the best way to signal management’s intentions about the future performance of their firms. However, other markets have a different corporate governance structure. For example, there is a close relationship between shareholders and management prior to the real estate bubble in Japan 3 and in other markets. This close relationship mitigates the agency problem and there should be other explanations for the positive stock market reaction, which are not captured by the traditional information-signaling hypothesis and agency theory explanations. However, after the financial market and real estate bubbles, the Japanese government has introduced new regulations and amended the rules to make corporate governance more market-based and investor-oriented. For example, the gradual decline in cross-shareholding and the increase in participation by foreign investors have exacerbated the agency problem in recent years4 . In the more recent study, Harada and Nguyen (2005) conclude that dividend-signaling hypothesis can explain well the situation in the Japanese market if the data used in the study is not aggregated across different economic situation. In Malaysia, there is still a very close relationship between block shareholders and management. In fact, the Chief Executive Officer and the Chairman of the firms are normally the nominees of the block shareholders. GLCs exist because of the active privatization program and the high growth economic policy of the Malaysian government. GLCs’ special characteristics allow them to control the strategic business that is monopolistic and that has the potential for higher investment growth. DATA AND METHODOLOGY The initial observations in this study are all the firms that announced dividend increases or decreases from 2001 to 2005. All the firms were listed for at least two years. Firms that announce special dividend in the announcement year are excluded. This requirement is to ensure that all firms in the sample had the dividend and daily stock price data. Then the utilities, financial, closed end funds or REITS were excluded from the sample. The stock price data and the dividend data are available from Datastream, Thompson Financial Service. A firm is defined as having increased (or decreased) its dividend in a given year if there was an annual dividend increase (or decrease) relative to the prior year. The data on the government-linked companies are obtained from the Khazanah Nasional Malaysia, the investment holding firm of the Malaysian government. The final observations consist of 853 dividend increase announcements and 376 dividend decrease announcements5 . The announcement dates of the firms are obtained from the KLSE database. Day 0 is defined as the day on which the firm announces its final dividend and the same announcement appears in the KLSE website. To
3 See Dewenter and Warther (1998), Lonie et al. (1996), McCluskey et al. (2006) and Travlos et al. (2001) that explain the relationship between shareholders-investors in their respective markets. 4 See Seki (2005), Yoshikawa and Phan (2005), Jackson and Moerke (2005) and Bebenroth and Tabuchi (2004). 5 These figures are obtained after the data are truncated at 5%.
203

Proceedings of The MFA Conference 2008 Parallel Session II (B) control for other events, the announcements are not contaminated with other firm specific information such as share repurchase and bonus issue at least five days surroundings the announcement day. A standard event study method is used to analyze the stock market reactions on the dividend increase and dividend decrease announcements. The following market model is used to calculate the abnormal return: Rit = αi + βi Rmt + єi where Rit and Rmt are, respectively, the return to stock i and the return on Kuala Lumpur Composite Index on day t. αi and βi are ordinary least square (OLS) estimates. The estimation period is from day –140 to day –21 relative to the announcement date. The mean buy and hold abnormal return is employed to measure the market reactions to the dividend announcements in different event windows. RESULTS Table 2.1 shows the buy and hold abnormal return for the 40-days period surrounding dividend increase announcements for the observations of dividend increase firms in KLSE. The immediate event windows of 3-days surrounding the announcements for the entire sample shows the buy and hold abnormal return is positive 0.54% and statistically significant. On the longer event windows 20 days after the announcements, the buy and hold abnormal return is 1.49% and significant. The evidence indicates that investors treat dividend announcements as good news and react positively to the news. The buy and hold abnormal return on the event windows of the entire observations is then dividend into 4 groups according to the magnitude of the dividend change. The buy and hold abnormal returns on the immediate event windows of 3-day surrounding the announcements across the groups are all positive. However, only the buy and hold abnormal return in Group 2 is statistically significant. While the evidence on the longer event windows are all positive and significant with the highest buy and hold abnormal return of 1.66% in Group 3.
Table 2.1: The buy and hold abnormal returns (%) for dividend increase firms in different event windows Groups ranked by the magnitude of dividend increase change Event windows Entire observations1 2 3 4
(Low) (High)(-20,-1) 0.10 -0.74 0.65 0.59 -0.10 (-1,1) 0.54** 0.49 0.94* 0.37 0.35 (1,20) 1.49*** 1.38*** 1.55*** 1.66*** 1.37**N 853 Income-increase group (-20,-1) -0.22 -1.57** 0.12 1.15** -0.60 (-1,1) 0.57* 0.73 0.66 0.56 0.33 (1,20) 1.48*** 1.78*** 1.41** 1.50*** 1.23*N 471 Income-decrease group (-20,-1) 0.50 0.53 0.62 0.14 0.73 (-1,1) 0.49 0.42 0.90 0.35 0.31 (1,20) 1.50*** 0.78 2.01** 1.69** 1.52***N 382 *** Significant at 1% level ** Significant at 5% level * Significant at 10% level The observations are then separated into income increase-group and income-decrease group. For the income-increase group, the evidence is similar with the results of the whole dividend increase observations. The difference is that the buy and hold abnormal return prior to the announcements is negative and significant in
204

Proceedings of The MFA Conference 2008 Parallel Session II (B) Group 1. One may interpret the results as investors have the expectations that those firms may not increase the dividend substantially and overreact by selling the stock prior to the announcements. However, the post announcements buy and hold abnormal return in this group is 1.78% and it is the highest among the dividend change magnitude groups. For the income-decrease group, the buy and hold abnormal return is positive and significant in the post dividend announcements windows except in Group 1 which has the lowest magnitude of dividend change. The evidences on the stock market reactions across the various magnitude of dividend increase and between income-increase and income-decrease groups indicate that the stock market treat dividend increase announcements as good news and responded positively to the announcements.
Table 2.2 : The buy and hold abnormal returns (%) for dividend decrease firms in different event windows
Groups ranked by the magnitude of dividend decrease change
1 2 3 4 Event windows Entire observations
(Low) (High) (-20,-1) 0.13 0.63 0.25 1.21* -1.56**(-1,1) -0.34 -0.22 -0.14 -0.25 -0.74 (1,20) 0.44 -0.34 0.57 0.86 0.69 N 376 Income-increase group (-20,-1) 0.29 0.58 -0.23 1.52 -0.70 (-1,1) -0.51 0.01 -0.60 -0.31 -1.13 (1,20) 0.89* 0.48 0.76 0.93 1.38 N 169 Income-decrease group (-20,-1) 0.01 0.23 0.75 0.33 -1.31 (-1,1) -0.19 0.23 -0.22 -0.03 -0.77 (1,20) 0.08 -1.11 0.59 0.74 0.12 N 207 ** Significant at 5% level * Significant at 10% level Comparatively, the buy and hold abnormal return earned surrounding the event windows is not much different when compared to the evidence found in the developed markets. The abnormal returns earned on the dividend increase announcement in the other markets are about 1.34 % in U.S. (Grullon et al. 2002), 1.42 % in U.K. (Lonie et al. 1996) and about 0.85% in Japan (Fukuda 2000). These results indicate that the stock market reacts positively to announcements of dividend increases in KLSE, similar to other market evidence. Table 2.2 presents the buy and hold abnormal return in different event windows for dividend decrease observations. The result shows that the sign on the magnitude of dividend decrease announcements across all groups in the immediate event windows surrounding the announcements are negative as predicted. However, the result is not statistically significant. There is not enough data to reject the hypothesis that the buy and hold abnormal return is not equal to 0 in 3-day period surrounding the announcements. In Group 3 on the entire observations on dividend decrease announcements, the buy and hold abnormal return is positive 1.21% and significant. Further investigation to find the source of the positive reaction prior to the dividend decrease announcements reveal that positive buy and hold prior to the announcements belong to the income increase group. The buy and hold abnormal return for the income-increase group is 1.52%, while the income-decrease group is 0.33%. However, the data is not sufficient to reject the hypothesis that the buy and hold abnormal return in the immediate event window is not equal to 0. The evidence on the income-increase group also reveals that the post announcements buy and hold abnormal return subsequent to the announcement is positive 0.89% and significant. One possible explanation for this scenario is that investor put more emphasize on the income increase than the negative aspect of dividend decrease announcements. There is a possibility
205

Proceedings of The MFA Conference 2008 Parallel Session II (B) that investors treat the income-increase group announce dividend decrease due to the reason that they may want to conserve cash for some future projects. For observations in Group 4 for the entire dividend decrease observations, the prior announcements buy and hold abnormal return is -1.56% and significant. This evidence suggests that investors have the ability to identify those firms that may reduce their dividend level significantly. This would not be surprised as listed firms in Malaysia are required to submit quarterly financial reports and these reports are available on KLSE website. The evidence suggests that investors anticipate which firms that may reduce the dividend level significantly and negatively react prior to the announcements. When the dividend decrease is announced, there is no element of surprise as the level of dividend reduction is anticipated earlier. To investigate further, the sample is separated into GLCs and non-GLCs subsamples. As mentioned earlier, GLCs are only involved in a strategic business and are inherently monopolistic. Furthermore, the GLCs are high-growth companies. The stock market reaction to dividend change announcements may indicate whether market treats the announcements differently than the non-GLCs. Table 2.3 presents the buy and hold abnormal return of the GLCs firm in the different event windows surrounding the dividend increase announcements and in the different magnitude of dividend change group. The immediate event windows have a positive sign but not significant. For the entire period, the buy and hold abnormal return is positive 1.37%. When the dividend increase is controlled with the magnitude of the dividend changes, the buy and hold abnormal return become not significant in all event windows and in all dividend magnitudes changes groups. For the income-increase group, the buy and hold abnormal return is positive and statistically significant in the post announcement period in Group 3. While for the income-decrease group, the prior announcement buy and hold abnormal return is positive and significant. The highest dividend increase change yield the positive buy and hold abnormal return in the post announcements period, as shown in Group 4.
Table 2.3: The buy and hold abnormal returns (%) for dividend increase government-linked companies (GLCs) in different event windows
Groups ranked by the magnitude of dividend increase change for GLC
1 2 3 4 Event windows
Entire observations
(Low) (High)(-20,-1) 0.43 -0.10 -1.40 1.10 2.10 (-1,1) 0.96 1.29 0.48 0.82 1.25 (1,20) 1.37** 2.01 -0.48 2.20 1.74 N 100 Income-increase group (-20,-1) -0.97 -2.15 -2.64 -0.15 1.05 (-1,1) 1.05 1.65 0.93 1.21 0.42 (1,20) 1.31 2.43 -0.73 3.86* -0.31 N 56 Income-decrease group (-20,-1) 2.21* 2.24 0.55 2.98 3.07 (-1,1) 0.84 1.00 -0.21 -0.15 2.72 (1,20) 1.43 0.70 0.72 0.10 4.21* N 44 **Significant at 5% level * Significant at 10% level Table 2.4 shows the buy and hold abnormal return for the dividend decrease GLCs. For the entire observations, the buy and hold abnormal return prior to the announcements and in the highest magnitude of
206
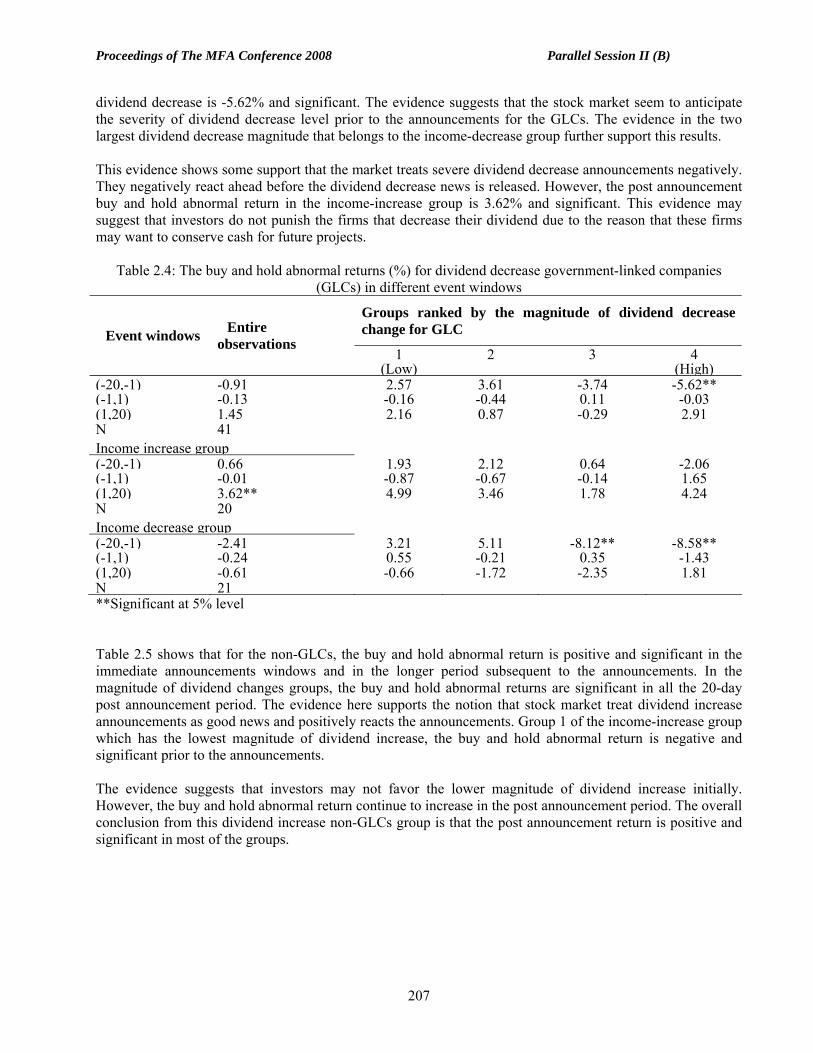
Proceedings of The MFA Conference 2008 Parallel Session II (B) dividend decrease is -5.62% and significant. The evidence suggests that the stock market seem to anticipate the severity of dividend decrease level prior to the announcements for the GLCs. The evidence in the two largest dividend decrease magnitude that belongs to the income-decrease group further support this results. This evidence shows some support that the market treats severe dividend decrease announcements negatively. They negatively react ahead before the dividend decrease news is released. However, the post announcement buy and hold abnormal return in the income-increase group is 3.62% and significant. This evidence may suggest that investors do not punish the firms that decrease their dividend due to the reason that these firms may want to conserve cash for future projects.
Table 2.4: The buy and hold abnormal returns (%) for dividend decrease government-linked companies (GLCs) in different event windows
Groups ranked by the magnitude of dividend decrease change for GLC
1 2 3 4 Event windows Entire
observations
(Low) (High)(-20,-1) -0.91 2.57 3.61 -3.74 -5.62**(-1,1) -0.13 -0.16 -0.44 0.11 -0.03(1,20) 1.45 2.16 0.87 -0.29 2.91N 41 Income increase group (-20,-1) 0.66 1.93 2.12 0.64 -2.06(-1,1) -0.01 -0.87 -0.67 -0.14 1.65(1,20) 3.62** 4.99 3.46 1.78 4.24N 20 Income decrease group (-20,-1) -2.41 3.21 5.11 -8.12** -8.58**(-1,1) -0.24 0.55 -0.21 0.35 -1.43(1,20) -0.61 -0.66 -1.72 -2.35 1.81N 21 **Significant at 5% level Table 2.5 shows that for the non-GLCs, the buy and hold abnormal return is positive and significant in the immediate announcements windows and in the longer period subsequent to the announcements. In the magnitude of dividend changes groups, the buy and hold abnormal returns are significant in all the 20-day post announcement period. The evidence here supports the notion that stock market treat dividend increase announcements as good news and positively reacts the announcements. Group 1 of the income-increase group which has the lowest magnitude of dividend increase, the buy and hold abnormal return is negative and significant prior to the announcements. The evidence suggests that investors may not favor the lower magnitude of dividend increase initially. However, the buy and hold abnormal return continue to increase in the post announcement period. The overall conclusion from this dividend increase non-GLCs group is that the post announcement return is positive and significant in most of the groups.
207

Proceedings of The MFA Conference 2008 Parallel Session II (B)
Table 2.5: The buy and hold abnormal returns (%) for dividend increase non-GLCs in different event
windows Groups ranked by the magnitude of dividend increase change for non-GLC
1 2 3 4 Event windows Entire
observations (Low) (High)
(-20,-1) 0.06 -0.83 1.11 0.33 -0.38(-1,1) 0.48* 0.44 0.93 0.34 0.20(1,20) 1.51*** 1.27*** 1.84*** 1.64*** 1.27**N 753 Income increase group (-20,-1) -0.12 -1.57** 0.60 1.27* -0.80(-1,1) 0.51 0.54 0.75 0.51 0.23(1,20) 1.50*** 1.68** 1.79** 1.11 1.44*N 415 Income decrease group (-20,-1) 0.28 0.02 0.93 -0.18 0.37(-1,1) 0.45 0.30 1.08 0.27 0.13(1,20) 1.51*** 0.77 2.20*** 1.77** 1.30N 338 *** Significant at 1% level ** Significant at 5% level * Significant at 10% level
Table 2.6: The buy and hold abnormal returns (%) for dividend decrease non-GLCs in different event windows
Groups ranked by the magnitude of dividend decrease change for non-GLC
1 2 3 4 Event windows Entire
observations (Low) (High)
(-20,-1) 0.26 0.48 -0.06 1.54* -0.95(-1,1) -0.36 -0.24 -0.11 -0.29 -0.82(1,20) 0.32 -0.63 0.64 0.83 0.45N 335 Income increase group (-20,-1) 0.24 0.40 -0.60 1.69 -0.52(-1,1) -0.58 0.13 -0.65 -0.34 -1.43(1,20) 0.52 -0.13 0.34 0.67 1.19N 149 Income decrease group (-20,-1) 0.28 -0.31 0.56 1.66 -0.74(-1,1) -0.19 0.18 -0.26 -0.11 -0.55(1,20) 0.16 -1.42 1.34 0.86 -0.13N 186 *Significant at 10% level Table 2.6 shows that for the entire observations, the buy and hold abnormal return is positive and significant prior to the dividend decrease announcements in Group 3. The evidence suggests that investors seem to ignore the potential dividend decrease announcements initially, when the announcement is made, they react negatively. However, the buy and hold abnormal return in the immediate event windows is not significant, although it has the expected sign.
208

Proceedings of The MFA Conference 2008 Parallel Session II (B) CONCLUSIONS The results in this paper indicate that, consistent with studies in the other markets, the dividend increase announcement is greeted positively by the stock market. The evidence suggests that the positive reaction is across different magnitude of the dividend increase change and across income change groups. There is also evidence that investors do not favor the small magnitude of dividend increase. However, the post announcement return shows that investors treat dividend increase announcements as good news and positively react to the announcements. For the dividend decrease announcements, the immediate buy and hold abnormal returns have the negative sign but not statistically significant. The data is not sufficient to support the hypothesis that the buy and hold abnormal return for the dividend decrease is not equal to 0. However, there are some evidences that indicate that investors react negatively prior to the announcements, as indicated by the evidence of the highest magnitude of dividend decrease change in the entire observation of dividend decrease group and in the GLCs group. One possible reason for lack of response to dividend decrease announcements in the immediate event windows is that investors in Malaysia anticipate earlier on firms that may decrease their dividend significantly. The share price is negative prior to the announcements and this evidence indicates that investors react negatively before the dividend decreased is announced. REFERENCES Aharony, J. and I. Swary (1980) Quarterly dividend and earnings announcements and stockholders’ returns: an empirical analysis, Journal of Finance, 35(1), 1–12. Arnott, R.D. and C.S. Asness (2003) Surprise! Higher dividends = higher earnings growth, Financial Analyst Journal, 59(1), 70–87. Asquith, P. and D.W. Mullins (1986) Signaling with dividends, stock repurchases and equity issues, Financial Management, 15(3), 27–44. Bebenroth, R. and S. Tabuchi (2004) Corporate governance in Japan: Government regulations, Osaka Keidai Ronshu, 54(5), 429–438. Bhattacharya, S. (1979) Imperfect information, dividend policy, and the bird in the hand fallacy, Bell Journal of Economics, 10 (1), 259–270. Benartzi, S., R. Michaely and R. H. Thaler (1997) Do changes in dividends signal the future or the past? , Journal of Finance, 52 (3), 1007–1034. DeAngelo, H., L. DeAngelo and D. J. Skinner (1996) Reversal of fortune: Dividend signaling and the disappearance of sustained earnings growth, Journal of Financial Economics, 40(3), 341–371. Docking, D.S. and P.D. Koch (2005) Sensitivity of investor reaction to market direction and volatility: Dividend change announcements, Journal of Financial Research, 28(1), 21–40. Dewenter, K., and V. Warther (1998) Dividends, asymmetric information, and agency conflicts: Evidence from a comparison of the dividend policies of Japanese and U.S. firms, Journal of Finance, 53(3), 879– 904. Easterbrook, F. (1984) Two agency-cost explanations of dividends, American Economic Review, 74(4), 650– 659. Fukuda, A. (2000) Dividend changes and earnings performance in Japan, Pacific-Basin Finance Journal, 8), 53–66. Grullon, G., R. Michaely, and B. Swaminathan (2002) Are dividend changes a sign of firm maturity?, Journal of Business, 75(3), 387–424. Grullon, G., R. Michaely, S. Benartzi and R. Thaler (2005) Dividend changes do not signal changes in future profitability, Journal of Business, 78(5), 1659–1682.
209

Proceedings of The MFA Conference 2008 Parallel Session II (B) Healy, P. and K. Palepu (1988) Earnings information conveyed by dividend initiations and omissions, Journal of Financial Economics, 21(2), 149–175. Jackson, G. and A. Moerke (2005) Continuity and change in corporate governance: comparing Germany and Japan, Corporate Governance 13(3), 351–361. Jagannathan, M., C.P. Stephens and M.S Weisbach. (2000) Financial flexibility and the choice between dividends and stock repurchases, Journal of Financial Economics, 57(3), 355–384. Jensen, M. (1986) Agency costs of free cash flow, American Economic Review, 76(2), 323–329. John, K. and J. Williams (1985) Dividends, dilution, and taxes: A signaling equilibrium, Journal of Finance, 40(4), 1053–1070. Kato, H. K., U. Loewenstein and W. Tsay (2002) Dividend policy, cash flow, and investment in Japan, Pacific-Basin Finance Journal,10 , 443– 473. Lonie, A. A., G. Abeyratna, D. M. Power and C. D. Sinclair (1996) The stock market reaction to dividend announcements: A UK study of complex market signals, Journal of Economic Studies, 23(1), 32–52. Lintner, J. (1956) Distribution and incomes of corporations among dividends, retained earnings and taxes, American Economic Review, 46 (2), 97– 113. McCluskey, T., B. M. Burton, D. M. Power and C. D. Sinclair (2006) Evidence on the Irish stock market’s reaction to dividend announcements. Applied Financial Economics, 16(8), 617–628. Michaely, R., R. H. Thaler and K. L. Womack (1995) Price reactions to dividend initiations and omissions: Overreaction or drift?, Journal of Finance, 50(2): 573–608. Miller, M. H., and K. Rock (1985) Dividend policy under asymmetric information, Journal of Finance, 40 (4), 1031–1051. Nissim, D., and A. Ziv (2001) Dividend changes and future profitability, Journal of Finance, 56(6), 2111– 2133. Pettit, R.R. (1972) Dividend announcements, security performance and capital market efficiency, Journal of Finance, 27(5), 993–1007. Robin, A. (1998) Dividend omissions: rationale and market impact. American Business Review, 16(2), 1–8. Seki, T. (2005) Legal reform and shareholder activism by institutional investors in Japan. Corporate Governance, 13(3), 377–385. Travlos, N., L. Trigeorgis and N.Vafeas (2001) Shareholder wealth effects of dividend policy changes in an emerging stock market: The case of Cyprus, Multinational Finance Journal, 5(2), 87–112. Yoshikawa, T. and P.H. Phan (2005) The effects of ownership and capital structure on board composition and strategic diversification in Japanese corporations, Corporate Governance, 13(2), 303–312. Zhou, P., and W.C.S. Ruland (2006) Dividend payout and future earnings growth, Financial Analyst Journal, 62(3), 70–87.
210