THE INFLUENCE OF THE IGV ON THE ROTATING STALL … 01.pdf · 2 device was forbidding the probe...
10
1 THE INFLUENCE OF THE IGV ON THE ROTATING STALL CELL STRUCTURE IN A TWO-STAGE LOW-SPEED AXIAL-FLOW COMPRESSOR F. Nurzia, C. Palomba and P. Puddu Mechanical Engineering Department University of Cagliari, Piazza D’armi 09123 Cagliari Italy -390706755709 fax +390706755717 [email protected] , [email protected] , [email protected] ABSTRACT Rotating stall instability in axial flow compressors arises when the mass flow is reduced at constant rotational speed. Despite the number of experimental and theoretical work already published in the scientific literature, many questions still remain unanswered. This work addresses the issue of rotating cell structure as a part of a fundamental research program of the Department of Mechanical Engineering of Cagliari on rotating stall. The general scope being that of reaching a better understanding of the basic flow structures in relationship with the global compressor performance during rotating stall. The effect of IGV removal on the cell structure both in terms of number of cells and of cinematic structure of the cell during abrupt full 1-cell stall in a two-stage axial flow compressor has been studied. The experimental determination of 3D flow field with the aid of hot-wire anemometer and of total pressure with a total pressure probe in the cell has been performed. The results have revealed interesting features about the cell flow structures and their variations along the stalled performance branch of the compressor. INTRODUCTION Rotating stall in axial flow compressors is a well-known instability phenomenon that limits compressors operating field in the low flow regimes. When the mass flow is reduced at constant rotational speed the practically axisymmetric field becomes asymetric and rotating perturbations develop leading to poor performances. The number, rotational frequency, circumferential and radial extension of the rotating cells can vary significantly from one compressor to another. Some general trends have been observed although exceptions are frequent. It has been observed that in progressive stall it is more frequent the presence of many fast part-span cells while abrupt stall is more likely to happen with few slow cells, Pampreen (1993). Moreover, abrupt stall is more frequent in multi stage compressor with high hub-to-tip ratio, while progressive stall is more likely to be encountered in low hub to tip ratio fans and compressors. In the numerical work by Takata e Nagano (1972), it has been seen that a variation in the number of cells was observed only when a second blade row was placed in the field. Therefore it can happen that changing the number of bladerows can bring a variation in the number of cells. The present work focuses on the effect of IGV removal in a two-stage, high hub-to-tip ratio axial- flow compressor. In the present model a series of tests has been conducted with the original configuration comprising variable stagger inlet guide vane. The blade row consists of 23 symmetrical profile blades, and in the previous test campaign the IGV stagger angle was set equal to 0° so that the IGV would just keep the flow axial in front of the first rotor blade row as shown in figure 1.c. Since the complete determination of the cinematic structure of the cell implies the measurement of flow quantities in the upstream sections and the presence of the IGV with its variable stagger and clocking
Transcript of THE INFLUENCE OF THE IGV ON THE ROTATING STALL … 01.pdf · 2 device was forbidding the probe...

1
THE INFLUENCE OF THE IGV ON THE ROTATING STALL CELL STRUCTURE IN A TWO-STAGE LOW-SPEED AXIAL-FLOW COMPRESSOR
F. Nurzia, C. Palomba and P. Puddu
Mechanical Engineering Department University of Cagliari, Piazza D’armi 09123 Cagliari Italy -390706755709 fax +390706755717
[email protected], [email protected], [email protected] ABSTRACT
Rotating stall instability in axial flow compressors arises when the mass flow is reduced at constant rotational speed. Despite the number of experimental and theoretical work already published in the scientific literature, many questions still remain unanswered. This work addresses the issue of rotating cell structure as a part of a fundamental research program of the Department of Mechanical Engineering of Cagliari on rotating stall. The general scope being that of reaching a better understanding of the basic flow structures in relationship with the global compressor performance during rotating stall. The effect of IGV removal on the cell structure both in terms of number of cells and of cinematic structure of the cell during abrupt full 1-cell stall in a two-stage axial flow compressor has been studied. The experimental determination of 3D flow field with the aid of hot-wire anemometer and of total pressure with a total pressure probe in the cell has been performed. The results have revealed interesting features about the cell flow structures and their variations along the stalled performance branch of the compressor.
INTRODUCTION
Rotating stall in axial flow compressors is a well-known instability phenomenon that limits compressors operating field in the low flow regimes. When the mass flow is reduced at constant rotational speed the practically axisymmetric field becomes asymetric and rotating perturbations develop leading to poor performances. The number, rotational frequency, circumferential and radial extension of the rotating cells can vary significantly from one compressor to another. Some general trends have been observed although exceptions are frequent. It has been observed that in progressive stall it is more frequent the presence of many fast part-span cells while abrupt stall is more likely to happen with few slow cells, Pampreen (1993). Moreover, abrupt stall is more frequent in multi stage compressor with high hub-to-tip ratio, while progressive stall is more likely to be encountered in low hub to tip ratio fans and compressors. In the numerical work by Takata e Nagano (1972), it has been seen that a variation in the number of cells was observed only when a second blade row was placed in the field. Therefore it can happen that changing the number of bladerows can bring a variation in the number of cells.
The present work focuses on the effect of IGV removal in a two-stage, high hub-to-tip ratio axial-flow compressor. In the present model a series of tests has been conducted with the original configuration comprising variable stagger inlet guide vane. The blade row consists of 23 symmetrical profile blades, and in the previous test campaign the IGV stagger angle was set equal to 0° so that the IGV would just keep the flow axial in front of the first rotor blade row as shown in figure 1.c. Since the complete determination of the cinematic structure of the cell implies the measurement of flow quantities in the upstream sections and the presence of the IGV with its variable stagger and clocking

2
device was forbidding the probe carrier positioning, the IGV has been removed and substituted with a similar slightly longer vane-less duct. This different configuration has brought major variations to the stall regime while, as expectable, the steady performance has not been influenced by it.
The cell structure itself could be influenced by IGV removal. Previous experimental works, Das and Jiang (1984), Breugelmans and Mathioudakis (1985), Nurzia et al (2000), Puddu et al (2001) have revealed that abrupt one-cell stall may present complex flow structures and that the mechanism of cell rotation and the type of interaction among the different flow regions are not completely clear. Especially with regards to the concept of passive or active cell. In the very early models of stall Fabri and Siestrunck (1957) the cell was thought of as a “dead flow” region. The work of Day and Cumpsty (1978), proposed an active interpretation of cell motion involving a tangential crossing of the clean flow in the cell flow associated with the high values of tangential velocity component measured in the cell region. This model was not completely agreeing with the more recent works by Mathioudakis and Breugelmans (1985) and Das and Jiang (1984) In these works a tangential crossing is not in accordance with the velocity diagrams at the cell borders, nevertheless, the cell structure is far from being a dead wake region. The research project of the Department of Mechanical Engineering of Cagliari has applied hot-wire probes with the multirotation technique for the determination of the three dimensional flow field during rotating stall on a single rotor, single stage and two stage compressor. The
experimental results in a single rotor Palomba et al (1998) and in a two-stage compressor Nurzia et al (2000) show velocity components that are in agreement with the ones of Breuglemans and Mathioudakis and Das and Jiang thus supporting the idea that tangential crossing of clean flow is not possible. Later, Puddu et al (2001) through velocity and wall static pressure measurements identified different flow structures in the cell flow region for a two-stage low-speed axial flow compressor presenting single-cell abrupt rotating stall. The cell border regions called “interface” regions are characterised by high circumferential velocity gradients. A wide portion of the cell is characterised by high tangential and low axial flow component and constant static pressure extending axially over the whole compressor, this has been called “stalled flow region”. A third region is characterised by a strong and organised back flow that crosses the compressor from downstream to upstream following quite well the direction of the blades and the static pressure changes along the axial direction, this region has been called “back flow region”. The present work describes the differences in the cell number, frequency and structure due to the removal of the IGV and the influence on the overall performance on the stalled branch of the compressor characteristic curve.
Mid-span
Tip
Hub
ROTOR BLADE
γ
α1
α2
Rc
θ
Rc
Figure 1 a) Rotor Blade Stacking
Mid-span
Tip
Hub
STATOR BLADE
α1
α2θ
Rcγ
Rc
Figure 1b) Stator Blade stacking
IGV
ROT.1 STAT.1 ROT.2 STAT.2
sect.1 sect.2 sect.3 sect.4 sect.5 Figure 1c) Compressor blade rows at midspan

3
DESCRIPTION OF THE TWO-STAGE COMPRESSOR AND OF ITS PERFORMANCE CURVE
The axial flow compressor under investigation consists of two identical stages. Both rotors and stators consist of 32, C4 profile blades. The rotor and stator blades of constant chord are twisted with profiles stacked upon their centre of gravity as shown in Figure 1a and 1b, while the blade-to-blade plane at midspan is shown on Figure 1c. The compressor’s hub-to-tip ratio is 0.667 and the tip diameter is 0.381 m. In its original configuration an inlet guide vane was also present made of 23 blades with symmetric profiles and chord of 43.5 mm, shown in Figure 1c. The compressor operates in the test facility represented in Figure 2, designed and built at the Department of Mechanical Engineering of Cagliari to allow the determination of compressor characteristic curve according to the standard ISO CD 5801. The global performance compressor parameters have been determined according to the standards measuring the pressures at the given points in the test tunnel with the aid of a Betz micro-manometer for a rotational speed of 1500 rpm and rotor frequency of 25 Hz. More details about test facility and procedure may be found in Nurzia et al (2000) and Puddu et al. (2001). When the compressor has been modified by removing the IGV the performance curve in stable and unstable operation has been measured again and the results are shown in Figure 3b. Figure 3a reports the characteristic curve with the previous configuration for comparison. While the stable performance curve has not been modified by the modification of the inlet section, the stalled branch of performance curve has been deeply affected by it. First of all there are several throttle positions for which the number of cells is 2 which was never observed before. Moreover, the stalled branch presents itself an hysteresys evident for φ=0.25. When the compressor first enters stall, one cell is formed. Then as the mass flow is reduced the number of cells equals 2 until the end of the measured curve.
Compressor
OI
4 6 8
Pe6 P ∆
400 400 1200 1400 750
Pe4
valvestraightener venturi
0 600 0 1 2 3 4 5 6 7 8 9 10 11 12 13 14 MEASURING SECTIONS 15
Figure 2) Two stage compressor test facility
0.0 0.2 0.4 0.6 0.8 1.0 1.2 1.4Φ
0.0
0.4
0.8
1.2
1.6
Ψ
P2P1
Deep StallC
Figure 3a) Compressor characteristic curve with
IGV
0.0 0.2 0.4 0.6 0.8 1.0 1.2 1.4Φ
0.0
0.4
0.8
1.2
1.6
Ψ 2 intermittent cells
1 cell 1 cell 2 cells P3
Figure 3b) Compressor characteristic curve without IGV

4
Upon reopening the number of cells is one except for a region around ϕ=0.4, for which a 2 cell structure becomes again stable. Then in the hysteresis region a 1 cell structure dominates until stall disappears. In table 1, a summary of stalled configuration characterised by number of cells, cell frequency and cell extension is shown. In Figure 4 the two stalled branches are shown on the same graph for a better comparison. Not only the number and frequency of cells has varied but also the stalled branch of performance curve has now a different trend with the appearance of a secondary hysteresys starting upon throttle valve reopening for φ=0.25. One may also see that the recovery to stable operating condition for the new configuration happens earlier or for smaller values of the flow coefficient with respect to the initial configuration. The removal of IGV has destabilised the regular 1-cell pattern previously observed: even in the hysteresys branch of performance where a 1-cell structure seems to be established for both configurations, the observation of several cell events revealed that the cell pulses considerably more with respect to the previous 1-cell structure in the configuration with IGV.
Moreover, for many operating conditions in the deep stall region the cell structure often presents intermittency: although a one or two cell structure is predominant bursts of the other structures may appear. These characteristic forbids the measurement of cell flow in the deep stall region with the on-line ensemble averaging technique so far used. Therefore, full 3D flow measurements of the cell structure with hot wire and total pressure probe have been performed only on the hysteresys branch of performance curve in point P3.
In order to compare flow measurements that are made with hot wire during rotating stall to the global stable operating conditions calculated with the Betz micromanometer measurements, some sort of relationship has to be established that relates the two different types of measurements.
Throttle Position
Number of Cells Φ Ψ
Frequency Hz
165 1 0.653 0.843 9 175 2 0.580 0.865 21.66 186 2 0.501 0.843 21.8 195 2 0.420 0.812 21.94 205 2 0.357 0.777 22 215 2 0.300 0.743 22.14 225 2 0.245 0.693 19.74 235 2 0.184 0.707 19.74 245 2 0.143 0.659 19.34
240R 1 0.175 0.691 9.8 230R 1 0.212 0.713 9.87 220R 1 0.267 0.731 9.87 210R 1 0.318 0.723 9.87 200R 1 0.362 0.687 9.93 190R 1 0.406 0.658 9.73 180R 2 0.543 0.846 21.74 170R 2 0.608 0.867 21.26 160R 1 0.683 0.666 9 150R 1 0.669 0.638 8.8 140R 1 0.720 0.626 8.47 130R 1 0.794 0.601 8.07 120R 1 0.863 0.597 7.99 115R 1 0.895 0.627 8.133
Table 1) Stall operating conditions
0.0 0.2 0.4 0.6 0.8 1.0Φ
0.0
0.4
0.8
Ψ
IGV
NO IGV (closing valve)
NO IGV (opening valve)
Figure 4) Stalled branch of performance curve
5
0.00 0.20 0.40 0.60 0.80 1.00 1.20 1.40Φ
0.0
0.4
0.8
1.2
1.6
Ψ
Hysteresis
First Stall Point
A B CfsC
Afs
Equivalent Operating Points
0.0 0.4 0.8 1.2 1.6
Φ
0.0
0.4
0.8
1.2
1.6
Ψ
Cfs
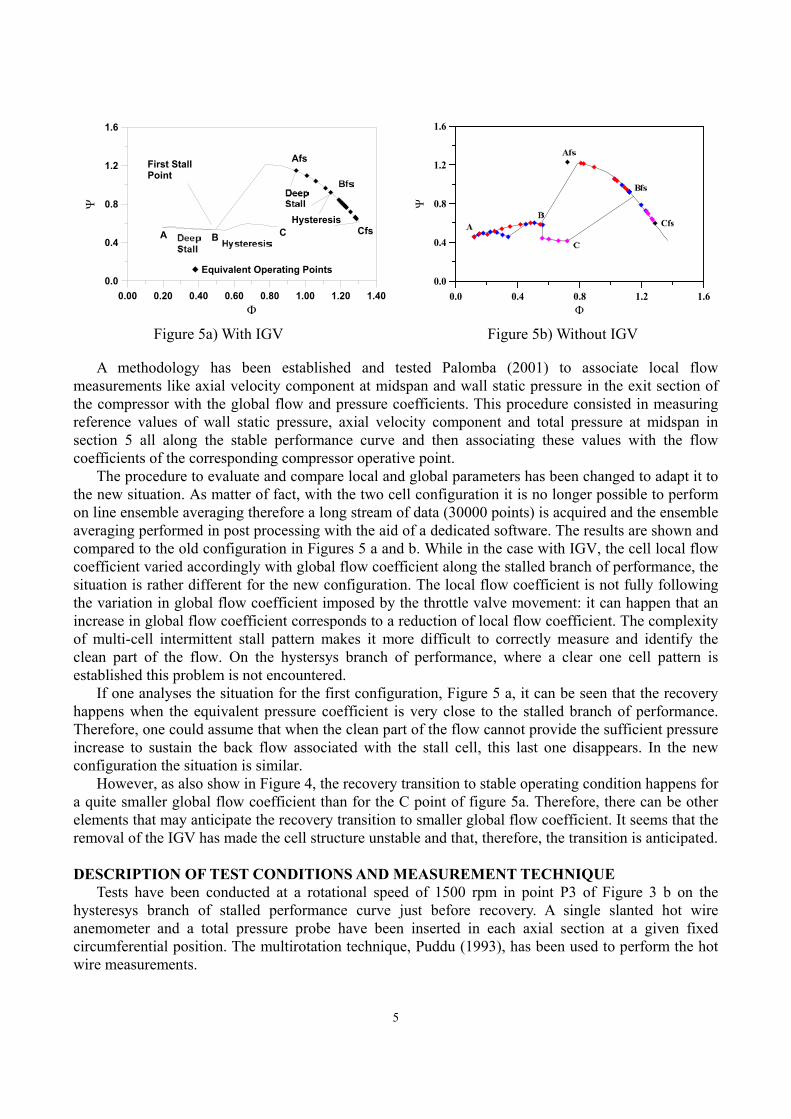
Figure 5a) With IGV Figure 5b) Without IGV
A methodology has been established and tested Palomba (2001) to associate local flow measurements like axial velocity component at midspan and wall static pressure in the exit section of the compressor with the global flow and pressure coefficients. This procedure consisted in measuring reference values of wall static pressure, axial velocity component and total pressure at midspan in section 5 all along the stable performance curve and then associating these values with the flow coefficients of the corresponding compressor operative point.
The procedure to evaluate and compare local and global parameters has been changed to adapt it to the new situation. As matter of fact, with the two cell configuration it is no longer possible to perform on line ensemble averaging therefore a long stream of data (30000 points) is acquired and the ensemble averaging performed in post processing with the aid of a dedicated software. The results are shown and compared to the old configuration in Figures 5 a and b. While in the case with IGV, the cell local flow coefficient varied accordingly with global flow coefficient along the stalled branch of performance, the situation is rather different for the new configuration. The local flow coefficient is not fully following the variation in global flow coefficient imposed by the throttle valve movement: it can happen that an increase in global flow coefficient corresponds to a reduction of local flow coefficient. The complexity of multi-cell intermittent stall pattern makes it more difficult to correctly measure and identify the clean part of the flow. On the hystersys branch of performance, where a clear one cell pattern is established this problem is not encountered.
If one analyses the situation for the first configuration, Figure 5 a, it can be seen that the recovery happens when the equivalent pressure coefficient is very close to the stalled branch of performance. Therefore, one could assume that when the clean part of the flow cannot provide the sufficient pressure increase to sustain the back flow associated with the stall cell, this last one disappears. In the new configuration the situation is similar.
However, as also show in Figure 4, the recovery transition to stable operating condition happens for a quite smaller global flow coefficient than for the C point of figure 5a. Therefore, there can be other elements that may anticipate the recovery transition to smaller global flow coefficient. It seems that the removal of the IGV has made the cell structure unstable and that, therefore, the transition is anticipated.
DESCRIPTION OF TEST CONDITIONS AND MEASUREMENT TECHNIQUE
Tests have been conducted at a rotational speed of 1500 rpm in point P3 of Figure 3 b on the hysteresys branch of stalled performance curve just before recovery. A single slanted hot wire anemometer and a total pressure probe have been inserted in each axial section at a given fixed circumferential position. The multirotation technique, Puddu (1993), has been used to perform the hot wire measurements.

6
Wz1.401.201.000.800.600.400.200.00
-0.20-0.40
Wz1.401.201.000.800.600.400.200.00
-0.20-0.40
a) Section 0 b) Section 5
Figure 6 ) Axial velocity component
Wr0.300.250.200.150.100.050.00
-0.05
Wr0.300.250.200.150.100.050.00
-0.05
a) Section 0 b) Section 5
Figure 7 ) Radial velocity component
Wt0.10.0
-0.1-0.2-0.3-0.4-0.5-0.6-0.7-0.8-0.9-1.0
Wt0.10.0
-0.1-0.2-0.3-0.4-0.5-0.6-0.7-0.8-0.9-1.0
a) Section 0 b) Section 5
Figure 8 ) Tangential velocity component

7
Once the acquisition frequency has been chosen, the number of points in one cell period depends upon cell frequency: as many as 800 points for a cell frequency of 8 Hz have been acquired. The flow field is measured based on ensemble averaged data phase locked to cell period. The acquisition is triggered by upstream wall static pressure signal, and data are averaged over 200 cell passages. Measurements have been performed at midspan in 7 axial sections (0,1,2,3,4,5,7 of Figure 2), while section 0 and section 5 have been investigated over the whole blade span at 8 radial positions. Section 0 is the new section obtained in the new free inlet duct and is located 0.05 m upstream of section 1. The measuring sections are shown in Figure 2, while the measuring sections 1 to 5 are indicated also in
Figure 1c with respect to compressor blade rows.
Hot wire measurements have been made with 12 rotations of the probe stem from 180° until –150° with a step of 30°.The measurement uncertainties given below correspond to the measurement performed with stationary flow conditions:
Velocity (Hot-wire multirotation technique)
• Mean velocity ± 2.5 % • Flow angle ± 2° • Probe position ± 0.1 mm
Pressure (total pressure probe multirotation)
• Pressure ± 2.5% The uncertainty will surely be higher in the interface regions of the flow Puddu et al (2000) where the rms of the measured cooling velocity increases significantly. However, the high repeatability found in the measurements over the years of testing on the same machine supports the results and gives confidence in the trends reported and in the qualitative description of the cinematic structure of the cell.
PRESENTATION OF RESULTS
The ensemble average technique phase locked to cell period allows to represent “instantaneous” pictures of average flow in cell reference frame.
Figure 6 shows the non dimensional axial flow component in section 0 and in section 5. The areas of iso-velocity reveal that while in section 5 downstream of the compressor the back
0
250
500
1.61.20.80.40.0
-0.4-0.8-1.2-1.6-2.0-2.4
Circumferential position [°]
Axi
allo
catio
n[m
m]
S2
S1
R1
R2
CLEAN FLOW CELL FLOW
0 60 120 180 240 300 360
CPt
U
IGV
Figure 9) Midspan Configuration with IGV
0
250
500
1.61.20.80.40.0
-0.4-0.8-1.2-1.6-2.0-2.4
Circumferential position [°]
Axi
allo
catio
n[m
m]
S2
S1
R1
R2
CLEAN FLOW CELL FLOW
0 60 120 180 240 300 360
CPt
U
Figure 10) Configuration without IGV

8
flow extends over the whole blade span (full-span), in section 0, it is only located in the tip region (part-span). On both sides of the cell region, there are wide regions characterized by tangential gradients of the axial flow component revealing that for this configuration the interface region characterized by velocity gradients is quite extended, in circumferential direction. Figure 7 compares the non dimensional radial velocity component in both sections. The clean flow region is characterised upstream by almost zero radial velocity component as expectable, while in the cell region gradients are present. The upstream section is characterised by high radial velocity component gradients in the tail of the cell Figure 7 a, while the downstream section, figure 7 b, reveals that high radial velocity components gradients are encountered in the cell head. In these regions the flow is centrifuged toward the casing wall with high positive values of radial velocity components.
Figure 8 shows the tangential velocity component in the cell reference frame. Therefore, flow with the tangential velocity component equal to cell speed is characterised by having zero relative tangential velocity component: the boundary between red and orange areas of iso-velocity values shows such condition. In the upstream section, this boundary comprises not only the back flow region at the tip highlighted in figure 6 a, but also al the region characterised by gradients of axial velocity component. In the downstream section, figure 8 b, such boundary covers the same area characterised by back flow in figure 6 b.
The tail region of the cell has negative tangential velocity component in the section 0 showing that the inlet flow is deviating to avoid the cell, it is evident that such flow direction will increase the incidence on the incoming blades that will very likely stall as it happens in the tail of the cell. This region is also characterised by very high radial velocity components Figure 7 a, and very low axial velocity component, Figure 6 a. The region left behind a rotating cell that moves in the circumferential direction is characterised also by very low total pressure values Nurzia et all 2008.
It is also interesting to see that if one identifies the cell region with the region enclosed by the iso-line of zero relative tangential velocity component then the cell does not remain axial along the compressor as in the upstream section this region is rotated forward in the direction of the cell motion with respect to the same region in section 5 downstream.
Figures 9 and 10 present the results obtained at midspan for the two geometries investigated with and without IGV in terms of total pressure and velocity vectors. There are a few important variations occurred that are interesting to show. First of all, the clean part of the flow in the configuration without IGV, Figure 10, shows a circumferential gradient of velocity and of total pressure, the same was not true for the case with IGV where the gradients where limited to the interface region close to the cell boundaries, Figure 9. Considering the cell region, one may notice that the first rotor is not more involved in the energy exchange with the back flow. No increase of the total pressure coefficient is observed across rotor 1 from downstream to upstream in figure 10, while this was true for the configuration with IGV, Figure 10. Moreover, in the tail part of the cell a wider region of low total pressure coefficient is present. This region, where the blades stall, is characterised by very low total pressure coefficients. This behaviour is present also in the configuration with IGV but it is limited to a smaller region with higher values of total pressure coefficient.
CONCLUSIONS
The experimental investigation of stall in a two-stage axial-flow compressor has been conducted with the aid of a single slanted hot wire and the multirotation technique and of a total pressure probe. This work aimed at the investigation of the effect of IGV removal on the rotating stall phenomenon including the inlet flow condition upstream of the compressor. The results obtained demonstrate that, although the general features of the cell and clean flow have not been modified by the modification of the inlet (removing the IGV), some important aspects have changed:

9
• The unstable branch of performance curve has been deeply affected. The number of cells, their frequencies and the performances have changed: a small hysteresys in the deep stall region has appeared upon reopening when a one cell structure appears.
• For the operating point investigated the clean part of the flow is less organised and presents circumferential gradients of velocity and pressure. This is likely due to the fact that the IGV was keeping the clean flow axial and uniform at the inlet, while now the clean flow is free in the large static pressure gradient created by the presence of the rotating cell.
NOMENCLATURE Ca Axial velocity component CPt = (PT-PTI)/(1/2ρUt
2) Total pressure coefficient P Pressure Ut Blade tip speed φ=Ca/Ut Flow-rate coefficient ψ = (PSO-PTI)/(1/2ρUt
2) Total-to-Static pressure coefficient ρ Fluid density A, B, C Operating points on the stalled performance curve Afs, Bfs, Cfs Equivalent operating points of the clean flow on the stable performance curve corresponding to A, B, C Subscripts a, θ ,r axial, tangential, radial directions fs clean flow I compressor inlet O compressor outlet S static T total t tip
REFERENCES Breugelmans, F.A.E., Mathioudakis, K., 1985, “The Three Dimensional Flow Field Inside an Axial Flow Compressor Operating in Rotating Stall”, 7° ISABE, Pag. 726-733 Das, D.K. and Jiang, H.K.;1984 "An Experimental Study of Rotating Stall in a Multistage Axial Flow Compressor" J. of Eng. for Gas Turbines and Power, vol. 106, July 1984, pag.542-551 Day, I. J., and Cumpsty, N. A.; 1978, “The Measurement and Interpretation of Flow within Rotating Stall Cells in Axial Compressors”, Journal of Mechanical Engineering Sciences, The Institution of Mechanical Engineers, Vol. 20, N. 2, 1978 Day, I.J., Greitzer, E.M. and Cumpsty, N.A.; (1978) " Prediction of Compressor Performance in Rotating Stall", Journal of Engineering for Power, vol. 100, Jan. 1978, pag. 1-12 Fabri, J.and Siestrunck, R.; (1957) “Rotating Stall in Axial flow Compressors” Journal of The Aeronautical Sciences, Nov. 1957, pag. 805-812 Moore, F.K.; (1984) "A Theory of Rotating Stall of Multistage Axial Compressors: Part I, II e III" Journal of Engineering for Gas Turbines and Power, vol. 106, April 1984, pag. 313-336
10
Nurzia, F., Palomba, C., and Puddu, P.; (2000) “Experimental investigation of Stall in a two Stage compressor” ASME 2000–GT-571 Monaco June F. Nurzia, C. Palomba and P. Puddu ; “Experimental investigation of rotating stall in a two-stage axial-flow compressor” 12th International Symposium on Transport Phenomena And Dynamics of Rotating Machinery, Honolulu, Hawaii, February 17-22, 2008 Palomba C., Puddu P., and Nurzia F.; “ 3D Flow Field Measurement Around a Rotating Stall Cell”, 43rd ASME 98-GT-596, 1998 June, Stockholm Palomba C.; “L’interpretazione dello stallo rotante alla luce di nuovi risultati sperimentali” Atti della facoltà di ingegneria, vol. 44 n. XXIX – ottobre 2001 C. Palomba, P. Puddu And F. Nurzia; “ Experimental Investigation Of Rotating Stall Cell Structure Variation During Recovery” 5th European Turbomachinery Conference On Turbomachinery, Fluid Dynamics And Thermodynamics, Prague, March 2003, Pag.187-196 C. Palomba; “Analysis of Local Flow Structure and Global Compressor Performance During Rotating Stall”, ASME Turbo EXPO 2004, Vienna Pampren, R., C.; "Compressor Surge and Stall", Concepts ETI, Norwich, Vermont, USA, 1993 Puddu, P. (1993), “Misure di turbolenza in elementi fissi e rotanti di turbomacchine con l’impiego di sonde a filo caldo”, MIS-MAC IV, Trieste, Italy Puddu, P., Palomba, C., and Nurzia, F.; (2001) “Comparison of Pressure and Velocity Measurements During One Cell Rotating Stall” MIS-MAC VII, Cagliari - April 2001 pag. 39 – 48 Takata, H., Nagano, S.; “Nonlinear Analysis of Rotating Stall”, ASME Paper N° 72-GT-3, 1972