
The India challenge - ING WB · Business opportunities report India ING Economics Department The...
14
Business opportunities report India ING Economics Department The India challenge India 25 september 2012 India’s growth rate this year is comparably low at 5.5% — near its 9-year low. Yet it is still six times higher than growth in the euro zone. It will take at least another year to bring India back to its potential output growth rate of 7.5% per year. A power failure at the beginning of August illustrates the severe structural problems the country faces. We still expect India to become the world’s fourth largest economy by 2030, as Goldman Sachs forecast in 2003. This will largely be achieved the Indian way, based on domestic strength with some help from outside. In this process, Dutch companies can play an important role by exporting goods and services and starting local production facilities. Official Dutch trade statistics underestimate the Dutch export performance. Adding indirect Dutch exports via among others Belgium and Germany in- creases total exports to India in 2011 by 60%, from €2.5 billion to €4 billion. Based on our economic forecast for India, we expect Dutch exports, including indirect, to double in 2016 to €7.6 billion. Dutch expertise and products show a good fit with the Indian needs, including the export potential. Main observations - Long-term potential growth rate for India is 7.5%. In 2012-2016 we expect an average growth rate of 7.7%, carried by a still- growing, young, better-educated population - Domestic demand and service sector-led growth seems to make India less vulnerable to global economic shocks - Indian exports are shifting from low-growth regions to high-growth regions in Asia, the Middle East and Northern Africa - High skill and high-tech sectors gain share in domestic production and export package - India is the most attractive production loca- tion for most sectors in the KPMG study, Guide to International Business Location Costs, 2012 edition (p 6.) - Best scores are for clinical trials manage- ment, shared service centres, video game production, software development, electron- ic system testing, biomedical R&D, interna- tional financial services, medical device manufacturing and metal machining - Dutch export performance in India is much better than official trade statistics show us - Dutch export package of goods and services fits well with Indian needs Basic facts India vs EU27 India EU27 Nominal GDP (US$bn) 2,013 15,523 GDP growth rate in % 5.5 -0.4 Population (million) 1,233 503 GDP per capita (US$) 1,646 35,450 CPI (average %YoY) 8.5 2.5 GDP-composition by sector (%) Agriculture 15 2 Industry 28 25 Services 57 73 Policy rate end of period 7.75 0.50 Exchange rate (USD/INR, USD/EUR) end of period 56.50 0.83 Merchandise Exports US$bn 310 2,018 Merchandise Imports US$bn 504 2,142 Trade balance (US$bn) -194 -124 India current ratings (foreign currency) Rating Outlook Moody's Baa3 Stable S&P BBB- Negative Fitch BBB- Negative
Transcript of The India challenge - ING WB · Business opportunities report India ING Economics Department The...

Business opportunities report India ING Economics Department
The India challenge
India 25 september 2012
India’s growth rate this year is comparably low at 5.5% — near its 9-year low. Yet it is still six times higher than growth in the euro zone. It will take at least another year to bring India back to its potential output growth rate of 7.5% per year. A power failure at the beginning of August illustrates the severe structural problems the country faces. We still expect India to become the world’s fourth largest economy by 2030, as Goldman Sachs forecast in 2003. This will largely be achieved the Indian way, based on domestic strength with some help from outside. In this process, Dutch companies can play an important role by exporting goods and services and starting local production facilities. Official Dutch trade statistics underestimate the Dutch export performance. Adding indirect Dutch exports via among others Belgium and Germany in-creases total exports to India in 2011 by 60%, from €2.5 billion to €4 billion. Based on our economic forecast for India, we expect Dutch exports, including indirect, to double in 2016 to €7.6 billion. Dutch expertise and products show a good fit with the Indian needs, including the export potential.
Main observations - Long-term potential growth rate for India is
7.5%. In 2012-2016 we expect an average growth rate of 7.7%, carried by a still-growing, young, better-educated population
- Domestic demand and service sector-led growth seems to make India less vulnerable to global economic shocks
- Indian exports are shifting from low-growth regions to high-growth regions in Asia, the Middle East and Northern Africa
- High skill and high-tech sectors gain share in domestic production and export package
- India is the most attractive production loca-tion for most sectors in the KPMG study, Guide to International Business Location Costs, 2012 edition (p 6.)
- Best scores are for clinical trials manage-ment, shared service centres, video game production, software development, electron-ic system testing, biomedical R&D, interna-tional financial services, medical device manufacturing and metal machining
- Dutch export performance in India is much better than official trade statistics show us
- Dutch export package of goods and services fits well with Indian needs
Basic facts India vs EU27 India EU27 Nominal GDP (US$bn) 2,013 15,523 GDP growth rate in % 5.5 -0.4 Population (million) 1,233 503 GDP per capita (US$) 1,646 35,450 CPI (average %YoY) 8.5 2.5 GDP-composition by sector (%)
Agriculture 15 2 Industry 28 25 Services 57 73
Policy rate end of period 7.75 0.50 Exchange rate (USD/INR, USD/EUR) end of period
56.50
0.83
Merchandise Exports US$bn 310 2,018 Merchandise Imports US$bn 504 2,142 Trade balance (US$bn) -194 -124
India current ratings (foreign currency) Rating Outlook Moody's Baa3 Stable S&P BBB- Negative Fitch BBB- Negative

India 25 september 2012 2
Figure 1 Development GDP India (constant prices)
-6
-4
-2
0
2
4
6
8
10
12
14
16
'00 '01 '02 '03 '04 '05 '06 '07 '08 '09 '10 '11 '12 '13 '14
%
-6
-4
-2
0
2
4
6
8
10
12
14
16
China India US Eurozone Netherlands
forecast
Source: EcoWin, ING Favourable economic growth prospects This year’s 5.5% growth rate is one of the lowest in nine years. Yet growth in India is still almost six times higher than in the euro zone. On the domestic front, India’s slow-down is a combination of a delayed impact of aggressive policy tightening, persistently high inflation and a lack of clarity on economic policies amid continuous policy inac-tion. Consumption remains robust, primarily led by im-proved job prospects and rising wages. Yet the pace of growth declined. Government initiatives for the underprivi-leged provided additional purchasing power to the rural population. Investment activity slowed down due to the weak global sentiment, delays in project approvals and high interest costs. We expect investment activity to pick later this year, thanks to easing inflation pressure and lower interest rates. The largest sector contributions come from the service sector and manufacturing industry. Due to a lack of policy measures, the Centre’s fiscal deficit will end this year at 5.5% of GDP. The government deficit plus the private sector deficit adds up to a current account deficit of 4.5% of GDP. Financing this deficit makes India highly de-pendent on capital flows. The twin deficit causes concerns for the Reserve Bank of India and global financial markets (see rating overview in basic facts) and made the Indian rupee eventually the worst currency performer amongst its Asian peers, but recovering in last months. We expect the Indian economy to grow in 2012 – 2016 by 7.7% on average. On the demand side, private consump-tion and investment will be the main drivers of GDP growth. On the production side, the main contribution to growth will come from the expanding labour force, the increase of capital stock and improved productivity. A lack of coordinated government policies together with increas-ing commodity prices may endanger the favourable growth prospects.
EMU breakup no showstopper A possible breakup of the European Monetary Union will harm the Indian economy due to its strong links with EU countries (EU27 share of total Indian exports is 19%) and the impact on financial markets sentiment. In figures, an EMU breakup will result in India losing 3% GDP growth accumulated over a three-year period. Investments and exports will be hit hardest and add 900,000 unemployed. India is a two-tier economy, with a cutting-edge and glob-ally competitive, knowledge-driven services sector em-ploying the brightest of the middle classes on the one hand, and a largely rain-dependent agricultural sector that employs the majority of the vast, poorly-educated labour force on the other. The manufacturing sector has a reputa-tion for low-quality goods, but this has changed rapidly in recent years. India’s strong national performance masks considerable interstate variation in terms of economic growth, economic policy, population and human development. Since the start of economic reforms in 1991, coastal states such as Gujarat and Maharashtra have been the fastest-growing, with rates of around 6-11%, comparable with oth-er East Asian economies. High-growth private-sector industries are concentrated around Mumbai in Maharashtra; in parts of Gujarat; around Delhi, including in Haryana and western Uttar Pradesh; and in the corridor from Bangalore in Karnataka to Chennai in Tamil Nadu. These states account for about 80% of foreign direct investment. As trade was liberalised and industry freed to locate where it wished, industrial development became concentrated in the south and along the west coast. The software export boom has also been largely concentrated in the southern and western cities of Chennai, Bangalore, Mumbai and Hyderabad. The process of economic policy reform that began in 1991 had important implications for state-level growth: the pros-perous states with better-performing administrations ap-pear to have benefited the most from reforms.

India 25 september 2012 3
Drivers and hurdles of long-term Indian economic development
Drivers - Growing young population that is increasingly educat-
ed. The demographic dividend (labour force growing faster than the population) will continue for India butl ended already for China.
Figure 2 Population development 2010-2030 only age group to decline
0
20
40
60
80
100
120
140
0 5 10 15 20 25 30 35 40 45 50 55 60 65 70 75 80 85 90 95 100
million
age group
0
20
40
60
80
100
120
1402010 2030
Source: UN statistics, ING calculations - Higher employment and higher wages - Increasing spending power - Differences in spending power within the country are
substantial. Differences with the EU are big. Figure 3 Income distribution Indian population (current prices)
148
279
333
373
2757
96
28 50
552
423349
260
215
146
8630
85 13
0%
20%
40%
60%
80%
100%
2005 2010 2015 2020
population
US$0-1000 US$1,001-2,500 US$2,501-5,000 US$5,001-10,000 > US$10,000
743 mln 827 mln 912 mln 994 mln
Source: Euromonitor International, ING calculations - Higher personal incomes generate more expenditure
on consumption, which at the same time triggers more import of consumption goods. This increasing spend-ing power already attracted the attention of corporate companies many years ago. The middle class is seen as the most attractive consumer target group. The def-inition of middle class depends on what you want to
sell. More luxury goods will be sold to Indian house-holds with an annual income of at least USD 10,000. In 2020, there will be 50 million people in India earning USD 10,000 or more. In 2020, the EU will have 389 mil-lion inhabitants with at least USD 10,000 income per year. Focus on lower income categories in India immediately increases the potential market.
Figure 4 Income distribution India compared with EU27
279
373
96
4830
347389
01
260
423
6 2
86
215
18 8
275013
0%
10%
20%
30%
40%
50%
60%
70%
80%
90%
100%
2010 2020 2010 2020
population
US$0-1000 US$1,001-2,500 US$2,501-5,000US$5,001-10,000 > US$10,000
827 mln. 994 mln. 420 mln. 429 mln.
Source: Euromonitor International, ING calculations Figure 5 Expenditure by category 2010-2020
15%21Communication
12%23Education
9%951Total
11%126Misc goods and services
13%27Hotels and catering
11%12Leisure and recreation
Transport
Health goods and medical services
Household goods and services
Housing
Clothing and footwear
Alcoholic beverages and tobacco
Food and non-alcoholic beverages
11%
11%
10%
8%
13%
4%
4%
CAGR2010-2020
168
45
37
138
61
31
263
2010 ($ bn1)
Source: Euromonitor International, ING calculations 1(USD current prices y-o-y exchange rate)

India 25 september 2012 4
- Most notable consumer expenditure increases are expected in the period 2010-2020 in communication, clothing and footwear, education, leisure and recrea-tion.
- Since income is unevenly distributed across the coun-try, the majority of “middle class households” are found in and near a few cities. Companies starting to produce in India for the Indian market need to reduce cost levels, tailor products to Indian customers’ preferences and focus on regions where there target income groups are living.
- The role of the private sector is increasing in Indian businesses. Controlling shareholders in listed Indian companies include 49% private enterprises, 20% for-eign, mainly private enterprises and 31% government. Figures for China show 28% private enterprises, 3% foreign and 68% government companies (Source UN Committee on Infrastructure).
- Domestic production as well as the export package becomes increasingly sophisticated.
- India is one of the most specialised economies among the world‘s main exporters of services. Export of ser-vices accounts for 38%, China only 9%. IT-related ser-vices exports have exploded since 2003 (Source CEIC).
- Trade openness is increasing further: tariffs are declin-ing and more trade alliances and new special econom-ic zones (SEZ) are established.
- Average level of productivity in India is currently only 9% of that of the US and 75% of China. There is a lot of room for improvement.
- India must be able to enjoy large productivity gains by enlarging and modernising its fixed capital stock, im-proving the skill level of its workforce and shifting re-sources towards higher productivity sectors, particu-larly from agriculture to services.
- Increasing attractiveness for foreign investors. Hurdles - Persistent, widespread poverty. - Literacy rate still below 70%; school dropout rate is
30%. - Skill distribution of labour force: 58% agricultural la-
bour; unskilled 38%; skilled 4%. In China, 44% agricul-tural labour, 48% unskilled and 8% skilled.
- Brain drain to the US is a big disadvantage for the Indi-an economy.
- Bureaucracy and corruption frustrates smooth opera-tion of the economy.
- Lack of a well-operating infrastructure in all areas need to be addressed to elevate economic growth and increase employment. A recent power failure leaving 600 million people without electricity for several days highlights the urgency to address the power problem.
- The disappointing low ranking of India in the World Bank indicator of the ease of doing business underlines the importance of the issues jeopardising the effort to bring India to a higher economic growth path.
- Breakdown of India’s exports by commodity still shows a high share of low-tech and a low share of high-tech products. However, recent statistics on the production and export package show this is changing.
- Indirect taxes in India are among the highest in Asia. - India is a debtor country while China is a creditor in-
ternationally. - Foreign direct investments flows into India are much
less than flows into China. This is due to all kind of re-strictions on FDI in India
- Domestic savings by households, companies and gov-ernment are insufficient to finance the required in-vestments in equipment and infrastructure. This short-age of domestic savings is reflected in a structural def-icit in the government budget and the current account. Addressing the so-called twin deficit requires gov-ernment action to cut expenditure and/or increase the tax base.
- So far, financing of the current account has not been too difficult. Dependence on external financing makes the country more vulnerable to changes in sentiment on the financial markets.
India 25 september 2012 5
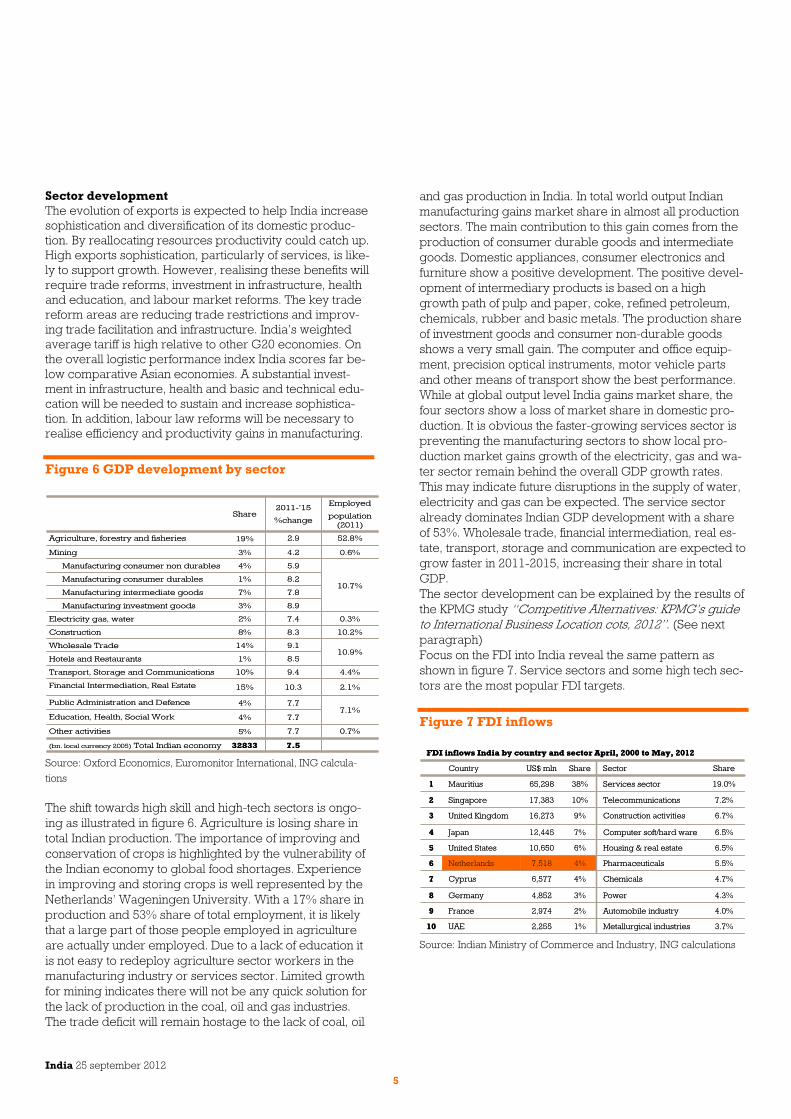
Sector development The evolution of exports is expected to help India increase sophistication and diversification of its domestic produc-tion. By reallocating resources productivity could catch up. High exports sophistication, particularly of services, is like-ly to support growth. However, realising these benefits will require trade reforms, investment in infrastructure, health and education, and labour market reforms. The key trade reform areas are reducing trade restrictions and improv-ing trade facilitation and infrastructure. India’s weighted average tariff is high relative to other G20 economies. On the overall logistic performance index India scores far be-low comparative Asian economies. A substantial invest-ment in infrastructure, health and basic and technical edu-cation will be needed to sustain and increase sophistica-tion. In addition, labour law reforms will be necessary to realise efficiency and productivity gains in manufacturing. Figure 6 GDP development by sector
7.5
7.7
7.7
7.7
10.3
9.4
8.5
9.1
8.3
7.4
8.9
7.8
8.2
5.9
4.2
2.9
2011-’15%change
10.9%
0.3%2%Electricity gas, water
3%Manufacturing investment goods
7%Manufacturing intermediate goods
32833(bn. local currency 2005) Total Indian economy
10.2%8%Construction
0.7%5%Other activities
7.1%4%Education, Health, Social Work
4%Public Administration and Defence
15%
10%
1%
14%
1%
4%
3%
19%
Share
2.1%
4.4%
10.7%
0.6%
52.8%
Employedpopulation
(2011)
Financial Intermediation, Real Estate
Transport, Storage and Communications
Hotels and Restaurants
Wholesale Trade
Manufacturing consumer durables
Manufacturing consumer non durables
Mining
Agriculture, forestry and fisheries
Source: Oxford Economics, Euromonitor International, ING calcula-tions The shift towards high skill and high-tech sectors is ongo-ing as illustrated in figure 6. Agriculture is losing share in total Indian production. The importance of improving and conservation of crops is highlighted by the vulnerability of the Indian economy to global food shortages. Experience in improving and storing crops is well represented by the Netherlands’ Wageningen University. With a 17% share in production and 53% share of total employment, it is likely that a large part of those people employed in agriculture are actually under employed. Due to a lack of education it is not easy to redeploy agriculture sector workers in the manufacturing industry or services sector. Limited growth for mining indicates there will not be any quick solution for the lack of production in the coal, oil and gas industries. The trade deficit will remain hostage to the lack of coal, oil
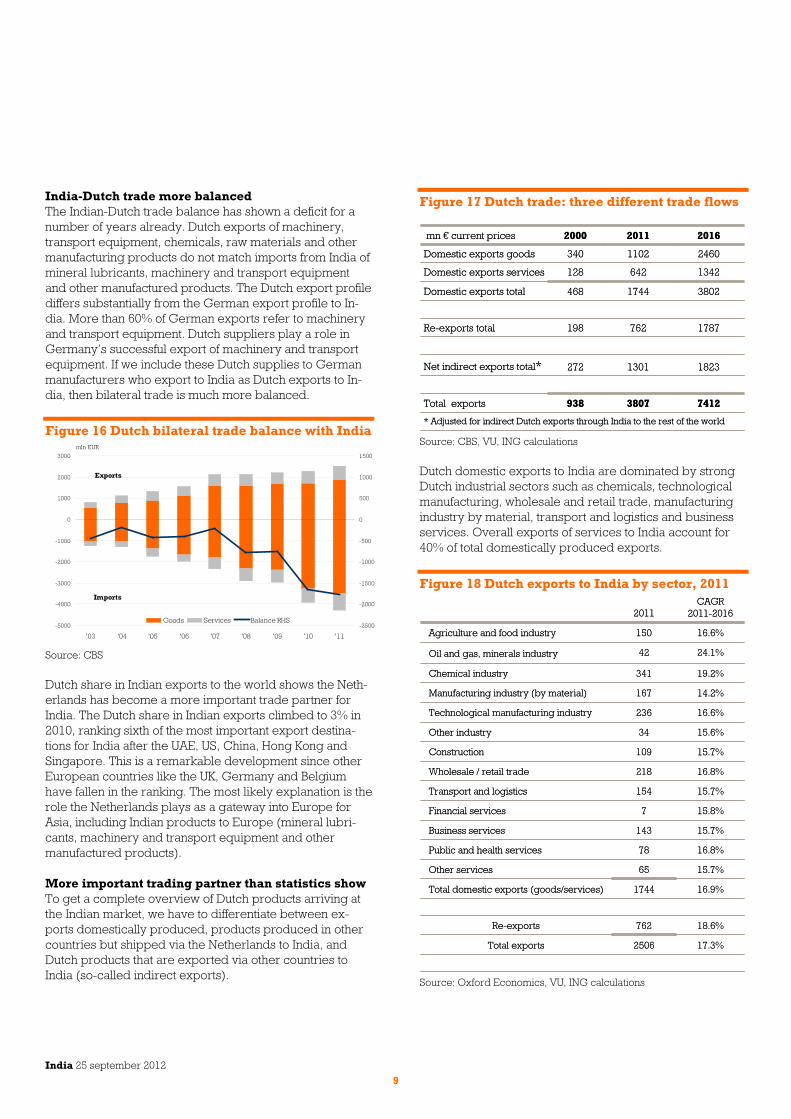
and gas production in India. In total world output Indian manufacturing gains market share in almost all production sectors. The main contribution to this gain comes from the production of consumer durable goods and intermediate goods. Domestic appliances, consumer electronics and furniture show a positive development. The positive devel-opment of intermediary products is based on a high growth path of pulp and paper, coke, refined petroleum, chemicals, rubber and basic metals. The production share of investment goods and consumer non-durable goods shows a very small gain. The computer and office equip-ment, precision optical instruments, motor vehicle parts and other means of transport show the best performance. While at global output level India gains market share, the four sectors show a loss of market share in domestic pro-duction. It is obvious the faster-growing services sector is preventing the manufacturing sectors to show local pro-duction market gains growth of the electricity, gas and wa-ter sector remain behind the overall GDP growth rates. This may indicate future disruptions in the supply of water, electricity and gas can be expected. The service sector already dominates Indian GDP development with a share of 53%. Wholesale trade, financial intermediation, real es-tate, transport, storage and communication are expected to grow faster in 2011-2015, increasing their share in total GDP. The sector development can be explained by the results of the KPMG study “Competitive Alternatives: KPMG’s guide to International Business Location cots, 2012”. (See next paragraph) Focus on the FDI into India reveal the same pattern as shown in figure 7. Service sectors and some high tech sec-tors are the most popular FDI targets. Figure 7 FDI inflows
10
9
8
7
6
5
4
3
2
1
FDI inflows India by country and sector April, 2000 to May, 2012
3.7%Metallurgical industries1%2,255UAE
Automobile industry
Power
Chemicals
Pharmaceuticals
Housing & real estate
Computer soft/hard ware
Construction activities
Telecommunications
Services sector
Sector
4.0%
4.3%
4.7%
5.5%
6.5%
6.5%
6.7%
7.2%
19.0%
Share
2%
3%
4%
4%
6%
7%
9%
10%
38%
ShareUS$ mlnCountry
2,974
4,852
6,577
7,518
10,650
12,445
16,273
17,383
65,298Mauritius
France
Germany
Cyprus
Netherlands
United States
Japan
United Kingdom
Singapore
Source: Indian Ministry of Commerce and Industry, ING calculations

India 25 september 2012 6
Competitive advantage Indian sectors of industry The Indian sector development is dominated by the devel-opment of the domestic market, although exports are gradually becoming more important. More than in any oth-er country, the service sector is the most important pillar of the economic development. Low wage rates in India stimu-late the growth of the service sector. Although still very low, even compared to China, wages are increasing faster in India (and China) than the Netherlands. The international competitive advantage of Indian sectors of industry are not only expressed in wage cost differences. Additional costs linked to local production sometimes mitigate the huge wage cost differentials. In addition, other hurdles as pre-sented in the World Bank ranking of the ease of doing business can play an important role in assessing India’s relative competitive position. KPMG’s Global Location and Expansion services conducted an analysis of the relative costs of doing business in 133 cities in 14 countries in ma-ture and high growth markets*. The scope of the study includes, apart from the cities, 19 industries and business operations, 26 location-sensitive cost factors and more than 30 non-cost competitive factors. More than 50,000 individ-ual data items were collected. Nine mature countries are included (G7 plus Australia and the Netherlands) and five countries in high growth markets (Brazil, Russia, India, China and Mexico). The location-sensitive cost compo-nents are: labour costs, including employment benefits, facility costs, transportation costs, utility costs, costs of capital, taxes other than on income and income tax. KPMG’s cost model applied current business cost data for each location to a set of business operating specifications that are generally held constant for all locations. The result is a comparison of the estimated cost of establishing and operating an equivalent facility in each location. We consider this study as one of the best as it covers a wide range of cost factors. To reflect physical productivity differences of labour, especially in high-growth markets, somewhat higher numbers of workers have been assigned in certain sectors to achieve a given level of output. The analysis assumes the same investment in all machinery and equipment for each specific business operation. Signifi-cant, generally applicable incentives (tax reductions) are also included in the study. Wage costs are a dominant cost component in many of the sectors of industry investigated. As shown in figure 8, wage costs in India are 70% to 80% lower than in the Netherlands, and are lowest among the 14 countries included in the KPMG Competitive Alternatives study. In the table below we use the Dutch cost level as reference (NL=100). In almost all sectors, the German la-bour cost level is the highest, and India’s the lowest. In the table showing total annual cost levels compared to the Netherlands (NL=100), India also has the lowest overall costs – although its cost advantage over China in percent-age terms is not as high as its labour cost advantage.
Figure 8 Salaries and wages (NL=100)
-
20
40
60
80
100
120
140
Food Proce
ssing
Shared Services Center
Plastic Pro
duct Manu
facturin
g
Metal M
achinin
Auto Parts M
anufac
turing
Pharmace
utical
Production
Medical Device M
anufacturin
g
Telecom Equipment Man
ufacturing
Precis
ion Component M
anufacturin
g
Specialty C
hemicals Manu
facturin
g
Electronic
s Asse
mbly
Aircraf
t Parts
Man
ufacturing
Advanced Batt
eries
Video Game Producti
on
Clinical T
rials
Management
Biomedical R&D
Internationa
l Fina
ncial Services
Software
Development
Electronic
Systems D
evelopment and
Testing
0
20
40
60
80
100
120
140 US Germany Brazil China India
Figure 9 Total annual cost levels
NL=100
85
85
83
80
78
77
77
75
72
71
70
63
52
51
47
35
34
30
29
India
86
85
84
83
80
79
80
77
74
74
74
67
67
65
64
59
55
40
52
China
96
95
95
96
96
96
90
93
93
93
91
90
103
105
102
99
97
75
100
Brazil
105
105
105
105
106
106
106
106
107
107
107
108
106
112
110
109
111
110
124
Germany
104Specialty Chemicals Manufacturing
105Precision Component Manufacturing
105Auto Parts Manufacturing
108Advanced Batteries
104Electronics Assembly
105Aircraft Parts Manufacturing
107Food Processing
105
107
109
108
107
109
111
118
105
109
103
118
US
Telecom Equipment Manufacturing
Pharmaceutical Production
Plastic Product Manufacturing
Metal Machining
Medical Device Manufacturing
International Financial Services
Biomedical R&D
Electronic Systems Development and Testing
Software Development
Video Game Production
Shared Services Center
Clinical Trials Management
Sector NL=100
85
85
83
80
78
77
77
75
72
71
70
63
52
51
47
35
34
30
29
India
86
85
84
83
80
79
80
77
74
74
74
67
67
65
64
59
55
40
52
China
96
95
95
96
96
96
90
93
93
93
91
90
103
105
102
99
97
75
100
Brazil
105
105
105
105
106
106
106
106
107
107
107
108
106
112
110
109
111
110
124
Germany
104Specialty Chemicals Manufacturing
105Precision Component Manufacturing
105Auto Parts Manufacturing
108Advanced Batteries
104Electronics Assembly
105Aircraft Parts Manufacturing
107Food Processing
105
107
109
108
107
109
111
118
105
109
103
118
US
Telecom Equipment Manufacturing
Pharmaceutical Production
Plastic Product Manufacturing
Metal Machining
Medical Device Manufacturing
International Financial Services
Biomedical R&D
Electronic Systems Development and Testing
Software Development
Video Game Production
Shared Services Center
Clinical Trials Management
Sector
Sectors offering the highest cost advantage are: 1. Clinical trials management; 2. Shared service centre; 3. Video game production; 4. Software development; 5. Electronic system testing; 6. Biomedical R&D; 7. International financial services; 8. Medical device manufacturing; and 9. Metal machining

India 25 september 2012 7
Indian trade performance The Indian development path chosen after the country gained independence was based on self-imposed isola-tion, according to Dietmar Rothermund in his book “The rise of an Asian giant”. This contributed to the development of the inner strength of the nation, but it also fostered an introvert mentality and resulted in a lack of competitive-ness. India finally broke out of this circle of isolation and faced the challenge of globalisation. This coincided with the technological revolution based on the introduction of computers. With a large supply of highly-educated man-power, India could make its mark on designing computer software and providing IT services support worldwide. Due to this late start, India still can be considered as a less open economy. Export and imports of goods and services is low, but increasing – 18.5 % of GDP compared with Chi-na at 29.4%. If we compare the development of Indian merchandise trade with Chinese trade the difference is clear. The development of trade in services seems to go more in parallel. India is becoming an important trader in services with a 3.2% share in global trade of services. Figure 10 Share in world trade India and China
0
1
2
3
4
5
6
7
8
9
10
11
'95 '96 '97 '98 '99 '00 '01 '02 '03 '04 '05 '06 '07 '08 '09 '10
%
merchandise
services
services
merchandise
Source: UNCTAD The composition of India’s exports is unique. The share of services exports has reached 35%, which is higher than in advanced countries, but the share of manufacturing ex-ports in total goods exports is still low. While services ex-ports have a high technology content and add high value, goods and manufacturing exports are still dominated by relatively low-tech and low-value added products, alt-hough there is a clear shift away from traditional exports (e.g. textiles, gems and leather products) towards medium and high-tech products. Indian services exports are more sophisticated relative to its income level. Nonetheless, ex-ports of Indian goods have remained below the average sophistication level of Asia, and is lower than China and Brazil.
Figure 11 Resource intensity of exports
0
5
10
15
20
25
30
35
40
'95 '96 '97 '98 '99 '00 '01 '02 '03 '04 '05 '06 '07 '08 '09 '10
billion USD
0
5
10
15
20
25
30
35
40
Manufactures with low skill and technology intensityManufactures with medium skill and technology intensityManufactures with high skill and technology intensityLabour-intensive and resource-based manufactures
Source: UNCTAD The evolution of exports is expected to help India increase sophistication, diversification and productivity. Trade di-versification by region will help India to keep up a high export growth rate. By switching exports from developed markets, including Europe, to developing Asia and coun-tries in the Middle East and North Africa (MENA), India secures its future export growth rates. Figure 12 Indian goods exports shift towards emerging regions
0%
5%
10%
15%
20%
25%
30%
35%
40%
45%
0%
5%
10%
15%
20%
25%
30%
35%
40%
45%
W-Europe EmergingEurope
OtherAfrica
EmergingAsia
MENA LATAM Otherdeveloped*
1995 201020052000
Source: UNCTAD, ING calculations (* Australia, Canada, Hong Kong, Taiwan, Israel, New Zealand, Singapore)

India 25 september 2012 8
Figure 13 Top 10 export partners India
2.2%
2.3%
2.7%
2.9%
3.0%
4.1%
4.3%
7.9%
10.8%
13.4%
% share
10
9
8
7
6
5
4
3
2
1
20101995
+3France3.2%Italy
Belgium
Germany
United Kingdom
Netherlands
Singapore
Hong Kong
China
United States
United Arab Emirates
Countries
-2
-4
-4
+6
+6
+1
+19
-1
+5
Change in ranking% shareCountries
3.3%
3.3%
3.5%
4.5%
5.7%
6.2%
6.3%
7.0%
17.4%United States
Russia
Bangladesh
Belgium
United Arab Emirates
Hong Kong
Germany
United Kingdom
Japan
Source: UNCTAD, ING calculations The regional shift introduced some new countries into In-dia’s top 10 major export partners. Topping the list is Unit-ed Arab Emirates, forcing the US into second place with newcomer China coming third. Except for France and the Netherlands, most EU countries lost some places in the top ranking. The Indian trade balance shows a continuously increasing deficit. Imports of energy (oil, coal and gold), transport equipment and machinery, plus the import of consumer goods, are a heavy burden on the Indian trade balance.
Figure 14 Trade balance India goods & services
-200
-100
0
100
200
300
400
500
'00 '01 '02 '03 '04 '05 '06 '07 '08 '09 '10
bln $
-200
-100
0
100
200
300
400
500
Trade balance Exports Imports
Source: UNCTAD Financing of the trade deficit or the current account deficit has not been much of a problem so far. Since non debt-creating capital inflows like FDI and portfolio investments are currently lagging, India is becoming more dependent on debt financing. In 2011, net FDI even shows a net out-flow. On going Indian investments outside the country re-flect a growing internalisation of the Indian business sector. The acquisition of Corus by Tata is an example of Indian investment in Dutch companies. It is highly likely that the current foreign direct investments by Indian companies
will continue. Main reasons are to secure access to global markets and acquire technologies important for the Indian companies. Figure 15 Inward and outward FDI (stock)
0
40
80
120
160
200
240
2000 2001 2002 2003 2004 2005 2006 2007 2008 2009 2010 2011
bln. USD
0.0
0.2
0.4
0.6
0.8
1.0
1.2%
Inward Outward Inward % world rhs Outward % world rhs
Source: Indian Ministry of Commerce and Industry, UNCTAD, ING calculations
India 25 september 2012 9
India-Dutch trade more balanced The Indian-Dutch trade balance has shown a deficit for a number of years already. Dutch exports of machinery, transport equipment, chemicals, raw materials and other manufacturing products do not match imports from India of mineral lubricants, machinery and transport equipment and other manufactured products. The Dutch export profile differs substantially from the German export profile to In-dia. More than 60% of German exports refer to machinery and transport equipment. Dutch suppliers play a role in Germany’s successful export of machinery and transport equipment. If we include these Dutch supplies to German manufacturers who export to India as Dutch exports to In-dia, then bilateral trade is much more balanced. Figure 16 Dutch bilateral trade balance with India
-5000
-4000
-3000
-2000
-1000
0
1000
2000
3000
'03 '04 '05 '06 '07 '08 '09 '10 '11
mln EUR
-2500
-2000
-1500
-1000
-500
0
500
1000
1500
Goods Services Balance RHS
Exports
Imports
Source: CBS Dutch share in Indian exports to the world shows the Neth-erlands has become a more important trade partner for India. The Dutch share in Indian exports climbed to 3% in 2010, ranking sixth of the most important export destina-tions for India after the UAE, US, China, Hong Kong and Singapore. This is a remarkable development since other European countries like the UK, Germany and Belgium have fallen in the ranking. The most likely explanation is the role the Netherlands plays as a gateway into Europe for Asia, including Indian products to Europe (mineral lubri-cants, machinery and transport equipment and other manufactured products). More important trading partner than statistics show To get a complete overview of Dutch products arriving at the Indian market, we have to differentiate between ex-ports domestically produced, products produced in other countries but shipped via the Netherlands to India, and Dutch products that are exported via other countries to India (so-called indirect exports).
Figure 17 Dutch trade: three different trade flows
3807
1301
762
1744
642
1102
2011
* Adjusted for indirect Dutch exports through India to the rest of the world
1787198Re-exports total
7412
1823
3802
1342
2460
20162000mn € current prices
938
272
468
128
340
Total exports
Net indirect exports total*
Domestic exports total
Domestic exports services
Domestic exports goods
Source: CBS, VU, ING calculations Dutch domestic exports to India are dominated by strong Dutch industrial sectors such as chemicals, technological manufacturing, wholesale and retail trade, manufacturing industry by material, transport and logistics and business services. Overall exports of services to India account for 40% of total domestically produced exports. Figure 18 Dutch exports to India by sector, 2011
15.6%34Other industry
16.8%78Public and health services
17.3%2506Total exports
18.6%762Re-exports
15.7%65Other services
16.9%1744Total domestic exports (goods/services)
15.7%143Business services
15.8%7Financial services
15.7%154Transport and logistics
16.8%
15.7%
16.6%
14.2%
19.2%
24.1%
16.6%
CAGR 2011-2016
218
109
236
167
341
42
150
2011
Wholesale / retail trade
Construction
Technological manufacturing industry
Manufacturing industry (by material)
Chemical industry
Oil and gas, minerals industry
Agriculture and food industry
Source: Oxford Economics, VU, ING calculations

India 25 september 2012 10
According to official statistics, Dutch exports to India in 2011 were EUR 2.5 billion. Of this, 30% refers to re-exports – products and services not produced in the Netherlands but shipped via Dutch ports to India. In addition to this EUR 2.5 billion, we have to add EUR 1.3 billion for indirect Dutch exports to India. This figure is calculated based on our Dutch trade model with modifications by the VU University Amsterdam. As shown in the graph, there is a substantial export flow via Belgium, Germany, Ireland and Switzerland to India. Examples of a supplier role by Dutch companies to German companies exporting to India causes a under-estimation of Dutch trade with India. What types of goods and services does this include? In the case of Germany, it often refers to car manufacturers using Dutch spare parts or satellite navigation systems. In the case of Ireland, this includes advisory services delivered by Dutch companies based in Ireland. Finally, we have to add EUR 1.3 billion of Dutch exports to the EUR 2.5 billion calculated by the Dutch statistics bureau, generating a total of EUR 3.8 billion in 2011. Based on the continuation of India’s high growth path, Dutch exports to India, including indirect exports, will amount to EUR 7.4 billion in 2016 indicating an annual nom-inal growth rate of 14.3%
Figure 19 Composition of Dutch exports to India 2000-2011
Exports 2000
28%
32%
12%
9%
14%
2%2%0%
Machinery and transport equipment
Chemicals
Crude materials
Miscellaneous manufactured articles
Manufactured goods
Mineral fuels
Food and live animals
Commodities and transactions, n.e.s.
Beverages and tobacco
Animal and vegetable oils, fats, waxes
Exports 2011
30%
25%
19%
12%
8%3% 2% 1%
Machinery and transport equipment
Chemicals
Crude materials
Miscellaneous manufactured articles
Manufactured goods
Mineral fuels
Food and live animals
Commodities and transactions, n.e.s.
Beverages and tobacco
Animal and vegetable oils, fats, waxes

India 25 september 2012 11
Box 1 Indirect exports – an additional EUR 1.5 billion of Dutch exports reaches India Exports are not only used to satisfy final demand in the importing country, but can also be used as an intermediary product in the destination country’s production process. Dutch components are included in products worldwide. It is also possible that Dutch products are re-exported via India to other countries. However, the analysis does not cover Indian re-exports. From oth-er countries, products, including the Dutch components, are exported to India. This implies that exports to other countries are not only driven by their final demand, but also by final demand of India. We refer to this as indirect exports through other coun-tries to India.
€ 23 mln.
€ 62 mln.
€ 92 mln.
€ 123 mln. € 975 mln.
€ 215 mln.
OTHER DEVELOPED WESTERN EUROPE
EMERGING EUROPE
LATIN AMERICAAFRICA / ME
EMERGING ASIA
Indirect Dutch exports (goods & services) to India
€ 1.5 billion
Agriculture and Food € 213 mln
Transport € 112 mlnOil, Gas and Minerals € 215 mln
Financial Services € 88 mlnChemicals € 187 mln
Business Services € 108 mlnManufacturing of Materials € 91 mln
Other Services € 69 mlnTechnological industrie € 158 mln
Other manufacturing € 32 mln
Distribution € 183 mln
Construction € 16 mln
Total indirect exports € 1.5 billionDutch sectors
283 mln.
Top 5 countries
249 mln.
100 mln.
79 mln.
63 mln.
direct Dutch exports (goods & services) to India
€ 2.5 billion

India 25 september 2012 12
Sources: CBS, data base
KPMG, Competitive Alternatives: KPMG’s Guide to Interna-
tional Business Location Costs, 2012 edition
Indian Ministry of Commerce and Industry
IMF, data base World Economic Outlook
Unctad, data bases on trade and foreign investments
Euromonitor, several publications
Oxford Economics data base and several publications
ING FM research (Upasna Bhardwaj), India Monthly
Dietmar Rothermund, The rise of an Asian giant

India 25 september 2012 13
Disclaimer The information in this report reflects the personal views of the analyst(s) and no part of the compensation of the ana-lyst(s) was, is or will be related, directly or indirectly, to the inclusion of specific |recommendations or views in this re-port. The analysts that contributed to this publication comply with all the requirements laid down by their national supervi-sors for the performance of their duties. This publication has been prepared on behalf of ING Bank N.V., established in Amsterdam, solely for the information of its clients. ING Bank N.V. is part of ING Groep N.V. This publication is not invest-ment advice or an offer or solicitation for the purchase or sale of any financial instrument. This publication is purely informa-tive and may not be regarded as advice. ING Bank N.V. se-cures its information from sources it regards as reliable and has taken all reasonable care to ensure that the information on which it based its view in this report are not untrue or mis-leading at the time of publication. ING Bank N.V. makes no representation that the information used by it is accurate or complete. The information in this report is subject to change without notice. Neither ING Bank N.V. nor any of its of direc-tors or employees accepts any liability for any direct or consequential loss arising from any use of this publication or its contents or mistakes in the printing and set-ting of this publication. Copyright and database rights protec-tion exist in this publication. Information in this publication may be used as long as the source is mentioned. In the Neth-erlands ING Bank N.V. is registered with and supervised by De Nederlandsche Bank and the Financial Markets Authority.

To find out more, visit ING.nl/kennis or call
Rob Rühl Head of Business Economics, ING ED Amsterdam + 31 20 56 39508 Mohammed Nassiri Research Assistant, ING ED Amsterdam + 31 20 56 34444
KPMG’s Global location and Expansion services Elbert Waller + 31 20 656 7009 www.competitivealternatives.com