
The Independents: Value Creation 2001- 1Q 2013 · PDF fileThe Independents: Value Creation...
59
Value Creation by Independent Oil & Gas Companies The Independents: Value Creation 2001- 1Q 2013 University of Houston, C.T. Bauer College of Business Student Research Project This report is developed solely for the purpose of class discussion. Cases and reports do not represent endorsements by the faculty or the C.T. Bauer College of Business on effective or ineffective management. 1
-
Upload
vuongkhuong -
Category
Documents
-
view
214 -
download
0
Transcript of The Independents: Value Creation 2001- 1Q 2013 · PDF fileThe Independents: Value Creation...

Value Creation by Independent Oil & Gas Companies
The Independents:
Value Creation 2001- 1Q 2013
University of Houston, C.T. Bauer College of Business
Student Research Project
This report is developed solely for the purpose of class discussion. Cases and reports do not represent endorsements by the faculty or the C.T. Bauer College of Business on effective or ineffective
management.
1

Value Creation by Independent Oil & Gas Companies
Table of Contents
1. Introduction
2. Summary of Findings
3. North American Independents
a. EOG
b. Encana
c. CNRL
d. Devon Energy
e. Continental Resources
4. Legacy Independents
a. Occidental Petroleum
b. BG Group
c. ConocoPhillips
d. Marathon Oil
e. Hess Corporation
5. Worldwide Independents
a. Anadarko
b. Apache
c. Noble Energy
d. Tullow
6. Conclusions
2

Value Creation by Independent Oil & Gas Companies
1. Introduction
a. Research Objectives This report documents the findings of a research project undertaken by students in the C.T. Bauer College of Business MBA program at the University of Houston.
The purpose of the project was to understand how Independent upstream oil and gas companies have created value for the shareholders and other stakeholders in the past, and the strategic lessons that can be learned from their successes and failures.
The intent has been to create a vehicle that will integrate the capabilities within the C.T. Bauer School of top tier academic research with experience-based knowledge of the challenges facing energy companies. Through this integration and our long time frame looking back and forward ten years, we hope to provide a set of analyses and commentaries that will complement existing reports available from financial institutions and will be useful both to financial institutions and to the companies studied.
This report is the final chapter of an upstream trilogy covering the Super-majors, National Oil Companies and Independents, to be followed by Refiners, Midstream and Oilfield Services, in each case updating prior analyses while detailing the new sector. We hope that these reports will deepen the relationship between the University of Houston and energy companies in Houston and beyond, creating opportunities for mutually beneficial dialogue.
b. The Independents Commercial energy provides the foundation for modern society. The machines that enabled the UK to spark the industrial revolution such as Newcomen’s steam engine (1712), James Watt’s improved versions (1753-75), the resulting railway boom starting with the Stockton to Darlington route in 1825 all depended on availability of commercial coal. The steel industry came to depend on coke from coal in place of charcoal as a fuel and reducing agent from 1709 when Abraham Darby took advantage of adjacently situated coal and iron ore resources on Coalbrookdale, Shropshire. Steel demand expanded rapidly following development of the hot blast process in the early 19th century. In the U.S., coal use exceeded wood in 1885 and its predominance was reinforced by Edison’s development of the first commercial electric power generator in 1882.
In 1869, Colonel Drake discovered oil in Pennsylvania, and oil demand grew mainly in heating and lighting sectors as a replacement for increasingly scarce whale oil. Soon, the “waste products” after kerosene had been extracted started finding uses as an alternative to coal in ship’s bunkers. Then the horseless carriage was invented in the 1890s and ushered in two decades of intense competition between steam driven, electric and internal combustion power trains, all trying to displace horse-drawn carriages. The latter power train proved to be the most practical solution, oil was confirmed as the economic winner and oil demand growth accelerated. Apart from the merits of the power train, oil’s natural attributes as a fluid that is widely available, affordable, easy to transport and store and relatively clean burning were essential parts of the automobile’s value proposition. These
3

Value Creation by Independent Oil & Gas Companies
attributes are still hard to match and explain the difficulty in replacing oil with other energy sources. Oil became an internationally traded commodity, with Standard Oil in the U.S. and Royal Dutch Shell as the largest international actors.
Winston Churchill, First Lord of the Admiralty, recognized the strategic importance of oil to the Royal Navy in 1913 after discussions with Marcus Samuel of London-based Shell Transport and Trading. But Shell had merged with Royal Dutch in 1907 and Churchill believed that the combination of Standard Oil and the new Royal Dutch Shell presented monopolistic characteristics. He was unable to negotiate an acceptable deal for supplies of bunker fuel oil with Shell and instead negotiated a deal with Anglo-Persian (later to become BP) and successfully proposed to the House of Commons in 1914 that the UK government should take a 51% ownership in Anglo-Persian.
Churchill commented “We knew that by our contract we should confer upon the Anglo-Persian an enormous advantage which, added to their concession, would enormously strengthen the Company and increase the value of their property. If this consequence arose from the action of the State, why should not the State share in the advantage which we created?”1
Thus came into being the first National Oil Company (NOC), born from government’s recognition of the strategic importance of oil to the national interest. Others would follow in consumer countries with concerns over the security and price of supplies, and in producer countries with concerns over their share of the revenues from oil extraction and control of the pace of development. The British government sold its BP shares over the period 1979-87 and the French government liquidated its holdings in Total in 1996; the Italian government retains a 30% interest in ENI. More recently, a number of emerging economies have partially privatized their national oil companies and have been quite successful in creating value for their outside shareholders as well as acquiring access to resources as described in the second report of this trilogy.
Meanwhile, mainly in the U.S., smaller independent oil and gas companies carved out niches where they could be competitive with the U.S majors and European government sponsored NOCs. These independents included integrated mini-majors such as Amoco, Arco and Unocal, which have been absorbed into BP and Chevron; Conoco and Phillips, which have combined and split upstream from downstream to reemerge as the largest pure play upstream independent; Marathon, which has also split upstream from downstream, and Hess, which is following the same pathway. BG Group was formed from the upstream assets after privatization of British Gas and has prospered as an integrated international natural gas company, though has been disinvesting from its natural gas distribution businesses. Occidental Petroleum, founded by Dr. Armand Hammer has survived since the 1960s with less convulsive ownership change or structural challenge than the other legacy independents, but still has repositioned its business model from international exploration towards a portfolio including substantial U.S. assets. This leaves five legacy, formerly integrated companies (OXY, BG, COP, MRO, HES) of which only Oxy retains a measure of integration through its chemicals business.
1 Terra Incognita: A Navigation Aid for Energy Leaders By Christopher Ross and Lane Sloan
4

Value Creation by Independent Oil & Gas Companies
To the five legacy integrated independents, we added nine newer companies, five with operations largely in North America (EOG, Encana, Canadian Natural Resources (CNRL), Devon Energy and Continental Resources, and four with important international assets (Anadarko, Apache, Noble Energy and Tullow). Enterprise value of the companies studied ranged from $100 billion to just under $20 Billion at the end of August, 2013 (Figure 2.1).
Thus, we investigated Independents in three groups:
• North American Independents: EOG, Encana, CNRL, Devon Energy and Continental Resources are all leaders in developing oil and gas shales in North America. Encana and Devon built significant international businesses, but chose to divest these to focus on North American unconventional plays. EOG and CNRL have modest international assets: EOG in Trinidad and Argentina, and CNRL in Africa and the North Sea, which benefit from its expertise in enhanced oil recovery. Continental Resources is a leader in tight oil development from the Bakken play and smaller positions in other resource plays.
• Legacy Independents: BG, ConocoPhillips, Marathon and Hess have undergone convulsive change over the past decade, while Oxy has transformed its portfolio in a more continuous manner.
• Worldwide Independents: Anadarko, Apache, Noble Energy and Tullow have each opened new international basins: Anadarko offshore Ghana and Mozambique; Apache in the Egyptian Western Desert; Noble Energy in the Levant Basin offshore Israel and Cyprus; and Tullow in Uganda and Ghana.
As in our previous studies, we start with the premise that shareholder value tracks the expected intrinsic value of the firm. Intrinsic value in turn is shaped by expectations of growth, returns on capital and risk. These are the result of strategic portfolio choices, execution capabilities and the leadership and organizational philosophy that define the firm’s human system.
0
20,000
40,000
60,000
80,000
100,000
120,000
$ M
illio
n
Figure 1.1: Enterprise Value, end Aug 2013
Worldwide
North America
Legacy Integrated
5

Value Creation by Independent Oil & Gas Companies
2. Summary of Findings The first report in this upstream trilogy showed that ConocoPhillips and Chevron were most aggressive among the IOCs in reinvesting in growth (measured as capital expenditures divided by end year total assets) and delivered highest value growth for their shareholders. Other IOCs were more cautious and delivered lower Total Shareholder Returns (TSR). To some extent, the caution of the IOCs opened the door for the NOCs to expand internationally. The majors also missed the boat on the North American shale revolution, entering late in the game by acquisitions or joint ventures at high entry prices.
The second report concluded that NOCs with some private ownership performed well for their private owners over the period of 2001-11: better, in fact, than did the Super-majors. The primary reason appears to have been their willingness to invest more aggressively in organic growth relative to their size than did the Super-majors. They were active in acquisition, and then spent heavily in developing the full potential of the acquired company’s portfolio of opportunities. Analysis of independents confirmed this finding: most of the independents with high reinvestment in organic growth achieved high total shareholder returns (TSR). However, some companies did not: this finding was intriguing and implied that the market differentiated between “good” growth and “bad” growth investments.
During a decade during which crude oil prices were rising steadily, growth was a winning strategy. There is a saying that “generals are always preparing to fight the last war” and it seems to have been the case that the IOCs2 through the first decade of the 21st century largely continued the strategies of the 1990s of consolidation, cost reduction and extreme capital discipline.
2 In this report, the terms Super-major and IOC (International Oil Company) will be used interchangeably
6

Value Creation by Independent Oil & Gas Companies
IOC capital discipline was important to the IOC “generals” who remembered the “war” of the 1990s but perhaps forgot that oil markets are cyclical (Figure 2.1). As one executive interviewed in 2006 said “in 1990, there was a dependence on the price of oil staying high, and that’s very dangerous.3” Capital discipline was reinforced by requiring that new projects be evaluated using low benchmark oil and gas prices. There was also recognition that the IOCs were limited in technical capacity following the staff cuts of the 1990s and that high capital expenditures could over-extend available talent, internally and of contractors.
The internationalizing NOCs marched to a different drummer. Statoil CEO Helge Lund in 2006 said “a key part of our value proposition is growth” and “I firmly believe we have an obligation, not only to our shareholders but also to our employees, to capitalize on the vast experience and technology development that we have developed4.” Other NOCs were driven as well by their governments’ directives to gain firm access to major oil and gas resources as a financial and security hedge to growing oil imports.
Whereas IOCs under normal circumstances can fund their capital investment and dividend programs from cash flow and NOCs often can access funding when required from their government owners, Independents must attract capital through a persuasive shareholder value proposition. The goal is to describe the company’s aspirations for growth, profitability and risk exposure and to include reasonable specificity on the portfolio structure, capabilities and organizational philosophy that will
3 Terra Incognita, p376 4 Terra Incognita, p211 and p 306
$0
$20
$40
$60
$80
$100
$120
1950 1955 1960 1965 1970 1975 1980 1985 1990 1995 2000 2005 2010
Inte
rnat
iona
l Oil
Pric
e ($
/B)
Figure 2.1: Oil Prices Drive Strategy
Current $/B 2011 $/B
Volume Growth New Basins Returns New Basins
7

Value Creation by Independent Oil & Gas Companies
enable delivery of the value proposition. Most independents are more strongly oriented towards growth and are more risky investments than the IOCs. The technical risks over the past decade have been compounded by exceptional variations in absolute and relative prices of different commodities (Figure 2.2), particularly in the U.S. It mattered whether a company accumulated reserves of light crude oil, bitumen from oil sands5, natural gas or natural gas liquids (e.g. propane).
In 1970, the seven sisters accounted for 50% of global production. Nationalization by OPC countries reduced this dramatically. Over the period 2002-2012, The Super-majors continued to lose market share of both crude oil and natural gas production (Figure 2.2) falling from 13.8% to 10.3%.
5 Lloydminster Blend prices are the cost of U.S. imports; others are U.S. spot prices from EIA and Bloomberg
$-
$5.00
$10.00
$15.00
$20.00
$25.00
Jan-
00Ju
l-00
Jan-
01Ju
l-01
Jan-
02Ju
l-02
Jan-
03Ju
l-03
Jan-
04Ju
l-04
Jan-
05Ju
l-05
Jan-
06Ju
l-06
Jan-
07Ju
l-07
Jan-
08Ju
l-08
Jan-
09Ju
l-09
Jan-
10Ju
l-10
Jan-
11Ju
l-11
Jan-
12Ju
l-12
Jan-
13
$/M
MBt
u
Figure 2.2: Spot U.S. Oil & Gas Prices
Lloydminster WTI Natural Gas Propane
0.0%
5.0%
10.0%
15.0%
20.0%
25.0%
30.0%
35.0%Figure 2.3: Share of Global Oil Production
Majors NOCs Independents
8

Value Creation by Independent Oil & Gas Companies
NOCs with some public ownership gained share from 11.0% to 12.3 % and the 14 independents we studied gained share from 3.5% to 4.1%. Both NOCs and independents invested more aggressively in growth than did the majors. Similar results are found in natural gas where the majors lost share (from 15.3% in 2002 to 12.4% in 2012) despite huge LNG projects in Qatar, while NOCs (3.5% to 6.3%) and independents (6.6% to 7.5%) increased their share of global production.
Overall the independents reviewed in this report have performed well for their shareholders over the past decade, some of them spectacularly well. $100 invested in Tullow Oil at the end of 2001 would have been worth (with dividends reinvested) $2,500 in mid 2012, though the value has declined to $1,600 in mid 2013. Tullow has been very successful in finding and developing new basins in Africa. By contrast, Devon and Encana decided to focus on North American natural gas and sold their international and deep water Gulf of Mexico assets; then Encana spun off its oil sands business as Cenovus. Both Encana and Devon peaked in value in 2008 with the investor’s $100 then worth about $600, but the investor’s value has since fallen below $300 as natural gas prices declined The return to shareholders over the full period has been similar to that of ExxonMobil, but the regrets for those investors that have seen the value of their investment cut in half since its 2008 peak must have been painful; XOM investors did not have to experience such a roller coaster ride.
Independents are inherently more risky than IOCs, with less diversification of risk across commodities and geographies, but with higher upside potential to those that make the right portfolio choices and execute well.
The performance of the Independents was analyzed within the context of the two previous studies on IOCs and NOCs. As for the NOC report, we reviewed performance in three time periods:
1. The period chosen for the IOC analysis of end 2001 through end 2011. 2. The period of financial crisis from July 2008 through April 2011 3. The period of recovery from April 2011 through March 2013
2.1 Period 1: 2001-2011 We tested our hypothesis that high shareholder returns accrued to companies that invested most aggressively and growth (measured by capital expenditure/ Total Assets) by adding the independents to our previous analysis of NOCs and IOCs to create a “full set” of oil & gas companies (Figure 2.4). This analysis uncovered that the majority of independents conformed to the hypothesis, but some did not. Five independents with relatively high reinvestment in growth measured by organic capital expenditures divided by Total Assets appeared to have been awarded less recognition in shareholder value for their efforts in reinvesting for growth than the other companies.
9

Value Creation by Independent Oil & Gas Companies
We investigated whether these “Underperformer” companies (Hess, Apache, Devon, Encana and EOG) were considered more risky than their rivals with higher betas6 but found that they fell within the overall pattern of higher beta companies being associated with higher TSR (Figure 2.5). Our conclusion was that the strategies of these companies were less persuasive than those of their rivals. We believe each had weaknesses in their asset portfolios that were of concern to investors, while the other independents could all point to portfolios including capital investment opportunities with credible profitable growth potential.
6 Betas for the North American companies were calculated relative to the S&P 500 index, while European companies were calculated relative to the FTSE 100 index.
CNPC
ONGC
PETROBRAS
SINOPEC
STATOIL
Chevron ConocoPhillips ExxonMobil
Shell Total BP
OXY
BG
TLW
HESS
MRO
APC
Noble
CNOOC
ECA DVN
EOG
"Perfom" R² = 0.605
Underperform R² = 0.622
0.0%
5.0%
10.0%
15.0%
20.0%
25.0%
30.0%
35.0%
40.0%
6.0% 8.0% 10.0% 12.0% 14.0% 16.0% 18.0% 20.0% 22.0% 24.0% 26.0%
TSR
(CAG
R)
GROWTH (Capex/ Total Assets) 2001-11
Figure 2.4: Full Set TSR & Growth 2001-11
CNRL
XOM
COP
CVX
BG
ECA
CNRL
EOG
APC
MRO
NBL
DVN APA HES
OXY
R² = 0.138
200%
300%
400%
500%
600%
700%
800%
900%
1000%
1100%
1200%
0.600 0.700 0.800 0.900 1.000 1.100 1.200 1.300
TSR
Beta
Figure 2.5: TSR & Beta: 0102-0713
APA
10

Value Creation by Independent Oil & Gas Companies
We continued the “full set” analysis to the relationship between TSR and Returns (measured by EBITDA/ Total Assets) and found that within the Underperformer group, returns were important: companies in this group with higher returns achieved higher TSR than those with lower returns (Figure 2.6). A similar relationship appears to hold for the IOCs7, as was noted in the first report of this trilogy, especially if Statoil is added to this group. Among the remainder of the “Perform” group, the relationship between TSR and return seems less strong (lower R2) than for the two groups of companies with lower TSR.
We conclude, therefore, that during the period 2001-11, most oil and gas companies achieved high Total Shareholder Returns by reinvesting strongly in capital projects. However, the market distinguished “good growth” from “not so good growth” and companies that invested in a portfolio that was rich in natural gas or was perceived to lack strategic coherence achieved lower TSR; for this group return on assets was important as an indicator of the quality of its growth investments:
• Since spinning off its oil sands business as Cenovus in 2009, Encana has been heavily weighted toward North American natural gas at a time when natural gas prices declined precipitously.
• Devon spun off its international and deep water businesses to become focused on Canadian oil sands and North American natural gas. Unfortunately both of these commodities are trading at discounted prices due to oversupply of natural gas and logistical bottlenecks for heavy oil.
• EOG was investing fiercely to shift its portfolio from natural gas to oil but the results were not fully visible at the end of 2011.
7 The first report concluded that return of total assets was correlated with TSR but was a less strong indicator of TSR than reinvestment in growth
CNPC
ONGC
PETROBRAS
SINOPEC
OXY
BG MRO
CNRL CNOOC
NBL
COP
TLW
Hess ECA
DVN
EOG APA
Chevron XOM
Shell Total
BP
Statoil
"Perform" R² = 0.029
"Underperform" R² = 0.716
IOCs R² = 0.762
0.0%
5.0%
10.0%
15.0%
20.0%
25.0%
30.0%
35.0%
40.0%
10.0% 15.0% 20.0% 25.0% 30.0% 35.0% 40.0%
TSR
CAG
R
RETURNS (EBITDA/ Total Assets)
Figure 2.6: Full Set TSR & Returns: 2001-11
APC
11

Value Creation by Independent Oil & Gas Companies
• Hess was undergoing a strategic shift from being international exploration led to a focus on growth in North American tight oil and gas and investors were unsure of the outcome of this shift.
• Investors were uncertain on whether Apache’s 2010 acquisitions of Mariner Energy ($4 Billion) and BP’s assets in the U.S. Permian Basin, Canada and Egypt ($7 Billion) would be accretive to value. This portfolio structure concern was amplified in 2011 as Egypt descended into political turmoil
2.2 The Financial Crisis: July 2008 through April 2011 We investigated how the full set of companies performed in the most recent period of financial crisis. During the financial crisis, most NOC and independents’ shareholder returns were generally more volatile than IOCs with a greater loss of value when oil prices collapsed from mid 2008 through mid 2009, and a stronger rebound as oil prices recovered (Figure 2.7). Their aggressive capital spending created financial stress as free cash flow was hit by lower oil and particularly natural gas prices. Note that the five “Underperform” companies identified above suffered a deep decline from July 2008 through January 2009, with a relatively weak recovery from January 2009 through April 2011. They were joined in this quadrant by ConocoPhillips and Sinopec. ConocoPhillips experienced a surge in capital spending in 2008 and the financial stress led to a sharp change in strategy including assets sales and the decision to split upstream from downstream. Sinopec is heavily weighted towards refining and required government support as price controls in China disallowed recovery of higher crude oil prices from 2009-11.
The IOCs were joined by Occidental and BG Group in the least volatile quadrant, while Ecopetrol, ONGC and Petrochina (CNPC) were less affected by the economic collapse and rebounded strongly as the global economy gradually climbed out of the crisis.
CVX
XOM TOT RDS
BP
ONGC CNPC Sinopec
STO PBR
Ecopet
OXY COP BG
MRO
Hess
Encana
CNRL
CLR
DVN
EOG
CNOOC
Noble
APC
APA
TLW
0.0%
10.0%
20.0%
30.0%
40.0%
50.0%
60.0%
70.0%
80.0%
-100.0% -90.0% -80.0% -70.0% -60.0% -50.0% -40.0% -30.0% -20.0% -10.0% 0.0%
Rest
orat
ion:
01/
09-0
4/11
Collapse: 07/08-01/09
Figure 2.7: TSR During the Financial Crisis
12

Value Creation by Independent Oil & Gas Companies The lesson from the financial crisis is that the oil and gas industry is highly cyclical. High and rising oil and gas prices carry the seeds of their own destruction as they contribute to cost inflation across the global economy, alter trade balances and increase the need for financing in importing countries, reduce consumption of other goods and services and expose fragilities in financially leveraged sectors of the global economy. The other lesson is that most oil and gas companies came through the storm intact, and only a few were forced to make significant strategic adjustments.
2.3 Period of Slow Economic Recovery Moving forward into the period of slow economic recovery from April 2011 through March 2013, investors have been differentiating the majority of oil and gas companies that achieve higher TSR by investing strongly in organic growth, from a minority that have been viewed less positively (Figure 2.8). The implication for this underperforming group is that investors consider that higher investment in growth projects will not necessarily increase the intrinsic value of the company.
The underperforming group no longer includes EOG, whose aggressive pivot from a portfolio concentrated in natural gas assets to one that is focused on oil is now recognized by investors as a stunning success. However, the underperforming group now includes three new independent additions8 (Occidental, BG, Canadian Natural Resources) joining the four companies that were underperforming from 2001-11. Possible reasons for their fall from grace could include:
• Oxy’s investors may also have been disturbed by the (failed) attempt by former CEO Ray Irani to take back the CEO position from current incumbent Steve Chazen.
• BG has been criticized for weak capital discipline and an overall portfolio that lacks coherence.
8 CNOOC and Petrobras were discussed in the second report on NOCs.
BP Shell
XOM CVX
APC
Total
COP MRO NBL
EOG
STO ONGC
Sinopec
CNPC
TLW
CRL
Ecopetrol
BG
APA
DVN
HES Encana
OXY CNOOC
Petrobras
CNRL
Perform R² = 0.336
Underperform R² = 0.024
-40.0%
-30.0%
-20.0%
-10.0%
0.0%
10.0%
20.0%
30.0%
0.0%
5.0%
10.0%
15.0%
20.0%
25.0%
30.0%
0411
-031
3 TS
R CA
GR
2011-12 Reinvestment in Growth (Capex/ Total Assets)
Figure 2.8: TSR & Growth: 04/11-03/13
13

Value Creation by Independent Oil & Gas Companies
• CNRL portfolio is weighted towards North American natural gas and Canadian heavy crude oil. Both of these commodities are selling at low prices.
As for the period 2001-11, the level of EBITDA returns on total assets (ROA) is not significantly correlated to shareholder returns for the performing group of companies, while ROA does seem more important for the underperforming group. The implication is that the performing group is trusted by investors to reinvest in growth so long as financial returns exceed the cost of capital, while the underperforming group is required to produce high returns on capital but not trusted to invest in growth (Figure 2.9).
The underperforming independents are also differentiated by their relationship between TSR and beta9 (Figure 2.10). The two groups of independents have similar slopes of TSR to beta, with a 0.1 increase in beta corresponding to approximately 8-10% increase in TSR, but the performers achieved a risk-adjusted TSR nearly 60 percentage points higher than the underperformers for the period 04/11 – 07/13.
9 TLW shows much lower beta (measured against the FTSE index) than other independents (except for BG, measured against the S&P 500 index) and has been omitted from Figure 2.8.
BP Shell
XOM CVX
APC Total
COP MRO
NBL
EOG
STO CNPC
Sinopec
ONGC
TLW
CLR
Ecopetrol
BG
APA
DVN
HES
ECA
OXY
CNOOC
PBR
CNRL
Perform R² = 0.024
R² = 0.230 Underperform
-40.0%
-30.0%
-20.0%
-10.0%
0.0%
10.0%
20.0%
30.0%
10.0% 15.0% 20.0% 25.0% 30.0% 35.0%
0411
-031
3 TS
R CA
GR
2011-12 EBITDA Return on Total Assets
Figure 2.9: TSR and Returns 04/11 - 03/13
14

Value Creation by Independent Oil & Gas Companies
2.4 Conclusions The oil and gas industry is subject to price swings (Figure 2.1) as global supply and demand move from periods of perceived shortage to abundance. When prices are rising, companies receive the economic signal to invest in growth, but history advises companies to be financially conservative on order to sustain their strategies through subsequent periods of low prices and revenues. The relative prices of oil and gas have also changed dramatically over the past decade (Figure 2.2), with particular impact on the value of light crude oil in North America relative to international prices, on the relative value of oil compared to natural gas and the relative value of oil sands bitumen compared to light crude oils.
Navigating these stormy price relationships has been challenging. Companies that recognized the shifting trade winds in the 2000s created substantial shareholder value by investing strongly in growth. However, those companies whose portfolios were highly weighted to low value resources (e.g., natural gas and oil sands) generally struggled to create shareholder value. Those with portfolios weighted to light crude oil and international LNG with prices linked to oil, generally did well.
What separated the performers from the underperformers? There are some interesting lessons to learn from the individual company analyses that follow this section.
a. Shareholder Value Proposition
It is risky to alter a company’s shareholder value proposition abruptly. Investors with expectations based on the prior proposition will leave and investors that like the new proposition will take time before switching. Weak shareholder returns will inevitably attract activist investors with plans to increase short term stock prices and turn a profit on their original investment; companies must then move fast to preempt the activists.
• The CNRL stock price at the end of 2011 incorporated certain expectations of future profitable growth. By reducing capital spending as a percent of total assets, CNRL signaled that
XOM
COP CVX EOG
APC MRO
CLR NBL
BG
ECA
CNRL
DVN
HES
APA
OXY
y = 0.0837x + 1.0843 R² = 0.2902
y = 0.102x + 0.5113 R² = 0.0973
40%
60%
80%
100%
120%
140%
0.600 0.800 1.000 1.200 1.400 1.600 1.800 2.000 2.200
TSR
Beta
Figure 2.10: TSR & Beta: 0411-0713
Perform
Underperform
Linear (Perform)
Linear(Underperform)
15

Value Creation by Independent Oil & Gas Companies
expectations of future growth should be revised downwards and consequently, the intrinsic value of the firm was lower than investors had been assuming. This perception was confirmed when CNRL failed to meet analysts’ expectations for financial results in the third quarter of 2012.
• Radical surgery on the portfolio changed the nature of Devon Energy. Investors that appreciated the broad portfolio of unconventional oil and gas with some exploration upside from deep water Gulf of Mexico and Brazil, likely moved their investments to companies with broader portfolios like Noble Energy and Anadarko. Devon was left to compete with EOG, CRL and CNRL as well as smaller companies such as Oasis, Range Resources and Cabot Oil and Gas for investors desiring pure play North American unconventional resources.
• It is important when adding new portfolio pieces to explain how they will strengthen the coherence of the overall portfolio. The Hess value proposition had been focused on successful international exploration, mainly offshore, and its abrupt shift to U.S. onshore shale plays did not seem to play to the company’s strengths.
• b. Leadership and Organization
Organizational leadership requires alignment of the overall strategic direction; the values and culture that leaders expect; the decision rules that define who makes decisions and how they are made; performance management; and talent development. These aspects are not necessarily visible from outside the organization but collectively determine the effectiveness and durability of the firm.
• A strong Board with oil and Gas experience can challenge management to revisit its assumptions and strategies; a weak Board at Hess provided lesser governance and was used by activist investors as a wedge to force unwanted change.
• There is tremendous value to be created through early entry into a new large play. CLR understood the potential of the Bakken/ Three Forks play before most rivals, deployed new technologies to realize that potential, and doubled down on the play, moving from 300,000 to 1.1 million net acres.
• In the international arena, Tullow (Ghana, Uganda, Kenya), Anadarko (Ghana and Mozambique) and Noble (Levant Basin) have each created substantial shareholder value through successful exploration following early entry. Tullow and Anadarko provided early guidance on the value of their holdings by selling down their interests in Uganda and Mozambique.
• Through the strength of its “no excuses” culture, EOG recognized the changing business environment for natural gas before its rivals and moved rapidly to capture opportunities in the Bakken and Eagle Ford liquids rich shale plays. By contrast, Devon and Encana leadership may have been preoccupied with radical portfolio surgery and were slower in shifting from natural gas towards liquids rich shale resources.
• Organization structures, processes and metrics need to be regularly reviewed to assure that they are encouraging capital and operational discipline. BG, Apache and Hess created portfolios that lacked coherence and were slow to rationalize. Hess underperformance
16

Value Creation by Independent Oil & Gas Companies
attracted Elliott Management to purchase 4% of the company’s stock and demand major changes in governance and strategy.
• Environmental liabilities are damaging financially and weaken reputation. They become a distraction to management and can become a hurdle to strategy development and execution. Anadarko shareholder value growth has been slowed by the Tronox environmental suit and the Macondo blow-out.
• Board disagreements should not be made public. The perception of disarray at the top of Oxy increased the risk in the eyes of investors and destroyed value.
• c. Strategic Choices
Within their chosen leadership and organizational framework, leaders’ most important decisions are where and how to compete. They decide where to compete through their capital allocation and portfolio management processes and determine how to compete based on their core capabilities. Institutional investors argue in favor of “pure plays” on grounds that they prefer to construct their own portfolios of assets from a set of “pure play” companies, and prefer that companies focus on becoming the low cost producer within their segment. However, a narrowly defined portfolio can increase risk and lower intrinsic value relative to a rival with a broader, coherent portfolio.
Portfolio focus and coherence is important, but robustness to adverse business conditions is critical to survival of the firm. Senior corporate leaders need to be able to “see around corners” and recognize that a favorable business context can deteriorate (or strengthen) rapidly. Strategies need to capture the commanding heights of a new play, but be robust to different future scenarios: when a new scenario materializes, companies should move rapidly to rebalance their portfolios with valuable assets and continuous proactive portfolio management.
Valuable Assets
• CLR doubled down on the Bakken, increasing its lease holdings from 300,000 to 1.1 million acres, and invested strongly in its drilling program to demonstrate the growth potential. This provides the company with both a platform for future growth and the opportunity to capture economies of scale.
• Similarly, by doubling down through acquisitions of smaller players in Uganda, Tullow built a position of scale in Uganda basins and then was able to attract larger more experienced and financially strong companies (Total and CNOOC) to support its development plans.
• By contrast, EnCana was an industry leader before it sold off its international and deep water assets from 2004-06 and found itself with a portfolio that was not robust to low natural gas prices ; the company was late in shifting its portfolio to liquids rich shale resources. Following a similar pathway, Devon’s portfolio became excessively weighted to natural gas and oil sands, both of which have been experiencing low prices.
• CNRL may well have been acting prudently to slow down investment in organic growth in light of low prices for natural gas and Canadian heavy crude oil and may have determined
17

Value Creation by Independent Oil & Gas Companies
that there were few projects that could meet the company’s threshold for return on investment. The challenge now facing the company is to restore confidence that its large inventory of undeveloped leases will support capital investments that return more than its cost of capital, which may be quite high based on the relatively high beta.
Proactive Portfolio Management
• ConocoPhillips has a large, balanced, diversified portfolio which is being actively rationalized following its split from the downstream business and contributes to lower risk than COP’s independent rivals. On a smaller scale, Noble Energy engages in proactive portfolio management to create a few material positions with visible potential for profitable growth that map well to the company’s capabilities. Both companies show consistency of performance leading to a lower beta, a lower cost of capital and a higher intrinsic value for expected future cash flows, and to higher enterprise value than more risky rivals.
• Marathon (2011) and ConocoPhillips (2012) provide empirical evidence that splitting upstream from downstream sectors can create value for shareholders. Hess was slower in acting on this insight.
• Acquisitions can propel a company into a different league, especially when followed by disciplined portfolio rationalization as demonstrated by Anadarko after its acquisitions of Western Gas and Kerr McGee in 2006. Apache was slow to start but is now moving rapidly to rationalize its portfolio following acquisitions of Mariner and assets from BP.
• BG and Hess were criticized for incoherent portfolios with few common themes and this contributed to weak shareholder returns since 2009. Both companies (Hess following a hostile intervention by Elliott Management) are promising significant portfolio rationalization.
d. Aligned Capabilities
Critical capabilities for the Independents include the technical and team competencies that enable successful exploration, development and operation of new fields and value adding commercialization of the hydrocarbons they produce. Before they can deploy their craft skills, however, companies must build productive relations with landowners and governments to gain access to potential resources; then they need a capital allocation process that results in investment decisions that create profitable growth and a portfolio management process that continuously optimizes value by divesting assets that may be worth more to others. They also need to develop productive relations with other oil companies that allow them to acquire new assets that enhance portfolio value and partner constructively to manage major projects.
• EOG has been extraordinarily successful in effectively redeploying its resource play capabilities developed for shale gas to the oil rich plays; its landmen were able to accomplish this without tipping their hand at moderate cost.
18
Value Creation by Independent Oil & Gas Companies
• Oxy’s strong positions in the Middle East and North Africa and its long-standing positive relations with host governments have provided opportunities for profitable growth. Though individually carrying more political risk than the U.S., production sharing agreements provide a buffer to any decrease in oil prices, since their structure allocates most of the price risk to the host government.
• Apache’s performance management system provided incentives at all levels to extract unrecognized value from acquired properties.
• Apache’s capability set of beneficial relations with Majors and other potential asset sellers, coupled with its ability to extract value unrecognized by the seller form a basis for continued profitable growth from acquisitions. Its realism in understanding the capabilities that it does not have (e.g., LNG development) will protect Apache from major mistakes and lower its risk over time, though its beta over the past couple years has been high relative to rivals. APA
• By all accounts, Tullow has been an exemplary partner in Ghana, with a strong record of social investment, good relations with the government, and working collaboratively with its partners, GNPC, Kosmos and Anadarko to bring the Jubilee field on stream in record time.
19

Value Creation by Independent Oil & Gas Companies
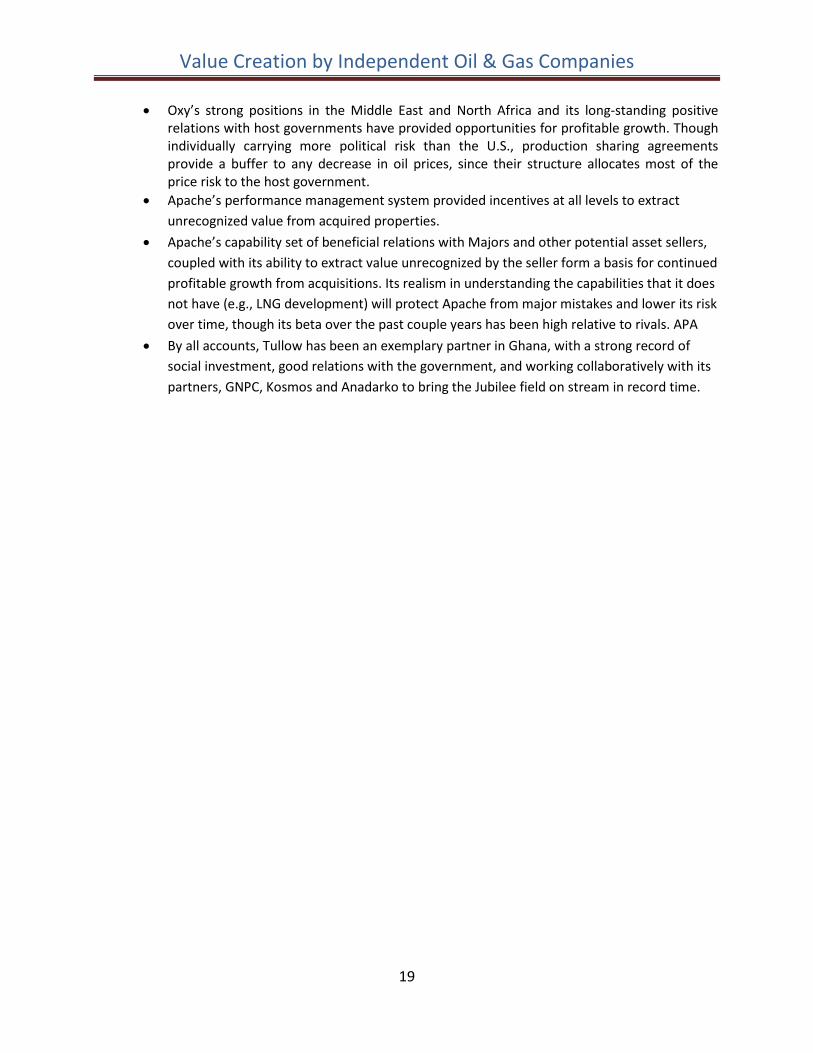
3. North American Independents Our study analyzed four oil and gas companies (Canadian Natural Resources, Continental Resources10, EOG Resources, Devon Energy and Encana) whose activities are heavily weighted to North America. CNRL achieved the highest Total Shareholder Returns of this group with its focused strategy of exploiting mature (mainly heavy) oil fields and conventional and unconventional gas fields mostly located in Canada. However, CNRL TSR performance has deteriorated since 2011. EOG has since 2011 separated in TSR from Encana and Devon through a stunning transformation from natural gas towards liquids development (Figure 3.1).
.
In 2007, Continental Resources (CLR) became a public company and has become the leader in TSR within this group by virtue of its strong position in the Bakken shale (Figure 3.2). As noted in our prior report on NOCs, new oil and gas IPOs appear to be undervalued at the initial offering and appreciate rapidly as management demonstrates its ability to create value.
10 went public in 2007
0%
200%
400%
600%
800%
1000%
1200%
1400%
1600%
1800%
2000%
TSR
Figure 3.1: North American Focused Independents (ex CRL)
EOG Encana CNRL Devon S&P 500 Index
20

Value Creation by Independent Oil & Gas Companies
a. EOG EOG Resources was spun off from Enron in 1999, two years before the collapse of its former parent company. As an independent company, EOG moved quickly to monetize its Trinidad natural gas production through supply agreements with an ammonia plant in 2000 and methanol and LNG plants in 2005. In 2003, EOG acquired natural gas properties in Southeast Alberta and entered the Southern Gas Basin of the UK North Sea.
However, EOG’s primary focus was North America and the company was aggressively acquiring acreage in emerging shale plays. By 2004, EOG had 400,000 acres under lease in the Barnett shale and was building its Marcellus position. EOG’s Barnett shale production exceeded expectations in 2006 and the company began producing liquids from the Bakken play in North Dakota. By 2006, CEO Mark Papa recognized that the industry was becoming too successful in developing shale gas production and refocused the company on acquiring leases to build an industry leading position in liquids rich shales.
EOG production of crude oil and condensates increased 11% and production of natural gas liquids by 31% in 2007. Production of liquids increased strongly in 2008 and subsequent years, but the market did not appreciate the magnitude of EOG’s transition until 2012 (Figure 3.1) and EOG emerged as a leading producer of shale oils from the Bakken and Eagle Ford plays.
0%
100%
200%
300%
400%
500%
600%
700%
TSR
Figure 3.2: North American Focused Independents (inc
CRL)
Continental Resources Devon EOG Encana CNRL S&P 500 Index
21
Value Creation by Independent Oil & Gas Companies
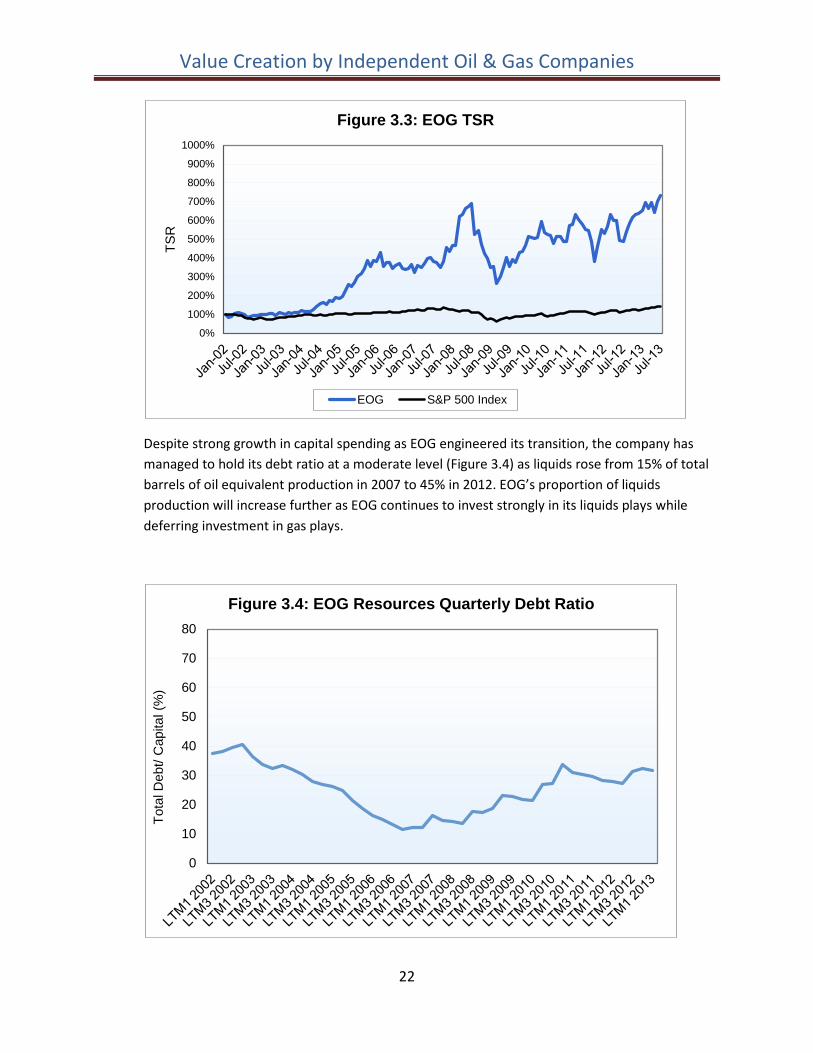
Despite strong growth in capital spending as EOG engineered its transition, the company has managed to hold its debt ratio at a moderate level (Figure 3.4) as liquids rose from 15% of total barrels of oil equivalent production in 2007 to 45% in 2012. EOG’s proportion of liquids production will increase further as EOG continues to invest strongly in its liquids plays while deferring investment in gas plays.
0%
100%
200%
300%
400%
500%
600%
700%
800%
900%
1000%
TSR
Figure 3.3: EOG TSR
EOG S&P 500 Index
0
10
20
30
40
50
60
70
80
Tota
l Deb
t/ C
apita
l (%
)
Figure 3.4: EOG Resources Quarterly Debt Ratio
22

Value Creation by Independent Oil & Gas Companies The strategic value creation lessons from EOG are:
• The strength of its “no excuses” culture in recognizing the changing business environment for natural gas before its rivals.
• Moving rapidly to transform its portfolio by acquiring large scale acreage positions at reasonable cost in the two most productive shale oil plays: Bakken and Eagle Ford; ; its landmen were able to accomplish this without tipping their hand at moderate cost
• Redeploying its resource play technological capabilities developed for shale gas effectively to the oil rich plays.
• Innovating along the value chain by integrating backwards to sand mines to provide a secure low cost source of proppants used in fracturing and integrating forward by building rail facilities to achieve better crude oil netback values than its rivals.
b. Encana Encana was formed through the 2002 merger of PanCanadian Energy and Alberta Energy, both based in Calgary, Alberta. The combined company moved to further strengthen its North American natural gas position through acquisition of 500,000 acres in the Cutbank Ridge resource play in 2003 and its acquisition of Tom Brown, Inc. in 2004, extending its acreage in the Piceance Basin of Northwestern Colorado.
Despite promising discoveries of oil in the North Sea, deep water Gulf of Mexico and offshore Brazil, the company decided to focus on development of North American unconventional oil and gas resources, based on its strong capabilities in unconventional natural gas resource development and the superior economic performance of its North American businesses. The company sold its North Sea assets to Nexen in 2004, its Gulf of Mexico deep water positions to Statoil in 2005 and South American assets to Andes Petroleum and Norsk Hydro in 2006 and then acquired a large position in the Haynesville natural gas shale play.
The refocused Encana emerged with a simplified portfolio of North American natural gas and Canadian oil sands. Then Encana formed a joint venture with ConocoPhillips to form an integrated oil sands value chain: Encana would contribute and operate its Foster Creek and Christina Lake oil sands projects, while ConocoPhillips would contribute, upgrade and operate its Wood River, IL and Borger, TX refineries.
In 2009, Encana may have taken a step too far and split its oil sands assets into a new company: Cenovus. From its inception through mid-2008, Encana provided superior returns to shareholders. After 2008, Encana underperformed its rivals, while Cenovus provided somewhat better returns to its shareholders (Figure 3.5).
23

Value Creation by Independent Oil & Gas Companies
Faced with declining natural gas prices throughout North America, Encana appeared preoccupied with its split of oil sands from natural gas assets and was slower than EOG and Chesapeake to shift is portfolio from unconventional natural gas to liquids rich shales. As it belatedly tried to catch up, it was forced to pay higher prices for leases and increase drilling to hold on to them. Its debt ratio increased to levels above its rivals (Figure 3.6).
The strategic value creation lessons from Encana are:
0%
100%
200%
300%
400%
500%
600%
700%
800%Figure 3.5: Encana and Cenovus TSR
Encana S&P 500 Index Cenovus
0
10
20
30
40
50
60
70
80
Tota
l Deb
t/ C
apita
l (%
)
Figure 3.6: Encana Debt Ratio
24

Value Creation by Independent Oil & Gas Companies
• Senior corporate leaders need to be able to “see around corners” and recognize that a favorable business context can deteriorate rapidly (and vice versa). Strategies need to be robust to different future scenarios. Encana found itself with a portfolio that was not robust to low natural gas prices and was late in shifting its portfolio to liquids rich resources.
• The acute strategic need for Encana to shift towards liquids rich resources required further capital investment that would have been less compelling had the oil sands assets been retained. To the extent that Encana made portfolio decisions to enter liquids rich plays at high prices, value may have been destroyed that might have been retained with oil sands as part of the corporate portfolio.
• Institutional investors argue in favor of “pure plays” on grounds that they prefer to construct their own portfolios of assets from a set of “pure play” companies, while the companies are highly focused on becoming the low cost producer within their segment. The spin-out of Cenovus was not necessarily an intrinsically bad decision, but it did have consequences. Portfolio focus and coherence is important, but robustness to adverse business conditions is also important, particularly in a cyclical commodity business.
c. CNRL Canadian Natural Resources Ltd. was incorporated in 1973 and by 1989 was focused on low cost development of long lived resources in the shallow gas basin of Alberta. In 1991 the company entered the Northeast British Columbia natural gas basin and in 1993 diversified into heavy crude oil properties in Southeast Alberta. The company moved into oil sands development by acquisitions in 1996. It has added further Canadian properties by acquisition and in the process acquired international offshore oil production.
CNRL highlights its large acreage position in Canada and its capabilities in enhanced recovery of hydrocarbons from mature fields and in developing unconventional oil and natural gas. It has been directing most of its capital investment towards its Pelican Lake medium gravity crude oil enhanced recovery program, its Cold Lake heavy oil cyclic steam recovery and its Horizon Athabasca oil sands mining and upgrading project. Expenditures on natural gas development have been reduced and its natural gas production is declining.
CNRL total shareholder return was exceptional through 2011 but has fallen off more recently (Figure 3.7).
25

Value Creation by Independent Oil & Gas Companies
As noted previously, CNRL stock had a relatively high beta (Figure 2.3) from 2001-11 and is situated among the underperformers from 04/11 through 07/13 (Figure 2.7). The reason for this shift from leader to underperformer is not related to a deterioration of its capital structure: CNRL’s debt ratio has been significantly reduced over recent years (Figure 3.8). Indeed the problem may be that CNRL has disappointed investors who had come to expect continuing investment in growth by CNRL by reducing its capital expenditures as a percent of total assets from 17.8% from 2001-11 to an average of 12.8% over 2011 and 2012.
The strategic lessons from CNRL are:
0%
200%
400%
600%
800%
1000%
1200%
1400%
1600%
1800%
2000%
TSR
CNRL TSR
CNRL S&P 500 Index
0
10
20
30
40
50
60
LTM
1 20
02LT
M3
2002
LTM
1 20
03LT
M3
2003
LTM
1 20
04LT
M3
2004
LTM
1 20
05LT
M3
2005
LTM
1 20
06LT
M3
2006
LTM
1 20
07LT
M3
2007
LTM
1 20
08LT
M3
2008
LTM
1 20
09LT
M3
2009
LTM
1 20
10LT
M3
2010
LTM
1 20
11LT
M3
2011
LTM
1 20
12LT
M3
2012
LTM
1 20
13
Tota
l Deb
t/ C
apita
l
Figure 3.8: CNRL Debt Ratio
26

Value Creation by Independent Oil & Gas Companies
• A change in shareholder value proposition from growth to returns and cash distributions is risky. The CNRL stock price at the end of 2011 incorporated certain expectations of future profitable growth. By reducing capital spending as a percent of total assets, CNRL signaled that expectations of future growth should be revised downwards and consequently, the intrinsic value of the firm was lower than investors had been assuming. This perception was confirmed when CNRL failed to meet analysts’ expectations for financial results in the third quarter of 2012.
• CNRL may well have been acting prudently to slow down investment in organic growth in light of low prices for natural gas and Canadian heavy crude oil and may have determined that there were few projects that could meet the company’s threshold for return on investment. The challenge now facing the company is to restore confidence that its large inventory of undeveloped leases will support capital investments that return more than its cost of capital, which may be quite high based on the relatively high beta.
• It is quite doubtful that CNRL’s international assets add much corporate value and they may be a distraction.
d. Devon Energy Devon Energy was founded in 1971 by John Nichols and his son Larry. Devon became a public company in 1988 and embarked on an aggressive strategy of acquisitions (Table 3.1).
Table 3.1: Devon Energy Acquisitions
Year Acquisition Focus Price ($M) 1992 Hondo Oil & Gas $122M 1996 Kerr McGee onshore properties US Onshore $250M 1998 Northstar Energy $750M 1999 Pennzenergy GoM $2,600M 2000 Merger with Santa Fe Snyder $3,500M 2001 Anderson Exploration Canada $4,600M 2002 Mitchell Energy Barnett Shale $3,500M 2003 Merger with Ocean Energy GoM $5,300M 2006 Chief Oil & Gas Barnett Shale $2,200M
By 2008, Devon was one of the largest independent oil and gas companies with assets in unconventional resource plays, deep water Gulf of Mexico, Brazil and other international basins. The strategy of sequential acquisitions during a period of rising oil prices had propelled the company to high shareholder returns (Figure 3.9).
27

Value Creation by Independent Oil & Gas Companies
In 2009, Devon announced its intention to sell its international and Gulf of Mexico assets to BP and Apache in order to focus on its North American onshore properties, with particular emphasis on shales and Canadian oil sands. The company closed its Houston office in 2012, retrenched to Oklahoma City and announced a $2.2 billion transaction to sell an interest in five of its shale plays to Sinopec. Despite (or because of) these moves, shareholder returns have been mediocre since 2008.
From its smaller base, Devon has continued to invest strongly in its U.S. shale plays (Permian, Mississippi Lime, Cana Woodford and Barnett) where the company is pivoting to liquids rich opportunities, as well as in its major Jackfish SAGD oil sands project. Capital expenditures as a percent of total assets increased from an average 17.0% during 2002-11 to 18.7% in 2011-12. Devon’s debt ratio has risen since 2010 (Figure 3.10).
0%
100%
200%
300%
400%
500%
600%
700%
800%
900%
1000%
TSR
Figure 3.9: Devon Energy TSR
Devon S&P 500 Index
28

Value Creation by Independent Oil & Gas Companies
The 2008-09 financial crisis and collapse in oil and natural gas prices was a shock to Devon. The capital required to realize the potential value of its large resources were greater than the company could comfortably afford. By divesting its Gulf of Mexico and international assets, the company lowered its capital requirements but was left with a portfolio heavily weighted to natural gas and oil sands. With the collapse of natural gas prices, the company embarked on a major drilling program to increase its proportion of liquids from its extensive shale properties. This again strained the company’s financial capacity.
Nevertheless, the strategy is showing some positive results. Reserves of liquids (crude oil plus natural gas liquids) rose to 47% of total boe of hydrocarbons in 2012 from 29% in 2008, and production rose to 28% in 2012 from 23% in 2008. However, this performance lags that of EOG.
The strategic lessons from Devon are:
• It is difficult to engineer a soft landing from a strategy of rapid growth by acquisition. Devon provided strong shareholder returns while growing by acquisition, but accumulated a set of organic of opportunities that exceeded its financial and possibly human capacity to implement. The company was obliged to shed assets.
• Like other companies in the North America segment, the company’s portfolio became excessively weighted to natural gas and oil sands, both of which have been experiencing low prices.
• Radical surgery on the portfolio changed the nature of the company. Investors that appreciated the broad portfolio of unconventional oil and gas with some exploration upside from deep water Gulf of Mexico and Brazil, likely moved their investments to companies with broader portfolios like Noble Energy and Anadarko. Devon was left to compete with EOG, and CNRL as well as smaller companies such as Oasis, Range
0
10
20
30
40
50
60
70
80To
tal D
ebt/
Cap
ital
Figure 3.10: Devon Energy Debt Ratio
29

Value Creation by Independent Oil & Gas Companies
Resources and Cabot Oil and Gas for investors desiring pure play North American unconventional resources.
e. Continental Resources Continental Resources (CLR) was founded as Shelly Dean Oil Co. by Harold Hamm in 1967. The company acquired Petro-Lewis in 1985 and changed its name to Continental Resources in 1990. The early focus was on Oklahoma and the Rocky Mountains; in 1995 CLR discovered the Cedar Hills field in North Dakota and in 2003 acquired 300,000 acres in the Bakken play and drilled the first Bakken horizontal well with hydraulic fracturing in 2005. The company went public on the NYSE in 2007.
Since becoming a public company, CLR has provided exceptional returns to shareholder (Figure 3.11), exceeding by far the TSR of its rivals in this segment.
The reason for this performance has been its strong position in and continuous reinvestment in growth (see Figure 2.6) mainly in the Bakken play. CLR leases 1.1 million net acres, the largest holding, in the Bakken and Three Forks plays. This provides a platform for continued crude oil production growth and concurrent growth in earnings per share. Proven reserves and production are both around 70% oil, higher than its rivals in this sector. CLR has a second growth area in the Anadarko Woodford play of Oklahoma, where it has accumulated over 300,000 net acres. Another reason for its strong performance could be attributed to an undervaluation of the company at the time of its IPO, when the company was not well known.
CLR has a higher debt ratio than its rivals (Figure 3.12) in support of its aggressive capital program, but was upgraded by Standard and Poor’s to investment grade BBB- in August 2013. The company has a
0%
100%
200%
300%
400%
500%
600%
700%
TSR
Figure 3.11: Continental Resources TSR
Continental Resources S&P 500 Index
30

Value Creation by Independent Oil & Gas Companies higher beta than other high performing independents (Figure 2.7) and a relatively high cost of capital but produces correspondingly high returns for its shareholders.
The strategic lessons from Continental resources are:
• There is tremendous value to be created through early entry into a new large play. CLR understood the potential of the Bakken/ Three Forks play before most rivals and deployed new technologies to realize that potential.
• CRL doubled down on the Bakken, increasing its lease holdings from 300,000 to 1.1 million acres, and invested strongly in its drilling program to demonstrate the growth potential. This provides the company with both a platform for future growth and the opportunity to capture economies of scale.
• CRL is simultaneously pursuing some diversification in its portfolio by retaining its legacy EOR program in the Red River formation (including its share of the Cedar Hills field) of North Dakota and expanding into the Niabrara formation in the DJ Basin of Northern Colorado and Southern Wyoming and the Anadarko Woodford play of Oklahoma.
0
10
20
30
40
50
60
70
80
Tota
l Deb
t/ C
apita
l
Figure 3.12: Continental Resources Total Debt/Capital
31

Value Creation by Independent Oil & Gas Companies
4. Legacy Integrated Independents Our study analyzed five companies that have had a legacy of integrated upstream and downstream businesses. Of these, Occidental retains chemicals and midstream businesses while BG, ConocoPhillips, Marathon Oil and Hess have largely exited their downstream businesses. The North American mid-size integrated oil sector is essentially extinct.
This sector includes the three largest independents by enterprise value (COP, BG, OXY) as well as Marathon Oil and Hess. The TSR performance of this sector has been better than the North American sector due mainly to a lower relative exposure to North American natural gas.
0%
100%
200%
300%
400%
500%
600%
700%
800%
900%
1000%Figure 4.1: Legacy Integrated TSR
Oxy BG Group ConocoPhillipsMarathon Oil Hess S&P 500 Index
32

Value Creation by Independent Oil & Gas Companies
a. Occidental Petroleum
Occidental Petroleum Corporation (NYSE:OXY) is an independent oil company founded in California in 1920. In 1957, Armand Hammer was appointed CEO and remained in that position until shortly before his death at age 92 in 1990. He appointed Ray Irani as his successor in 1990, who remained CEO until 2011. Steve Chazen became CEO in 2011. Oxy operates its business through three segments: ‘Oil and Gas Exploration and Production (E&P)’, ‘Midstream, Marketing and Other’, and ‘OxyChem’
• The Oil and Gas E&P segment engages exploration and production of oil and condensate, NGLs, and natural gas in three core regions: United States, Middle East/North Africa and Latin America.
• Its ‘Midstream, Marketing and Other’ segment provide services to other segments and third paties; it operates and invests in gas plants and oil, gas, NGLs and CO2 pipeline systems and storage facilities. In addition, the marketing and trading group markets OXY’s and third-party oil and gas, trades around the midstream assets and engages in commodities trading.
• OxyChem manufacturers polyvinyl chloride (PVC) resins, chlorine and caustic soda and owns and operates manufacturing plants at 22 domestic sites in Alabama, Georgia, Illinois, Kansas, Louisiana, Michigan, New Jersey, New York, Ohio, Pennsylvania and Texas and at two international sites in Canada and Chile and has interests in a Brazilian joint venture.
Oxy has delivered sector leading shareholder returns since 2002 (Figure 4.2).
In the first quarter of 2013, Oxy production of oil and gas was 72% liquids in the U.S. and on average from international operations; of Oxy’s total oil and gas production, 62% came from the U.S.
Oxy has created value by continuous acquisition of substantial acreage positions in the Permian Basin, mid-continent and California and applying enhanced oil recovery technologies at scale to increase total
0%
100%
200%
300%
400%
500%
600%
700%
800%
900%
1000%
TSR
Figure 4.2: Occidental Petroleum TSR
Oxy S&P 500 Index
33

Value Creation by Independent Oil & Gas Companies hydrocarbons recovery. These properties also contain unconventional opportunities which Oxy is adding to by further land acquisitions and exploiting with horizontal drilling and hydraulic fracturing. This long lived strategy of focus on the Lower 48 has enabled continuous low risk, profitable growth in production at a time when oil prices were rising. Investors have responded favorably to this value proposition.
Approximately 60% of Oxy’s 2013 capital budget is targeted at U.S. projects. Oxy’s international operations provide further opportunities for profitable growth, albeit with greater political risk. The largest single project is the Al Hosn project to develop the giant Shah gas field in Abu Dhabi. Natural gas production from this field will complement Oxy’s existing Dolphin natural gas pipeline project from Qatar to the U.A.E.
Shareholder value declined from April 2011 through March 2013 as Oxy was obliged to write down reserves primarily due to the impact of higher oil prices on future international production under production sharing contracts. A Board dispute and attempt by 78 year old former CEO Irani to displace current CEO Chazen did not help. Over this period Oxy’s beta ballooned to be the highest among the independents (Figure 2.8) even as its debt ratio remained at low levels relative to its rivals (Figure 4.3). Since the Board dispute was resolved in favor of Chazen in April 2013, shareholder value has improved.
The strategic lessons from Oxy are:
• Over the past ten years, the U.S. has provided major substantial growth opportunities and Oxy has prospered by expanding its land holdings and focusing on liquids rich opportunities.
• Oxy’s strong positions in the Middle East and North Africa and its long-standing positive relations with host governments have provided opportunities for further profitable growth. Though individually carrying more political risk than the U.S., production sharing agreements provide a buffer to any decrease in oil prices, since their structure allocates most of the price risk to the host government.
• Board disagreements should not be made public. The perception of disarray at the top of a company increases the risk in the eyes of investors and destroys value.
05
101520253035404550
Tota
l Deb
t/ C
apita
l %
Figure 4.3: Occidental Petroleum Corporation Total Debt/Capital
34

Value Creation by Independent Oil & Gas Companies
b. BG Group BG Group was created in February 1997 when British Gas plc divested Centrica and became BG plc. In September 1997, the company acquired Gujarat Gas Company (India's leading natural gas distribution company). In 1999 the company was reorganized as BG Group. The company purchased a controlling stake in Comgas (Brazilian gas distributor focused on São Paulo state). This marked the group’s entry into the Brazilian market. Under CEO Frank Chapman, BG built an international integrated natural gas company with regional exploration and production operations complemented by local distribution companies and global LNG trading. The results have been good for shareholders (Figure 4.4) until recently.
BG has a strong base in the North Sea and E&P assets in Egypt, Kazakhstan, Trinidad and Tobago, U.S.A, Tunisia, India, Thailand and Bolivia. Its current major projects are the Queensland Gas coal-seam gas to LNG export project in Australia and the development of a major pre-salt field in Brazil, where BG is non-operating partner with Petrobras as operator. This discovery changes BG’s positioning from a global natural gas company to a global oil and gas upstream company with an LNG trading capability. The new positioning has been solidified by the sale of its Gujarat and Comgas natural gas distribution businesses in 2012. The two major projects have both been troubled. Queensland Gas is delayed and over budget, and BG’s exciting position in Brazil has been clouded by government mandates applied to Petrobras, which have weakened PBR’s ability to execute its projects (see the second report in this trilogy). Shareholder value began to deteriorate in April 2011 and has declined since then. BG’s debt to equity increased significantly from 2008-12 (Figure 4.5) which may also be cause for concern. Further, BG is now increasing its emphasis on value creation through exploration. As will be seen in the discussion on Tullow, exploration value tends to be recognized in chunks with large value swings resulting from successful discoveries or disappointments.
0%
100%
200%
300%
400%
500%
600%
700%
800%
900%
1000%
TSR
Figure 4.4: BG Group TSR
BG Group S&P 500 Index
35

Value Creation by Independent Oil & Gas Companies
BG’s strategy presentation in May 2013 included a list of things they “will do differently” to provide greater portfolio focus and improved capital discipline:
• Invest $1.6-1.8 billion per year in exploration with a focus on early stage origination, discovery & development
• More active portfolio management to accelerate value delivery, and prioritize value over production
• Transparent milestones & greater asset disclosure • Simple organization and clear personal accountability
These responses address an implied dissatisfaction among investors with the coherence of BG’s exploration and business portfolios and with capital discipline: in short a sense that BG may have been trying to juggle too many objects of different shapes. So far, most investors are taking a “wait and see” approach before becoming buyers.
The strategic lessons from BG Group are:
• Company management can “fall in love with their positions” and neglect to prune their portfolio when it lacks coherence or when elements of the portfolio may be worth more to others than its value in their company’s portfolio.
• Similarly, organization structures, processes and metrics need to be regularly reviewed to assure that they are encouraging capital and operational discipline.
• Successful exploration creates great value, but a high weighting to exploration can lead to volatility as discoveries may be initially be highly valued, such that additional information when it becomes available has a high bar to clear to create a positive surprise.
05
101520253035404550
Tota
l Deb
t/ C
apita
l %
Figure 4.5: BG Group Total Debt/Capital %
36

Value Creation by Independent Oil & Gas Companies
c. ConocoPhillips ConocoPhillips (COP) is now the largest “pure play” independent E&P company by enterprise value (Figure 1.1). A series of transactions started at Phillips by CEO Jim Mulva culminated in the Phillips merger with Conoco in 2002 to create a potential new Super-major. Further acquisitions of Tosco (a large U.S. refiner) and Burlington Resources (a large independent with a high weighting towards natural gas) added bulk but weighted the COP portfolio more towards refining and towards North America than the other Super-majors.
ConocoPhillips pursued an aggressive strategy of organic investment in new projects which created greater shareholder value growth than the other Super-majors until the financial crisis (see the first report of this trilogy), but lost ground as oil and natural gas prices collapsed in 2009 (Figure 4.6).
With a higher proportion of non-operated projects than its rivals, COP was vulnerable to bunching of capital calls resulting in financial stress requiring an increase in debt ratio (Figure 4.7).
0%100%200%300%400%500%600%700%800%900%
1000%
Axis
Titl
e
Figure 4.6: ConocoPhillips TSR
ConocoPhillips S&P 500 Index
37

Value Creation by Independent Oil & Gas Companies
The company embarked on a portfolio rationalization, selling a number of upstream assets but unable to sell downstream assets at acceptable prices, resulting in increased the highest weighting to refining of the Super-majors. In July 2011, the ConocoPhillips Board decided to split the firm into two companies: the upstream sector became a pure play independent E&P company, retaining the ConocoPhillips name, and the downstream company became the largest U.S. independent refiner, taking the Phillips 66 name.
Since the split, ConocoPhillips has continued to rationalize its portfolio, divesting high risk projects such as Kashagan and reducing its exposure to Canadian oil sands, for which it no longer has forward integration into refining, while investing strongly in its North American shale oil resource development programs and international major projects.
05
101520253035404550
Tota
l Deb
t/ C
apita
l %
Figure 4.7: ConocoPhillips Total Debt/Capital %
38

Value Creation by Independent Oil & Gas Companies
Share holders who held on to both stocks have done well (Figure 4.8). Phillips 66 total shareholder return since its IPO in May, 2013 through end August 2013 was approximately 80%, benefitting from propitious timing as all U.S. refiners enjoyed high margins due to distressed inland domestic crude oil prices; ConocoPhillips’ TSR as an independent E&P company has exceeded that of Chevron, its closest Super-major rival (see first report of our trilogy). Over the period April 2011 through March 2013, COP was a high performer in TSR with lower beta than other independents (Figure 2.6).
Strategic lessons from ConocoPhillips are:
• ConocoPhillips provides empirical evidence that splitting upstream from downstream sectors can create value for shareholders.
• There are risks in having a high proportion of non-operated projects under development with little control over the cadence of capital calls.
• A large balanced, diversified portfolio can contribute to lower beta and lower cost of capital than COP’s independent rivals.
0%
50%
100%
150%
200%
250%TS
R
Figure 4.8: ConocoPhillips and Phillips 66 Compared
COP PSX
39

Value Creation by Independent Oil & Gas Companies
c. Marathon Oil Marathon came under pressure from activist investors in the 1980s, as did Phillips and Conoco. Phillips fought off Carl Icahn, took on debt to pay a special dividend to investors and remained independent. Conoco sold itself to DuPont, and Marathon was absorbed into US Steel. In 2001, USX spun off its steel business and in 2002 renamed itself Marathon Oil, about the same time as Phillips merged with Conoco. In 2005, Marathon bought out Ashland with whom it had formed a downstream joint venture. Marathon Oil Company reached the conclusion a little earlier than ConocoPhillips, that shareholders would realize greatest value from the split of its upstream from downstream businesses and completed the spin-off of its downstream business as Marathon Petroleum in July 2011.
Marathon Oil has provided respectable returns to shareholders over the past decade or so (Figure 4.9)
The results for Marathon shareholders since the split have been similar to those of ConocoPhillips. The downstream business soared in value, while the upstream Marathon Oil provided similar returns to those of ConocoPhillips (Figure 4.10). However, MRO has one third the enterprise value of COP.
0%100%200%300%400%500%600%700%800%900%
1000%
TSR
Figure 4.9: Marathon Oil TSR
Marathon Oil S&P 500 Index
40

Value Creation by Independent Oil & Gas Companies
MRO came through the financial crisis with less turbulence than COP and has maintained a conservative balance sheet (Figure 4.11). Under CEO Clarence Cazalot, the company has been responsibly led and has been rather risk-averse. However, its beta for 2001-11 (Figure 2.3) and for 24/2011 – 03/2013 has been higher than average for independents.
Marathon is promising higher growth in production (5-7% per year) than ConocoPhillips (3-5%) with strong growth projected from its Bakken and Eagle Ford (purchased from Hilcorp in 2012) leaseholds, and a higher dividend than most independents, though at 2%, it is lower than COP at 4%. MRO also
0%
50%
100%
150%
200%
250%TS
R
Figure 4.10: Marathon and ConocoPhillips Compared
MPC MRO COP PSX
05
101520253035404550
Tota
l Deb
t/ C
apita
l %
Figure 4.11:Marathon Oil Total Debt/Capital %
41

Value Creation by Independent Oil & Gas Companies emphasizes its renewed exploration portfolio in Kurdistan, East Africa, Gabon and the U.S. Gulf of Mexico. However, there seems a gap in international major projects in the next few years to offset the decline in mature fields.
The strategic lessons from Marathon are:
• As for COP, the split of upstream from downstream appears to have created value for shareholders.
• A corporate portfolio needs to be managed for coherence across types of assets and across time periods. MRO does not seem to have a strong pipeline of potential projects coming to fruition in the 2015-2020 timeframe and may need further acquisitions to strengthen its medium term portfolio.
d. Hess Corporation Hess Corporation is the last large oil and gas company to bear the name of its founder. Leon Hess formed Hess Incorporated in 1933 to make residential deliveries of fuel oil in 1933. The company built its first refinery in Port Reading, NJ in 1952, opened its first gasoline station in 1960, built a large refinery on St. Croix, in the U.S. Virgin Islands in 1967 and entered the upstream business in 1969 through a merger with Amerada Petroleum Corporation, becoming Amerada Hess. John B. Hess, son of Leon Hess, became CEO in 1995 and changed the name to Hess Corporation in 2006.
Hess started building its position in North Dakota in 1977 with the acquisition of 100,000 acres near Williston. It diluted its refining exposure through a joint venture with PDVSA of the St. Croix refinery to form HOVENSA in 1998, and during the 1990s invested in successful development of oil fields in the Gulf of Mexico, North Sea and Southeast Asia. It bought Triton Energy in 2001, adding production assets and exploration opportunities in Equatorial Guinea and the Malaysia/ Thailand joint development area. In the 2000s, the company increased its emphasis on exploration to increase its reserve life and made a strong move into shale plays, strengthening its position in the North Dakota Bakken play and buying into the .
Shareholder returns were lagging its rivals as Hess stock was particularly affected by the financial crisis. Large transactions in 2011 of Marquette Exploration to enter the Marcellus and a joint venture with Consol Energy to enter the Ohio Utica play did not seem to help (Figure 4.10).
42

Value Creation by Independent Oil & Gas Companies
The cause of the weak shareholder returns did not seem to be excessive debt (Figure 4.11) but strategic in nature. Because its refineries were on the East Coast of the USA like Sunoco, they were struggling economically without easy access to low cost shale oils, and the St. Croix refinery was affected by political turmoil in Venezuela so a spin-off or sale was not available.
In 2012, Hess announced the closure of St. Croix and in 2013 of the Port Reading refinery. In early 2013 an activist investor group, Elliott Management purchased 4% of Hess shares and announced a possible
0%
100%
200%
300%
400%
500%
600%
700%
800%
900%
1000%TS
R
Figure 4.10: Hess Corporation TSR
Hess S&P 500 Index
0
10
20
30
40
50
60
Tota
l Deb
t/ C
apita
l %
Figure 4.11: Hess Corporation Total Debt/Capital %
43

Value Creation by Independent Oil & Gas Companies intent to buy a further 4%. It proposed a new Board with more oil industry experience and a radical portfolio overhaul, exiting all downstream businesses and separating domestic from international assets into different companies.
Hess management responded with its own plan to exit downstream and simplify its upstream portfolio through asset sales and increase dividends and stock buy-backs as well as to strengthen its Board with new but different oil industry candidates. Hess and Elliott settled on a compromise including three of Elliott’s candidates; John Hess stepped down as Chairman and was replaced by a Director nominated by Hess, former Shell executive Mark Williams.
The final strategic outcome is not yet settled; the lessons from Hess are:
• Weak shareholder returns will inevitably attract activist investors with plans to increase short term stock prices and turn a profit on their original investment. Companies must move fast to preempt the activists.
o Hess was slow in following Marathon and ConocoPhillips in simplifying its portfolio by exiting its downstream businesses.
o Though Hess had plans to readjust its overall portfolio to increase shareholder value, it failed to make public a persuasive shareholder value proposition.
• A strong Board with oil and Gas experience can challenge management to revisit its assumptions and strategies; a weak Board provides lesser governance and can be used by activist investors as a wedge to force unwanted change.
• It is important when adding new portfolio pieces to explain how they will strengthen the coherence of the overall portfolio. The Hess value proposition had been focused on successful international exploration, mainly offshore, and its abrupt shift to U.S. onshore shale plays did not seem to play to the company’s strengths.
44

Value Creation by Independent Oil & Gas Companies
5. Worldwide Independents Finally, our study analyzed a set of companies that had grown and prospered as pure play independents with a mix of North American and international assets (Anadarko, Apache, Noble Energy and Tullow). Anadarko was spun out from a natural gas pipeline company; Noble Energy emerged from a combined drilling and exploration & production company; Apache grew by acquiring and redeveloping mature assets from major oil companies; Tullow reemerged from a slow start in the North Sea to become an exploration power house opening new African basins. Tullow achieved spectacular shareholder returns, but appears for the moment to have lost momentum (Figure 5.1).
Apache TSR went in lock step with Noble Energy until early 2012 but has lost ground since then. Anadarko was a weak TSR performer in the early 2000s, but has recovered in recent years.
0%
500%
1000%
1500%
2000%
2500%
TSR
Figure 5.1: Worldwide Independents TSR
Anadarko Apache Noble Energy Tullow S&P 500 Index
45

Value Creation by Independent Oil & Gas Companies
a. Anadarko Anadarko began life in 1959 as the exploration & production subsidiary of Panhandle Eastern Pipeline Company. Following the 1978 Natural Gas Policy Act (NGPA), Anadarko farmed in with Amoco to joint venture several Gulf of Mexico blocks. In 1979, Robert Allison became CEO of Anadarko and focused strongly on exploration in the Gulf of Mexico shelf. The NGPA started an inexorable process of natural gas deregulation, which caused Panhandle Eastern to rescind its contract to purchase LNG from the Algerian National Oil Company Sonatrach. As part of the settlement, Panhandle spun off Anadarko in 1984, with Sonatrach receiving an ownership share. In 1993, Anadarko became the first foreign company since Algerian nationalization to discover a new oil field in Algeria.
In the early 2000s, Anadarko began to lose momentum (Figure 5.2), and in 2003 Jim Hackett was appointed CEO with Robert Allison remaining as Chairman. Production declined from 2002-05.
In a series of bold moves in 2006, Anadarko purchased Kerr-McGee and Western Gas Resources, and acquire 2.6 million acres offshore Mozambique. Kerr McGee helped rejuvenate Anadarko’s exploration capabilities (but also brought with it a $14 billion law suit filed by creditors when its former Titanium Dioxide subsidiary Tronox declared bankruptcy in 2009citing environmental liabilities), while Western Gas gave the company a strong position in Rocky Mountain unconventional natural gas. In 2009, Anadarko announced major discoveries in the deep water Gulf of Mexico, Ghana and offshore Brazil.
The two major acquisitions stressed the Anadarko balance sheet, but the company was able to repair the damage quickly through disciplined portfolio rationalization (Figure 5.3), though the company’s debt ratio is high relative to its rivals, especially for a company with a strong exploration emphasis.
0%100%200%300%400%500%600%700%800%900%
1000%
TSR
Figure 5.2: Anadarko Petroleum TSR
Anadarko S&P 500 Index
46

Value Creation by Independent Oil & Gas Companies
In addition to the shadow cast by the Tronox, suit, Anadarko was also non-operating partner in the 2010 Macondo tragedy and settled its liabilities with BP for $4 Bn. The Company resolved a dispute with Algeria on excess profit taxes levied by the government in its favor for $4.4 Bn in net present value. In 2012, Anadarko discovered a huge natural gas field offshore Mozambique and this discovery was followed by two more successful exploration wells confirming large discoveries in adjacent fields. In 2013, Anadarko was able to monetize its Mozambique reserves in advance of production by agreeing to sell a 10-percent interest in Mozambique's Offshore Area 1 to ONGC for $2.64 billion in cash. Anadarko will remain the operator of Area 1 with a working interest of 26.5 percent. This followed a successful IPO in 2012 of the company’s Rocky Mountain midstream assets as Western Gas Equity Partners for $6.8 Bn.
The strategic lessons from Anadarko are:
• Acquisitions can propel a company into a different league, especially when followed by disciplined portfolio rationalization.
• Environmental liabilities are damaging financially and weaken reputation. They become a distraction to management and can become a hurdle to strategy development and execution.
• Successful exploration can create substantial shareholder value. Early harvesting of that value through farm-out strengthens a company’s balance sheet and demonstrates the implicit value of a discovery.
10
20
30
40
50
60
70
80
Tota
l Deb
t/ C
apita
l %
Figure 5.3: Anadarko Petroleum Total Debt/Capital
47

Value Creation by Independent Oil & Gas Companies
b. Apache Apache was founded in Minneapolis, Minn., by Raymond Plank and partners in 1954. After acquiring a wide range of companies, the company sold off the diversified businesses; emerged as Apache Petroleum Company in 1981 and purchased Dow Chemical Company’s oil and gas assets in 1982. There followed a long sequence of acquisitions (Table 5.1) as Apache honed two important capabilities: building strong relations with major oil companies to become a preferred buyer of (largely mature) properties as the majors continuously fine tuned their portfolios; and perfecting a performance measurement and reward system that provided incentives at all levels to redevelop fields and extract value that had not been recognized by their former owners.
Table 5.1: Major Apache Acquisitions
Year Acquisition Focus Price ($M) 1993 Hadson Australia 1993 Dekalb Canada 1996 Phoenix Egypt 1999 Shell GoM & Canada $518M 2001 Fletcher Challenge Canada $677M Repsol Egypt $447M 2003 BP UK North Sea, GoM $650M Shell GoM $200M 2004 Anadarko GoM $525M 2005 ExxonMobil West TX, Canada, GoM 2006 Amerada Hess Permian Basin 2010 Devon GoM $1,050M BP Permian, Canada. Egypt $6,400M Mariner GoM, Permian $2,700M 2011 ExxonMobil UK North Sea $1,750M 2012 49% of Burrup Holdings Australia
Growth by acquisition created substantial shareholder value especially in the 2000s while oil and prices were rising (Figure 5.4). In addition, Apache continued to find ways to add value to the purchased assets through organizational and technical innovation. However, the large acquisitions of 2011-12 appear to have caused some indigestion among investors. Of particular concern were the company’s extensive holdings in Egypt as that country experienced political turmoil.
48

Value Creation by Independent Oil & Gas Companies
Responding quickly to investors’ concerns, Apache began a process of portfolio rationalization in early 2013 through which it promised to realize $2 billion. This process has already resulted in an agreement with Sinopec to sell 33% of its Egypt oil and gas business for $3.1 Bn in cash. This followed a sale of its Gulf Mexico shelf assets to a company owned by private equity firm Riverstone Holdings for $3.75 Bn. Further sales are expected.
Despite the major acquisitions, Apache’s debt ratio has remained moderate and infusions from divestitures will allow debt reduction, share repurchases or special dividends.
0%
100%
200%
300%
400%
500%
600%
700%
800%TS
R
Table 5.4: Apache TSR
Apache S&P 500 Index
10
15
20
25
30
35
40
45
50
Tota
l Deb
t/ C
apita
l %
Figure 5.5: Apache Corporation - Total Debt/Capital
49

Value Creation by Independent Oil & Gas Companies Apache has also recognized that its core capabilities are not aligned with those required for major international LNG projects. Consequently, Apache has bought into Chevron’s Wheatstone LNG project to commercialize its offshore natural gas reserves, and has formed a joint venture with Chevron to develop the Kitimat, British Colombia LNG pipeline and LNG export project and commercialize its Horn River shale resources.
The lessons from Apache are:
• Portfolio rationalization should follow quickly after a series of acquisitions to create a strong, coherent platform for future profitable growth.
• Apache’s performance management system provided incentives at all levels to extract unrecognized value from acquired properties.
• Apache’s capability set of beneficial relations with Majors and other potential asset sellers, coupled with its ability to extract value unrecognized by the seller form a basis for continued profitable growth from acquisitions. Its realism in understanding the capabilities that it does not have (e.g., LNG development) will protect Apache from major mistakes and lower its risk over time, though its beta over the past couple years has been high relative to rivals.
c. Noble Energy Noble Energy traces its origins to Samedan Oil Corporation, founded by Lloyd Noble in 1932. In 1970, the company reorganized as Noble Affiliates with three operating companies, Samedan Oil Corporation, Noble Drilling Company and B.F. Walker trucking company. Noble Affiliates became publicly trading on NASDAQ in 1972 and transferred to NYSE (NBL) in 1980.
With falling oil prices, Noble sold B.F. Walker trucking in 1984 and spun off the drilling company to shareholders in 1985 as Noble Corporation (NE). After a loss during the oil price collapse of 1986, Noble returned to profitability in 1987. In 2000, Charles Davidson, previously CEO of Vastar joined Noble as Chairman and CEO. The company expanded from its U.S. base with production starting from the Alba field offshore Equatorial Guinea in 1991 and a further discovery of a deeper large gas condensate field in 2004. The company entered the North Sea in 1996 and started production in the Bohai Bay of China in 2003.
Noble built a reputation of innovative development of international stranded natural gas fields with a 2002 power plant development to commercialize its Amistad field in the Gulf of Guayaquil, Ecuador, a 2001 methanol production facility on Bioko Island, Equatorial Guinea to commercialize associated gas from the Alba gas condensate field and in 2004 local sales of natural gas from its Mari-B natural gas field offshore Israel.
In 2005, Noble acquired Patina Oil and Gas Corporation for $3.4 billion, with assets in the Rocky Mountain and Midcontinent of the U.S. This formed the basis for a recent transition from unconventional natural gas to development of the liquids rich Niobrara formation of the Wattenberg field in the Rocky Mountains DJ Basin. In 2011, Noble invested over $3 Bn to form a joint venture partnership with Consol Energy to develop over 600,000 acres of Marcellus shale in Southwest PA.
50

Value Creation by Independent Oil & Gas Companies Since 2008, Noble has achieved a succession of exploration successes in the deepwater Gulf of Mexico, the Tamar and giant Leviathan gas fields offshore Israel, followed by discoveries demonstrating extension of the new Levant Basin offshore Cyprus, and the Aseng field offshore Equatorial Guinea.
In 2012, Noble rationalized its portfolio by selling assets in the Permian Basin and Kansas and is selling its North Sea assets along with remaining U.S. assets outside its core areas of the DJ Basin and Marcellus.
The combination of exploration success, strong project execution, innovative natural gas commercialization and proactive portfolio management has rewarded investors (Figure 5.6).
0%
100%
200%
300%
400%
500%
600%
700%
800%
TSR
Figure 5.6: Noble Energy TSR
Noble Energy S&P 500 Index
1015202530354045505560
Tota
l Deb
t/ C
apita
l %
Figure 5.7: Noble Energy Total Debt/Capital
51

Value Creation by Independent Oil & Gas Companies Noble has maintained a conservative balance sheet with a moderate debt ratio (Figure 5.7).
Noble’s consistency of performance has led to a relatively low beta compared to independent rivals (Figures 2.3 and 2.8), despite a strong emphasis on exploration.
Strategic lessons from Noble Energy are:
• Consistency of performance leads to a lower beta, a lower cost of capital and a higher intrinsic value for expected future cash flows, leading to higher enterprise value than more risky rivals.
• Exploration success can deliver a material increase in shareholder value, when associated with a material position in a new basin with substantial opportunities for further discoveries.
• Proactive portfolio management to create a few material positions with visible potential for profitable growth that map well to the company’s competencies is a prerequisite for value creation.
d. Tullow Tullow Oil was founded in Ireland by Aidan Heavey in Ireland in 1985 to explore in Senegal and other parts of Africa that had been overlooked by the majors. It began production and local sales of natural gas in 1987. In 1988 the company acquired proven fields and exploration acreage in the UK and was awarded exploration acreage in the North Sea, Spain, Italy and the Yemen. In the 1990s Tullow discovered the Sara field in Pakistan and signed exploration licenses in India, Egypt and Romania. In 2000, Tullow acquired producing gas fields in the Southern North Sea from BP and refocused on the UK, West Africa and South Asia.
Tullow’s 2004 acquisition of Energy Africa for $500 M was transformational. It doubled the size of the company and provided access to several West African producing fields and provided a platform for its successful discovery of the Jubilee field (with partners Anadarko and Kosmos) offshore Ghana in 2007. In 2006, Tullow acquired Hardman Resources for $1.1 Bn to increase its holding in Uganda oil discoveries and further increased its Uganda holding with the 2010 acquisition of Heritage Oil and gas for $1.5 Bn. In 2012, Tullow farmed down 66% of its Uganda holdings to Total and CNOOC.
Tullow’s acquisition of Energy Africa and subsequent exploration success in Ghana and Uganda propelled substantial shareholder value growth through mid 2012 (Figure 5.8). Then Tullow failed to meet production targets due to sand encroachment in Jubilee field, and there has been a lull in new discoveries.
52

Value Creation by Independent Oil & Gas Companies
The Jubilee sand problem has apparently been fixed and Tullow has approval from the government to move ahead with its TEN project. Tullow has monetized some of its Uganda position, and has made important discoveries in Kenya. Its balance sheet is now robust (Figure 5.9) to support further development of its Ghana, Uganda and Kenya discoveries and continue to drill up its robust exploration portfolio.
The strategic lessons from Tullow Oil are:
0%
500%
1000%
1500%
2000%
2500%TS
R
Figure 5.8: Tullow Oil TSR
Tullow S&P 500 Index
10
20
30
40
50
60
70
80
Tota
l Deb
t/ C
apita
l %
Figure 5.9: Tullow Oil Total Debt/Capital
53

Value Creation by Independent Oil & Gas Companies
• Opening new basins crates substantial shareholder value. By entering early, before a basin’s potential is established, a company can generally negotiate attractive fiscal terms that are not available to itself or new entrants after significant discoveries have been made. Tullow has been a basin opener in Ghana, Uganda and Kenya.
• However, exploration success can generate excessive excitement among investors, resulting in value volatility. It is difficult for an exploration-based company to create a ratable sequence of positive surprises that will allow for continuous steady value growth.
• By doubling down through acquisitions of smaller players in Uganda, Tullow built a position of scale in Uganda basins and then was able to attract larger more experienced and financially strong companies (Total and CNOOC) to support its development plans.
• By all accounts, Tullow has been an exemplary partner in Ghana, with a strong record of social investment, good relations with the government, and working collaboratively with its partners, GNPC, Kosmos and Anadarko to bring the Jubilee field on stream in record time.
54

Value Creation by Independent Oil & Gas Companies
6. Conclusions The oil and gas industry is subject to price swings (Figure 2.1) as global supply and demand move from periods of perceived shortage to abundance. When prices are rising, companies receive the economic signal to invest in growth, but history advises companies to be financially conservative on order to sustain their strategies through subsequent periods of low prices and revenues. The relative prices of oil and gas have also changed dramatically over the past decade (Figure 2.2), with particular impact on the value of light crude oil in North America relative to international prices, on the relative value of oil compared to natural gas and the relative value of oil sands bitumen compared to light crude oils.
Navigating these stormy price relationships has been challenging. Companies that recognized the shifting trade winds in the 2000s created substantial shareholder value by investing strongly in growth. However, those companies whose portfolios were highly weighted to low value resources (e.g., natural gas and oil sands) generally struggled to create shareholder value. Those with portfolios weighted to light crude oil and international LNG with prices linked to oil, generally did well.
What separated the performers from the underperformers? There are some interesting lessons to learn from the individual company analyses that precede this section.
a. Shareholder Value Proposition
It is risky to alter a company’s shareholder value proposition abruptly. Investors with expectations based on the prior proposition will leave and investors that like the new proposition will take time before switching. Weak shareholder returns will inevitably attract activist investors with plans to increase short term stock prices and turn a profit on their original investment; companies must then move fast to preempt the activists.
• The CNRL stock price at the end of 2011 incorporated certain expectations of future profitable growth. By reducing capital spending as a percent of total assets, CNRL signaled that expectations of future growth should be revised downwards and consequently, the intrinsic value of the firm was lower than investors had been assuming. This perception was confirmed when CNRL failed to meet analysts’ expectations for financial results in the third quarter of 2012.
• Radical surgery on the portfolio changed the nature of Devon Energy. Investors that appreciated the broad portfolio of unconventional oil and gas with some exploration upside from deep water Gulf of Mexico and Brazil, likely moved their investments to companies with broader portfolios like Noble Energy and Anadarko. Devon was left to compete with EOG, CRL and CNRL as well as smaller companies such as Oasis, Range Resources and Cabot Oil and Gas for investors desiring pure play North American unconventional resources.
• It is important when adding new portfolio pieces to explain how they will strengthen the coherence of the overall portfolio. The Hess value proposition had been focused on successful international exploration, mainly offshore, and its abrupt shift to U.S. onshore shale plays did not seem to play to the company’s strengths.
55

Value Creation by Independent Oil & Gas Companies
b. Leadership and Organization
Organizational leadership requires alignment of the overall strategic direction; the values and culture that leaders expect; the decision rules that define who makes decisions and how they are made; performance management; and talent development. These aspects are not necessarily visible from outside the organization but collectively determine the effectiveness and durability of the firm.
• A strong Board with oil and Gas experience can challenge management to revisit its assumptions and strategies; a weak Board at Hess provided lesser governance and was used by activist investors as a wedge to force unwanted change.
• There is tremendous value to be created through early entry into a new large play. CLR understood the potential of the Bakken/ Three Forks play before most rivals, deployed new technologies to realize that potential, and doubled down on the play, moving from 300,000 to 1.1 million net acres.
• In the international arena, Tullow (Ghana, Uganda, Kenya), Anadarko (Ghana and Mozambique) and Noble (Levant Basin) have each created substantial shareholder value through successful exploration following early entry. Tullow and Anadarko provided early guidance on the value of their holdings by selling down their interests in Uganda and Mozambique.
• Through the strength of its “no excuses” culture, EOG recognized the changing business environment for natural gas before its rivals and moved rapidly to capture opportunities in the Bakken and Eagle Ford liquids rich shale plays. By contrast, Devon and Encana leadership may have been preoccupied with radical portfolio surgery and were slower in shifting from natural gas towards liquids rich shale resources.
• Organization structures, processes and metrics need to be regularly reviewed to assure that they are encouraging capital and operational discipline. BG, Apache and Hess created portfolios that lacked coherence and were slow to rationalize. Hess underperformance attracted Elliott Management to purchase 4% of the company’s stock and demand major changes in governance and strategy.
• Environmental liabilities are damaging financially and weaken reputation. They become a distraction to management and can become a hurdle to strategy development and execution. Anadarko shareholder value growth has been slowed by the Tronox environmental suit and the Macondo blow-out.
• Board disagreements should not be made public. The perception of disarray at the top of Oxy increased the risk in the eyes of investors and destroyed value.
56

Value Creation by Independent Oil & Gas Companies
c. Strategic Choices
Within their chosen leadership and organizational framework, leaders’ most important decisions are where and how to compete. They decide where to compete through their capital allocation and portfolio management processes and determine how to compete based on their core capabilities. Institutional investors argue in favor of “pure plays” on grounds that they prefer to construct their own portfolios of assets from a set of “pure play” companies, and prefer that companies focus on becoming the low cost producer within their segment. However, a narrowly defined portfolio can increase risk and lower intrinsic value relative to a rival with a broader, coherent portfolio.
Portfolio focus and coherence is important, but robustness to adverse business conditions is critical to survival of the firm. Senior corporate leaders need to be able to “see around corners” and recognize that a favorable business context can deteriorate (or strengthen) rapidly. Strategies need to capture the commanding heights of a new play, but be robust to different future scenarios: when a new scenario materializes, companies should move rapidly to rebalance their portfolios with valuable assets and continuous proactive portfolio management.
Valuable Assets
• CLR doubled down on the Bakken, increasing its lease holdings from 300,000 to 1.1 million acres, and invested strongly in its drilling program to demonstrate the growth potential. This provides the company with both a platform for future growth and the opportunity to capture economies of scale.
• Similarly, by doubling down through acquisitions of smaller players in Uganda, Tullow built a position of scale in Uganda basins and then was able to attract larger more experienced and financially strong companies (Total and CNOOC) to support its development plans.
• By contrast, EnCana was an industry leader before it sold off its international and deep water assets from 2004-06 and found itself with a portfolio that was not robust to low natural gas prices ; the company was late in shifting its portfolio to liquids rich shale resources. Following a similar pathway, Devon’s portfolio became excessively weighted to natural gas and oil sands, both of which have been experiencing low prices.
• CNRL may well have been acting prudently to slow down investment in organic growth in light of low prices for natural gas and Canadian heavy crude oil and may have determined that there were few projects that could meet the company’s threshold for return on investment. The challenge now facing the company is to restore confidence that its large inventory of undeveloped leases will support capital investments that return more than its cost of capital, which may be quite high based on the relatively high beta.
Proactive Portfolio Management
• ConocoPhillips has a large, balanced, diversified portfolio which is being actively rationalized following its split from the downstream business and contributes to lower risk than COP’s independent rivals. On a smaller scale, Noble Energy engages in proactive portfolio
57

Value Creation by Independent Oil & Gas Companies
management to create a few material positions with visible potential for profitable growth that map well to the company’s capabilities. Both companies show consistency of performance leading to a lower beta, a lower cost of capital and a higher intrinsic value for expected future cash flows, and to higher enterprise value than more risky rivals.
• Marathon (2011) and ConocoPhillips (2012) provide empirical evidence that splitting upstream from downstream sectors can create value for shareholders. Hess was slower in acting on this insight.
• Acquisitions can propel a company into a different league, especially when followed by disciplined portfolio rationalization as demonstrated by Anadarko after its acquisitions of Western Gas and Kerr McGee in 2006. Apache was slow to start but is now moving rapidly to rationalize its portfolio following acquisitions of Mariner and assets from BP.
• BG and Hess were criticized for incoherent portfolios with few common themes and this contributed to weak shareholder returns since 2009. Both companies (Hess following a hostile intervention by Elliott Management) are promising significant portfolio rationalization.
d. Aligned Capabilities
Critical capabilities for the Independents include the technical and team competencies that enable successful exploration, development and operation of new fields and value adding commercialization of the hydrocarbons they produce. Before they can deploy their craft skills, however, companies must build productive relations with landowners and governments to gain access to potential resources; then they need a capital allocation process that results in investment decisions that create profitable growth and a portfolio management process that continuously optimizes value by divesting assets that may be worth more to others. They also need to develop productive relations with other oil companies that allow them to acquire new assets that enhance portfolio value and partner constructively to manage major projects.
• EOG has been extraordinarily successful in effectively redeploying its resource play capabilities developed for shale gas to the oil rich plays; its landmen were able to accomplish this without tipping their hand at moderate cost.
• Oxy’s strong positions in the Middle East and North Africa and its long-standing positive relations with host governments have provided opportunities for profitable growth. Though individually carrying more political risk than the U.S., production sharing agreements provide a buffer to any decrease in oil prices, since their structure allocates most of the price risk to the host government.
• Apache’s performance management system provided incentives at all levels to extract unrecognized value from acquired properties.
• Apache’s capability set of beneficial relations with Majors and other potential asset sellers, coupled with its ability to extract value unrecognized by the seller form a basis for continued profitable growth from acquisitions. Its realism in understanding the capabilities that it does
58

Value Creation by Independent Oil & Gas Companies
not have (e.g., LNG development) will protect Apache from major mistakes and lower its risk over time, though its beta over the past couple years has been high relative to rivals. APA
• By all accounts, Tullow has been an exemplary partner in Ghana, with a strong record of social investment, good relations with the government, and working collaboratively with its partners, GNPC, Kosmos and Anadarko to bring the Jubilee field on stream in record time.
These lessons from the successes and disappointments of the Independents over the past decade bear reflection as a new generation of leaders take over and prepare for the next decade.
59


