The Importance of Streetscapes and Servicescapes …...servicescapes as noted in the TSV literature...
120
The Importance of Streetscapes and Servicescapes in Tourist Shopping Villages: A Case Study of Two Arizona Communities by Jordan Cox A Thesis Presented in Partial Fulfillment of the Requirements for the Degree Master of Science Approved July 2013 by the Graduate Supervisory Committee: Dallen Timothy, Chair Deepak Chhabra, Co-chair David Carlson ARIZONA STATE UNIVERSITY August 2013
Transcript of The Importance of Streetscapes and Servicescapes …...servicescapes as noted in the TSV literature...

The Importance of Streetscapes and Servicescapes in Tourist Shopping
Villages: A Case Study of Two Arizona Communities
by
Jordan Cox
A Thesis Presented in Partial Fulfillment of the Requirements for the Degree
Master of Science
Approved July 2013 by the Graduate Supervisory Committee:
Dallen Timothy, Chair
Deepak Chhabra, Co-chair David Carlson
ARIZONA STATE UNIVERSITY
August 2013

i
ABSTRACT
Many communities that once relied on the extractive industries have since turned
to tourism to find another source of income. These communities are primarily old mining
towns. Since these towns have started to reinvent themselves, they have become
important places of study. Previous literature has found specific factors that are common
in tourist shopping villages. Currently, there is not much research that has explored the
affect the streetscape and servicescape have on visitor experiences. Existing research
focuses on urban shopping settings such as shopping malls. This study interviewed
employees and surveyed visitors in two suburban tourist shopping villages in Arizona.
More specifically, it is aimed to explore how the streetscapes and servicescapes in tourist
shopping villages influence visitors’ overall experience, intent to return to the village, and
their purchasing behavior. This study adds to the current literature on tourist shopping
villages and the streetscapes and servicescapes as there is a limited amount of
information available. To date, the majority of scholarly information available describes
the factors of tourist shopping villages and does not attempt to identify their importance
for tourists. This study may serve as a stepping platform for future research. The
findings of this study offer important implications for destination marketing
organizations, different stakeholders of tourism, and the policy makers. This study
primarily focuses on the tourists’ view of tourist shopping villages, and can offer insight
into how to increase visitor spending.

ii
TABLE OF CONTENTS
Page
LIST OF TABLES ................................................................................................................. vi
LIST OF FIGURES .............................................................................................................. vii
CHAPTER
1 INTRODUCTION ............................................................................................. 1
2 REVIEW OF LITERATURE ........................................................................... 4
Tourist Shopping Villages and the Attractiveness of Destinations .............. 4
Attractiveness of Tourist Definitions ............................................................ 8
Post-Industrialism and the Development of TSVs ...................................... 14
Features of TSVs .......................................................................................... 21
Streetscapes and Servicescapes ................................................................... 23
3 CASE STUDIES AND METHODs ............................................................... 33
Jerome .......................................................................................................... 33
Wickenburg .................................................................................................. 35
Methods ........................................................................................................ 37
Data Collection and Analysis ...................................................................... 41
4 FINDINGS AND INTERPRETATIONS ....................................................... 47
5 CONCLUSION ............................................................................................... 57
Conceptual Implications .............................................................................. 57
Real World Recomendations ....................................................................... 58
Limitations/Future Research ........................................................................ 63
REFERENCES .................................................................................................................... 65

iii
APPENDIX
A MODIFIED STREETSCAPE & SERVICESCAPE FACTORS .............. 72
B VISITOR SURVEY & INTERVIEW ......................................................... 75
C SOCIO-DEMOGRAPHICS & TRAVEL BEHAVIOR .............................. 86
D STREETSCAPE, SERVICESCAPE & INFRASTRUCTURE
FREQUENCIES ....................................................................................... 93
E MULTIPLE REGRESSION MODELS .................................................... 104

iv
LIST OF TABLES
Table Page
1. Labor Force by Industry ................................................................................. 15
2. Environmental and Social Cues Found in TSV Streetscapes ....................... 30
3. Environmental Cues Found in TSV Servicescapes ....................................... 31
4. Environmental and Social Cues Found in Jerome and Wickenburg
Streetscapes ................................................................................................... 73
5. Environmental Cues Found in Jerome and Wickenburg Servicescapes
....................................................................................................................... 74
6. Socio-demographic Characteristics of Jerome and Wickenburg ................... 87
7. Satisfaction and Travel Behavior- Jerome ..................................................... 89
8. Satisfaction and Travel Behavior- Wickenburg ............................................ 91
9. Streetscape Frequencies- Jerome ................................................................... 94
10. Servicescape Frequencies- Jerome .............................................................. 96
11. Infrastructure Frequencies- Jerome ............................................................. 98
12. Streetscape Frequencies- Wickenburg ......................................................... 99
13. Servicescape Frequencies- Wickenburg .................................................... 101
14. Infrastructure Frequencies- Wickenburg ................................................... 103
15. Influence of Overall Streetscape Experience- Jerome .............................. 105
16. Influence of Overall Servicescape Experience- Jerome ............................ 105
17. Influence of Overall Infrastrucsture Experience- Jerome ......................... 106
18. Influence of Streetscape Intent to Return- Jerome .................................... 106
19. Influence of Servicescape Intent to Return- Jerome ................................. 107

v
20. Influence of Infrastructure Intent to Return- Jerome .................................. 107
21. Influence of Streetscape Purchasing Behavior- Jerome ............................. 108
22. Influence of Servicescape Purchasing Behavior- Jerome ......................... 108
23. Influence of Infrastructure Purchasing Behavior- Jerome ........................ 109
24. Influence of Overall Streetscape Experience- Wickenburg ...................... 109
25. Influence of Overall Servicescape Experience- Wickenburg ................... 110
26. Influence of Overall Infrastructure Experience- Wickeburg .................... 110
27. Influence of Streetscape Intention to Return- Wickenburg ....................... 111
28. Influence of Servicescape Intent to Return- Wickenburg ......................... 111
29. Influence of Infrastructure Intent to Return- Wickenburg ........................ 112
30. Influence of Streetscape Purchasing Behavior- Wickenburg ................... 112
31. Influence of Servicescape Purchasing Behavior- Wickenburg ................. 113
32. Influence of Infrastructure Purchasing Behavior- Wickenburg ................ 113

vi
LIST OF FIGURES
Figure Page
1. Variables influencing the attractiveness of a tourism region ........................ 10
2. General factors influencing the attractiveness of a tourism region ............... 11
1
Chapter 1
INTRODUCTION
Queen Hatshepsut’s journey in 1480 B.C.E. is recorded on a temple wall in Egypt,
marking one of the first journeys taken for leisure purposes. Thousands of years later,
tourism is one of the largest industries in the world. In 2009 in the United States, tourism
was the third largest retail industry after auto and food sales. In employment, tourism
was ranked second only to health services. There are many different categories of
tourism, including ethnic tourism, cultural tourism, heritage tourism, environmental
tourism, recreational tourism, and business tourism (Goeldner and Ritchie, 2009).
Heritage tourism is one of the oldest forms of tourism, existing since ancient
times. Ancient explorers, traders, sailors and adventurers explored the world and
discovered different cultures. During the 16th and 17th centuries, people participated in
the Grand Tour, traveling through multiple ancient cities, including Paris, Milan, Rome,
and Venice (Timothy and Boyd, 2003; Towner, 1984). Today, approximately half of all
international trips taken involve some type of cultural heritage.
The World Tourism Organization (UNWTO) noted that “heritage and culture
have become a component in almost 40 per cent of all international trips undertaken,”
(Timothy and Boyd, 2003, pg.1). Heritage tourism is the primary form of tourism in
many different parts of the world; places that have traditionally relied on other forms of
tourism have begun to offer heritage tourism (Richards, 2007; Prideaux and Kininmont,
1999; Timothy and Boyd, 2003). The UNWTO defines heritage tourism as “an

2
immersion in the natural history, human heritage, arts, philosophy and institutions of
another region,” (Timothy and Boyd, 2003, pg.1). Many others have defined heritage
tourism, and while no two definitions are identical, most of them share a common thread.
Common terms found in most heritage tourism definitions include remains of the past,
natural landscapes, local cultures, traditions, historic buildings, works of art, beautiful
scenery, and others’ ways of life (Caton and Santos, 2007; Goeldner and Ritchie, 2009;
Timothy and Boyd, 2003; Yale, 1991; Zeppel, Hall and Weiler, 1992). Heritage is often
equated with history; however, they are not one in the same. History is the recording of
the past, and while heritage does include history, it also includes language, culture,
identity and locality. Heritage refers to how the past is used today.
Heritage tourism is significant in many ways. Heritage helps visitors and
residents develop a sense of place within their own heritage. Place attachment formed by
visitors often sparks a desire to preserve historic areas (UNWTO, n.d.; Richards, 2007;
Park, 2010). Heritage and its conservation are also of scientific significance. Some
protected and conserved areas, such as national parks, may hold gene pools and
ecosystems that may have medical significance. There is also an educational aspect in
which visitors can learn about living history, culture, and the people of an area (Timothy
and Boyd, 2003). For most communities, however, the main promise of heritage tourism
lies in its economic potential. Regions with thriving heritage tourism benefit
economically from visitor expenditures. Tourists spend money at restaurants, souvenir
shops, convenience stores, and accommodations (Murphy et. al, 2010). Heritage tourism

3
sites rely on entrance fees and donations from visitors to survive, and they provide jobs
for local people, which help to stimulate the local economy.
One of the closest economic relationships between heritage tourism and economic
development in destination communities is shopping. A litany of studies has illustrated
how heritage tourists tend to be bigger spenders than other types of tourists, resulting in
more desirable fiscal outcomes for destinations than many other types of tourists
(Chhabra et al. 2003; McKercher and Chan 2005). One manifestation of this phenomenon
is the formation of what Getz (1993) has called tourist shopping villages (TSVs), where
tourists and recreationists go to enjoy a heritage ambience and to shop in rural or
suburban communities that are known for their historic importance. The purpose of this
research is to examine the role of the destination ambience in two Arizona TSVs, namely
Jerome and Wickenburg. The focus of the study is the communities’ streetscapes and
servicescapes as noted in the TSV literature and how the elements of these affect tourists’
overall experience, purchasing behavior, and intent to return.

4
Chapter 2
REVIEW OF LITERATURE
Tourist Shopping Villages and the Attractiveness of Destinations
There are multiple forms of cultural heritage attractions, which all fit into one of two
categories: tangible or intangible heritage. Tangible heritage includes buildings,
archaeological sites, heritage cities, routes and cultural landscapes, moveable cultural
property, and museums. Intangible heritage is mostly made up of stories, poems, and
traditions passed down through generations (Apostolakis, 2003; Caton and Santos, 2007;
ethics.unwto.org). Timothy and Boyd (2003) identified several different types of heritage
in the tourism context: natural heritage (national parks), living cultural heritage (customs
and traditions), built heritage (historic cities, castles), industrial heritage (coal mines,
lumber mills), personal heritage (cemeteries, religious sites), and dark heritage (places of
atrocity, death and pain).
One of the most salient forms of heritage in Arizona and the US Southwest is
industrial heritage, and it is this resource from the past that is the focus of the present
study. Since the decline of extractive industries throughout the world, including in the
United States, tourism has been an important tool in reinvigorating derelict industrial
regions in the form of industrial heritage. One result has been the growth and
development of the TSVs noted above. Several of these TSVs exist in Arizona based
upon the villages’ industrial (primarily mining) past and have become known as desirable
destinations because of the shopping opportunities that have developed and enhanced the

5
heritage appeal of the communities. This study will take place in two industrial heritage-
based TSVs in Arizona: Jerome and Wickenburg. These towns were once booming mine
towns that faced a detrimental decline in the mining industry, and have revitalized their
economies by turning to tourism, particularly recreational shopping.
As already noted, observers have found significant relationships between heritage
destinations and shopping. One manifestation of this is tourist shopping villages (TSVs).
TSVs are an element of the leisure shopping phenomenon, and are often linked to
heritage conservation (Getz, 1993). Getz (1993) defines tourist shopping villages as:
[S]mall towns and villages that base their tourist appeal on retailing, often in a pleasant setting marked by historical or natural amenities. They are found along touring routes, in destination areas and near urban centres, but are markedly different from urban business and shopping districts in terms of their small scale, specialty retailing and distinct ambiance (p.15).
Shopping is a complex subject and one of the oldest and most important activities
undertaken by tourists (Lehto, Cai, O’Leary, and Huan, 2004; Goss, 1993; Murphy,
Benckendorff, Moscardo, and Pearce, 2010; Murphy et. al, 2008; Timothy & Butler,
1995; Yüksel, 2007). Despite the gaps in the wide-ranging literature, one constant in the
research surrounding leisure shopping is its economic importance, as well as its
importance in creating a positive visitor experience. Multiple studies have determined
that shopping is among the top leisure activities in tourism throughout the world, as most
tourists seek to purchase some kind of souvenir, and shopping is often the main
motivation for taking a trip. Many tourists do not feel satisfied if they do not purchase
something to represent their experience (Lehto et. al., 2004; Snepenger, Murphy,

6
O’Connell, Gregg, 2003; Timothy & Butler, 1995; Turner and Reisinger, 2001; Wilkins,
2011). Following accommodations, shopping is the second most important expenditure
in both domestic and international tourism (Goss, 1993; Turner and Reisinger, 2001).
Some estimates suggest that shopping accounts for 33% of tourists’ expenditures (Getz,
1993; Littrel et. al. 1994; Murphy, Moscardo, Benckendorff, and Pearce, 2011; Turner
and Reisinger, 2001; Wilkins, 2011). Moscardo’s (2004) study found that 49% of
tourists she surveyed said that they went shopping for souvenirs (local arts and crafts),
and 62% said that they went shopping in general.
Some researchers have suggested that shopping enhances a site and the
experience of the visitor (Murphy et. al, 2010). However, there is some disagreement
among researchers on this subject. Timothy (2005) references 11 studies after stating that
shopping is a universal activity and that it does, indeed, enhance destinations globally.
Getz (1993) stated that there has been research done in historic inner cities that has
confirmed that “historic settings and shopping together present an inviting leisure
environment,” (1993, pg. 17). Also in the article, Getz stated that while shopping is a
very common tourist activity, “it does not necessarily mean that shopping heightens an
area’s relative attractiveness,” (1993, p.17). While this discrepancy should be
acknowledged, most of the existing literature leans toward the notion that shopping
improves a tourism area.
Due to the complexity of this subject, the current literature on leisure shopping is
vast and covers a wide range of topics, yet relatively little is known about tourists’

7
experiences in tourist shopping villages and how TSVs can influence the visitors’
experiences.
Murphy et. al. (2010) identified several needs for future research on tourist
shopping villages, claiming that shopping is a very important visitor activity, but it is
poorly researched in TSV settings. While onsite visitor experiences, including the
influences of servicescapes and other elements of the retail environment, have been
thoroughly researched in urban retail centers and tourist attractions (Timothy, 2005), they
are poorly understood in the context of TSVs. How do intangible elements, such as
service quality and experiencing new cultures, affect the visitor experience? Research is
needed to understand the linkage of elements that are consistent with the overall theme of
the village, including the interior and exterior environment of shops. These concepts
should be applied to TSVs and other outdoor shopping areas. It is also worth researching
whether or not visitors are more interested in the environment and the theme of the
village rather than the products offered. Additionally, Bäkström, (2006) suggested that
future studies focus on the importance that individuals attach to the physical aspects of
store environments while they are partaking in leisure shopping, and what meanings
those individuals attribute to these aspects. She also recommended researching the role
these aspects play in creating the satisfaction derived from leisure shopping.
These issues are all important in understanding how TSVs become tourist
attractions and how their physical environments affect visitors’ experiences. This study
aims to examine the role of streetscapes and servicescapes in the experiences of tourists,

8
how they influence visitors’ purchasing behavior, and their intent to return to the TSV.
TSVs, however, as already noted, are different from other shopping environments in that
they typically derive most of their appeal from their historic origins. Their cultural or
natural heritage, therefore, provides the foundations for tourism development, while
shopping becomes the secondary product down the road. In the end, however, the
heritage and shopping elements tend to become equal in importance for attracting
tourists.
Attractiveness of Tourist Destinations
Ritchie and Zins (1978) presented a model aimed at determining the variables that most
influence the attractiveness of a tourism region. This is a two-stage model; the first stage
includes the general factors that determine the overall attractiveness of a tourism region,
and the second stage includes the social and cultural elements contributing to the
attractiveness of a tourism region, shown in Figure 1. While both stages may apply to
TSVs, this study will only include the first stage. The first stage of the model lists eight
variables that determine the overall attractiveness of a tourism region, shown in Figure 1
and described in Figure 2. These variables are sport, recreation and educational facilities,
shopping and commercial facilities, price levels, infrastructure of the region, attitudes
towards tourists, accessibility of the region, cultural and social characteristics, and natural
beauty and climate. The inclusion of shopping and commercial facilities in this model

9
supports the idea that shopping does increase a tourism area’s attractiveness. The
remaining factors will be further discussed later in this study.

Figure 1. Variables influencing the attractiveness of a tourism region
STAGE 1
STAGE 2 -
10
Source: Ritchie and Zins (1978)
. Variables influencing the attractiveness of a tourism region
STAGE 1 - General factors which determine the overall attractiveness of a tourism region
Sport, recreation and educational facilities
Natural beauty and climate
Cultural and social characteristics
Accessibility of the region
Attitudes towards tourists
Infrastructure of the region
Price levels
Shopping and commercial facilities
Social and cultural elements contributing to the attractiveness of a tourism region
Work
Dress
Architecture
Handicrafts
History
Language
Religion
Education
Traditions
Leisure Activities
General factors which determine the overall
Sport, recreation and educational facilities
Natural beauty and climate
Cultural and social
Accessibility of the region
Attitudes towards tourists
Infrastructure of the region
Shopping and commercial
Social and cultural elements contributing to the
Work
Dress
Architecture
Handicrafts
History
Language
Religion
Education
Traditions
Leisure Activities

Figure 2. General Factors Influencing the Attractiveness of a Tourism Region
Natural beauty and climate
•which includes the general topography; flora and fauna; proximity to lakes, rivers and sea; mountains; islands; hot and mineral water springs; waterfalls; as well as; amount of sunshine; temperature; winds; precipitation; discomfort index
Culture and social characteristics
•which includes language; traditions; gastronomic practices; art; sculpture; music; architecture; work; religion; education; dress; leisure behavior; history; museums; and festivals
Sport, recreation and educational facilities
•which includes golf courses; tennis courts; swimming; skiing; horseback riding; sailing; movies; casinos; health spas; picnic grounds; hiking trails; zoos; aquariums; and botanical gardens
Shopping and commercial facilities
•which includes souvenir and gift shops; boutiques; shopping malls; commercial displays
Infrastructure of the region
•which includes the quality and availability of differenct means of communication; auto routes; lodging; health services; information; food services; and level of personal and material safety
Price levels
•which involves the value received for money spent on major services, food, lodging and transportation within the region
Attitudes towards tourists
•which involves the warmth of reception by the local population; ease of communication; willingness to privide information; and a lack of hostility towards tourism activities
Accessibility of the region
•which includes the physical distance to the region; the time involved in reaching the region; and practical barriers due to customs and security inspections
11
Source: Ritchie and Zins (1978)
General Factors Influencing the Attractiveness of a Tourism Region
which includes the general topography; flora and fauna; proximity to lakes, rivers and sea; mountains; islands; hot and mineral water springs; waterfalls; as well as; amount of sunshine; temperature; winds; precipitation; discomfort index
Culture and social characteristics
which includes language; traditions; gastronomic practices; art; sculpture; music; architecture; work; religion; education; dress; leisure behavior; history; museums; and festivals
Sport, recreation and educational facilities
which includes golf courses; tennis courts; swimming; skiing; horseback riding; sailing; movies; casinos; health spas; picnic grounds; hiking trails; zoos; aquariums; and botanical
Shopping and commercial facilities
which includes souvenir and gift shops; boutiques; shopping malls; commercial displays
which includes the quality and availability of differenct means of communication; auto routes; lodging; health services; information; food services; and level of personal and material safety
which involves the value received for money spent on major services, food, lodging and transportation within the region
which involves the warmth of reception by the local population; ease of communication; willingness to privide information; and a lack of hostility towards tourism activities
which includes the physical distance to the region; the time involved in reaching the region; and practical barriers due to customs and security inspections
General Factors Influencing the Attractiveness of a Tourism Region
which includes the general topography; flora and fauna; proximity to lakes, rivers and sea; mountains; islands; hot and mineral water springs; waterfalls; as well as; amount of sunshine;
which includes language; traditions; gastronomic practices; art; sculpture; music; architecture;
which includes golf courses; tennis courts; swimming; skiing; horseback riding; sailing; movies; casinos; health spas; picnic grounds; hiking trails; zoos; aquariums; and botanical
which includes souvenir and gift shops; boutiques; shopping malls; commercial displays
which includes the quality and availability of differenct means of communication; auto routes; lodging; health services; information; food services; and level of personal and material safety
which involves the value received for money spent on major services, food, lodging and
which involves the warmth of reception by the local population; ease of communication;
which includes the physical distance to the region; the time involved in reaching the region;

12
The first factor from Ritchie and Zins’ (1978) model is ‘natural beauty and
climate.’ This includes the flora and fauna, which is part of the vegetation of an area, and
the temperature of the area. In this study, as it is being conducted in Arizona, the
temperature of the region can be very important. Day trippers from the Phoenix area
usually enjoy a break from the summer heat, making at least one of the two sites in this
study, Jerome, an ideal place to go, as the temperature tends to be much lower than that in
Phoenix.
The second factor is ‘cultural and social characteristics,’ including language and
tradition. Languages and traditions are part of intangible heritage, and are usually found
in TSVs. Museums and festivals can serve as anchor attractions in a TSV. Also in this
category are architecture and art, which are tangible heritage.
The next factor in Ritchie and Zins’ (1978) model is the availability of ‘sport,
recreation, and educational facilities.’ Amenities such as golf courses, swimming, skiing
and horseback riding are interactive, participatory activities for visitors. Casinos, health
spas, zoos, and hiking trails can be anchor attractions that entice tourists to visit a village.
‘Shopping and commercial facilities’ includes souvenir and gift shops, boutique
shops, and displays. This is the foundation of a TSV, as the majority, if not all, of the
shops in a TSV are unique, boutique style stores.
The ‘infrastructure of the region’ is important to any tourist attraction. This
includes parking and easy public access, which TSVs sometimes struggle with. TSVs are
often located in old towns that were not built to sustain a heavy traffic flow, which leads

13
town managers to be creative with the space available. Also in this category are lodging
and food services. Both of these are important components in TSVs, as they can lure
visitors to stay longer and spend more money.
Of the eight factors listed in Ritchie and Zins’ (1978) model, one of them, ‘price
levels,’ is not very relevant to TSVs. While this may be somewhat applicable to any
lodging properties in a village, people are more willing to spend money on items that are
unique to a location, such as artwork and handicrafts, typically found in TSVs (Murphy
et. al., 2010).
Ritchie and Zins’ (1978) model includes a factor called ‘attitudes towards
tourists,’ which is echoed in Mitchell’s (1998) creative destruction model. Ritchie and
Zins found that of the eight factors that contribute to the attractiveness of a tourism
region, ‘attitudes towards tourists’ was ranked third most important to tourists. While
this study focused on warm, helpful and friendly attitudes, it is safe to assume that
negative attitudes towards tourists would be just as important. Mitchell’s creative
destruction begins with positive attitudes towards tourists, but as tourism takes over, the
locals’ views of tourists begins to worsen, ending with an extremely negative attitude
towards visitors. Drawing from both models, it is necessary to find a happy medium in
which the locals do not feel threatened by tourism, and the visitors feel welcomed by the
locals.
Finally, ‘accessibility of the region’ refers to the distance and time travelled to
arrive at the tourist destination, as well as any barriers to entrance. Murphy et. al. (2010)

14
stated that in order to have a busy TSV, it needs to be located close enough to a large
base market where visitors can make a day trip to the village. It should also be relatively
easy for visitors to access from main roads; signage can be helpful to guide visitors to the
village.
Post-Industrialism and the Development of TSVs
Many regions of the world have undergone an economic transition from extractive
economies (e.g. mining, hunting, gathering, agriculture), to manufacturing/industrial
economies, to post-industrial economic activities (e.g. services and information
technology). In pre-industrial societies, more than 60% of the labor force is engaged in
extractive industries, which include mining, fishing, forestry, and agriculture. These
industries were, and still are, exceptionally important to the global economy (Bell, 1976).
By the late 1970s, some areas of the world were still in the pre-industrial period,
including parts of Asia, Africa, and South America. Some areas of the world, such as
Japan and the United States, have moved on to become industrial and post-industrial
societies. In an industrial society, the mass production of goods prevails, and workers
rely more heavily on machinery for production. Post-industrial societies are based on
services rather than the production of goods. In the US in 1950, half of the labor force
was involved in the production of goods, with 34% directly manufacturing products
(Bell, 1976). The 2010 US Census found that only 18.6% of the population was
employed in the agriculture, mining, construction, and manufacturing industries. By
2010, over one third of the US population, 34.4%, was employed in the retail trade and
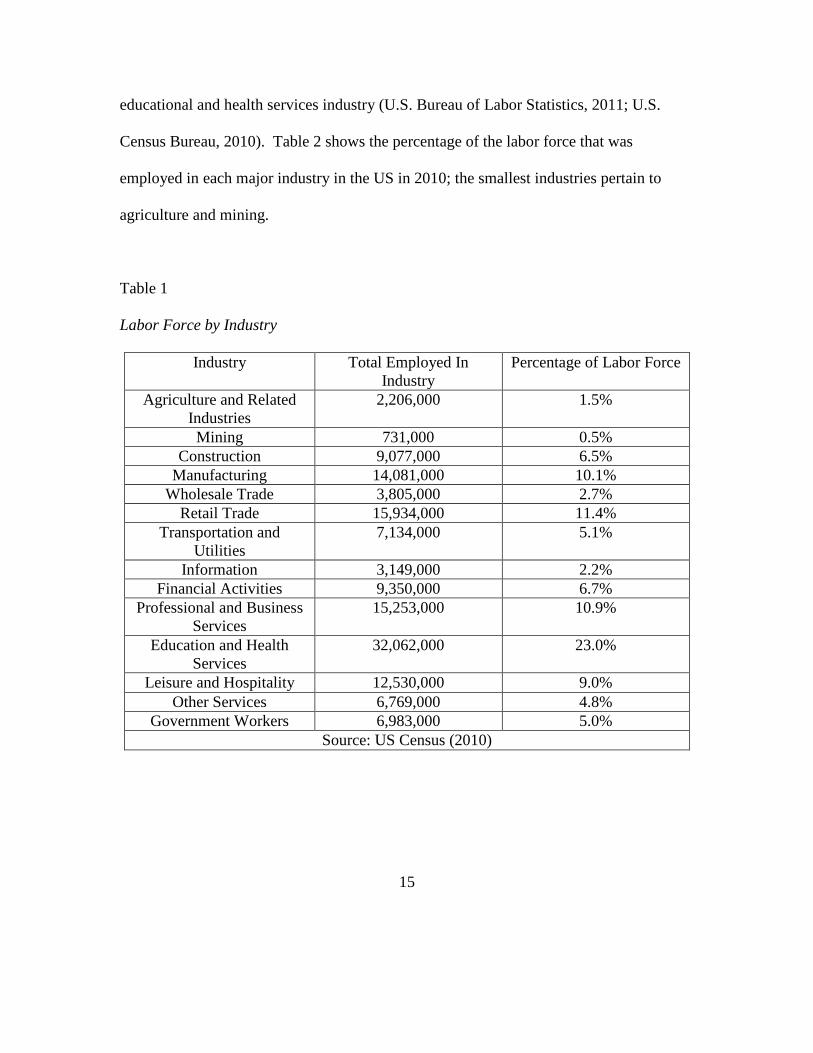
15
educational and health services industry (U.S. Bureau of Labor Statistics, 2011; U.S.
Census Bureau, 2010). Table 2 shows the percentage of the labor force that was
employed in each major industry in the US in 2010; the smallest industries pertain to
agriculture and mining.
Table 1
Labor Force by Industry
Industry Total Employed In Industry
Percentage of Labor Force
Agriculture and Related Industries
2,206,000 1.5%
Mining 731,000 0.5% Construction 9,077,000 6.5%
Manufacturing 14,081,000 10.1% Wholesale Trade 3,805,000 2.7%
Retail Trade 15,934,000 11.4% Transportation and
Utilities 7,134,000 5.1%
Information 3,149,000 2.2% Financial Activities 9,350,000 6.7%
Professional and Business Services
15,253,000 10.9%
Education and Health Services
32,062,000 23.0%
Leisure and Hospitality 12,530,000 9.0% Other Services 6,769,000 4.8%
Government Workers 6,983,000 5.0% Source: US Census (2010)

16
The production of goods will continue to be an important component in the
United States as long as the public yearns for a higher standard of living. However, goods
are being produced by fewer and fewer people (U.S. Census Bureau, 2010).
The transition from an industrial society to a post-industrial society has roughly
followed the economic shift from Fordism to post-Fordism (Apostolakis, 2003). The
concept of Fordism began in the 1920s, and was based on Henry Ford’s approach to mass
production (Ioannides and Debbage, 1997). Ford used an assembly line and broke down
complex tasks into simpler tasks by the use of specialized tools. By doing so, Ford was
able to increase the volume of goods produced, while at the same time reducing the cost
of producing the goods (Antonio and Bonanno, 2000; Sayer, 1989). The major
characteristics of Fordism include mass production and consumption, standardization of
products, unskilled laborers, and most everything being crafted by a machine rather than
by hand (Clarke, 1990; Ioannides and Debbage, 1997).
The Fordist economy was at its highest point in the 1960s. The 1970s marked a
time of crisis for Fordist economies, and during the 1980s the economy began to shift
towards post-Fordist service economies (Clarke, 1990; Ioannides and Debbage, 1997).
Rather than mass production, post-Fordism uses small batch production. Goods and jobs
are more specialized, and luxury and custom goods are more important. Mass marketing
is replaced by market segmentation in which consumers are treated as different groups
who seek different goods and services. Production of goods is based on demand, rather
than relying on a mass stock of standardized goods (Ioannides and Debbage, 1997; Sayer,

17
1989), and the economic focus shifts from manufacturing to more service-oriented
economies such as technology, tourism, and finance.
One area of historic economic importance that has undergone a radical change, or
de-industrialization, is mining. Mining in the US southwest began in 1849 during the
California Gold Rush. When the output of gold decreased, the price of silver increased.
Copper did not become very important or valuable until the 1890s. Copper camps were
usually camps that had previously mined for other minerals, such as gold or silver.
Nikola Tesla introduced alternating current (AC) electricity at the World Exposition in
Chicago in 1893. The AC system relied on copper as a conductor for electricity, causing
the copper industry to boom. By 1910, Arizona had become the country’s leader in
copper mining (Arizona Mining Association, 2013), and by 1970 the US had become the
largest copper producer in the world (Tilton and Landsberg, 1999).
By 1790, a mere 5% of Americans lived in cities that had a population of 2,500 or
more. By 1995, that number had increased to over 80% of the American population.
Rural North America was heavily dependent on the extractive industries until the 1970s.
During this time, an economic restructuring was occurring, shifting from pre-
industrial/industrial society with a Fordist economy to a post-industrial society with a
post-Fordist economy. The US started to move away from the extractive economy to a
more service-based economy. This caused a rise in rural unemployment, which forced
people to have to find new sources of income. Many turned to service-based activities,
such as tourism. Areas that were once heavily production based have now become

18
consumption areas (Litvin, 2005; Daugstad, 2008). One manifestation of this
phenomenon was socio-economic change in rural America, and the development of what
Getz (1993) terms ‘tourist shopping villages.’
In most cases, TSVs began as agricultural or mining settlements that possessed cultural and/or natural heritage features that were of interest to outsiders. As part of a natural process, then, tourism began to grow, transforming them into boutique communities where shopping dominates the tourism scene (Timothy, 2005 p. 48).
As previously noted, Getz (1993) defines TSVs as small towns that attract tourists by
unique shopping opportunities, and historic or natural amenities. The primary appeal of
TSVs is heritage or natural surroundings, but they also offer specialty shops,
accommodations, and restaurants designed around a specific theme, all of which create a
unique rural shopping appeal. TSVs are often set in important historic areas that offer
additional attractions and services for visitors. These attractions may consist of
museums, guided tours, historic buildings, bed and breakfast establishments, and
shopping (Getz, 1993; Lew, 1989). Businesses typically found in TSVs include cafes,
antique shops, gift shops, art galleries, book stores, and restaurants (Timothy, 2005). A
combination of these amenities, together with the villages’ heritage ambience, attracts
tourists to these towns (Murphy et. al., 2010).
As the above paragraphs note, TSVs tend to spring up in attractive areas. There
are three ways in which TSVs develop: natural/organic evolution, entrepreneur-driven,
and planned. In the case of natural evolution, tourist-oriented services develop in
response to tourist demand, which usually appears and grows as a result of an area’s

19
natural or cultural aesthetics (Getz, 1993; Lew, 1989). There is no single individual or
business that dominates the area, only several small businesses. Although growth begins
organically, local planning and environmental controls are needed to conserve the
heritage and natural amenities in the area (Getz, 1993).
In an entrepreneur-driven TSV, there is a dominant business or individual that
takes initiative, and others may follow suit. The first businesses act as catalysts in hopes
that tourism demand will be stimulated. There is a risk of selling out to non-residents and
a loss of authentic heritage in the area (Getz, 1993).
The final strategy of TSV development is a planned site. A developer may be
enticed by the heritage or natural attractiveness of an area, and create a TSV where one
does not exist. This would result in a built heritage site, with a high risk of a negative
reaction due to its lack of authenticity (Getz, 1993).
Souvenir shops are a common result of tourism growth. As tourism becomes
more concentrated in an area, souvenir shops are established to capitalize on tourists’
need to spend. As tourism increased throughout the 20th century, tourists’ demand for
local handicrafts increased and souvenir shops began to open around major attractions.
Besides meeting tourist demand, shopping adds attractiveness to most tourist
destinations, which can increase the flow of traffic through an area (Timothy, 2005). As
TSVs develop, the entire leisure experience should be taken into consideration to attract
tourists (Murphy, Moscardo, Benckendorff & Pearce, 2011). As noted above, initially,
the growth of a TSV is largely due to the nearby natural or heritage attraction. As the

20
number of visitors increases, the town begins to thrive and shopping comes in, adding to
the flow of tourists (Murphy et. al., 2010).
Successful TSVs do not solely focus on the shops in the village and the products
that are sold; they focus on the visitors’ leisure experience as a whole, including the
shops and additional activities available for tourists. TSVs are typically located near
multiple anchor attractions, although there are some exceptions. Single dominant anchor
attractions are not common. It is better to have several smaller anchor attractions than
one dominant one; if the dominant anchor attraction moves or closes, the town may have
to re-establish itself as a tourist destination. Anchor attractions can include large
museums, large theme stores, and natural or heritage tourism sites. The more shops,
restaurants, and accommodations that are available, the longer tourists are likely to stay
(Murphy et. al., 2010). Also, the more significant the attractions are, the more people
will likely visit the TSV (Apostolakis, 2003).
TSVs are typically located near a large base market, or on a touring route. It is
beneficial to the TSV if it is located near a major highway, as the highway provides easy
access. It is beneficial if the drive to the TSV is scenic and enjoyable, rather than
something that has to be endured, however, not all villages have a choice in this matter,
as some of them have developed organically (Murphy et. al, 2008; Murphy et. al, 2010).

21
Features of TSVs
Visitor information centers offer information, usually free of charge, to the public. The
information provided is intended to aid in creating a positive experience for visitors. The
information center needs to be easy to access and clearly visible to tourists. Information
provided can include maps, accommodation options, tours, and activity information.
Maps are important to help visitors find their way to and around the village. They can
help to manage the traffic flow of visitors, guiding them to a particular pathway through
the village (Murphy et. al, 2008; Murphy et. al, 2010).
Certain amenities are often overlooked that are actually very important to visitors’
perceptions of a TSV. Some of these amenities are trash cans, public restrooms, benches,
shade, lighting, parks and play areas for children. Many successful TSVs have
incorporated these amenities into the village without taking away from the heritage
aesthetic by designing them to fit the theme of the village (Murphy et. al, 2010).
As a TSV grows, the need for accommodations becomes increasingly important.
Most TSV visitors spend half a day to a full day in the village, but there are tourists who
spend longer periods of time and require accommodations. Accommodations in TSVs
usually consist of bed and breakfast inns, country inns, dude ranches, and guest houses.
Some locations renovate heritage buildings, such as barns or workers quarters, and
transform them into guest accommodations, keeping with the heritage theme of the rest of
the village (Murphy et. al., 2010).
22
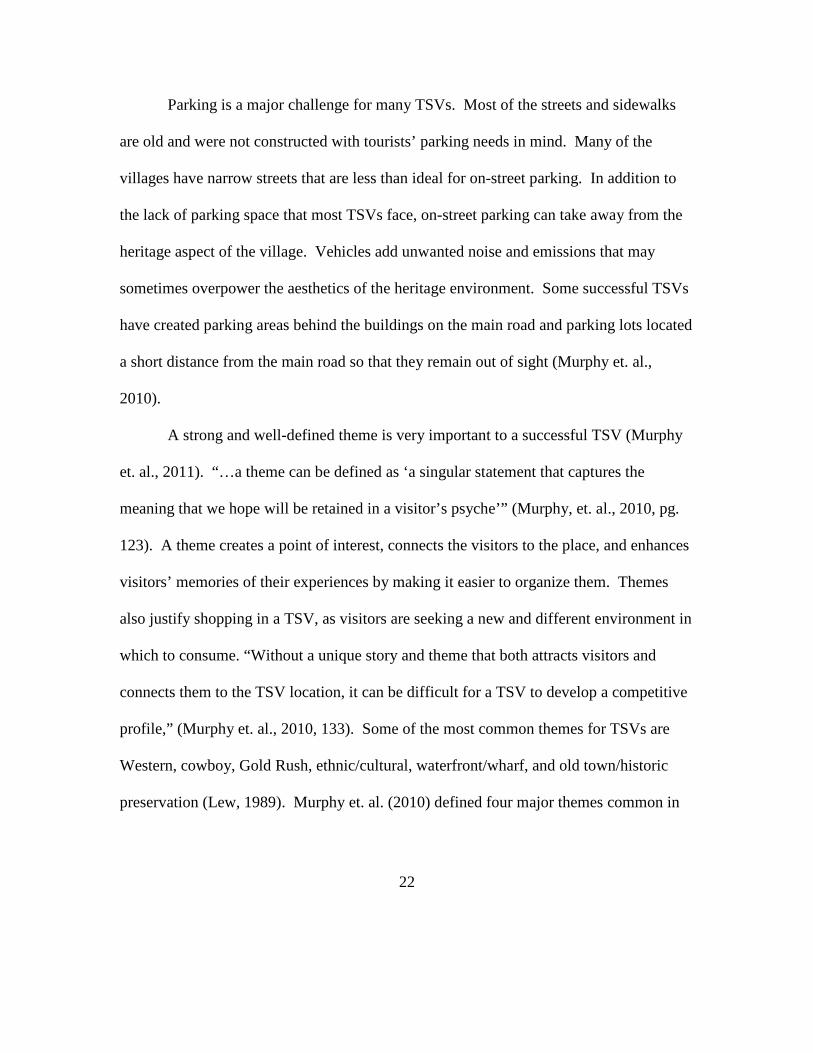
Parking is a major challenge for many TSVs. Most of the streets and sidewalks
are old and were not constructed with tourists’ parking needs in mind. Many of the
villages have narrow streets that are less than ideal for on-street parking. In addition to
the lack of parking space that most TSVs face, on-street parking can take away from the
heritage aspect of the village. Vehicles add unwanted noise and emissions that may
sometimes overpower the aesthetics of the heritage environment. Some successful TSVs
have created parking areas behind the buildings on the main road and parking lots located
a short distance from the main road so that they remain out of sight (Murphy et. al.,
2010).
A strong and well-defined theme is very important to a successful TSV (Murphy
et. al., 2011). “…a theme can be defined as ‘a singular statement that captures the
meaning that we hope will be retained in a visitor’s psyche’” (Murphy, et. al., 2010, pg.
123). A theme creates a point of interest, connects the visitors to the place, and enhances
visitors’ memories of their experiences by making it easier to organize them. Themes
also justify shopping in a TSV, as visitors are seeking a new and different environment in
which to consume. “Without a unique story and theme that both attracts visitors and
connects them to the TSV location, it can be difficult for a TSV to develop a competitive
profile,” (Murphy et. al., 2010, 133). Some of the most common themes for TSVs are
Western, cowboy, Gold Rush, ethnic/cultural, waterfront/wharf, and old town/historic
preservation (Lew, 1989). Murphy et. al. (2010) defined four major themes common in

23
TSVs. These themes are nature, primitive or ethnic culture, nostalgia for childhood, and
heritage.
Themes are presented in a variety of ways, including promotion through websites
and brochures, theme slogans in advertisements, architectural style, landscaping, events
and festivals, merchandise sold in shops, and activities and attractions. There are usually
museums and art galleries consistent with the theme. Also, guided tours, information
centers, signs, and the information provided through these methods helps to disperse
knowledge about the theme of the village (Murphy et. al, 2010).
Streetscapes and Servicescapes
Successful TSVs do not solely focus on the specialty shops and their products, but also
on the ambiance and environment both in and out of the shops. A variety of
environmental details are important in creating a successful TSV, which Murphy et. al.
(2010) break down into three categories: landscape, streetscape and servicescape.
The landscape includes factors that provide the setting for TSVs. Some
environmental aspects such as vegetation and signage may cross over into the streetscape
category. Vegetation is an important visual feature of a TSV. Important aspects of
vegetation include trees, shrubbery, grass, flowers, and open spaces. The presence of
these factors creates a positive image, and helps attract visitors (Fukahori and Kubota,
2003). Some man-made features are also desired, such as stone walls and heritage
buildings. However, because many TSV visitors travel to rural areas to escape their

24
urban way of life and seek the rural idyll, some man-made elements detract from the
visitors’ positive view of the village, including roads and power lines. In addition to
visual elements of a TSV, auditory and olfactory elements are important in creating a
pleasant village. Instead of alarms, sirens, car horns, traffic, and telephone noises, the
sounds in a TSV should be replaced with birds, moving water, and other animals.
Similarly, vehicle emission and other pollution odors should be replaced by scents of
food, herbs, flowers, and local produce (Murphy et. al., 2010).
The servicescape is possibly the most well-researched of the three settings
(landscape, servicescape, and streetscape) as the social, physical, and ambient factors that
make up this category describes the interior environment of the shops. However, the
majority of the existing literature regarding the servicescape pertains to retail settings in
general, not necessarily in TSV settings. The servicescape impacts not only visitors, but
entrepreneurs as well. Entrepreneurs may view the servicescape as factors that “can be
manipulated to encourage desirable visitor responses such as repeat visitation, increased
length of stay and increased expenditures,” (Murphy et. al., 2010, pg. 88). However,
despite evidence that suggests that customer satisfaction is valuable, Arnold et. al. (2005)
found that less than 30% of 200 firms in a study thought that their satisfaction
management increased their bottom line.
Often the exterior theme continues to the interior of the shops. A store’s internal
environment is likely to influence consumers’ moods and emotions, which affect their
purchasing intentions, patronage decisions, decision making time, willingness to buy,

25
perceived value, and consumer satisfaction (Akhter, 1994; Andreu, Bigné, Swaen, 2006;
Aubert-Gamet, 1999; Babin, 2000; Bitner, 1992). The environment in which products
are placed are just as important, if not more so, than the product themselves (Akhter,
1994). Some scholars believe that the physical attractiveness of a store has a greater
affect on consumer intentions than the quality and price of the actual products (Baker,
1994). Providing a pleasant shopping environment has become a competitive retailing
strategy (Andreu et. al, 2006; Turley and Chebat, 2002).
There are many aspects of the internal environment that impact consumers’
shopping behavior including music, color, noise, lighting, signage, layout of the store,
temperature, air quality, odor, and furnishings (Akhter, 1994; Anderson, 1983; Babin,
2000; Baker, 1994, Bitner, 1992; Chebat, 2003; Park, 2007; Yüksel, 2007). Kotler
(1974) termed the interior elements of stores ‘atmospherics,’ and divided them into four
categories: visual, aural, olfactory and tactile (softness, smoothness, temperature). Later,
Bitner (1992) coined the term servicescapes, which is generally the same as atmospherics
(Areni, 1994; Aubert-Gamet, 1999). As the atmospherics in a retail environment change,
consumers’ perceptions, behaviors and attitudes also tend to change (Turley and Chebat,
2002).
Many of the aforementioned elements of a store have been thoroughly researched
in the retail context; however, most of this research has been conducted in malls and
other urban shopping areas and has not focused on shopping in heritage villages
(Bäckström, 2006). Music has been found to influence the speed in which consumers

26
shop, the amount of time spent in the store, and the amount of money spent. The slower
the tempo, the more customers tend to linger in the store. Also, if consumers perceive the
music as favorable, their perceptions of wait times are influenced, and they find waiting
in line to be less stressful (Baker, 2002; Bitner, 1992; Yüksel, 2007). While music tends
to influence shoppers’ moods positively, other noises can have the opposite effect. In
more rural areas, mechanical/unnatural sounds are not as accepted as they are in
developed areas. Loud vehicles, tools, motorcycles, car horns, sirens, etc. can detract
from the environment and negatively affect consumers’ image of the store. Sounds such
as birds, wind, water, and other natural sounds usually have a positive effect on shoppers
(Anderson, 1983).
Lighting can also have an impact on consumer purchase behavior. Bright lights
can cause shoppers to be more aroused and influence more impulse buys, while soft
lighting is less stimulating and causes shoppers to spend more time in the store (Areni,
1994). Lighting can be so influential that there is a Lighting Handbook, which lays out
the three main goals of lighting in retail. These goals are 1) to attract the customer, 2) to
allow for evaluation of the merchandise, and 3) to facilitate completion of the sale.
Lighting can affect people’s mood and emotional state, which can influence their
purchasing behavior (Park, 2007).
Smell also plays an important role inside of stores. Different smells elicit
different feelings and emotions, which again, can affect shoppers’ purchasing behaviors
and intentions (Bitner, 1992; Chebat, 2003). Artificial smells are often used to induce

27
specific feelings in customers, depending on the store. For example, a room in the Epcot
Center in Walt Disney World smells like freshly baked chocolate chip cookies to make
visitors feel relaxed and comfortable. Bakeries have used synthetic scents to increase
sales, Dunkin’ Donuts and Starbucks infuse their shops with potent coffee smells, and
similar tactics have been utilized in Las Vegas, NV (Chebat, 2003). While these
elements have been well researched in typical retail settings, they have not been
excessively applied to TSV settings.
While the servicescape has been thoroughly researched, the importance of the
streetscape has been given less attention by researchers (Murphy et. al., 2010). It has
been well established that the atmospherics and design of store are very important, but
little research exists that explains how or why they are important (Bäckström, 2006).
This study will help to minimize this deficiency, and will focus on the streetscape of
TSVs. The streetscape is the exterior environment in a TSV; it is what the tourists are
drawn to. The exterior shopping environment is evaluated by tourists before entering the
shops, it is important that their first impression of the village is pleasing in order to draw
visitors into the shops (Bäckström, 2006; Yüksel, 2007; Frost, 2006; Murphy et. al.,
2011; Ward et. al, 1992). When the streetscape is well designed, it becomes an amenity
zone and attractive shopping area. However, sometimes the money spent to improve
streetscapes is considered a waste, often keeping the spending to a minimum (Fukahori
and Kubota, 2003). The streetscape is made up of vegetation, signage, street furniture,
water features, roadside buildings, road paving, and other aesthetic elements (Fukahori
28
and Kubota, 2003). Social, physical, and ambient factors are also included in the
streetscape.
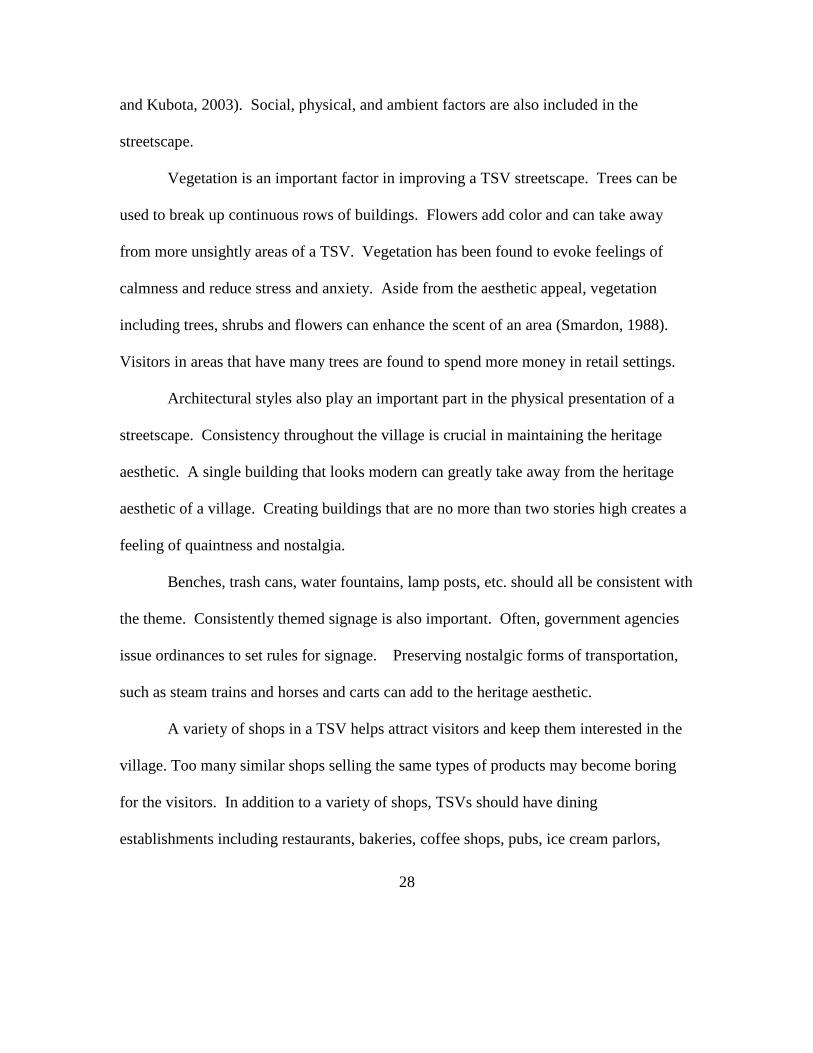
Vegetation is an important factor in improving a TSV streetscape. Trees can be
used to break up continuous rows of buildings. Flowers add color and can take away
from more unsightly areas of a TSV. Vegetation has been found to evoke feelings of
calmness and reduce stress and anxiety. Aside from the aesthetic appeal, vegetation
including trees, shrubs and flowers can enhance the scent of an area (Smardon, 1988).
Visitors in areas that have many trees are found to spend more money in retail settings.
Architectural styles also play an important part in the physical presentation of a
streetscape. Consistency throughout the village is crucial in maintaining the heritage
aesthetic. A single building that looks modern can greatly take away from the heritage
aesthetic of a village. Creating buildings that are no more than two stories high creates a
feeling of quaintness and nostalgia.
Benches, trash cans, water fountains, lamp posts, etc. should all be consistent with
the theme. Consistently themed signage is also important. Often, government agencies
issue ordinances to set rules for signage. Preserving nostalgic forms of transportation,
such as steam trains and horses and carts can add to the heritage aesthetic.
A variety of shops in a TSV helps attract visitors and keep them interested in the
village. Too many similar shops selling the same types of products may become boring
for the visitors. In addition to a variety of shops, TSVs should have dining
establishments including restaurants, bakeries, coffee shops, pubs, ice cream parlors,

29
candy stores, etc. While many vendors extend their window displays to the exterior of
the shop to lure customers, they should to be careful not to make the area look cluttered
(Yüskel, 2007). Street vendors, greeters, guides, and street performers can add to the
liveliness of the streetscape.
The design and comfort of pedestrian pathways is also an important factor in the
physical presentation of a TSV. Raised pedestrian crossways, wide walkways, and
walkways that are separated from the road add to pedestrian comfort and their perception
of their safety (Murphy et. al., 2010).

30
Table 2
Environmental and Social Cues Found in TSV Streetscapes Environmental Cues Typical Features Physical/design factors
Vegetation Well-maintained small to medium street trees with wide canopies, woody flowering perennials, bright perfumed annuals, climbers on buildings, hardy drought tolerant species, fragrant herbs
Architectural Style Heritage facades, distinct rural or ethnic styles, use of natural materials (stone and timber), use of color
Use of Space Low built forms, set back from road, separation between buildings
Store Variety Restaurants, pubs, cafes, bakeries, local produce, arts and crafts, galleries, antiques & collectibles, toy shops, boutique clothing, Christmas shops, fudge & lolly shops
Signage Small, quaint, country-style, old-style lettering, use of rustic materials. Themed entrance signage, directional signs and interpretation
Street Decoration Consistent presentation of amenities such as lamp posts, bins and seating, street art, pavement art, water features, picket fences, café-style umbrellas
Pedestrian Areas Separation from road, wide walkways, arcades, frequent crossings, consistent use of paving in natural tones to add interest and texture
Displays Prominent street and window displays of products
Water Running water, fountains, streams
Social factors
People Street theatre, music, costumed/uniformed ‘actors’
Transport Nostalgic modes of transport, stream trains, horse& cart, vintage cars, removal of modern transport and parking from main streetscape
Ambient factors
Soundscape Birdsong, livestock, running water, breeze through vegetation, street music, absence of urban noises
Olfactory Village smells, cafes, bakeries, coffee shops, fragrant flowers & herbs, smoke from log fires, absence of urban pollution
Source: Murphy et. al. (2010)

31
Table 3 Environmental Cues Found in TSV Servicescapes
Environmental Cues Typical Features Physical/design factors
Use of Space Small, narrow walkways, often cluttered with products, limited use of tall shelving
Product Variety Individual stores specialize in particular product categories, breadth of products but often one of a kind or limited number of the same product, local handcrafted products or produce
Signs & Labels Small, quaint, country-style, old-style lettering, labels often hand written, emphasis on products themselves not elaborate labeling
Displays Low to eye level displays, emphasis on showcasing products and produce with great care taken in placing products, organic rather than orderly arrangement of displays, products often not grouped
Color & Texture Earthy tones (e.g. timber, stone) or heritage schemes, walls sometimes textured (e.g. stone, timber)
Floor Coverings Hard surfaces, tiles, timber, stone, slate
Furnishings & Shelving Usually timber, sometimes glass, rarely metallic
Social factors
Hosts Traditional outfits, ethnic clothing styles or costume
Visitors Expectations are for an uncrowded experience
Ambient factors
Lighting Natural light, supplemented by warm, soft lighting schemes
Sound Quiet music, slow tempo, relaxation, classic or jazz styles, rarely pop or rock
Olfactory Coffee, baked items, confectionary, incense, handmade soaps, timber, candles
Source: Murphy et. al. (2010)

32
Almost every aspect of a successful TSV corresponds to Ritchie and Zins’ (1978)
model of general factors that determine the overall attractiveness of a tourism region.
This study will merge these two sets of concepts and attempt to study the common
characteristics of TSVs empirically with two case studies in Arizona.

33
Chapter 3
CASE STUDIES AND METHODS
This study took place in two industrial heritage villages in Arizona: Jerome and
Wickenburg. These sites were chosen based on Getz’s (1993) definition of a TSV and
because of their representativeness of industrial heritage locations in the state and
because they have become recreational shopping communities for day-trippers and
tourists.
Jerome
Jerome was settled on top of Cleopatra Hill, more than a mile above sea level, and is
known as the “City on the Move” due to the town gradually shifting down the hill. The
mine in Jerome, the United Verde Mine, was once the largest copper mine in Arizona,
and one of the richest in the west, as it produced more than a billion dollars in copper,
gold, silver and zinc (Stocker, 1976). Established in 1876, Jerome began as a tent city.
With the increasingly profitable mine, Jerome became a prosperous company town
(jeromechamber.com), and at one point during the 1870s it was the fourth largest city in
the Arizona Territory (AZJerome, 2013). The United Verde & Pacific Railway opened in
1894, allowing miners’ families to move to Jerome, greatly increasing the population
(Rodda, 1990). At its peak in the 1920s, Jerome had a population of 15,000
(jeromechamber.com, azjerome.com, Toll, 1968; Stocker, 1976). During the 1890s
Jerome burned down at least three times, which partially led to it becoming incorporated.
By incorporating Jerome, tax money would remain in the town, rather than be spent to

34
build roads outside of Jerome. It would also allow for laws to be formed prohibiting any
wooden structures built in the commercial area, and it would enable residents to form a
volunteer fire department. Jerome was incorporated on March 8, 1899, and the first
volunteer fire department was established on July 27, 1899 (Smith, 1990).
In the early 1930s during the Depression, mining slowed due to the decrease of
copper’s value (Smith, 1990). Production picked back up, only to cease forever in 1953
(Toll, 1968; Stocker, 1976; Smith, 1990; jeromechamber.com; azjerome.com). The
population decreased dramatically to about 50-100 people after the closing of the mine
(AZJerome, 2013). With the loss of mining wages, the remaining residents turned to
tourism to supplement a large portion of income. They formed the Jerome Historical
Society in an attempt to preserve Jerome and its mining history (Smith, 1990). Jerome
was designated as a National Historic District in 1967 (Smith, 1990; AZJerome, 2013;
jeromechamer.com). During the 1970s the population had increased to about 300, and
the current population is approximately 500 (jeromechamber.com; Smith, 1990).
Many of the buildings in Jerome have been standing since 1899, and have been
restored and turned into shops, restaurants, wineries, saloons, art galleries, and more.
There are more than ten eateries, nine lodging properties and many unique shops. The
hospital was turned into a large hotel, and the Douglas Mansion, home of one of the
mine’s owners, was turned into a museum in 1965 (AZJerome, 2013; Smith, 1990).
In addition to the Douglas Mansion, Jerome features the Gold King Mine and
Ghost Town. Located about one mile north of Jerome, the Gold King Mine and Ghost

35
Town is a self guided, outdoor museum. It features a blacksmith shop from about 1901,
antique gas engines, and a gift shop. The Jerome Historical Society Mine Museum is
located on Main Street and houses pictures and equipment from the United Verde Mine.
Also located near Jerome are the Cliff Castle Casino, Tuzigoot National Memorial,
Montezuma Castle, and the Verde Canyon Railroad. Jerome is located 30 miles from
Prescott, 90 miles from Phoenix, 20 miles from Sedona, and 60 miles from Flagstaff,
giving Jerome a base market of over 4,000,000 people, and an ideal location for day trips
from Phoenix (AZJerome, 2013).
Wickenburg
Henry Wickenburg came to the area that is now known as Wickenburg in the late 1800s
in search of gold. He eventually founded the Vulture Mine, which went on to produce
more than $30 million of gold, silver, and copper. Wickenburg was founded in 1864 and
incorporated in 1909 (Smith, 1964).
In 1866, Wickenburg almost became the capital of Arizona Territory, but fell
short by only two votes. The town had a difficult beginning due to many factors
including, droughts, mine closures, crime, and a major flood. From 1865 to 1880, crime
ran rampant throughout western Arizona. For example, Wells Fargo drivers were
murdered for the gold that they guarded. In 1890 there was a severe rainstorm that
caused the Hassayampa River to rage and break through the Walnut Grove Dam located
25 miles north of Wickenburg. This flood wrecked mines, ranches, and the town, and
also killed residents. During this time, the rich ore vein in the Vulture Mine was lost

36
forever. Despite these hardships, Wickenburg continued to grow. Wickenburg was once
the third largest city in Arizona Territory, and the construction of the railroad only
increased the population (Smith, 1964; Brown, n.d.). The construction of the highway
connecting Phoenix to California brought more tourists through Wickenburg.
Many of the buildings currently in Wickenburg are from the early 1900s and
house many different types of businesses. There are over 600 businesses throughout the
town, including those aimed at tourists and those for local residents, such as grocery
stores. There are 15 gift shops, one museum, antique stores, over 20 restaurants, eight
bars, four art galleries, and various other shops geared towards tourists. Wickenburg is
also known as the Dude Ranch Capital of Arizona, boasting four ranches that offer a
unique western accommodation experience. Wickenburg offers Jeep tours, self-guided
mine tours, and guided tours of the town. Located along the main street there are six
large statues, including an early 1900s school teacher, a cowboy, and a miner. Each
statue has a button, which when pushed tells a short story about Wickenburg’s history
(Brown, n.d.; Wickenburg Chamber of Commerce, n.d.).
Wickenburg has hosted an annual Gold Rush Days festival for over 60 years,
beginning in 1951 (Smith, 1964). This festival takes place over three days in February
each year, and attracts more than 100,000 visitors. Gold Rush Days features food, music,
panning for gold, a shoot out in the street, a parade, arts and crafts, and a carnival.
Wickenburg is located 54 miles from Phoenix, giving Wickenburg a base market of over
4,000,000 people, and making it an ideal location for a day trip (Brown, n.d.).

37
Methods As noted at the outset, the purpose of this study is to acquire a better understanding of the
role that streetscapes and servicescapes in TSV settings have in the experiences of
tourists, how they influence the tourists’ purchasing behavior, and their influence on the
tourists’ intent to return to the TSV.
To achieve this goal, multiple data sources were used, including observations,
questionnaires, and interviews. The utilization of multiple data-collection methods, or
triangulation, helps to eliminate personal and methodological biases, weaknesses of
single methods, and enhances the overall validity of the research findings (Decrop, 1999;
Hartmann, 1988; and Modell, 2005).
As already mentioned, this study has taken place in Jerome and Wickenburg,
Arizona. These sites were chosen for the aforementioned reasons, as they fit Getz’s
(1993) definition of a TSV and are in their own right important day-trip and tourist
destinations in the state. The researcher recorded the physical elements of the towns,
based upon the work of Murphy et al. (2010) (Tables 2 and 3). The researcher noted
which elements in the towns are consistent with Murphy et. al. (2010) and which
elements are not. The observations collected regarding the environmental elements of the
towns aided in creating the survey instrument. Participant observation is most
appropriate under certain conditions; the research question is concerned with human
meanings and interactions, it is observable in an everyday setting, the researcher is easily
able to gain access to the setting, and the research question can be effectively addressed
by qualitative data that can be gathered by direct observation (Jorgensen, 1989), which

38
are all applicable conditions in this study. Participant observation allows the researcher to
conduct observations fairly unobtrusively, observe and experience the setting, and can
play a role in recording information as it occurs (Jorgensen, 1989; Creswell, 2009). In
addition to observing the elements of the towns, the participant observations allowed the
researcher to study tourists’ purchasing behavior by observing their actions and dialogue
inside the shops.
Secondary data sources, including brochures, maps, and websites, were collected
for further analysis. These sources helped show how the towns portray themselves to
tourists, and can possibly offer insight into how shop owners view the TSVs.
Additionally, these secondary sources may reveal some discrepancies between how the
town promotes itself and what is actually there and how visitors perceive the town.
Surveys were utilized to analyze all three of the components of the research
purpose. Surveys may help researchers to gain an understanding of a particular
phenomenon, and are often used for theory testing (Modell, 2005). They can also be
utilized for theory development if the research takes on a more inductive research
approach such as this project does. The completed surveys for this study will help to
understand the case studies from the perspective of Ritchie and Zins’ (1978) model of
factors that contribute to a tourism area’s attractiveness, as well as Murphy et. al.’s
(2010) important factors of streetscapes and servicescapes. Given the confined set of
shopping opportunities and the limited access points available, the surveys were
conducted using a convenience sample. A convenience sample utilizes the most

39
accessible subjects that are willing to participate (Marshall, 1996; Teddlie and Yu, 2007).
While convenience samples have clear limitations when it comes to generalizability, they
are useful in identifying patterns and trends that can help establish theory development
and empirical cases. Lloyd et. al. (2011) conducted a study using similar variables, such
as shop environment and behavioral intentions, and found convenience sampling to be
effective.
There have been many different definitions of a ‘tourist’ through the evolution of
tourism research. In the 1970s, both a ‘tourist’ and ‘excursionist’ were defined, the
former referring to people that stay one or more nights at a destination other than home,
and the latter referring to people that are same day travelers, or what is also known as
‘day trippers.’ Additionally, the word ‘trip’ was also defined as people leaving their
place of residence and returning home. Included in this definition was a specific number
of miles away from home one needed to travel to be considered a tourist, which began at
50 miles one way, but was later changed to 100 miles one way (Hunt and Layne, 1991).
For the purpose of this study, all of the aforementioned definitions were combined to
create the definition of a visitor. This study refers to visitors as people who have traveled
outside of their home town to visit Jerome or Wickenburg. They may be overnight
visitors or day trippers, as long as they do not live or work in the TSV being studied.
Interviews were also used to analyze all of the components of the research
question. Interviews help researchers understand the lived experiences of other people
and the meanings they make of their experiences (Seidman, 2006). This type of

40
qualitative research method enables the researcher to understand the world and its human
dimensions, which in tourism are the social and cultural implications (Phillimore and
Goodson, 2004). Participants can provide historical and unobservable information that
the researcher may otherwise be unable to access (Creswell, 2009). Semi-structured and
open-ended interviews were carried out with shopkeepers to obtain a better understanding
of their perceptions of visitors’ attitudes about, and experiences with, the elements of the
streetscape and servicescape.
Upon completion of the initial site observations based on Murphy et. al.’s (2010)
elements regarding the ambiance of TSVs (Tables 2 and 3), interview and survey
questions were created. Not all of the elements identified by Murphy et. al. (2010)
applied to both Jerome and Wickenburg. The surveys were created based upon the
elements found to exist in the TSVs. Additionally, the two TSVs do not have identical
ambient elements. It is crucial that the surveys for the two towns are identical for
analytical purposes, so the common factors that were found were taken to create the
survey instrument.
The survey questions were primarily measured on a seven point Likert scale with
a neutral midpoint. Likert scales are commonly used to measure participant’s attitudes on
a subject, allowing the participants to express the direction and strength of their opinions
(Garland, 1991; Komorita, 1963). Researchers tend to prefer participants to make a
definite choice rather than choose the neutral point. It has been found that the more
points there are on a Likert scale, the less likely the participants are to choose the neutral

41
point. Scales that contain three to five points tend to result in 20% neutral responses,
while scales that have seven or more points may result in around 7% neutral responses.
Likert scales with only four points and no midpoint have a tendency to push people to
respond on the positive side, which may not necessarily be their true opinions. While it
has been concluded that the more points that are included in a Likert scale may produce
more accurate results, it is still up for debate whether or not it is beneficial to include a
neutral midpoint (Garland, 1991).
The interview questions were more general than the survey questions, and were
made up of open ended questions. There were guiding questions, but the interviewees
were able to discuss any topic they found relevant to the study. The results of these
interviews aided in the creation of the survey questions, as what the business owners see
as important factors to the TSV were not identical to the researcher’s primary
observations and Murphy et. al.’s (2010) TSV factors. The initial observations found
many of the original factors in Murphy et. al.’s (2010) research to exist in the towns.
New tables were created to fit Jerome and Wickenburg (Tables 4 and 5). The interviews
with the employees in Jerome and Wickenburg also helped to adjust Murphy et. al.’s
(2010) streetscape and servicescape tables.
Data Collection and Analysis
Initial observations were collected by the researcher in each town. The researcher
utilized Murphy et. al.’s (2010) lists of important factors of the streetscape and
servicescape in TSVs. The researcher wrote down whether or not the factors existed in
42
the towns’ streetscapes and servicescapes, and noted specific details about each factor.
This information was then reviewed to find common themes.
Brochures and websites were analyzed for Jerome and Wickenburg. The data was
thoroughly read through and organized into different categories based on the frequency of
certain words in the documents This resulted in the formation of multiple categories:
activities/attractions, history, directions/addresses/phone numbers, events, businesses,
accommodations and nearby attractions.
Interviews were conducted in both Jerome and Wickenburg on two occasions per
town. The interviews were done with employees of various shops located throughout the
town. In total, 15 interviews were completed in each community. Random visits by the
researcher were made to places such as restaurants, bars, wineries, antique stores, gift
shops, museums, lodging properties, and art galleries, and talked with employees that
were willing to participate. They were assured that the interviews would be kept
completely anonymous. Each interview lasted from five to 20 minutes, as some
participants were much more willing to talk than others. Some participants were very
hesitant to answer questions. The results of these interviews were transcribed by the
researcher so that they could be reviewed for themes. The main purpose of the interviews
was to aid in the creation of the survey instrument.
The surveys were collected during multiple visits to Jerome and Wickenburg.
Sixty-five surveys were collected from each town. Participants were selected based on a
convenience sample. Visitors who were at least 18 years of age and did not live or work

43
in the town were asked to complete a survey. Visitors were informed that their answers
would be completely anonymous and that participation was fully voluntary and they
could withdraw at any time. Of the 130 participants, none of them withdrew from the
study. The response rate for Jerome was 78.3% and 80.2% for Wickenburg.
Upon completion of the data collection, the surveys were reviewed and coded to
allow the qualitative data to be entered into the statistical computer program, SPSS. The
responses to the open ended qualitative question, which was number five regarding
participants main purpose for their visit, were divided into 12 codes. These codes were
created based upon the frequency of key words in the responses such as art, museums,
and shops. The rest of the questions, both qualitative and quantitative, were assigned a
number so they could be entered into SPSS. The raw data were first entered into
Microsoft Excel into two separate worksheets, one for Jerome’s data and one for
Wickenburg’s data. The Excel worksheets were then transferred into SPSS. Before
running statistical tests, the data frequencies and descriptive data were obtained. This
was done for both towns’ socio-demographics, travel behavior and preferences, as well as
the responses to the questions regarding experience, intent to return to the town and
purchasing behavior.
Participants were asked to fill in their exact age; it was not based on a scale.
However, for analytical purposes, ages were grouped together in ten year intervals.
Participants were asked to check all that apply when describing their employment status.
Multiple people checked off that they were both employed and a student. The options

44
given were full time student, part time student, employed part time and employed full
time. Given the many different combinations, the responses were simply grouped into
student only, employed only, and student and employed. Respondents were given seven
choices when choosing their income. The highest three choices, $100,001-$125,000,
$125,001- $150,000, and more than $150,000 were combined into a group called more
than $100,000 due to their low response rates.
Before asking respondents about their current experience in Jerome and
Wickenburg in regards to the streetscape, servicescape and infrastructure, they were
asked about their travel behavior and preferences. The first seven questions made up this
portion of the survey. Participants were asked about their overall satisfaction with their
current visit, how long they planned on staying in town, how they learned about the town,
how likely they are to return within the next 12 months, the main purpose for their visit,
which activities they had participated in and how many times they had previously visited.
Responses to the question regarding overall satisfaction with the current visit
were scored on a seven point Likert scale, ranging from extremely dissatisfied, very
dissatisfied, dissatisfied, neither satisfied or dissatisfied, very satisfied and extremely
satisfied. These categories were ranked from one to seven, one being extremely
dissatisfied and seven being extremely satisfied. For analyzing purposes, the categories
were condensed from seven to five, resulting in extremely/very dissatisfied (Ex/V Dis),
dissatisfied, neutral, satisfied and very satisfied/extremely satisfied (V/Ex Sat). The
categories that were combined were done so due to the similarity in their meanings.
45
Participants were asked questions pertaining to the streetscape, the servicescape
and the infrastructure. These questions were asked three different times as they were
applied to the different parts of the research question: overall experience, intention to
return and purchasing behavior. The frequencies of these responses were grouped
together by streetscape as it applies to each portion of the research question, streetscape
as it applies to the research question, and infrastructure as it applies to the research
question.
Questions about the streetscape, servicescape and infrastructure were scored on a
seven point Likert scale ranging from strongly disagree, disagree, slightly disagree,
neither agree nor disagree, slightly agree, agree and strongly agree. These categories
were ranked from one to seven, one being strongly disagree and seven being strongly
agree. For analyzing purposes, the categories were condensed from seven to five,
resulting in strongly disagree/disagree (SD/D), slightly disagree (SLD), Neutral (N),
slightly agree (SLA), and agree/strongly agree (A/SA). The categories that were
combined were done so due to the similarity in their meanings.
Multiple regression analysis was performed using SPSS. Multiple tests were run
using different dependent and independent variables. The dependent variables were
satisfaction with current visit, length of stay and frequency of visits. Each of the
dependent variables was paired with a set of constant socio-demographic independent
variables: age, education, income and gender. Additionally, each dependent variable was
tested with streetscape overall experience, streetscape intent to return, streetscape

46
purchasing behavior, servicescape overall experience, servicescape intent to return,
servicescape purchasing behavior, infrastructure overall experience, infrastructure intent
to return, and infrastructure purchasing behavior. Each town’s data were analyzed with
27 tests to determine if there were any significant cause and effect relationships. The
tables showing the significant models (Appendix) will be discussed in Chapter 4.

47
Chapter 4
FINDINGS AND INTERPRETATIONS
During interview visits, the researcher collected brochures from each town.
These brochures were content analyzed for recurrent themes. The brochures and
websites were found to offer valid information that can be useful to visitors before and
during their trip. The websites for Jerome and Wickenburg offer a brief history of the
town, accommodation information, what shops and restaurants are located in the towns,
local and nearby attractions, as well as current and future events. The websites also
present pictures of the towns and their surroundings. Many of the pictures provided show
some aspects of the streetscape, including the signage on the buildings, historic buildings,
public areas and landscaping. Other than photos of the exterior of some shops, there is
not much information provided about the servicescape. There does not seem to be any
falsified information, and the towns appear to represent themselves appropriately. The
brochures’ main purpose for this study was to list the activities available to visitors in
each town. These activities were then listed in the visitor surveys.
The common factors found in the interviews from Jerome were that there is not
enough parking available, traffic congestion is often a problem, products being unique to
Jerome are important to visitors, the display of products and the layout of the stores are
the most significant factors of the streetscape and servicescape. The interviews
conducted in Wickenburg found the traffic driving through the town to sometimes detract
from the historic ambience of the town; however, this is not as common as it used to be

48
now that an alternate bypass road was recently constructed. Another aspect of the town
that sometimes takes away from the historical ambience is the presence of some buildings
and a gas station immediately next to the main street in Wickenburg that do not have a
heritage façade. These structures are located directly next to other buildings that fit the
old west theme, making them stand out. While parking is not usually an issue in
Wickenburg, aside from during special events, important elements of the servicescape are
the same as in Jerome, according to employees. Visitors and employees agree about
some aspects of the streetscape and servicescape; it was found that parking and the
amount of traffic are important to visitors. Product displays influenced visitors’
purchasing behavior. Additionally, architecture and historic buildings had a statistically
significant effect on visitors’ overall experience and intent to return.
The parking and traffic situation differ significantly between Jerome and
Wickenburg. During interviews in Jerome, the most common complaint about the town
was the lack of parking. They noted that it has been an issue for a while, and that some
businesses have lost customers due to the lack of parking. Also, on weekends or when
there is a special event, the traffic through the town can be an issue as well. In
Wickenburg, the main complaint about traffic was that there can be a lot of cars driving
through the town to get to another destination, sometimes causing a hassle for people
who actually want to visit historic Wickenburg. In either scenario, it is apparent that the
accessibility of the region, which is a category on Ritchie and Zins’ (1978) model, is
important to both employees and tourists.

49
The key points taken from the interviews were that parking and traffic can cause
problems for both employees and tourists and that buildings that do not follow the
heritage theme can greatly take away from the historic ambience. These two items
adhere to Murphy et. al’s (2010) research, which states that modern transportation on the
main roads in TSVs can take away from the experience, and that buildings incongruent
with the rest of the TSV’s theme can have a similar effect.
While the specific details of each town are not identical, factors that were found
to exist and not exist were the same. These include vegetation, architectural styles, store
variety, signage, street decorations, pedestrian areas, displays, product variety, signs and
labels, color and texture and furnishings. Factors not found to exist are use of space,
water, people, transport, soundscape, olfactory, floor coverings, hosts, visitors, and
lighting. These findings were used to adjust Murphy et. al.’s (2010) tables to fit Jerome
and Wickenburg’s streetscapes and servicescapes (Appendix A).
While the socio-demographic information is not identical between the two towns,
each category’s breakdown is similar. There were slightly more female participants, but
the distribution was about even. Therefore, this study is representative of gender. The
age group 21-30 had the most respondents in Jerome and Wickenburg, and only about
16% were over 60. However, this study was conducted in the spring, so it is a possibility
that older people do not visit during this time and there may be a seasonal bias. In
Arizona, the population of seniors increases dramatically during the winter months.
Almost half of the respondents had a Bachelor’s degree or higher in both towns. More

50
than half of the participants said that they were employed only, and more than half of the
participants in both towns identified as being white. In Jerome, 35.4% of people said
they made $25,001-$50,000 and 35.4% said they made $50,001- $75,000. In
Wickenburg, 33.8% of people said they made $50,001-$75,000 in the last year (Appendix
C).
One third of participants were satisfied with their visit, and almost two thirds were
either very satisfied or extremely satisfied with their visit. No one was extremely or very
dissatisfied, and only one person said they were dissatisfied in Wickenburg. This may
have been the person who said that their main purpose for visiting was for a funeral
(Appendix C).
Almost half of the participants planned in the TSV 3-5 hours. None said they
were staying for less than one hour, and almost one third said they were staying for more
than five hours, making these locations daytrip destinations, which corresponds with
previous research (Murphy et. al., (2010). In Jerome, 18.5% of people said they planned
to stay for more than one day, while in Wickenburg this number was only 6.2%
(Appendix C).
Most people learned about Wickenburg through friends or relatives. Over 75% of
people said that they learned about it through friends or relatives, or word of mouth. The
next most popular choice for this question was books, then other sources, films and lastly
by travel agents. For Jerome, while the frequencies per category differ slightly from
Wickenburg, the order is exactly the same (Appendix C).

51
The main purpose for visiting the towns was pretty evenly disbursed. The most
common purpose for visiting Wickenburg was friends and relatives, which could be
interpreted as a visit to a friend or relative or a trip with a friend or relative. Shopping
was the next most common answer. This supports the ‘Shopping and Commercial
Facilities” portion of Ritchie and Zins’ (1978) model of factors that improve a tourism
area. Art, personal/work/school, and driving through all scored the same. Next was for
historic learning/experience, then a daytrip or staycation. Museums, sightseeing and no
specific reason were ranked the same. Winery/restaurant was next, and ghost town
experience came in last with no responses. The main purpose for visiting Jerome
differed from that of Wickenburg. The most common reason was the ghost town
experience, followed by shopping. Art and driving through ranked third with the same
number of responses. Daytrip/staycation and sightseeing were next and also ranked the
same. Next was sightseeing and friends or relatives, which were scored the same.
Lastly, museums, historic learning/experience, personal/work/school and no specific
reason were all the least frequent and were the same (Appendix C).
Respondents were asked to choose all of the activities that they have participated
in. The number of responses for this question was different for each town, but they both
had the same top three responses. Museum/gallery, restaurant/café, and shopping were
all chosen by more than 70% of participants. In Wickenburg, restaurants came in first,
followed by museum/gallery and shopping which were ranked the same, followed by
sightseeing, bar/saloon, winery and other. In Jerome, restaurants were first, followed by

52
shopping, museum/gallery, sightseeing, bar/saloon, winery and other. Restaurants fall
into Ritchie and Zins’ (1978) category of “Infrastructure of the Region,” museums and
galleries fit into “Cultural and Social Characteristics,” and again, shopping supports the
model here as it did in the visitors’ main purpose for their trip (Appendix C).
Forty-six percent of participants in Jerome had never been there before, and
33.8% in Wickenburg said it was their first visit. More than half of the participants were
repeat visitors, with 6.2% in each town having visited seven or more times. Sixty-seven
percent of respondents in Jerome, and 72.3% in Wickenburg, said they were likely or
very likely to return within the next 12 months. Murphy et. al. (2011) did a study that
found 42.6% of participants were planning on returning to the village within the
following 12 months, which is a significantly lower percentage than what was found in
Jerome and Wickenburg. However, Murphy et. Al. did find that almost half of
participants were planning on returning, which is a considerable portion of visitors. The
difference between this study and Murphy et. al.’s (2011) study could be due to the
locations in which the studies were conducted, the distance the tourists had to travel to
visit the village or the visitors that were surveyed. Yüskel (2007) noted that due to the
entertainment and novelty value of the TSV setting, visitors were very likely to return
(Appendix C).
Respondents were asked to choose all of the information sources they used when
planning their trips. For Wickenburg, the internet was the most chosen answer, followed
by friends and family, previous trips, guidebooks and then locals. Magazines, films and

53
other sources were next and were scored the same. Travel agents and Chamber of
Commerce/Tourism Bureau came in last with no responses. For Jerome, the internet was
most frequent, followed by friends and family, previous trips, guidebooks then
magazines. Films, locals and other sources were next with the same ranking. Travel
agents and Chamber of Commerce/Tourism Bureau came in last with no responses
(Appendix C).
Landscaping rated between slightly agree and agree as being important to the
visitor’s trip. Landscaping and vegetation fall into Ritchie and Zins’ (1978) model into
the “Natural Beauty and Climate” category. Additionally, architecture, which falls into
the “Cultural and Social Characteristics” category, was rated as agree or slightly higher
than that, making it very important to visitors. Again, shopping proves to be important.
Store variety scored in between agree and strongly agree.
The following findings apply to the first research question: how do streetscapes
affect tourists’ overall experience, intent to return and purchasing behavior.
Architecture/historic buildings, variety of stores and cleanliness of public areas were the
most important items to visitors for their overall streetscape experience. For their intent
to return and streetscape experience, architecture/historic buildings, variety of stores and
well maintained public spaces were the most important. For purchasing behavior, the
most important factors were variety of stores, signage and street and window displays.
Streetscape experience in all three categories averaged a response of 6, which was ‘agree’
on the surveys, meaning that the streetscape is important to visitors (Appendix D).

54
These findings apply to the second part of the research question: how do
servicescapes affect tourists’ overall experience, intent to return and purchasing behavior.
For their overall experience, architectural/artistic merit, visual appeal, and overall
ambiance were the most important factors for both TSVs. Architectural/artistic merit,
range of products and visual appeal were the most important items for visitors’ intent to
return. Alluring colors, product displays, range of products, signs and windows and
visual appeal were all very important for visitors’ purchasing behavior. Like the
streetscape experience, the servicescape experience in all three categories averaged a
response of about 6, meaning the servicescape is important to visitors (Appendix D).
In addition to the importance of the streetscape and servicescape, it was found that
the ease of navigation through the town was very important to visitors in both towns
(Appendix J and M), which was also found as significant in Murphy et. al.’s (2011)
study.
Murphy et. al. (2011) conducted a study in which visitors ranked different items
on their importance to their experience in a TSV. Some of the items in that study are
congruent with the current study, including cleanliness of the shops (termed ‘cleanliness
of public areas’ in this study), regionally distinctive products (noted by employees as
important), variety of products and window displays. These items all scored over 4 out
of 5, five being the highest, in Murphy et. al.’s study. Additionally, Murphy et. al. (2011)
found the ease of parking, ease of navigating through the town, heritage buildings and
variety of shops to be essential for attracting visitors.

55
Upon running multiple regression analysis and controlling for socio-demographic
variables, some surprising relationships were revealed. While these relationships were
not the primary purpose of the study, they were found to be significant and need to be
discussed. Models 1-10 explain the significant relationships for Jerome. Model 1
explains 7% of variance in frequency of visits (R² = .007) while controlling for
streetscape experience, age, education, income and gender. Model 2 explains 11.9% of
variance in satisfaction (R² = .119) while controlling for servicescape experience, age,
education, income and gender. The remaining models are all interpreted in the same
manner.
Tables 15-23 (Appendix E) show which models had significant factors for the
town of Jerome. Table 15 shows that gender, when applied with servicescape experience,
has a positive correlation with satisfaction with the current visit. This means that females
ranked their satisfaction with Jerome higher than males when servicescape experience is
taken into account. All of the tables, 15-23, show that age has a positive correlation with
the frequency of visits when it was applied to streetscape overall experience, streetscape
intent to return, streetscape purchasing behavior, servicescape overall experience,
servicescape intent to return, servicescape purchasing behavior, infrastructure overall
experience, infrastructure intent to return, and infrastructure purchasing behavior. This
indicates that as age increases, so does the number of visits to Jerome. None of the other
dependent variables, with the exception of satisfaction, mentioned above had any
statistical significance.

56
Models 11-30 explain the significant relationships for Wickenburg. Model 11
explains 44.8% of variance in satisfaction (R² = .448), while controlling for streetscape
experience, age, education, income and gender. Like the models for Jerome, the
remaining models for Wickenburg are interpreted in the same way, and can be found in
the appendix.
Tables 24-32 (Appendix E) show the significant factors for Wickenburg. Only
two factors were significant for the dependent variable, frequency of visits, which were
servicescape experience and streetscape intent to return. This indicates that the higher the
ratings for these two independent variables, the more frequently the participants visit
Wickenburg. Similarly, streetscape experience, servicescape experience, streetscape
intent to return and servicescape purchasing behavior were all significantly, positively
correlated to satisfaction with the current visit. This indicates that the higher the rating in
these categories, the higher the visitor satisfaction with their visit to Wickenburg. Gender
is a significant factor in each model for satisfaction of current visit and length of stay. It
is positively correlated to each dependent variable for every model, meaning females
rated their satisfaction higher than males, and they planned to spend more time in town
than males.

57
Chapter 5
CONCLUSIONS
This study surveyed visitors to two TSVs in Arizona. The purpose was to find out
what, if any, importance the streetscape and servicescape have on visitors’ experiences
with the town, their intent to return to the town and their purchasing behavior while in the
town. It was found that streetscapes and servicescapes are influential in visitors’
experiences in TSVs. Certain factors were more important than others, but they were the
same in both towns.
Conceptual Implications
This study adds to the current literature on TSVs and streetscapes and
servicescapes as there is a limited amount of information available that goes beyond
listing ambient factors found in TSVs. To date, most of the scholarly information
available describes the ambient factors of a TSV and does not attempt to identify their
importance for tourists. It is important to determine which elements make a TSV more
attractive in the eyes of a tourist. This study may serve as a stepping platform for future
research.
This study has validated previous research on TSV environments (Murphy et. al.,
2010; Murphy et. al., 2011). Many of the factors that have been understood to be
important in a TSV setting have been confirmed in this study. Similar to Murphy et. al.
(2011), this study puts a value on the level of importance each factor holds to visitors.
However, the current study utilized different factors than Murphy et. al. (2011), and they

58
were applied to visitors’ overall experience, intent to return and purchasing behavior.
This study used a modified model based on Murphy et. al.’s (2010) important factors of a
TSV (Tables 2 and 3). It was modified according to the initial observations and
interviews conducted for this study, which resulted in new models appropriate for Jerome
and Wickenburg (Tables 4 and 5). This research will allow future studies to be
conducted to further validate these findings in other locations.
Additionally, this study focused on the tourists’ perspective of TSVs and how
certain feature influence their overall experience, intent to return to the TSV and their
purchasing behavior while in the TSV. Due to the demand perspective provided, the
findings from this study have economic implications for TSVs. The findings will help to
identify what should be enhanced or emphasized in the village in order to increase visitor
spending.
This study also validates the statement that historic settings and shopping go hand
in hand (Getz, 1993), which also confirms two of the elements on Ritchie and Zins’
(1978) model, ‘culture and social characteristics’ and ‘shopping and commercial
facilities.’ Knowing that this applies to modern TSVs, more research can be done
utilizing these models.
Real World Recommendations
The most influential factors relating to visitors’ overall experience and intent to
return were architecture, store variety, range of products, parking, ease of navigation
through the town, visual appeal, well maintained public spaces and cleanliness. Making

59
certain that these items are updated and kept to what the visitors want can help to increase
the amount of return visitors.
Architecture was important to visitors in both Jerome and Wickenburg, and is a
major attraction for many visitors. City officials, preservation societies and shopkeepers
can work together to create a set of standards that should be applied to all of the buildings
in the village, and ensure that each building meets these standards.
Making sure that there are not too many of the same types of shops in town will
help attract repeat visitors. If there are many similar stores, shopkeepers may possibly
work together to spread out the variety of products they offer so that each store does
differ from the rest, as range of products was also important to visitors’ experience and
intent to return.
Parking was an issue for both employees and visitors in Jerome, and during
special events in Wickenburg. It was noted in Jerome during the interviews that some
businesses have lost customers due to the parking situation. While it may not be possible
to add parking space, it is worth reevaluating it to see if there is a feasible solution.
Ease of navigation through the town was important in both locations.
Additionally, Murphy et. al. (2011) came to the same conclusion. To aid in visitors’
navigation, signs, maps, arrows and information booths would be beneficial.
Visual appeal was important to visitors’ overall experience and intent to return.
Further studies should focus on exactly what visitors find visually appealing in TSVs and
make any necessary changes in the villages.

60
Well maintained public spaces and cleanliness of public areas were both found to
be important in this study as well as in Murphy et. al.’s (2011) study. The towns may
hire someone to maintain the cleanliness on the streets, in the parking lots and in the
recreational areas. Also, shopkeepers should make sure the interior of the stores are kept
clean and orderly.
The most influential factors on visitors’ purchasing behavior are variety of stores,
range of products, easy to navigate through town, signage, street and window displays,
product displays, and alluring colors. Maintaining these factors can be financially
beneficial to shop owners as they may entice people to spend more money.
Varieties of stores, range of products and ease of navigation through the town
have already been discussed, and their implications are the same for purchasing behavior.
Stores should feature clear signage both inside and outside of the shops so visitors
know what kinds of products are available in the store, pricing information, and any other
relevant information about the products, such as if it was made locally.
Street and window displays should be visually appealing and show the products
that the store offers. Similarly, product displays within the shop should also be visually
appealing. The products should be easy to see, within reach (no tall shelving), be neat
and organized, and be labeled with the prices and other information about the products.
Further studies should be conducted to find out exactly what about product displays in
TSVs is visually appealing to visitors.

61
Alluring colors was significant to visitors’ purchasing behavior. Additional
studies should be conducted to determine which colors bring about certain feelings, and
where they should be placed in TSV shops in order to encourage people to spend more
money.
Additionally, it was found that gender has a significant relationship with visitors’
overall satisfaction, and age has a positive correlation to the frequency of visits to
Jerome. The overall satisfaction with Wickenburg’s streetscape and people’s intent to
return based on the servicescape has a positive correlation with the frequency of visits.
The higher visitors rated the servicescape and streetscape, the higher they rated their
satisfaction with the town. Gender is a positive factor in Wickenburg. Females rated
their satisfaction higher and planned on spending more time in the town. By finding out
what each age group and gender group’s preferences are, marketing managers can better
serve these market segments.
Word of mouth was the most common way that participants heard about the
TSVs. This has implications for marketing managers, and gives them the opportunity to
increase visitor traffic through town. Marketing managers should assure that visitors are
receiving correct and thorough information about the town. Shopkeepers can ensure that
visitors are receiving a consistently good experience so that they tell their friends and
family about it. People are more likely to tell others about a bad experience, so it is
imperative that visitors do not have a negative experience in the TSVs. Also, social
media should be utilized to spread the word of the towns and their activities.

62
There were several participants that said they found the town by accident, were
driving through and decided to stop or were brought there for a reason other than tourism.
These participants can be categorized as incidental visitors, and marketing managers
should find a way to appeal to them.
The majority of respondents said that they participated in multiple activities
during their visit. Town officials and shopkeepers should work together to ensure there is
always a variety of activities available to visitors. Murphy et. al. (2010) stated that it is
better for TSVs to have more than one anchor attraction to attract more visitors.
More than half of the respondents were repeat visitors. The local CVBs should
offer a newsletter or email club to visitors to keep them informed of any local events,
new shop openings, etc. to entice people to come back.
Only 18% of participants in Jerome and 6% in Wickenburg were planning to
spend the night. There is a great opportunity to increase overnight visits in these towns.
Owners of lodging properties should push their advertising and possibly use social media
networks as a platform to do so. These owners may partner with other businesses and
tourism officials to offer incentives to visitors that spend the night.
The internet was the most common tool used for trip planning. Tourism officials
should make sure that the information presented to potential visitors is always correct and
thorough. The websites should advertise upcoming events, new store openings, etc.
The Chamber of Commerce and Tourism Bureau were not utilized by any
participants when planning their trip. These offices may use social media to reach

63
potential visitors, particularly younger people. As the internet was the most popular way
to plan a trip, and social media is incredibly common, this would be beneficial to let
people know what they offer.
Limitations/Future Research
This study is not without its limitations. Future studies should attempt to validate
these findings. This study assumes that respondents answered the survey questions
honestly, accurately and without any biases. It is possible that survey questions were
interpreted differently by different participants. Furthermore, this study is not
representative of age. It should be repeated during the winter months to see if there is a
difference in visitors’ age, and if so, if there is a difference in their responses.
Future studies may be more heavily qualitative in nature. By doing more in depth
interviews and adding more open ended questions to visitor surveys, it is likely that new
information will be discovered. In depth surveys with the employees and shop owners
can give more information about the supply side of TSVs. A look at how TSVs are
portrayed in guidebooks, magazines and other print media compared to how the town
portrays itself and visitors’ opinions of the TSV would also offer new insight.
Additionally, ethnography may shed new light on the TSVs.
This study was only conducted in two towns in one southwestern state in the
United States, and the results did vary between the two towns. It is possible that answers
will be different in every town since none of them are identical in their history and

64
activities offered. While the findings may only specifically relate to Jerome and
Wickenburg, they may still have implications for similar sites.
Also, the sample size for this study is rather small with a total of 130 surveys and
30 interviews. Additional studies that replicate the current study with larger sample sizes
would be beneficial in helping to validate the findings of this study.

65
REFERENCES
Akhter, S. D., Andrews, J.C. and Durvasula, S. (1994) The influence of retail store environment on brand-related judgments. Journal of Retailing and Consumer Services, 1 (2): 67-76. Anderson, L.M., Mulligan, B.E., Goodman, L.S. and Regen, H.Z. (1983) Effects of sounds on preferences for outdoor settings. Environment and Behavior, 15 (5): 539-566. Antonio, R. J. and Bonanno, A. (2000) A new global capitalism? From “Americanism and Fordism” to “Americanism-Globalization.” American Studies, 41 (2/3): 33-77. Apostolakis, A. (2003) The convergence in heritage tourism. Annals of Tourism Research, 30 (4): 795-812. Areni, C.S and Kim, D. (1994) The influence of in-store lighting on consumers’ examination of merchandise in a wine store. International Journal of Research in Marketing, 11: 117-125. Arnold, M.J, Reynolds, K.E., Ponder, N and Lueg, J.E. (2005) Customer delight in a retail context: Investigating delightful and terrible shopping experiences. Journal of Business Research, 58: 1132-1145. Andreu, L., Bigné, E., Chumpitaz, R. and Swaen, V. (2006) How does the perceived retail environment influence consumers’ emotional experience? Evidence from two retail settings. International Review of Retail, Distribution and Consumer Research, 16 (5); 559-578. Arizona Mining Association (2013) Arizona mining association: Minerals make it possible. Retrieved from http://www.azmining.com/ Aubert-Gamet, V. and Cova, B. (1999) Servicescapes: From modern non-places to postmodern common places. Journal of Business Research, 44: 37-45. AZJerome (2013) Jerome, Arizona. Retrieved from http://www.azjerome.com/jerome/ Babin, B.J. and Attaway, J.S. (2000) Atmospheric affect as a tool for creating value and gaining share of customer. Journal of Business Research, 49: 91-99. Baker, J., Grewal, D. and Parasuraman, A. (1994) The influence of store environment on quality inferences and store image. Journal of the Academy of Marketing Science, 22 (4): 328-339.

66
Baker, J., Parasuraman, A., Grewal, D. and Voss, G.B. (2002) The influence of multiple store environment cues on perceived merchandise value and patronage intentions. Journal of Marketing, 66 (2): 120-141. Bäckström, K. (2006) Understanding recreational shopping: A new approach. International Review of Retail, 16 (2): 143-158. Bell, D. (1976) The coming of the post-industrial society. The Educational Forum, 40 (4): 574-579. Bitner, M.J. (1992) The impact of physical surroundings on customers and employees. Journal of Marketing, 56 (2): 57-71. Brown, A. (n.d.) Town of Wickenburg, AZ. Retrieved from http://www.ci.wickenburg.az.us/ Caton, K. and Santos, C. A. (2007) Heritage tourism on Route 66: Deconstructing nostalgia. Journal of Travel Research, 45 (4): 371-386. Chebat, J.C. and Michon, R. (2003) Impact of ambient odors on mall shoppers’ emotions, cognition, and spending: A test of competitive casual theories. Journal of Business Research, 56: 529-539. Chhabra, D., Healy, R. and Sills, E. (2003) Staged authenticity and heritage tourism. Annals of Tourism Research, 30(3): 702-719. Clarke, S. (1990) What in the F---‘s name is Fordism? British Sociological Association Conference. Creswell, J. W. (2009) Research Design: Qualitative, Quantitative, and Mixed Methods Approaches. Thousand Oaks, CA: Sage Publications. Daugstad, K. (2008) Negotiating landscape in rural tourism. Annals of Tourism Research, 35 (2): 402-426. Decrop, A. (1999) Triangulation in qualitative tourism research. Tourism Management, 20 (1): 157-161. Frost, W. (2006) From diggers to baristsas: Tourist shopping villages in the Victorian goldfields. Journal of Hospitality and Tourism Management, 13 (2): 136-143.

67
Fukahori, K. and Kubota, Y. (2005) The role of design elements on the cost-effectiveness of streetscape improvement. Landscape and Urban Planning, 63 (2): 75-91. Garland, R. (1991) The mid-point on a rating scale: Is it desireable? Marketing Bulletin, 3:66-70. Getz, D. (1993) Tourist shopping villages: Development and planning strategies. Tourism Management, 14 (1): 15-26. Goeldner, C. R. and Ritchie, J.R.B. (2009) Tourism: Principles, Practices, Philosophies. Hoboken, NJ: John Wiley & Sons, Inc. Goss, J. (1993) The ‘magic of the mall’: An analysis of form, function, and meaning in the contemporary retail built environment. Annals of the Association of American Geographers, 83 (1): 18-47. Hartmann, R. (1988) Combining field methods in tourism research. Annals of Tourism Research, 15 (1): 88-105. Hunt, J.D. and Layne, D. (1991) Evolution of travel and tourism terminology and definitions. Journal of Travel Research, 29 (4): 7-11. Ioannides, D. and Debbage, K. (1997) Post-Fordism and flexibility: The travel industry polyglot. Tourism Management, 18 (4): 229-241. Jeromechamber.com Jorgensen, D. L. (1989) Participant Observation: A Methodology for Human Studies. Thousand Oaks, CA: Sage Publications. Komorita, S. S. (1963) Attitude content, intensity, and the neutral point on a Likert scale. The Journal of Social Psychology, 61(2): 327-334. Kotler, P. (1974) Atmospherics as a marketing tool. Journal of Retailing, 49 (4): 48-64. Lehto, X. Y., Cai, L. A., O’Leary, J. T., and Huan, T. C. (2004) Tourist shopping preferences and expenditure behaviours: The case of the Taiwanese outbound market. Journal of Vacation Marketing, 10 (4): 320-332. Lew, A. A. (1989) Authenticity and sense of place in the tourism development experience of older retail districts. Journal of Travel Research, 27 (4): 15-22.

68
Littrell, M.A., Baizerman, S., Kean, R., Gahring, S., Niemeyer, S., Reilly, R., and Stout, J. (1994) Souvenirs and tourism styles. Journal of Travel Research, 33 (3): 3-11. Litvin, S. W. (2005) Streetscape improvements in an historic tourist city a second visit to King Street, Charleston, South Carolina. Tourism Management, 26 (3): 421-429. Lloyd, A. E., Yip, L. S. C., and Luk, S. T. K. (2011) An examination of the differences in retail service evaluation between domestic and tourist shoppers in Hong Kong. Tourism Management, 32 (3): 520-533. Marshall, M. N. (1996) Sampling for qualitative research. Family Practice, 13 (6): 522-526. McKercher, B. and Chan, A. (2005) How special is special interest tourism? Journal of Travel Research, 44(1): 21-31. Mitchell, C.J.A. (1998) Entrepreneurialism, commodification and creative destruction: A model of post-modern community development. Journal of rural Studies, 14 (3): 273-286. Modell, S. (2205) Triangulation between case study and survey methods in management accounting research: An assessment of validity implications. Management Accounting Research, 16 (2): 231-254. Moscardo, G. (2004) Shopping as a destination attraction: An empirical examination of the role of shopping in tourists’ destination choice and experience. Journal of Vacation Marketing, 10 (4): 294-307. Murphy, L., Pearce, P., Benckendorff, P., and Moscardo, G. (2008) Tourist shopping villages: Challenges and issues in developing regional tourism. CAUTHE 2008 Conference: Where the Bloody Hell are We? Murphy, L., Benckendorff, P., Moscardo, G., and Pearce, P.L. (2010). Tourist Shopping Villages: Forms and Functions. New York, NY: Routledge. Murphy, L., Moscardo, G., Benckendorff, P., and Pearce, P. (2011) Evaluating tourist satisfaction with the retail experience in a typical tourist shopping village. Journal of Retailing and Consumer Services, 18: 302-310. Park, H.Y. (2010) Heritage tourism: Emotional journeys into nationhood. Annals of Tourism Research, 37 (1): 116-135.

69
Park, N.K. and Farr, C.A. (2007) The effects of lighting on consumers’ emotions and behavioral intentions in a retail environment: A cross-cultural comparison. Journal of Interior Design, 33 (1): 17-32. Phillimore, J. and Goodson, L. (2004) Progress in qualitative research in tourism: Epistemology, ontology and methodology. In J. Phillimore and L. Goodson (eds.) Qualitative Research in Tourism: Ontologies, Epistemologies and Methodologies (pp. 3-29). New York, NY: Routledge. Prideaux, B. R. and Kininmont, L.J. (1999) Tourism and heritage are not strangers: A study of opportunities for rural heritage museums to maximize tourism visitation. Journal of Travel Research, 37: 299-303. Richards, G. (2007) Introduction: Global trends in cultural tourism. In G. Richards (ed.) Cultural Tourism: Global and Local Perspectives (pp.1-9). Binghamton, NY: The Hawthorn Press Inc. Ritchie, J.R.B. and Zins, M. (1978) Culture as determinant of the attractiveness of a tourism region. Annals of Tourism Research, V (2): 252-267. Rodda, J. (1990) “Hizzoner” the governer, “Baking Powder” Bill and “Rawhide” Jimmy: The men who built Jerome: Jerome’s mining history to the great depression. In A. Caillou (ed) Experience Jerome: The mogules, miners, and mistresses of Cleopatra Hill (pp.1-22). Sedona, AZ: Thorne Enterprises, Inc. Sayer, A. (1989) Postfordism in question. International Journal of Urban and Regional Research, 13 (4): 666-695. Seidman, I. (2006) Interviewing as Qualitative Research: A Guide for Researchers in Education and the Social Sciences. New York, NY: Teachers College Press. Smardon, R.C. (1988) Perception and aesthetics of the urban environment: Review of the role of vegetation. Landscape and Urban Planning, 15: 85-106. Smith, I. (1964) Wickenburg: yesterday and today. Arizona Highways, 40 (2). Smith, N. R. (1990) Jerom’s billion dollar boom bustle and bust: 1898 to the present. In A. Caillou (ed) Experience Jerome: The mogules, miners, and mistresses of Cleopatra Hill (pp.1-22). Sedona, AZ: Thorne Enterprises, Inc. Snepenger, D. J., Murphy, L., O’Connell, R., and Gregg, E. (2003) Tourists and residents use of a shopping space. Annals of Tourism Research, 30 (3): 567-580.

70
Stocker, J. (1976) Tumbledown town with a love of life. Arizona Highways, 52 (5). Teddlie, C. and Yu, F. (2007) Mixed methods sampling: A typology with examples. Journal of Mixed Methods Research, 1 (1): 77-100. Tiltion, J.E. and Landsberg, H.H. (1999) Innovation, productivity growth, and the survival of the U.S. copper industry. In R.D. Simpson (ed.) Improvement Through Innovation (pp.109-140). Washington, DC: Resources for the Future.
Timothy, D.J. (2005) Shopping Tourism, Retailing and Leisure. Bristol: Channel View.
Timothy, D.J., and Boyd, S.W. (2003) Heritage Tourism. NJ, USA: Pearson Education.
Timothy, D. J., and Butler, R. W. (1995) Cross-border shopping: A North American perspective. Annals of Tourism Research, 22 (1): 16-34.
Toll, D. W. (1968) Touring Arizona’s yesterdays. Arizona Highways, 44 (10). Towner, J. (1984) The grand tour: Sources and a methodology for an historical study of tourism. Tourism Management, 5 (3): 215-222. Turley, L.W. and Chebat, J.C. (2002) Linking retail strategy, atmospherics design and shopping behavior. Journal of Marketing Management, 18 (1-2): 125-144. Turner, L. W. and Reisinger, Y. (2001) Shopping satisfaction for domestic tourists. Journal of Retailing and Consumer Services, 8: 15-27. UNWTO (n.d.) World tourism organization UNWTO. Retrieved from htto://www2.unwto.org U.S. Bureau of Labor Statistics (2011) Employment and earnings online. Retrieved from http://www.bls.gov/opub/ee/home.htm U.S. Census Bureau (2010) United States census 2010: It’s in our hands. Retrieved from http://www.census.gov/2010census/ Ward, J.C., Bitner, M.J., and barnes, J. (1992) Measuring the prototypicality and meaning of retail environments. Journal of Retailing, 68 (2): 194-220.

71
Wickenburg Chamber of Commerce (n.d.) Visit Wickenburg Arizona. Retrieved from http://outwickeburgway.com Wilkins, H. (2011) Souvenirs: What and why we buy. Journal of Travel Research, 50 (3): 239-247. Yale, P. (1991) From Tourist Attraction to Heritage Tourism. Huntingdon, UK: Elm Publications. Yüksel, A. (2007) Tourism shopping habitat: Effects on emotions, shopping value and bahaviors. Tourism Management, 28: 58-69. Zeppel, H., Hall, C.M., and Weiler, B. (1992) Special Interest Tourism. London, UK: Belhaven Press.

72
APPENDIX A
MODIFIED STREETSCAPE & SERVICESCAPE FACTORS

73
Table 4
Environmental and Social Cues Found in Jerome and Wickenburg Streetscapes
Environmental Cues Typical Features Physical/design factors
Landscaping Trees, flowers, bushes or any other plant life located throughout the street
Architecture/Historic Buildings Heritage facades, distinct rural or ethnic styles, use of natural materials (stone and timber), use of color
Layout of town Aesthetically pleasing, easy to find one’s way around
Variety of store types Restaurants, pubs, cafes, bakeries, local produce, arts and crafts, galleries, antiques & collectibles, toy shops, boutique clothing, Christmas shops, candy shops
Signage Small, quaint, country-style, old-style lettering, use of rustic materials. Themed entrance signage, directional signs and interpretation
Street Decorations Lamp posts, trash cans, seating, fences
Pedestrian Areas/Front Street Well maintained, seating, shading, wide walkways
Street and Window Displays Prominent street and window displays of products
Social factors
Crowding Streets may be overpopulated with tourists
Parking Parking lots are set away from buildings and main streets, but it is still available on the streets

74
Table 5 Environmental Cues Found in Jerome and Wickenburg Servicescapes
Environmental Cues Typical Features Physical/design factors
Layout Organized shelving and product displays
Product Variety Variety of products throughout different shops, products unique to town
Signs & Labels Small, quaint, country-style, old-style lettering, labels often hand written, emphasis on products themselves not elaborate labeling
Displays Low to eye level displays, emphasis on showcasing products and produce with great care taken in placing products
Color & Texture Earthy tones (e.g. timber, stone) or heritage schemes, walls sometimes textured (e.g. stone, timber)
Furnishings Usually timber, sometimes glass, rarely metallic
Social factors
Crowding Shops may be crowded with tourists, making it difficult to see all products available

75
APPENDIX B
VISITOR SURVEY & INTERVIEW

76
Jerome/Wickenburg Visitor Survey
Thank you for agreeing to help us with this important study. This study is being conducted to understand visitors’ experiences in Jerome. Your participation in this survey is completely voluntary, and you are free to withdraw at any time. Your anonymity will be assured, as no names will be included in the study. If you have any questions, please feel free to contact Dr. Dallen Timothy, who is supervising this study (602) 496 1566 (email: [email protected]). Part 1- We would like to begin by asking you some questions about your current visit to Jerome. 1. Overall, how satisfied are you with your current visit?
o Extremely dissatisfied o Very dissatisfied o Dissatisfied o Neither satisfied or dissatisfied o Satisfied o Very satisfied o Extremely satisfied
2. How long do you plan to stay in Jerome?
o Less than one hour o One to three hours o Three to five hours o More than five hours o More than one day
3. Where did you learn about Jerome?
o Friends or relatives o Films o Books o Travel agent o Other (specify _______________________________)
4. How likely are you to make a return visit to Jerome in the next 12 months?
o Very unlikely o Unlikely o Neutral o Likely o Very likely o Not sure
5. What was the main purpose for your visit today? ___________________________________________________________ 6. Which activities did you participate in on this visit? Please mark all that apply.
o Museum/gallery o Winery

77
o Restaurant/café o Shopping o Bar/saloon o General sightseeing o Other (please specify ______________________________________________)
7. How many times have you been to Jerome in the past?
o Never o One o Two to three o Four to six o Seven or more
Part 2- Next, we would like to ask you about your thoughts and impressions of Jerome during your visit. 8. How would you rank the following as being an important part of your overall experience here today?
Strongly disagree
Disagree Slightly disagree
Neither agree nor
disagree
Slightly agree
Agree Strongly agree
The community’s landscaping
� � � � � � �
Architecture/historic buildings
� � � � � � �
Geographical layout of the town
� � � � � � �
Variety of store types and other businesses
� � � � � � �
Signage (e.g. quaint, rustic, historical)
� � � � � � �
Street decorations (e.g. fences, street lights)
� � � � � � �
Pedestrian areas/main street
� � � � � � �
Street and window displays
� � � � � � �
Cleanliness of the streets and public areas
� � � � � � �

78
9. To what extent do you think the shop-specific (in-shop) elements below played an important part of your overall experience here today? Strongly
disagree Disagree Slightly
disagree Neither agree nor
disagree
Slightly agree
Agree Strongly agree
alluring colors � � � � � � �
architectural/artistic merit
� � � � � � �
visual appeal � � � � � � �
building materials � � � � � � �
signs and windows � � � � � � �
layout of the shops, bars, cafes
� � � � � � �
range of products � � � � � � �
product displays � � � � � � �
furnishings � � � � � � �
overall ambience (e.g. lighting, sounds, smells)
� � � � � � �
10. To what extent do you agree with the statements below regarding your experience here today?
Strongly disagree
Disagree Slightly disagree
Neither agree nor disagree
Slightly agree
Agree Strongly agree
There was adequate parking
� � � � � � �
Well maintained public spaces
� � � � � � �

79
The town was too crowded
� � � � � � �
The shops were too crowded
� � � � � � �
It was easy to find my way around
� � � � � � �
11. How would you rank the following as influencing your intention to return to Jerome in the future? Strongly
disagree Disagree Slightly
disagree Neither agree nor
disagree
Slightly agree
Agree Strongly agree
The community’s landscaping
� � � � � � �
Architecture/historic buildings
� � � � � � �
Geographical layout of the town
� � � � � � �
Variety of store types and other businesses
� � � � � � �
Signage (e.g. quaint, rustic, historical)
� � � � � � �
Street decorations (e.g. fences, street lights)
� � � � � � �
Pedestrian areas/main street
� � � � � � �
Street and window displays
� � � � � � �
Cleanliness of the streets and public areas
� � � � � � �
Well maintained public spaces
� � � � � � �
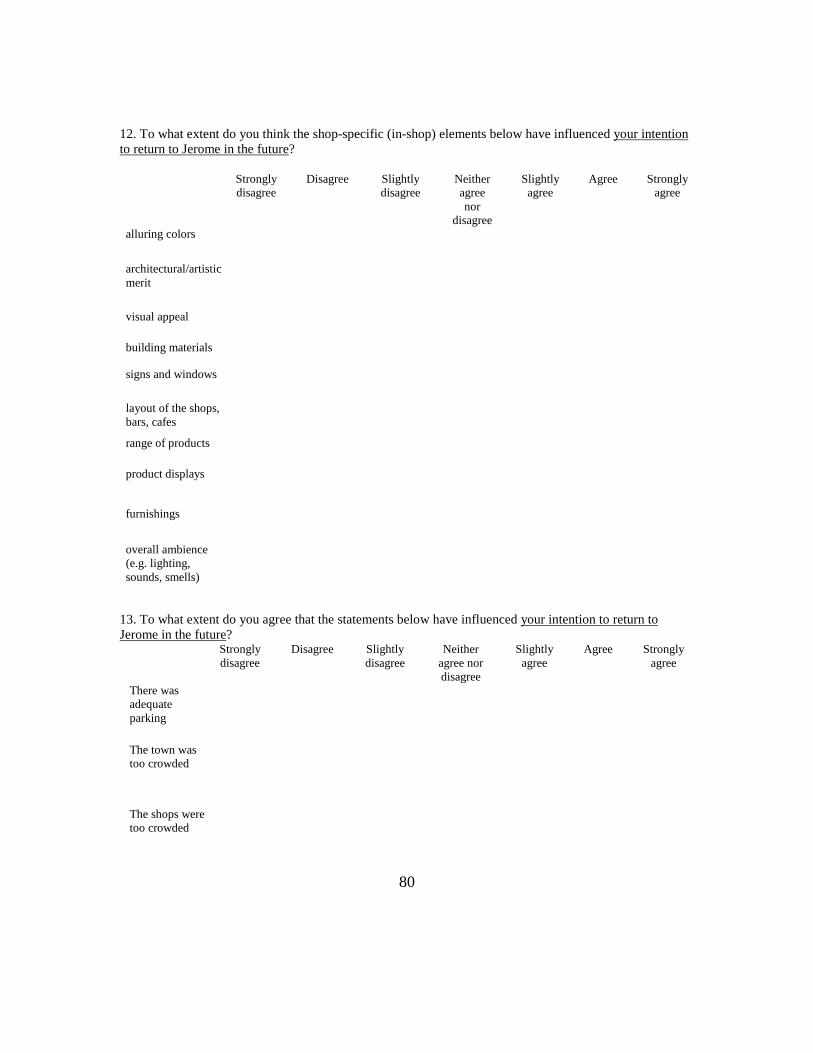
80
12. To what extent do you think the shop-specific (in-shop) elements below have influenced your intention to return to Jerome in the future? Strongly
disagree Disagree Slightly
disagree Neither agree nor
disagree
Slightly agree
Agree Strongly agree
alluring colors � � � � � � �
architectural/artistic merit
� � � � � � �
visual appeal � � � � � � �
building materials � � � � � � �
signs and windows � � � � � � �
layout of the shops, bars, cafes
� � � � � � �
range of products � � � � � � �
product displays � � � � � � �
furnishings � � � � � � �
overall ambience (e.g. lighting, sounds, smells)
� � � � � � �
13. To what extent do you agree that the statements below have influenced your intention to return to Jerome in the future?
Strongly disagree
Disagree Slightly disagree
Neither agree nor disagree
Slightly agree
Agree Strongly agree
There was adequate parking
� � � � � � �
The town was too crowded
� � � � � � �
The shops were too crowded
� � � � � � �

81
It was easy to find my way around
� � � � � � �
14. How would you rank the following as being an important part of your purchasing behavior (souvenirs, food, etc.) here today? Strongly
disagree Disagree Slightly
disagree Neither agree nor
disagree
Slightly agree
Agree Strongly agree
The community’s landscaping
� � � � � � �
Architecture/historic buildings
� � � � � � �
Geographical layout of the town
� � � � � � �
Variety of store types and other businesses
� � � � � � �
Signage (e.g. quaint, rustic, historical)
� � � � � � �
Street decorations (e.g. fences, street lights)
� � � � � � �
Pedestrian areas/main street
� � � � � � �
Street and window displays
� � � � � � �
Cleanliness of the streets and public areas
� � � � � � �
Well maintained public spaces
� � � � � � �
15. To what extent do you think the shop-specific (in-shop) elements below played an important part of your purchasing behavior (souvenirs, food, etc.) here today?

82
Strongly
disagree Disagree Slightly
disagree Neither agree nor
disagree
Slightly agree
Agree Strongly agree
alluring colors � � � � � � �
architectural/artistic merit
� � � � � � �
visual appeal � � � � � � �
building materials � � � � � � �
signs and windows � � � � � � �
layout of the shops, bars, cafes
� � � � � � �
range of products � � � � � � �
product displays � � � � � � �
furnishings � � � � � � �
overall ambience (e.g. lighting, sounds, smells)
� � � � � � �
16. To what extent do you agree with the statements below regarding your purchasing behavior (souvenirs, food, etc.) here today?
Strongly disagree
Disagree Slightly disagree
Neither agree nor disagree
Slightly agree
Agree Strongly agree
There was adequate parking
� � � � � � �
The town was too crowded
� � � � � � �
The shops were too crowded
� � � � � � �

83
It was easy to find my way around
� � � � � � �
Part 3- In this final part, we would like to ask you some background information about you and your household. This information will be kept strictly confidential and used for statistical purposes only. The information is used to make sure we accurately represent visitors to Jerome. 17. Which of the following sources of information did you use when planning your trip? (check all that apply)
o Internet o Travel agent o Friends/Family o Guidebooks o Magazines o Films o Chamber of Commerce/Tourism Bureau o Local business people o From a previous trip o Other (please specify___________)
18. What is your gender?
o Male o Female
19. What is your age? ____ 20. Please indicate the highest level of education that you have attained. (check only one)
o Less than high school o High school graduate o Technical school or Associates degree o Bachelor’s degree o Master’s Degree o Ph.D., M.D., J.D., or equivalent
21. What was your employment status during the past year (check all that apply)
o Full-time student o Part-time student o Employed part-time o Employed full-time o Unemployed o Homemaker or caregiver o Retired o Other (please specify________)
22. With which racial group(s) do you identify?
o American Indian or Alaska Native o Latino/Latina o Asian

84
o African American o Native Hawaiian or other Pacific Islander o White
23. Which of the following broad categories best describes your total annual household income for the last calendar year?
o $25,000 or less o $25,001 - $50,000 o $50,001 – $75,000 o $75,001 - $100,000 o $100,001 - $125,000 o $125,001 - $150,000 o More than $150,000
Thank you for helping us with this important study. If there is anything else you would like to tell us, please do so in the space below.

85
INTERVIEW
What drew you to Jerome/Wickenburg?
What elements of a store do you think impact visitors the most?
Why do you think people come to Jerome/Wickenburg?
In what ways do you think the historic ambience of the town affects the tourist’s
experiences?
Do you think that carrying the historic theme into the stores is important? Does it affect
the tourist’s experience?
Have you seen any changes in the town since you have been here (aesthetic changes, new
stores, etc.)? How have they affected tourists?
If you could change one thing in town, what would it be and why?

86
APPENDIX C
SOCIO-DEMOGRAPHICS & TRAVEL BEHAVIOR

87
Table 6
Socio-demographic Characteristics of Jerome and Wickenburg
Socio-demographic Characteristics- Jerome Socio-demographic Characteristics- Wickenburg
Socio-demographics Frequency
(%) Socio-demographics Frequency
(%)
Gender Gender
Male 41.5% Male 46.0%
Female 58.5% Female 54.0%
Age Age
Below 20 1.5% Below 20 0.0%
21-30 36.9% 21-30 33.8%
31-40 18.5% 31-40 23.1%
41-50 15.4% 41-50 13.8%
51-60 12.3% 51-60 12.3%
61-70 9.2% 61-70 9.2%
Over 70 6.2% Over 70 7.7%
Education Education
Less than Highschool 0.0% Less than Highschool 0.0%
Highschool graduate 20.0% Highschool graduate 15.4% Associate Degree/Technical school 29.2% Associate Degree/Technical school 23.1%
Bachelor's Degree 36.9% Bachelor's Degree 38.5%
Master's Degree 13.8% Master's Degree 16.9%
Doctorate Degree 0.0% Doctorate Degree 6.2%
Employment Employment
Student Only 1.5% Student Only 3.1%
Employed Only 73.8% Employed Only 63.1%
Student and Employed 16.9% Student and Employed 21.5%
Unemployed 0.0% Unemployed 0.0%
Homemaker 0.0% Homemaker 1.5%
Retired 7.7% Retired 10.8%
Other 0.0% Other 0.0%
Race Race
American Indian/Alaska Native 9.2% American Indian/Alaska Native 3.1%

88
Latino/Latina 10.8% Latino/Latina 15.4% Asian 3.1% Asian 3.1%
African American 13.8% African American 4.6% Hawaiian or other Pacific Islander 1.5% Hawaiian or other Pacific Islander 3.1%
White 61.5% White 73.8%
Income Income
Less than $25,000 13.8% Less than $25,000 13.8%
$25,001- $50,000 35.4% $25,001- $50,000 29.2%
$50,001-$75,000 35.4% $50,001-$75,000 33.8%
$75,001-$100,000 10.8% $75,001-$100,000 12.3%
More than $100,000 4.6% More than $100,000 10.8%

89
Table 7
Satisfaction and Travel Behavior- Jerome
Items Frequency
(%) Items Frequency
(%) Overall Satisfaction Activities Extremely/Very Dissatisfied 0.0% Museum/gallery 72.3% Dissatisfied 0.0% Winery 27.7% Neutral 1.5% Restaurant/café 92.3% Satisfied 38.5% Shopping 81.5% Very/Extremely Satisfied 60.0% Bar/saloon 30.8%
General sightseeing 52.3%
Length of Stay Other 3.1% Less than 1 hour 0.0% 1-3 hours 13.8% Previous Visit 3-5 hours 40.0% Never 46.2% More than 5 hours 27.7% One 23.1% More than 1 day 18.5% Two to three 16.9%
Four to six 7.7% Learned About Jerome Seven or more 6.2% Friends or Relatives 75.4% Films 1.5% Books 35.4% Travel Agent 0.0% Other 3.1%
Likely to Return Very Unlikely 1.5% Unlikely 4.6% Neutral 21.5% Likely 33.8% Very Likely 33.8% Not Sure 4.6%
Main Purpose for Visit

90
Shopping 13.8% Museums 4.6% Art 10.8% Historic Learning/Experience 4.6% Personal/work/school 4.6% Driving through 10.8% Daytrip/Staycation 9.2% Sightseeing 6.2% Winery/Restaurant 9.2% Ghost Town Experience 15.4% Friends/Relatives 6.2% No specific reason 4.6%

91
Table 8
Satisfaction and Travel Behavior- Wickenburg
Items Frequency
(%) Items Frequency
(%)
Overall Satisfaction Activities Extremely/Very Dissatisfied 0.0% Museum/gallery 72.7%
Dissatisfied 1.5% Winery 6.1% Neutral 4.6% Restaurant/café 75.8% Satisfied 32.3% Shopping 72.7% Very/Extremely Satisfied 61.5% Bar/saloon 30.3%
General sightseeing 54.5%
Length of Stay Other 4.5% Less than 1 hour 0.0%
1-3 hours 18.5% Previous Visit 3-5 hours 46.2% Never 33.8% More than 5 hours 29.2% One 18.5% More than 1 day 6.2% Two to three 27.7%
Four to six 13.8% Learned About Wickenburg Seven or more 6.2% Friends or Relatives 78.5%
Films 3.1% Books 20.0% Travel Agent 1.5% Other 6.2%
Likely to Return Very Unlikely 3.1% Unlikely 4.6% Neutral 9.2% Likely 43.1%

92
Very Likely 29.2% Not Sure 10.8%
Main Purpose for Visit Shopping 13.8% Museums 7.7% Art 12.3% Historic Learning/Experience 10.8% Personal/work/school 12.3% Driving through 12.3% Daytrip/Staycation 9.2%
Sightseeing 7.7% Winery/Restaurant 3.1% Ghost Town Experience 0.0% Friends/Relatives 3.1% No specific reason 7.7%

93
APPENDIX D
STREETSCAPE, SERVICESCAPE & INFRASTRUCTURE FREQUENCIES

94
Table 9
Streetscape Frequencies- Jerome
Frequencies
Streetscape- Overall Experience SD/D SLD N SLA A/SA
Average
Standard Deviatio
n
Community landscaping 0.00%
1.54%
3.08%
15.38%
80.00% 5.99 0.82
Architecture/historic buildings 0.00%
0.00%
4.62% 4.62%
90.77% 6.31 0.769
Geographical layout of town 0.00%
3.08%
1.54%
23.08%
72.31% 5.91 0.914
Variety of stores 0.00%
1.54%
3.08% 3.08%
92.31% 6.28 0.801
Signage 0.00%
1.54%
4.62%
15.38%
78.46% 6 0.884
Street decorations 0.00%
1.54%
3.08%
12.31%
83.08% 6.09 0.843
Pedestrian areas 1.54%
0.00%
3.08% 7.69%
87.69% 6.12 0.975
Street and window displays 1.54%
0.00%
4.62% 6.15%
87.69% 6.17 0.928
Cleanliness of public areas 1.54%
0.00%
3.08%
10.77%
84.62% 6.22 0.944
Well maintained public spaces 1.54%
0.00%
3.08%
10.77%
84.62% 6.28 0.96
Overall Streetscape Experience 6.14 0.677 Streetscape- Intention to
Return
Community landscaping 1.54%
1.54%
3.08%
16.92%
76.92% 5.83 0.911
Architecture/historic buildings 0.00%
3.08%
3.08% 4.62%
89.23% 6.2 0.905
Geographical layout of town 0.00%
1.54%
4.62%
32.31%
61.54% 5.74 0.889
Variety of stores 0.00%
0.00%
3.08%
10.77%
86.15% 6.22 0.76
Signage 0.00%
0.00%
6.15%
24.62%
69.23% 5.95 0.909
Street decorations 0.00%
3.08%
3.08%
26.15%
67.69% 5.82 0.934
Pedestrian areas 0.00%
1.54%
4.62%
26.15%
67.69% 5.83 0.894
Street and window displays 0.00%
1.54%
3.08%
15.38%
80.00% 6.03 0.847

95
Cleanliness of public areas 0.00%
3.08%
1.54%
18.46%
76.92% 6.09 0.964
Well maintained public spaces 0.00%
1.54%
7.69% 9.23%
81.54% 6.17 0.993
Overall Streetscape Experience 5.99 0.747 Streetscape- Purchasing Behavior
Community landscaping 1.54%
1.54%
6.15%
38.46%
52.31% 5.52 0.97
Architecture/historic buildings 0.00%
3.08%
3.08%
24.62%
69.23% 5.72 0.839
Geographical layout of town 1.54%
1.54%
3.08%
15.38%
78.46% 5.8 0.87
Variety of stores 1.54%
0.00%
3.08% 3.08%
92.31% 6.35 0.975
Signage 0.00%
0.00%
4.62% 7.69%
87.69% 6.29 0.805
Street decorations 1.54%
3.08%
3.08%
44.62%
47.69% 5.54 1.119
Pedestrian areas 1.54%
1.54%
3.08%
44.62%
49.23% 5.49 0.986
Street and window displays 1.54%
1.54%
4.62% 4.62%
87.69% 6.12 1.068
Cleanliness of public areas 1.54%
1.54%
3.08%
40.00%
53.85% 5.68 1.032
Well maintained public spaces 0.00%
3.08%
4.62%
38.46%
53.85% 5.69 1.014
Overall Streetscape Experience 5.82 0.812

96
Table 10
Servicescape Frequencies- Jerome
Frequencies
Servicescape- Overall Experience SD/D SLD N SLA A/SA
Average
Standard Deviatio
n
Alluring colors 1.54%
0.00% 4.62% 4.62%
89.23% 6.23 0.932
Architectural/artistic merit 0.00%
0.00% 3.08% 6.15%
90.77% 6.42 0.748
Visual appeal 0.00%
0.00% 3.08% 6.15%
90.77% 6.37 0.741
Building materials 1.54%
1.54% 1.54%
10.77%
84.62% 6.03 0.918
Signs and Windows 0.00%
0.00% 7.69% 4.62%
87.69% 6.05 0.779
Layout of shops 0.00%
1.54% 3.08%
13.85%
81.54% 6.05 0.837
Range of products 0.00%
1.54% 1.54%
12.31%
84.62% 6.23 0.844
Product displays 0.00%
0.00% 3.08%
10.77%
86.15% 6.19 0.748
Furnishings 0.00%
3.08% 3.08% 6.15%
87.69% 6.15 0.905
Overall ambience 1.54%
0.00% 3.08% 1.54%
93.85% 6.46 0.885
Overall Servicescape Experience 6.22 0.695 Servicescape- Intention to Return
Alluring colors 1.54%
0.00%
615.38% 7.69%
84.62% 5.91 0.861
Architectural/artistic merit 1.54%
3.08% 1.54% 6.15%
87.69% 5.99 1.023
Visual appeal 0.00%
3.08% 0.00% 6.15%
90.77% 6.14 0.788
Building materials 1.54%
1.54% 7.69%
23.08%
66.15% 5.74 1.122
Signs and Windows 1.54%
1.54% 6.15%
18.46%
72.31% 5.82 1.088
Layout of shops 0.00%
0.00% 7.69%
24.62%
67.69% 5.86 0.899
Range of products 1.54%
1.54% 0.00% 9.23%
87.69% 6.03 0.935
Product displays 1.54%
1.54% 4.62%
20.00%
72.31% 5.85 1.079

97
Furnishings 1.54%
1.54% 4.62%
24.62%
67.69% 5.8 1.093
Overall ambience 0.00%
3.08% 3.08% 6.15%
72.31% 6.23 0.932
Overall Servicescape Experience 5.94 0.795 Servicescape- Purchasing Behavior
Alluring colors 0.00%
0.00% 4.62% 3.08%
92.31% 6.17 0.698
Architectural/artistic merit 0.00%
0.00% 6.15%
18.46%
75.38% 5.89 0.793
Visual appeal 0.00%
1.54% 0.00%
12.31%
86.15% 6.22 0.781
Building materials 0.00%
1.54% 12.31%
40.00%
46.15% 5.43 0.918
Signs and Windows 0.00%
1.54% 0.00% 9.23%
89.23% 6.15 0.712
Layout of shops 0.00%
0.00% 3.08%
10.77%
86.15% 6.08 0.692
Range of products 0.00%
0.00% 3.08% 6.15%
90.77% 6.35 0.738
Product displays 0.00%
1.54% 0.00% 6.15%
92.31% 6.39 0.744
Furnishings 0.00%
0.00% 4.62%
29.23%
66.15% 5.91 0.879
Overall ambience 0.00%
1.54% 1.54%
23.08%
73.85% 6.02 0.875
Overall Servicescape Experience 6.06 0.612

98
Table 11
Infrastructure Frequencies- Jerome
Frequencies
Infrastructure- Overall Experience SD/D SLD N SLA A/SA
Average
Standard Deviatio
n
There was adequate parking 41.54
% 33.85
% 10.77
% 6.15% 7.69% 2.94 1.456
Town was too crowded 3.08% 18.46
% 29.23
% 26.15
% 23.08
% 4.54 1.3
Shops were too crowded 4.62% 16.92
% 26.15
% 29.23
% 23.08
% 4.57 1.287
Easy to navigate through town 1.54% 0.00% 0.00% 15.38
% 83.08
% 6.06 0.917 Overall Infrastructure Experience 4.53 0.587 Infrastructure- Intention to Return
There was adequate parking 35.38
% 36.92
% 13.85
% 4.62% 9.23% 3.08 1.44
Town was too crowded 1.54% 30.77
% 33.85
% 13.85
% 20.00
% 4.29 1.308
Shops were too crowded 1.54% 26.15
% 35.38
% 20.00
% 16.92
% 4.34 1.254
Easy to navigate through town 3.08% 0.00% 1.54% 16.92
% 78.46
% 5.83 1.084 Overall Infrastructure Experience 4.38 0.639 Infrastructure- Purchasing Behavior
There was adequate parking 43.08
% 26.15
% 18.46
% 4.62% 7.69% 3.02 1.42
Town was too crowded 1.54% 32.31
% 24.62
% 20.00
% 21.54
% 4.37 1.341
Shops were too crowded 0.00% 27.69
% 27.69
% 21.54
% 23.08
% 4.49 1.288
Easy to navigate through town 3.08% 0.00% 3.08% 15.38
% 78.46
% 5.86 1.13 Overall Infrastructure Experience 4.43 0.647

99
Table 12
Streetscape Frequencies- Wickenburg
Frequencies
Streetscape- Overall Experience SD/D SLD N SLA A/SA
Average
Standard Deviatio
n
Community landscaping 1.54% 0.00% 1.54% 7.69%
89.23% 6.18 0.934
Architecture/historic buildings 1.54% 0.00% 1.54% 6.15%
90.77% 6.29 0.947
Geographical layout of town 1.54% 0.00% 0.00%
23.08%
75.38% 5.91 0.947
Variety of stores 1.54% 0.00% 0.00% 1.54%
89.23% 6.17 0.928
Signage 0.00% 0.00% 3.08%
18.46%
78.46% 6.11 0.812
Street decorations 1.54% 0.00% 3.08%
10.77%
84.62% 6.15 1.004
Pedestrian areas 1.54% 0.00% 1.54%
12.31%
84.62% 6.18 0.983
Street and window displays 1.54% 0.00% 3.08%
13.85%
81.54% 5.98 0.96
Cleanliness of public areas 0.00% 0.00% 0.00% 9.23%
90.77% 6.37 0.651
Well maintained public spaces 0.00% 0.00% 1.54% 9.23%
89.23% 6.29 0.701
Overall Streetscape Experience 6.12 0.82 Streetscape- Intention to Return
Community landscaping 1.54% 1.54% 1.54%
15.38%
80.00% 5.92 0.989
Architecture/historic buildings 0.00% 1.54% 1.54% 4.62%
92.31% 6.26 0.756
Geographical layout of town 0.00% 4.62% 3.08%
27.69%
64.62% 5.72 0.976
Variety of stores 0.00% 3.08% 1.54% 9.23%
86.15% 6.08 0.853
Signage 0.00% 1.54% 3.08%
30.77%
64.62% 5.85 0.905
Street decorations 0.00% 1.54% 1.54%
18.46%
78.46% 6 0.81
Pedestrian areas 0.00% 1.54% 1.54% 7.69%
89.23% 6.15 0.755
Street and window displays 1.54% 1.54% 1.54%
27.69%
67.69% 5.77 0.932

100
Cleanliness of public areas 1.54% 1.54% 0.00%
12.31%
84.62% 6.11 0.921
Well maintained public spaces 0.00% 1.54% 0.00% 9.23%
89.23% 6.2 0.733
Overall Streetscape Experience 5.97 0.728 Streetscape- Purchasing Behavior
Community landscaping 3.08%
12.31%
10.77%
21.54% 52.3% 5.26 1.384
Architecture/historic buildings 1.54% 7.69% 7.69%
27.69%
55.38% 5.52 1.251
Geographical layout of town 1.54% 4.62% 7.69%
24.62%
61.54% 5.62 1.141
Variety of stores 0.00% 0.00% 3.08% 4.62%
92.31% 6.22 0.673
Signage 0.00% 1.54% 3.08%
10.77%
84.62% 6.06 0.808
Street decorations 0.00% 6.15% 9.23%
33.85%
50.77% 5.51 1.12
Pedestrian areas 0.00% 4.62%
15.38%
29.23%
50.77% 5.43 1.089
Street and window displays 0.00% 0.00% 4.62%
10.77%
84.62% 6.2 0.814
Cleanliness of public areas 1.54% 4.62% 9.23%
26.15%
58.46% 5.57 1.159
Well maintained public spaces 1.54% 4.62% 9.23%
26.15%
58.46% 5.58 1.171
Overall Streetscape Experience 5.66 0.853

101
Table 13
Servicescape Frequencies- Wickenburg
Frequencies
Servicescape- Overall Experience SD/D SLD N SLA A/SA
Average
Standard Deviatio
n
Alluring colors 0.00% 0.00% 3.08%
23.08%
73.85% 5.89 0.732
Architectural/artistic merit 0.00% 0.00% 3.08% 4.62%
92.31% 6.22 0.673
Visual appeal 0.00% 0.00% 3.08% 4.62%
92.31% 6.31 0.705
Building materials 0.00% 4.62% 4.62%
18.46%
72.31% 5.88 1.038
Signs and Windows 0.00% 0.00% 3.08%
18.46%
78.46% 6.03 0.77
Layout of shops 0.00% 0.00% 0.00%
20.00%
80.00% 6.08 0.692
Range of products 0.00% 0.00% 3.08% 6.15%
90.77% 6.14 0.659
Product displays 0.00% 0.00% 4.62% 6.15%
89.23% 6.23 0.766
Furnishings 0.00% 0.00% 1.54%
24.62%
73.85% 6.03 0.709
Overall ambience 0.00% 0.00% 3.08% 4.62%
92.31% 6.34 0.713
Overall Servicescape Experience 6.09 0.655 Servicescape- Intention to Return
Alluring colors 0.00% 3.08%
10.77%
20.00%
66.15% 5.65 0.975
Architectural/artistic merit 0.00% 1.54% 3.08% 9.23%
86.15% 6.05 0.779
Visual appeal 0.00% 0.00% 4.62% 4.62%
90.77% 6.23 0.745
Building materials 0.00% 4.62% 9.23%
23.08% 62.8% 5.71 1.1
Signs and Windows 0.00% 0.00% 6.15%
26.15%
67.69% 5.97 0.935
Layout of shops 0.00% 0.00% 3.08%
27.69%
69.23% 5.88 0.781
Range of products 0.00% 0.00% 4.62% 4.62%
90.77% 6.14 0.704
Product displays 0.00% 0.00% 4.62%
21.54%
73.85% 5.97 0.829

102
Furnishings 0.00% 1.54% 3.08%
27.69%
67.69% 5.85 0.87
Overall ambience 0.00% 0.00% 3.08%
10.77%
86.15% 6.25 0.771
Overall Servicescape Experience 5.89 0.664 Servicescape- Purchasing Behavior
Alluring colors 0.00% 0.00% 1.54%
13.85%
84.62% 6.06 0.659
Architectural/artistic merit 0.00% 0.00% 9.23%
30.77%
60.00% 5.68 0.868
Visual appeal 0.00% 0.00% 1.54% 7.69%
90.77% 6.15 0.618
Building materials 3.08%
12.31%
10.77%
23.08%
50.77% 5.52 1.381
Signs and Windows 0.00% 0.00% 3.08% 6.15%
90.77% 6.26 0.713
Layout of shops 0.00% 0.00% 0.00%
18.46%
81.54% 6.11 0.687
Range of products 0.00% 0.00% 3.08% 6.15%
90.77% 6.23 0.702
Product displays 0.00% 0.00% 1.54% 4.62%
93.85% 6.37 0.651
Furnishings 0.00% 3.08% 7.69%
33.85%
55.38% 5.66 1.035
Overall ambience 0.00% 0.00% 3.08%
18.46%
78.46% 5.91 0.678
Overall Servicescape Experience 5.97 0.586

103
Table 14
Infrastructure frequencies- Wickenburg
Frequencies
Infrastructure- Overall Experience SD/D SLD N SLA A/SA
Average
Standard Deviatio
n
There was adequate parking 3.08% 4.62% 3.08% 9.23%
80.00% 5.94 1.223
Town was too crowded 70.77
% 4.62%
10.77% 6.15% 7.69% 2.4 1.579
Shops were too crowded 70.77
% 6.15% 9.23% 6.15% 7.69% 2.42 1.648
Easy to navigate through town 0.00% 1.54% 3.08% 3.08%
92.31% 6.26 0.796
Overall Infrastructure Experience 4.22 0.573 Infrastructure- Intention to Return
There was adequate parking 4.62% 4.62% 3.08%
13.85%
73.85% 5.85 1.337
Town was too crowded 72.31
% 9.23% 7.69% 6.15% 4.62% 2.23 1.487
Shops were too crowded 70.77
% 9.23% 7.69% 6.15% 6.15% 2.29 1.608
Easy to navigate through town 0.00% 0.00% 1.54% 3.08%
95.38% 6.35 0.623
Overall Infrastructure Experience 4.15 0.667
Infrastructure- Purchasing Behavior
There was adequate parking 4.62% 4.62% 3.08%
10.77%
76.92% 5.85 1.314
Town was too crowded 72.31
% 7.69% 9.23% 3.08% 7.69% 2.28 1.566
Shops were too crowded 73.85
% 6.15% 4.62% 7.69% 7.69% 2.32 1.669
Easy to navigate through town 0.00% 0.00% 1.54% 3.08%
95.38% 6.38 0.63
Overall Infrastructure Experience 4.21 0.702

104
APPENDIX E
MULTIPLE REGRESSION MODELS

105
Table 15 Influence of Overall Streetscape Experience- Jerome
Model 1: Frequency of Visits
N=65 Independent Variables Parameter t-Value Age 0.008 .294* Education 0.02 2.138 Income -0.059 0.088 Gender 0.094 -0.291 Streetscape Experience -0.162 -0.699 R² 0.007 F-value 0.98 Significance 0.438 *Significant at p= 0.05 level.
Table 16 Influence of Overall Servicescape Experience- Jerome
Model 2: Satisfaction with
visit Model 3:
Frequency of Visits N=65 N=65
Independent Variables Parameter t-Value Parameter t-Value Age -0.002 -1.104 0.009 2.373* Education 0.014 0.098 0.028 0.124 Income -0.034 -0.282 -0.071 -0.361 Gender 0.376 1.933* 0.057 0.184 Servicescape Experience 0.249 0.074 -0.39 -1.77 R² 0.119 0.116 F-value 1.595 1.548 Significance 0.176 0.189 *Significant at p= 0.05 level.
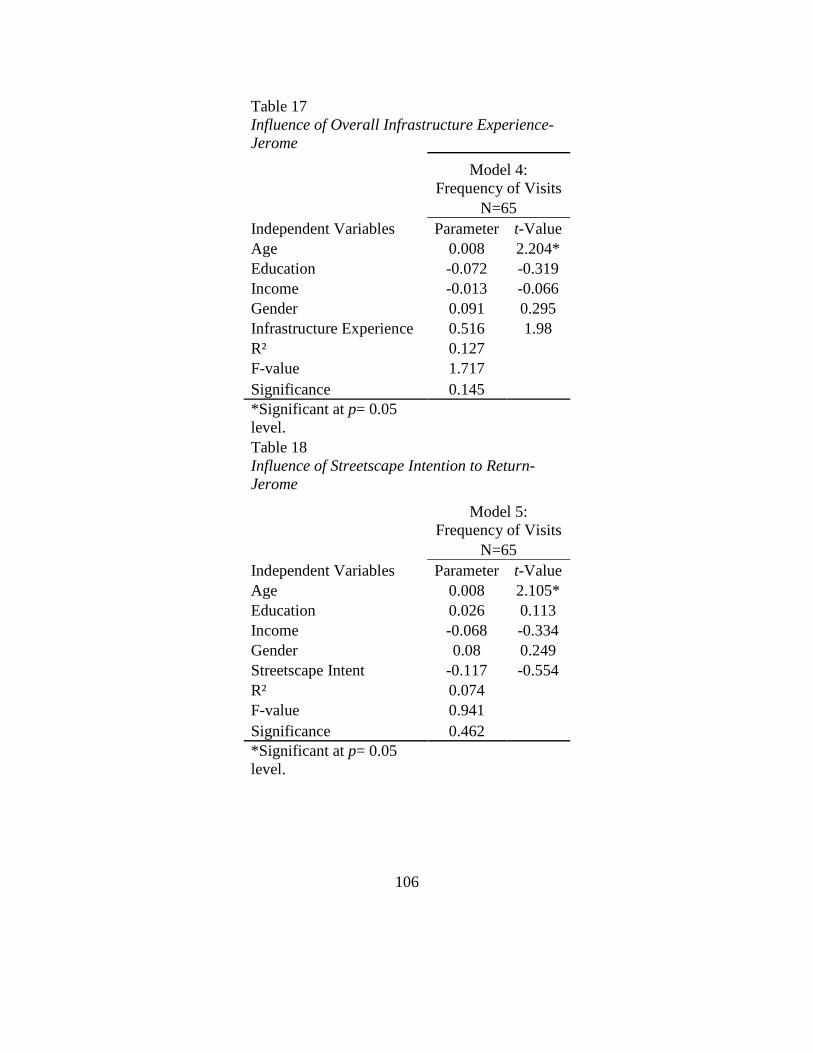
106
Table 17 Influence of Overall Infrastructure Experience- Jerome
Model 4: Frequency of Visits
N=65 Independent Variables Parameter t-Value Age 0.008 2.204* Education -0.072 -0.319 Income -0.013 -0.066 Gender 0.091 0.295 Infrastructure Experience 0.516 1.98 R² 0.127 F-value 1.717 Significance 0.145 *Significant at p= 0.05 level. Table 18 Influence of Streetscape Intention to Return- Jerome
Model 5: Frequency of Visits
N=65 Independent Variables Parameter t-Value Age 0.008 2.105* Education 0.026 0.113 Income -0.068 -0.334 Gender 0.08 0.249 Streetscape Intent -0.117 -0.554 R² 0.074 F-value 0.941 Significance 0.462 *Significant at p= 0.05 level.

107
Table 19 Influence of Servicescape Intent to Return- Jerome
Model 6: Frequency of Visits
N=65
Independent Variables Parameter t-Value Age 0.008 2.075* Education 0.005 0.021 Income -0.049 -0.243 Gender 0.74 0.23 Servicescape Intent -0.073 -0.372 R² 0.071 F-value 0.904
Significance 0.484 *Significant at p= 0.05 level.
Table 20 Influence of Infrastructure Intent to Return- Jerome
Model 7: Frequency of Visits
N=65
Independent Variables Parameter t-Value
Age 0.008 2.131* Education -0.021 -0.089 Income -0.055 -0.275 Gender 0.145 0.432 Infrastructure Intent 0.174 0.62 R² 0.075 F-value 0.957
Significance 0.451 *Significant at p= 0.05 level.

108
Table 21 Influence of Streetscape Purchasing Behavior- Jerome
Model 8: Frequency of Visits
N=65 Independent Variables Parameter t-Value Age 0.008 2.089* Education 0.011 0.049 Income -0.05 -0.249 Gender 0.086 0.268 Streetscape Purchasing -0.088 -0.456 R² 0.072 F-value 0.919 Significance 0.475 *Significant at p= 0.05 level.
Table 22 Influence of Servicescape Purchasing Behavior- Jerome
Model 9: Frequency of Visits N=65
Independent Variables Parameter t-Value Age 0.008 2.289* Education 0.009 0.042 Income -0.07 -0.351 Gender 0.093 0.295 Servicescape Purchasing -0.375 -1.484 R² 0.103 F-value 1.348 Significance 0.257 *Significant at p= 0.05 level.
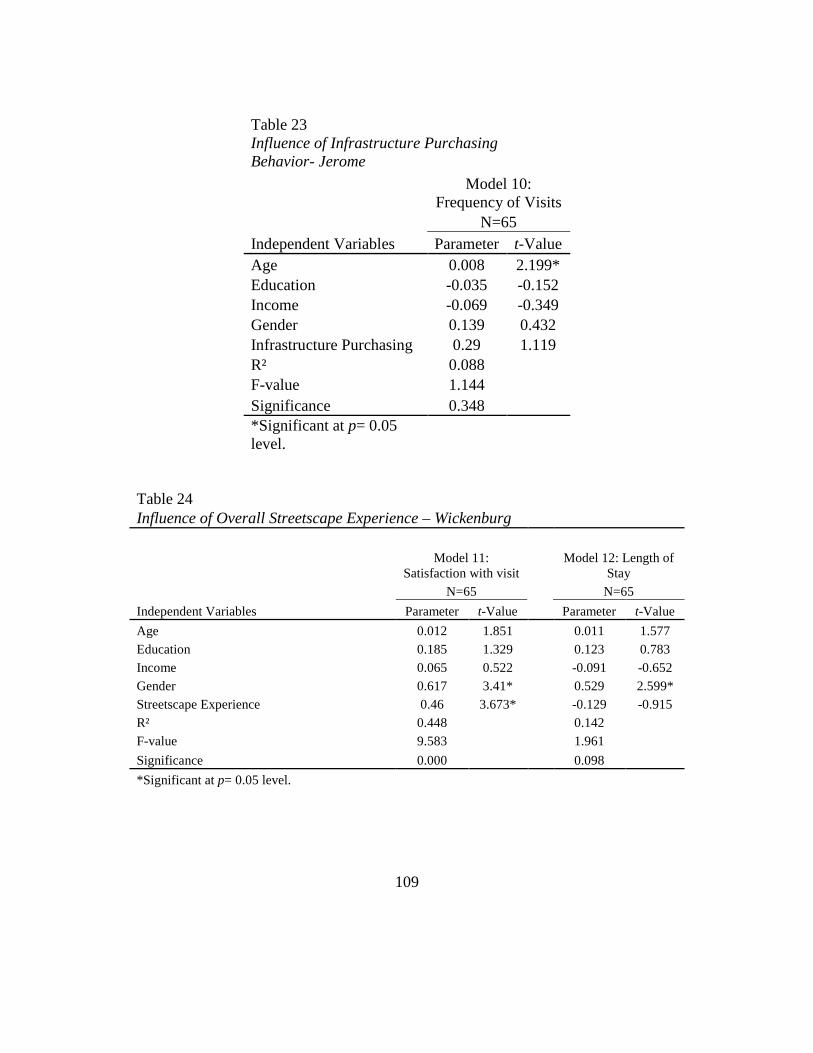
109
Table 23 Influence of Infrastructure Purchasing Behavior- Jerome
Model 10: Frequency of Visits
N=65 Independent Variables Parameter t-Value Age 0.008 2.199* Education -0.035 -0.152 Income -0.069 -0.349 Gender 0.139 0.432 Infrastructure Purchasing 0.29 1.119 R² 0.088 F-value 1.144 Significance 0.348 *Significant at p= 0.05 level.
Table 24 Influence of Overall Streetscape Experience – Wickenburg
Model 11: Satisfaction with visit
Model 12: Length of Stay
N=65 N=65
Independent Variables Parameter t-Value Parameter t-Value
Age 0.012 1.851 0.011 1.577 Education 0.185 1.329 0.123 0.783 Income 0.065 0.522 -0.091 -0.652 Gender 0.617 3.41* 0.529 2.599* Streetscape Experience 0.46 3.673* -0.129 -0.915 R² 0.448 0.142 F-value 9.583 1.961
Significance 0.000 0.098
*Significant at p= 0.05 level.

110
Table 25 Influence of Overall Servicescape Experience- Wickenburg
Model 13: Satisfaction with
visit Model 14: Length
of Stay Model 15:
Frequency of Visits
N=65 N=65 N=65
Independent Variables Parameter t-
Value Parameter t-
Value Parameter t-
Value
Age 0.011 1.783 0.011 1.623 0.002 0.825
Education 0.089 0.629 0.15 0.971 0.199 0.404
Income 0.154 1.244 -0.137 -1.009 -0.085 0.684
Gender 0.594 3.182* 0.504 2.46* -0.371 0.242
Servicescape Experience 0.481 3.103* 0.122 0.715 0.649 .015*
R² 0.417 0.138 0.135
F-value 8.444 1.885 1.837
Significance 0.000 0.111 0.120 *Significant at p= 0.05 level.
Table 26 Influence of Overall Infrastructure Experience- Wickenburg
Model 16: Satisfaction with visit
Model 17: Length of Stay
N=65 N=65
Independent Variables Parameter t-Value Parameter t-Value
Age 0.01 1.454 0.012 1.723
Education 0.101 0.668 0.133 0.863
Income 0.178 1.341 -0.109 -0.805
Gender 0.639 3.196* 0.537 2.64*
Infrastructure Experience -0.125 -0.829 0.161 1.046
R² 0.33 0.146
F-value 5.807 2.019
Significance 0.000 0.089
*Significant at p= 0.05 level.

111
Table 27 Influence of Streetscape Intention to Return- Wickenburg
Model 18: Satisfaction with
visit Model 19: Length
of Stay
Model 20: Frequency of
Visits
N=65 N=65 N=65
Independent Variables Parameter t-
Value Parameter t-
Value Parameter t-
Value
Age 0.012 1.843 0.011 1.609 0.003 0.778
Education 0.153 1.051 0.156 0.995 0.28 0.256
Income 0.111 0.868 -0.135 -0.97 -0.135 0.534
Gender 0.648 3.429* 0.518 2.534* -0.298 0.351
Streetscape Intent 0.38 2.709* 0.037 0.247 0.48 .046*
R² 0.397 0.131 0.107
F-value 7.769 1.782 1.407
Significance 0.000 0.131 0.235 *Significant at p= 0.05 level.
Table 28 Influence of Servicescape Intent to Return
Model 21: Satisfaction with visit
Model 22: Length of Stay
N=65 N=65
Independent Variables Parameter t-Value Parameter t-Value
Age 0.01 1.554 0.011 1.586
Education 0.073 0.509 0.149 0.957
Income 0.171 1.356 -0.129 -0.951
Gender 0.578 3.005* 0.512 2.472*
Servicescape Intent 0.369 2.547* 0.035 0.224
R² 0.389 0.131
F-value 7.517 1.779
Significance 0.000 0.131
*Significant at p= 0.05 level.

112
Table 29 Influence of Infrastructure Intent to Return- Wickenburg
Model 23: Satisfaction with visit
Model 24: Length of Stay
N=65 N=65
Independent Variables Parameter t-Value Parameter t-Value
Age 0.011 1.56 0.013 1.779
Education 0.087 0.565 0.113 0.728
Income 0.193 1.431 -0.091 -0.667
Gender 0.653 3.262* 0.523 2.595*
Infrastructure Intent 0.007 0.046 0.217 1.366
R² 0.322 0.157
F-value 5.605 2.197
Significance 0.000 0.067
*Significant at p= 0.05 level.
Table 30 Influence of Streetscape Purchasing Behavior- Wickenburg
Model 25: Satisfaction with visit
Model 26: Length of Stay
N=65 N=65
Independent Variables Parameter t-Value Parameter t-Value
Age 0.012 1.735 0.013 1.823
Education 0.103 0.683 0.168 1.107
Income 0.161 1.216 -0.167 -1.241
Gender 0.649 3.283* 0.513 2.563*
Streetscape Purchasing 0.15 1.29 0.195 1.661
R² 0.341 0.169
F-value 6.095 2.402
Significance 0.000 0.047
*Significant at p= 0.05 level.

113
Table 31 Influence of Servicescape Purchasing Behavior- Wickenburg
Model 27: Satisfaction with visit
Model 28: Length of Stay
N=65 N=65
Independent Variables Parameter t-Value Parameter t-Value
Age 0.01 1.505 0.011 1.555
Education 0.07 0.477 0.143 0.924
Income 0.18 1.417 -0.132 -0.977
Gender 0.605 3.14* 0.5 2.447*
Servicescape Purchasing 0.38 2.324* 0.145 0.837
R² 0.379 0.14
F-value 7.197 1.929
Significance 0.000 0.103
*Significant at p= 0.05 level. Table 32 Influence of Infrastructure Purchasing Behavior- Wickenburg
Model 29: Satisfaction with visit
Model 30: Length of Stay
N=65 N=65
Independent Variables Parameter t-Value Parameter t-Value
Age 0.011 1.523 0.012 1.745
Education 0.099 0.643 0.11 0.705
Income 0.184 1.371 -0.097 -0.716
Gender 0.645 3.205* 0.549 2.706*
Infrastructure Purchasing -0.054 -0.366 0.198 1.339
R² 0.324 0.156
F-value 5.643 2.18
Significance 0.000 0.068
*Significant at p= 0.05 level.