![Importance of anisotropy in the spin-liquid … · PHYSICAL REVIEW B 88, 155139 (2013) Importance of anisotropy in the spin-liquid candidate Me 3EtSb[Pd(dmit) 2] 2 A. C. Jacko, Luca](https://static.fdocuments.in/doc/165x107/5b8452a77f8b9aef498c13a1/importance-of-anisotropy-in-the-spin-liquid-physical-review-b-88-155139-2013.jpg)
The importance of liquid alternatives in a portfolio context · The importance of liquid...
38
For professional investors and advisers only. The importance of liquid alternatives in a portfolio context Andrew Dreaneen | Head of Schroder GAIA Product & Business Development This presentation is only for qualified investors attending the Liquid Alternative event. Industry Overview – Schroder GAIA & GAIA II Update
Transcript of The importance of liquid alternatives in a portfolio context · The importance of liquid...

For professional investors and advisers only.
The importance of liquid
alternatives in a portfolio
context
Andrew Dreaneen | Head of Schroder GAIA Product &
Business Development
This presentation is only for qualified investors attending the Liquid Alternative event.
Industry Overview – Schroder GAIA & GAIA II
Update

Agenda
Global hedge fund landscape
Drivers for hedge fund allocations and common misconceptions
Available strategies & setting a framework
Thoughts and considerations for choosing UCITS hedge funds
Schroders capabilities in liquid alternatives
Conclusions
1

Global hedge fund
landscape

Global hedge fund assets
3
Source: HFI Global Autumn Review 2016

Global hedge fund assets
4
Source: HFI Global Autumn Review 2016
Drivers for hedge fund
allocations and common
misconceptions

Global alternative assets
(US$ in trillions) by asset class type
Demand for Alternatives Substantial growth forecasted over the next five years
3,2
4,8
0.9
2.1
0,0
2,0
4,0
6,0
8,0
10,0
12,0
14,0
16,0
18,0
20,0
2012 2015F 2018F 2020F
6
Source: Strategy and PWC 2015
Global alternative assets
(US$ in trillions) by sector
Global alternative assets
(US$ in trillions) by region
8.1
10.8
14.6
18.1
2,8
5,6
1,5
2,5
0,0
2,0
4,0
6,0
8,0
10,0
12,0
14,0
16,0
18,0
20,0
2012 2015F 2018F 2020F0,0
2,0
4,0
6,0
8,0
10,0
12,0
14,0
16,0
18,0
20,0
2012 2015F 2018F 2020F
8.1
10.8
14.6
18.1
8.1
10.8
14.6
18.1
Commodities
Liquid
alternatives
Institutional
loans
Real estate
Hedge funds
Private equity
Sovereign
wealth funds
Insurers
High-net-worth
Mass affluent
Pension funds
Middle East
and Africa
Latin America
Asia-Pacific
Europe
North America
0.5
1.0

$Bn Club of UCITS Absolute Return Investors Reasons for Allocating
7
Source: Morgan Stanley Absolute Return UCITS Survey Results November 2015. 155 Respondents with Absolute Return UCITS AUM: $91bn
Source: Schroders as at 30 September 2016 (strategy inception for each manager). *Please not Two Sigma is based on simulated returns, please refer to the full simulated
performance disclaimers at the back of the presentation
Providing uncorrelated
returns to overall
portfolio; 55%
Reduce equity beta; 6%
Substitute for fix income
exposure; 8%
Managing cash to offset illiquid
instruments; 7%
Simply look for outperformance
; 22%
Reduced duration risk;
2%
Investment considerations for Allocating
S&P 500 MSCI
World
MSCI AC
Asia
Pacific
ML High
Yield
index
HFRI
Egerton 0.47 0.50 - - 0.68
Sirios 0.42 0.47 - - 0.60
Indus - 0.66 0.79 - 0.74
Paulson 0.24 0.28 - - 0.39
BSP - - - 0.03 0.08
NGA 0.54 - - 0.71 0.65
BlueTrend 0.00 0.03 - 0.03 0.14
Two
Sigma* -0.23 -0.23 - -0.18 -0.16
Cat Bond -0.08 -0.02 - 0.09 -0.02

Ex
am
ple
s
93.2 60.1 50.6
58 207 185
45.7% 29.5% 24.8%
Who are the main providers of liquid alternatives today?
Hedge Fund Managers Long Only Asset Managers Convergence Asset Managers
# P
rod
uc
ts
Source: HFR, HFI, Strategic Consulting analysis, as at 30 September 2015.
AU
M (
US
Db
n)
8
Using distribution capabilities to build alternatives businesses Marketing HF expertise to UCITS investor base
AUM dominated by Asset Managers 75%: but Hedge Fund Managers now 25%
% A
UM

US Based Managers Abrams Capital Management GMT Capital
Adage Capital Management GoldenTree Asset Management
Anchorage Capital Group Greenlight Capital
Angelo, Gordon & Co. HBK Capital Management
Apollo Management Highfields Capital Management
Appaloosa Management JANA Partners
Avenue Capital Group Kayne Anderson Capital Advisors
Bain Capital/Brookside Capital Partners King Street Capital Management
Balyasny Asset Management Lone Pine Capital
Baupost Group Luxor Capital Group
Blue Ridge Capital Magnetar Capital
BlueMountain Capital Management Marathon Asset Management
Bracebridge Capital Mariner Investment Group
Bridgewater Associates Mason Capital Management
Carlson Capital Millennium Management
Caxton Associates Monarch Alternative Capital
Centerbridge Partners Moore Capital Management
Cerberus Capital Management MSD Capital
Citadel Pennant Capital Management
Coatue Capital Perry Capital
Convexity Capital Management Pershing Square Capital Management
Corvex Management Pine River Capital Management
D.E. Shaw Group PointState Capital
Davidson Kempner Capital Management Renaissance Technologies
Discovery Capital Management Samlyn Capital
DW Partners Scopia Capital
EJF Capital Senator Investment Group
Element Capital Silver Point Capital
Ellington Management Group Soroban Capital Partners
Elliott Management Corporation Steadfast Capital Management
Emerging Sovereign Group Taconic Capital Advisors
Eton Park Capital Management Third Point
Farallon Capital Management Tiger Global Management
Fir Tree Partners Trian Fund Management
First Quadrant ValueAct Capital Management
Glenview Capital Management Viking Global Investors
AQR Capital Management Maverick Capital
Beach Point Capital Management MKP Capital Management
Blackstone Group/GSO Capital Partners Och-Ziff Capital Management Group
Canyon Capital Advisors Omega Advisors
Fortress Investment Group Paulson & Co.
Graham Capital Management Tudor Investment Corp
Grantham, Mayo, Van Otterloo Two Sigma Investments
Halcyon Asset Management Visium Asset Management
Indus Capital Partners York Capital Management
UK Based Managers Capula Investment Management LLP
Lansdowne Partners
The Children's Investment Fund
AKO
Brevan Howard Asset Management LLP
Cheyne Capital Management
CQS (UK) LLP
Egerton Capital
Marshall Wace LLP
Odey Asset Management
Winton Capital Management Limited
Man GLG
The $5 billion dollar hedge fund club Many of the largest hedge fund managers now available in UCITS
Source: Schroders analysis and HFI data based on US and UK headquartered hedge fund centric managers with $5bn+ AUM data as at 01 January 2015. Those launched UCITS
funds in blue as at 31 May 2016.
75%
20%
9

Performance comparison UCITS vs. offshore hedge funds
Despite limitations, liquid alts can provide similar benefits
to hedge funds
10
Source: HFR as of 30 September 2016
Industry performance
HFRI HFRU
Number of
funds 2,200 500
Regulatory
regime Flexible UCITS
Opportunity set
Index YTD 2016 F/Y2015 F/Y 2014 Annualised
Return
Annualised
Volatility Drawdown Months to Recover
Correlation
to S&P 500 (5
years)
Traditional Hedge Fund HFRI Offshore Hedge Fund
Weighted Composite Index 4.2% -1.1% 3.0% 2.6% 6.4% -20.1% 14 0.85
Liquid Alternatives HFRU UCITS Hedge Fund
Composite Index 0.5% 1.5% 4.7% 1.9% 3.3% -6.3% 10 0.68
-30%
-20%
-10%
0%
10%
20%
30%
2008 2009 2010 2011 2012 2013 2014 2015 2016
HFRI Fund Weighted Composite Index HFRU Hedge Fund Composite Index

Available strategies &
setting a framework
233
112
106
61
59
49
41
32 25
24
14
Long / Short Equity
Global Macro
Fixed Income
Equity Market Neutral
CTA
Emerging Markets
Multi-Strategy
Event-Driven
Currency
Volatility
Commodities
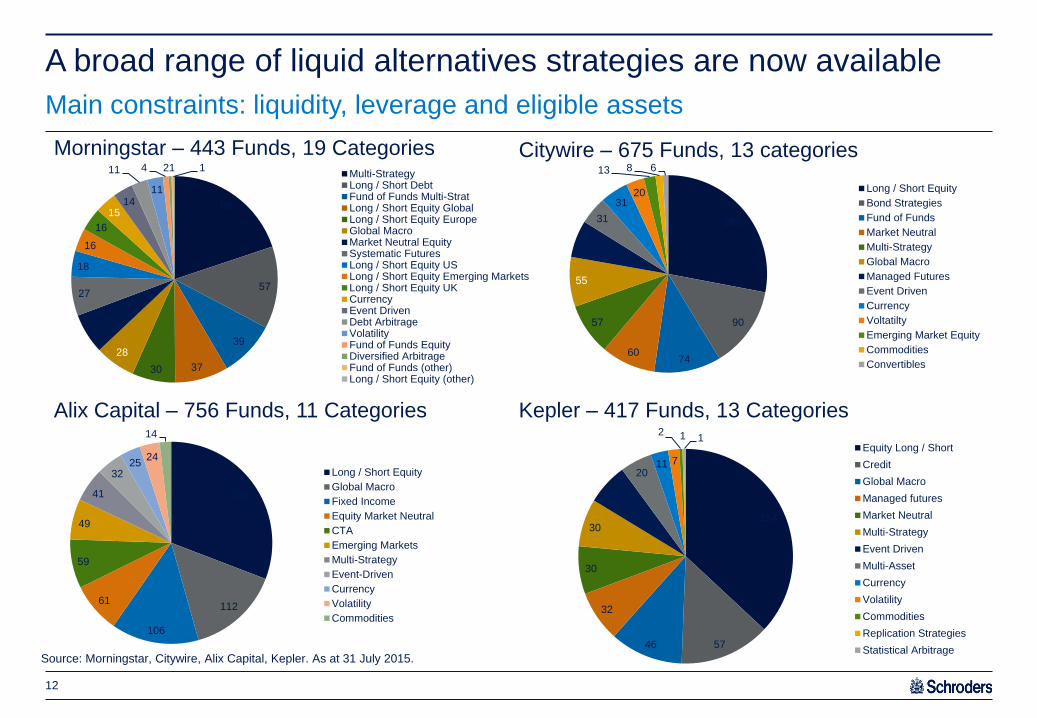
A broad range of liquid alternatives strategies are now available
Source: Morningstar, Citywire, Alix Capital, Kepler. As at 31 July 2015.
12
88
57
39
37 30
28
28
27
18
16
16
15 14
11
11
4 2 1 1 Multi-StrategyLong / Short DebtFund of Funds Multi-StratLong / Short Equity GlobalLong / Short Equity EuropeGlobal MacroMarket Neutral EquitySystematic FuturesLong / Short Equity USLong / Short Equity Emerging MarketsLong / Short Equity UKCurrencyEvent DrivenDebt ArbitrageVolatilityFund of Funds EquityDiversified ArbitrageFund of Funds (other)Long / Short Equity (other)
Morningstar – 443 Funds, 19 Categories
189
90
74 60
57
55
41
31
31 20
13 8 6
Long / Short Equity
Bond Strategies
Fund of Funds
Market Neutral
Multi-Strategy
Global Macro
Managed Futures
Event Driven
Currency
Voltatilty
Emerging Market Equity
Commodities
Convertibles
154
57 46
32
30
30
26
20 11 7
2 1 1 Equity Long / Short
Credit
Global Macro
Managed futures
Market Neutral
Multi-Strategy
Event Driven
Multi-Asset
Currency
Volatility
Commodities
Replication Strategies
Statistical Arbitrage
Alix Capital – 756 Funds, 11 Categories Kepler – 417 Funds, 13 Categories
Citywire – 675 Funds, 13 categories
Main constraints: liquidity, leverage and eligible assets
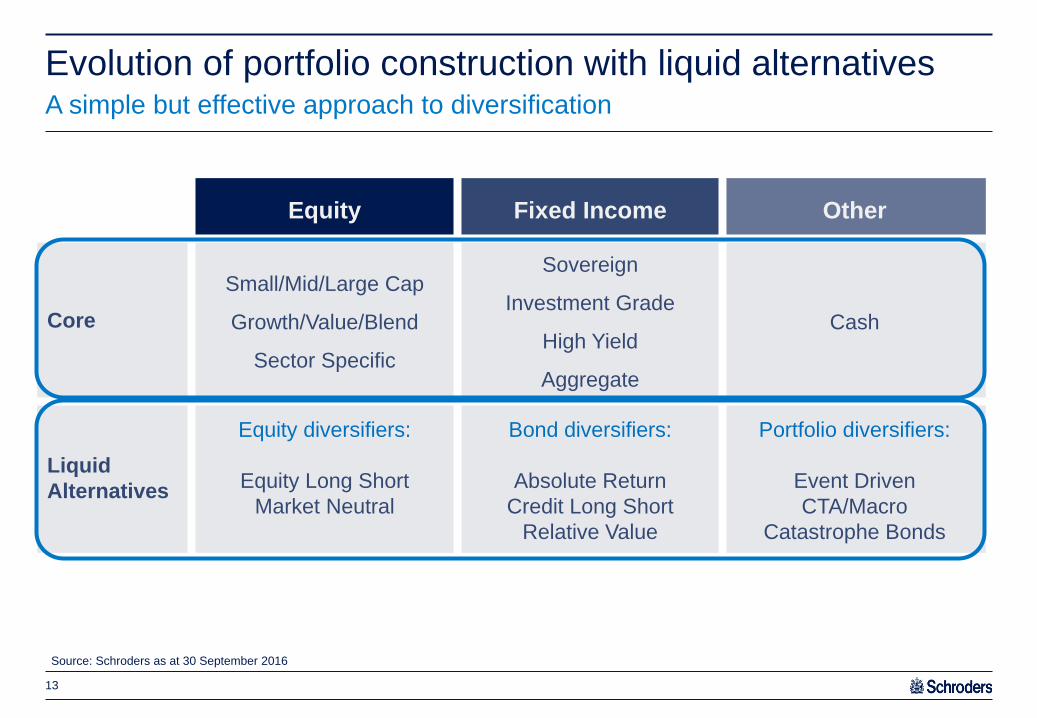
Equity Fixed Income Other
Core
Small/Mid/Large Cap
Growth/Value/Blend
Sector Specific
Sovereign
Investment Grade
High Yield
Aggregate
Cash
Liquid
Alternatives
Equity diversifiers:
Equity Long Short
Market Neutral
Bond diversifiers:
Absolute Return
Credit Long Short
Relative Value
Portfolio diversifiers:
Event Driven
CTA/Macro
Catastrophe Bonds
Evolution of portfolio construction with liquid alternatives A simple but effective approach to diversification
13
Source: Schroders as at 30 September 2016
0,00%
1,00%
2,00%
3,00%
4,00%
5,00%
6,00%
4,00% 6,00% 8,00% 10,00% 12,00% 14,00% 16,00% 18,00%
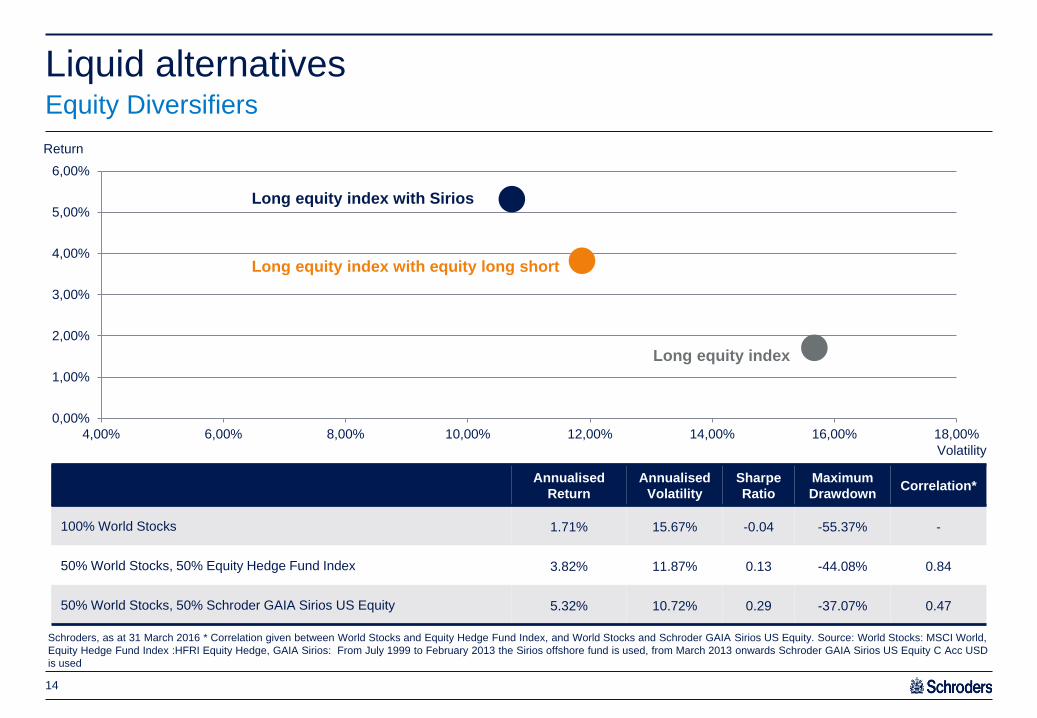
Liquid alternatives Equity Diversifiers
14
Schroders, as at 31 March 2016 * Correlation given between World Stocks and Equity Hedge Fund Index, and World Stocks and Schroder GAIA Sirios US Equity. Source: World Stocks: MSCI World,
Equity Hedge Fund Index :HFRI Equity Hedge, GAIA Sirios: From July 1999 to February 2013 the Sirios offshore fund is used, from March 2013 onwards Schroder GAIA Sirios US Equity C Acc USD
is used
Annualised
Return
Annualised
Volatility
Sharpe
Ratio
Maximum
Drawdown Correlation*
100% World Stocks 1.71% 15.67% -0.04 -55.37% -
50% World Stocks, 50% Equity Hedge Fund Index 3.82% 11.87% 0.13 -44.08% 0.84
50% World Stocks, 50% Schroder GAIA Sirios US Equity 5.32% 10.72% 0.29 -37.07% 0.47
Volatility
Return
Long equity index with equity long short
Long equity index
Long equity index with Sirios

0%
1%
2%
3%
4%
5%
6%
4,00% 4,50% 5,00% 5,50% 6,00% 6,50% 7,00% 7,50% 8,00%
Liquid alternatives Portfolio Diversifiers - CTA
15
Schroders, as at 31 March 2016 *Correlation given between a portfolio of 20% Cash, 40% World Stocks, 40% World Bonds and CTA index, followed by Bluetrend. Source: Cash :USD 1M LIBOR,
World Stocks: MSCI World, World Bonds: Barclays Global Aggregate, CTA Index: Newedge CTA Index, Bluetrend: BlueTrend Fund Limited (Class A USD) inception date was 1 April 2004. The
management fee for Class A Shares was 1.5% from inception to 30 June 2011 and 2% from 1 July 2011 to 31 July 2014.
Volatility
Annualised
Return
Annualised
Volatility
Sharpe
Ratio
Maximum
Drawdown Correlation*
20% Cash, 40% World Stocks, 40% World Bonds 3.59% 7.37% 0.25 -25.97% -
32% World Stocks, 32% World Bonds, 16% Cash, 20% CTA Index 3.62% 6.16% 0.30 -19.24% 0.05
32% World Stocks, 32% World Bonds, 16% Cash, 20% Bluetrend 5.13% 6.81% 0.49 -16.43% 0.12
Return
Traditional portfolio with CTA index
Traditional portfolio
Traditional portfolio with BlueTrend
Thoughts and
considerations for
choosing UCITS
hedge funds

UCITS Hedge Fund vs. Offshore Hedge Fund High level considerations
17
UCITS hedge fund Offshore hedge fund
Prime broker Requirement to have an independent custodian
so
typical prime broker arrangement is not possible
Prime broker
Eligible Assets Prescribed includes by of way of example cash,
transferable securities, derivatives, funds
Flexible
Commodities, Property Excludes commodity futures, limited to equities,
ETFs,
and financial indices
Can also invest in derivatives on individual
commodities, properties, and physical
property/commodities
Borrowing Limited to 10% on a temporary basis Can borrow e.g. up to 200% on a permanent
basis
Leverage 200% global exposure or prescribed VaR limit Flexible
Short sales Short sales not permitted, can only seek short
exposure via derivatives
Short sales permitted
Diversification 5/10/40 Flexible
Minimum dealing/
valuation frequency
Twice monthly (typically weekly) Annually although most monthly or quarterly

Rigorous manager selection process and monitoring Overview
18
Source: Schroders, 30 September 2016
Strategy selection
Investment due diligence
Operational due diligence
Ongoing risk management
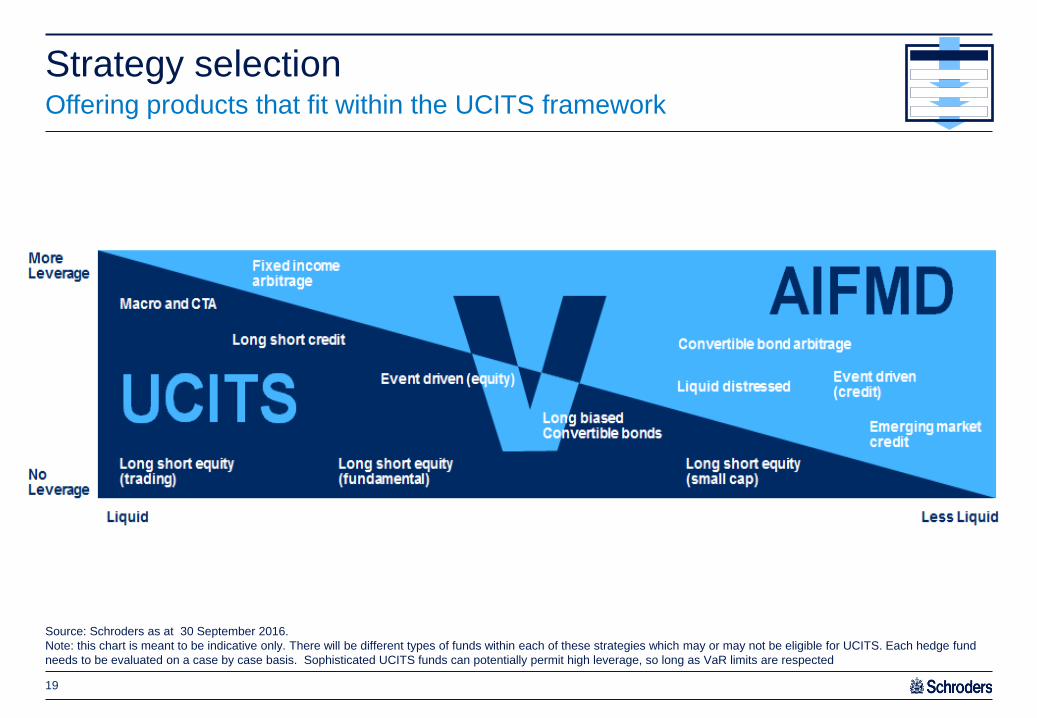
Strategy selection Offering products that fit within the UCITS framework
19
Source: Schroders as at 30 September 2016.
Note: this chart is meant to be indicative only. There will be different types of funds within each of these strategies which may or may not be eligible for UCITS. Each hedge fund
needs to be evaluated on a case by case basis. Sophisticated UCITS funds can potentially permit high leverage, so long as VaR limits are respected

GAIA Investment Committee
Investment manager selection Full due diligence performed based on key requirements for a given strategy
20
Source: Schroders, as at 30 September 2016
Experience
Track record and skill
Investment process
Integrity
Size
Reputation
Investment due diligence
Risk management capabilities
Fit with regulatory requirements
– Investment diversification rules
– Asset eligibility
– Market & liquidity risks
Preliminary regulatory
compatibility assessment
Initial review of available regulatory, marketing, and personnel materials
Full documentation review covering all key business areas
Onsite visit including thorough validation of all points and processes raised in the documentation review
Operational due diligence

Group due diligence Independent group due diligence process
21
Source: Schroders, as at 30 September 2016
Full background check review on entire firm and employees
Initial high level RFI
Key financial and insurance policy verification undertaken
Internal stakeholder review and sign off
Detailed review of:
Organisational structure
Investment risk/Operational risk framework including capabilities of managing a regulated fund
Compliance: Key policies and procedures to be provided
Operation: How a fund is managed in a regulated environment
Full IT/Security/BCP to ensure minimum Schroders/industry best practices
A full review and discussion with the investment manager
On-desk review of end-to-end processes. Testing of processes and output validation
Challenging the RFI responses where appropriate (based on internal review)
Explanation of how GAIA operates and how the Manager will need to adapt to its framework
DD
conclusion
and ongoing
monitoring
Post DD visit, conclusion report issued to senior management
Integration planning and launch of product commences with Lux and Manager
Group policy dictates annual RFI review with an on-site visit every two years
Pre-full
DD review
Full DD and
RFI review Onsite
review

Monthly GAIA risk meetings
Monthly monitoring by Schroder GAIA Investment Committee
Quarterly monitoring by Schroder GAIA II Board
Robust risk management with independent oversight and governance
Source: Schroders, 30 September 2016
Schroder GAIA risk management framework Several layers of risk management oversight for each hedge fund
22
Investment manager risk controls
Pre-trade compliance
Daily reviews
Portfolio limits/risk controls (leverage, liquidity, sector, single position, VaR)
Independent regulatory risk and compliance monitoring
Post-trade compliance monitoring
Investment risk monitoring: counterparty risk, liquidity, global exposure, VaR
Independent daily risk oversight
Performed by specialist hedge fund analysts in conjunction with multi asset risk team
Investment guidelines/stress tests/style drift/exposures/performance
Operational due diligence
Initial detailed operational due diligence
On-going monitoring of original due diligence findings
Annual update of initial report, biennial formal update including on site visit
Governance meetings
NGA

Extensive global and local distribution support Over 250 distribution professionals servicing clients in >30 countries
23
Source: Schroders, as at 31 August 2016
US offshore Netherlands
Denmark
Germany
Switzerland
Austria
UK
Luxembourg
Spain
Italy
Portugal
France
Sweden
Finland
Norway
Greece
Belgium
Ireland China
Hong Kong
Korea
Japan
Singapore
Taiwan Brazil
Colombia
Chile
Peru
Panama
Uruguay
Argentina
Mexico
Israel
Dubai

Targeted fund information for investors
globally
Active support for global intermediary partners
Comprehensive marketing information
Fund launch video
Dedicated website
Monthly factsheets
Quarterly letters
Quarterly webcasts
Peer analysis
Specialised client reports
Explanatory sales documents
Sales support
Transparent client-friendly marketing materials Ensures investors are well informed
24
Source: Schroders, as at 30 September 2016

Introducing
Schroder GAIA

Launch date Manager Fund Strategy Geographic focus AUM (USD)
2 Mar 2016 Schroder GAIA II NGA Turnaround Distressed Predominantly US 12m
Schroder GAIA
Schroder GAIA and Schroder GAIA II Overview of sub-funds
26
Total AUM 5,159m Source: Schroders as at 30 September 2016 *Hard closed, but subject to Capacity Restricted Dealing.
Schroder GAIA II
Launch date Manager Fund Strategy Geographic focus AUM (USD)
25 Nov 2009 Schroder GAIA Egerton Equity* Equity long short Global 1,377m
27 Feb 2013 Schroder GAIA Sirios US Equity Equity long short Predominantly US 1,366m
21 Oct 2013 Schroder GAIA Cat Bond Catastrophe Bonds Global 1,099m
25 Jun 2014 Schroder GAIA Paulson Merger Arbitrage Merger Arbitrage US, Canada and Western Europe
503m
17 Jun 2015 Schroder GAIA BSP Credit Credit long short Predominantly US 35m
9 Dec 2015 Schroder GAIA BlueTrend Trend Following Global 350m
6 Jul 2016 Schroder GAIA Indus PacifiChoice Equity long short Pan Asian including
Japan 92m
24 Aug 2016 Schroder GAIA Two Sigma Diversified Equity Market Neutral /
Systematic Macro Predominantly US 325m

Independent money management firm based in London, founded in 1994
by John Armitage
Experienced investment team of 16 professionals
Employee investments account for c. 7% of total firm assets
Key to success is research-intensive stock picking. ‘Bottom-up’ approach
to stock selection creates a portfolio that is dynamic, eclectic, and
uncorrelated
The strategy aims to deliver equity type returns with less volatility than the
market over the medium to long term
Egerton Capital Limited: AUM $14.6bn Performance objective
Schroder GAIA Egerton Equity Equity long short fund with significant outperformance over time
27
Source: Schroders and Egerton as at 31 August 2016. *Performance shown for chain-linked track record of Egerton long short Equity B1 USD since its inception in September 1994. Egerton’s
offshore fund has been used from December 1994 to November 2009. From December 2009 onwards Schroder GAIA Egerton Equity C Acc USD Hedged has been used. MSCI World Index is used.
Performance is shown net of fees, NAV to NAV.
Performance analysis (Egerton’s equity long short strategy*)
Fundamental long short equity fund, typically long-biased
Straightforward, liquid strategy investing predominantly in large cap equities
Opportunistically invest in corporate bonds
Uses little or no leverage
Reduces volatility through the use of alpha shorts, hedges (e.g. index put
options) and cash
Avoids large drawdowns
Fund key features
Strategy* Index
Annualised return 13.3% 6.7%
Annualised volatility 9.6% 14.0%
Sharpe ratio 1.1 0.3
Maximum drawdown -28.3% -50.8%
Portfolio Manager John Armitage, Egerton
Inception date 25 November 2009
Base currency EUR
Institutional share class fee 1.25%/20%
Liquidity Weekly (on Wed) and month end
0%
500%
1000%
1500%
2000%
19
94
19
95
19
96
19
97
19
98
19
99
20
00
20
01
20
02
20
03
20
03
20
04
20
05
20
06
20
07
20
08
20
09
20
10
20
11
20
12
20
13
20
14
20
14
20
15
Schroder GAIA Egerton Equity Strategy MSCI World

Egerton Long/Short vs. Schroder GAIA Egerton Equity Similarities and differences between GAIA Egerton UCITS and Cayman fund
28
The Egerton Long/Short strategy can operate comfortably within the UCITS framework. However, there will be performance divergence through time as a result of the differences
outlined above
Source: Sirios as at 30 September 2015
Egerton Long/Short Schroder GAIA Egerton
Equity
Investment manager John Armitage, Egerton Capital
Investment strategy Market directional equity long short
Portfolio liquidity Liquid portfolio focussed on mid/ large cap securities
Leverage/ gross
exposure Max 150%
Typical number of
positions
Longs 40 – 60 positions
Shorts 60 – 100 positions
Long exposure
(single securities) Mainly physical securities/ occasionally synthetic
Short exposure
(single securities)
Mainly physical
securities/occasionally
synthetic
Always synthetic (UCITS
requirement)
Options Occasionally used for hedging (single name and indices)
Institutional fees 1.00%/15% performance fee 1.25%/15% performance fee
Dealing frequency Monthly (30 days notice) Weekly (3 days notice)
Minimum investment $1m $500,000
90
100
110
120
130
140
150
160
170
180
190
nov/09 nov/10 nov/11 nov/12 nov/13 nov/14 nov/15
Schroder GAIA Egerton Equity C Acc EUR
Egerton European Equity Fund Ltd - Class B

Globally renowned hedge fund founded by John Paulson in 1994
Strategies include merger arbitrage, event-driven, credit and special situations’.
The merger funds have one of the longest and most successful track records, compounding at 11.2% over the last 22 years**
Proven team of 54 experienced investment professionals consisting of both sector and M&A transaction specialists
The fund targets an absolute return of 8 – 10% net of fees
Paulson & Co. AUM $11.1bn* Performance objective
Schroder GAIA Paulson Merger Arbitrage Superior risk-adjusted returns that are uncorrelated to the broader markets
29
Source: Schroders as at 31 August 2016. * Paulson as at 1 September 2016. **Inception July 1994 . Performance shown for Paulson Partners LP from July 1994 until June 2014 and Schroder GAIA
Paulson Merger Arbitrage C Acc USD has been used from July 2014 onward. Performance is shown net of fees, NAV to NAV.
Performance analysis (Paulson Partners LP**)
An absolute return focused merger arbitrage UCITS fund looking at
opportunities in US, Canada and Europe
Predominantly listed equities with opportunistic exposure to credit
Aims to deliver returns in all market cycles by using different strategies. ie;
cash/stock deals, topping bids, bankruptcies, restructurings
High potential for alpha generation given sophisticated investment approach
seeking unique and complex merger situations
Capital preservation, low correlation to markets and low volatility – just 2
down years since inception in 1994 and returned +7.9% in 2008
Portfolio Managers John Paulson, Andrew Hoine, Jim Hoffman
Inception Date 25 June 2014
Base Currency USD
Institutional share class fee 1.25%/20%
Liquidity Weekly (on Wed) and month end
Ann. Ret. Ann. Vol. Correlation to Paulson
Paulson Merger Arbitrage** 11.2% 9.5% 1.00
S&P500 9.5% 14.9% 0.24
HFRI Merger Arbitrage
Index 7.1% 3.5% 0.43
Fund key features
0%
200%
400%
600%
800%
1000%
1200%
1400%
1994 1996 1998 1999 2001 2003 2005 2006 2008 2010 2012 2013 2015Schroder GAIA Paulson Merger ArbitrageStrategy

Paulson Partners LP vs. Schroder GAIA Paulson Merger Arbitrage
Main similarities and differences between GAIA Paulson UCITS and US Onshore fund
30
Paulson Partners LP Schroder GAIA Paulson Merger
Arbitrage
Investment manager John Paulson, Paulson & Co.
Investment strategy Merger Arbitrage
Portfolio liquidity Liquid portfolio focussed on mid/ large cap securities
Leverage/gross
exposure
Leverage of up to 1.5x of the long
market value in the portfolio and 2.0x
of the long plus short market value in
the portfolio
200%
Typical number of
positions 30 – 60, diversified across geography, sector and instrument type
Long exposure
(single securities)
Mainly physical
securities/occasionally synthetic
Mainly synthetic
securities/occasionally physical
Short exposure
(single securities)
Mainly physical
securities/occasionally synthetic
Always synthetic (UCITS
requirement)
Asset classes
Predominantly listed equity with
opportunistic
exposure to credit
Bank debt, commodities and
private/restricted equity are not
permitted within UCITS
Concentration Issuer Size (at cost) <12%
Issuer Size (at market) <18% Restricted by UCITS 5/10/40 rule
Fees 1.0%/20% performance fee 1.25%/20% performance fee
Dealing frequency Quarterly (60 days notice) Weekly and month end (3 days
notice)
Minimum
investment $5m $500,000
Source: Schroders and Paulson & Co. as at 31 July 2015
65
70
75
80
85
90
95
100
105
110
jun/14 dez/14 jun/15 dez/15 jun/16
Schroder GAIA Paulson Merger Arbitrage C Acc USD
Pauslon Partners LP

-50%
0%
50%
100%
150%
200%
250%
300%
Jan-0
4
Aug
-04
Ma
r-0
5
Oct-
05
Ma
y-06
Dec-0
6
Jul-0
7
Fe
b-0
8
Sep
-08
Apr-
09
Nov-0
9
Jun-1
0
Jan-1
1
Aug
-11
Ma
r-1
2
Oct-
12
Ma
y-13
Dec-1
3
Jul-1
4
Fe
b-1
5
Sep
-15
Apr-
16
BlueTrend Barclays Global Aggregate Bond Index
HFRI Fund Weighted Composite Index MSCI WorldInvestment team Head Leda Braga
Inception date 9 December 2015
Base currency USD
Institutional share class fee 1.50%/20%
Liquidity Weekly (on Wed) and month end
Systematica founded in January 2015 after a decade of experience within
BlueCrest Capital Management
Systematica manage total assets of $9.5bn, with $7.4bn in their trend-
following strategy*
Investment team headed by Leda Braga, former President and Head of
Systematic Trading at BlueCrest Capital Management
The fund aims to provide capital growth by adopting a pure systematic trend
following strategy, across global markets, based on quantitative signals with
multiple time horizons. It targets returns of 10-15%.
Investment Manager: AUM $9.5 bn* Performance objective
Schroder GAIA BlueTrend Diversified Systematic Macro Trend Following Strategy
31
Source: Systematica Investments and Schroders, as at 31 August 2016. * Systematica Investments, as at 1 August 2016. AUM data based on estimates, and is subject to change. Managed by BlueCrest Capital Management Group from inception
to 1 January 2015 when Systematica Investments Limited (acting in its capacity as general partner of Systematica Investments LP) became the investment manager. **BlueTrend strategy refers to an SMA from January 2004 to March 2004 and
BlueTrend Fund Limited (Class A USD) from 1 April 2004 to 31 December 2015. From 1 January 2016 onwards performance is provided for Schroder GAIA BlueTrend C Acc USD. Performance is shown net of fees, NAV to NAV.
Performance analysis (BlueTrend strategy**)
Diversified systematic trend following fund, launched in April 2004
Extremely competitive track record with average annualised return of 10%,
with 14% annualised volatility
Positive in 9 out of the past 10 years
Uncorrelated returns over time/delivered positive returns in both up and
down markets
Performed well in periods of prolonged market downturns like 2008
Trades the most liquid assets among equity, currency, commodity and
fixed income
Strategy
Annualised return 9.8%
Annualised volatility 14.1%
Maximum drawdown -22.1%
Fund key features

BlueTrend vs. Schroder GAIA BlueTrend
Main similarities and differences between GAIA BlueTrend UCITS and offshore fund
32
BlueTrend Master Fund Limited Schroder GAIA BlueTrend
Investment
manager
Systematica Investments Limited (acting as a general partner of
Systematica Investments LP)
Investment
strategy Trend Following
Domicile Cayman Islands Luxembourg
Portfolio liquidity Liquid and diversified portfolio across 200 markets
Leverage/gross
exposure 600% – 2,300%
Long/short
exposures Futures
Asset classes Commodities, FX, Bonds, Equity Indices
Government
concentration No restrictions
Government exposure
replicated through IRS (no
govt. exposure over 100%
per UCITS regulations)
Fees 1.50% / 20% performance fee* 1.50% / 20%** performance
fee
Dealing frequency Monthly (30 days’ notice) Weekly and month-end (3
days’ notice)
Minimum
investment US$1m US$500,000*
*For investments up to $75 million. **C share class. Please note these are the stated management and performance fees and do not include other administrative fees.
Source: Schroders and Systematica Investments, as at 30 September 2016.
85
90
95
100
105
110
115
jan/16 mar/16 mai/16 jul/16 set/16
Schroder GAIA BlueTrend C Acc BlueTrend Offshore

Conclusion
Source: Schroders, September 2016
33
Liquid Alternatives represent a new and rapidly growing asset class for investors
Whilst UCITS has a number of constraints, many hedge fund strategies can be run
comfortably within the framework
Long short strategies make sense now to help diversify client portfolios
Investors should consider blending long only strategies together with long short
strategies, and include alternative funds within the core portfolio as opposed to an
alternatives bucket
Fund selectors should focus on established managers that have a proven track record
of producing consistent risk adjusted returns
Emphasis should be on strategies with uncorrelated returns streams, reduced volatility
and proven downside protection
Schroders offers a broad range of liquid alternative funds including a leading platform
of external managers

Two Sigma Diversified simulated returns Methodology
34
The return stream presented in the next slide seeks to reflect the simulated performance of a hypothetical portfolio focused on liquid strategies in US equity,
futures and FX markets for the period referenced. Specifically, the hypothetical portfolio is constructed by allocating (a) 15% of the portfolio’s capital in support of
a managed futures portfolio (the “Macro" portfolio) and (b) 85% of the portfolio’s capital in support of an equity market neutral portfolio (the "Equity" portfolio, and
together with Macro portfolio, the “Adjusted Results”). The simulated performance of the hypothetical portfolio were then each further modified on a pro-forma
basis to adjust performance and volatility based on certain historically-perceived variables: (i) volatility was adjusted by scaling the simulated performance of the
hypothetical portfolio in a given year such that volatility is presented half-way between the hypothetical volatility result and targeted volatility (8.0%) and (ii)
performance was discounted by subtracting 75% of the average monthly simulated performance of the Adjusted Results. In each case, “Gross Returns” of Class
C Shares are gross of fees and estimated operating expenses and net of estimated trading expenses. "Net Returns” of Class C Shares are net of a hypothetical
1.4% annualized management fee accrued and paid monthly in advance and a hypothetical 20% performance fee (or allocation) accrued monthly and paid
annually (subject to standard high water mark, where applicable), but are gross of estimated operating expenses and net of estimated trading expenses. Please
note that fees vary by share class and additional fees and fund expenses apply.
The simulated strategy's settings or investment methodology may not be representative of any future portfolio due to, among other things, the addition or deletion
of trading models, changes in optimization settings, changes in model weightings and other variables. The simulated and/or pro-forma performance results shown
are for illustration purposes only as part of an ongoing business discussion with a sophisticated party and should not be relied upon when making an investment
decision. Certain factors will likely cause the simulations to generate better performance than live trading of the associated strategy. These factors (which are
further discussed on the last page of this report) include, but are not limited to, the following: (i) the simulations benefit from the use of the most recent models,
research and optimizer settings used by Two Sigma (as defined below), all of which have been tested historically and in most cases have been fit to a period
similar to the one shown and, therefore, benefit from portfolio settings that have been found to be optimal for such time period (e.g., more risk is taken in the
simulations than would otherwise likely have been taken during periods of high volatility or deemed systemic risk); and (ii) the lack of operating expenses which, if
included, would degrade performance in a compounded fashion over time. The last page of this document provides important details regarding these simulated
performance statistics, which are subject to the explanations and disclaimers discussed therein. Past performance, especially simulated performance, is not an
indicator or guarantee of future results

The simulated performance results shown above are for illustrative purposes only and were prepared for the recipient as part of ongoing discussions. Two Sigma Advisers, LP (the “Investment Manager”) has worked with its affiliated investment adviser, Two Sigma Investments, LP (together with the Investment Manager, "Two Sigma") to engineer certain software that attempts to simulate the trading patterns that would have resulted had the Investment Manager utilized certain quantitative trading models over the period of January 1, 2005 through the date of this report. These simulated results should not be relied upon.
These simulated results are based largely on historical information available from certain proprietary databases of Two Sigma compiled, in part, from multiple commercially available data sources, as well as certain assumptions made by Two Sigma about, among other things, trade execution, financing and market impact costs. While Two Sigma has expended considerable efforts attempting to clean and cross-check these inputs, Two Sigma cannot and has not independently verified the accuracy or completeness of such information, nor have the results of the simulation been independently verified or audited. Should any information used in the above simulation prove to be inaccurate, the simulated results themselves may be inaccurate.
In addition, all simulated results have many inherent limitations. In particular, simulated results are often prepared with the benefit of hindsight, meaning models utilized in these simulations may have been developed explicitly with the benefit of data from the time period covered by these simulations. Additionally, simulated results do not involve financial risk or reflect actual trading under actual market conditions and do not reflect the ability to withstand losses or to adhere to an investment program despite trading losses. The simulation was also performed using only a finite number of variables. The actual performance of any trading program the Investment Manager ultimately elects to employ in the future will from time to time be dependent on, and influenced by, any number of factors, many of which (i) have not been taken into account in performing the simulation; (ii) are inherently difficult to quantify; and (iii) are outside the Investment Manager's control. Due to the nature of simulations, it is likely that actual trading performance will be materially lower than the simulated performance set forth herein.
Simulations were run using Two Sigma's tradable universe of global futures, currencies, and equities that met proprietary inclusion criteria intended to foster, among other goals, adequate liquidity and issuer uniqueness, as well as a number of other factors.
The tradable universe of global futures, currencies and equities, as well as trading models used by Two Sigma have evolved and are likely to continue to evolve over time. There can be no assurance that the trading program pursued by the Investment Manager on behalf of any of its investment products in actual trading will be the same or substantially the same as the ones that were subjected to the above simulation.
Future performance may be affected by existing and/or new events or factors, which may or may not have played any material role in the past. Therefore no assurance or guarantee can be given that the actual trading results achieved using those strategies and/or models employed during this simulation, and/or others that are being used and/or may be used in the future, are or will be as successful and/or achieve the same results as those presented above. Past performance, especially simulated performance, is not an indicator or guarantee of future results.
The results of the simulation are being provided to you by the Investment Manager solely to assist you in considering your potential interest in making an investment in a potential future investment product to be managed by the Investment Manager.
In the event of any conflict between this document and the prospectus, the prospectus shall prevail. The securities discussed herein shall not be offered or sold, nor shall there be any solicitation of any offer to buy such securities, in any jurisdiction in which such offer, sale or solicitation would be unlawful until the requirements of the laws of such jurisdictions have been satisfied.
An investment in any investment product is speculative and involves significant risk, including the risk of a total loss of capital. Opportunities for withdrawal or transfer of interests in a strategy may be limited and therefore an investor may not have access to its capital when it desires.
This information is being furnished to the recipient on a confidential basis, is not intended for public use or distribution, and by accepting this file, you agree to keep confidential the existence of this document and the information contained herein. The recipient should not disclose, reproduce, distribute or otherwise make available the existence of and/or all or any portion of the information contained herein to any other person (other than its employees, officers and advisors on a need-to-know basis, whom the recipient will cause to keep the information confidential) without Schroders and the Investment Manager's prior written consent.
Important Information regarding simulated returns
35

Risk Considerations
For professional investors and advisers only. This material is not suitable for retail clients.
This document is intended to be for information purposes only and it is not intended as promotional material in any respect. The material is not intended as an
offer or solicitation for the purchase or sale of any financial instrument. The material is not intended to provide, and should not be relied on for, accounting, legal or
tax advice, or investment recommendations.
Important Information
The views and opinions contained herein are those of Schroder Investment Management (Switzerland) AG, and may not necessarily represent views expressed
or reflected in other Schroders communications, strategies or funds. This document is intended to be for information purposes only and it is not intended as
promotional material in any respect. The material is not intended to provide, and should not be relied on for, accounting, legal or tax advice, or investment
recommendations. Information herein is believed to be reliable but Schroders does not warrant its completeness or accuracy. The data has been sourced by
Schroders and should be independently verified prior to further publication or use. No responsibility can be accepted for errors of fact or opinion.
This document does not constitute an offer to anyone, or a solicitation by anyone, to subscribe for shares of Schroder GAIA and Schroder GAIA II (the
“Companies”). Nothing in this document should be construed as advice and is therefore not a recommendation to buy or sell shares. The offering of shares in
certain jurisdictions may be restricted and accordingly persons are required, by the Companies, to inform themselves of and observe any such restrictions.
Subscriptions for shares of the Companies can only be made on the basis of its latest prospectus together with the latest audited annual report (and subsequent
unaudited semi-annual report, if published). The prospectus, the key investor information document(s) for Switzerland (if available), the articles of association, the
annual and semi-annual reports can be obtained, free of charge, at the offices of the Swiss representative, Schroder Investment Management (Switzerland) AG,
Central 2, P.O. Box, CH-8021 Zurich (authorised and regulated by FINMA) and the Swiss paying agent, Schroder & Co. Bank AG, Central 2, P.O. Box, CH-8021
Zurich.
Investments in the Companies entails risks, which are fully described in the prospectus.
The Company has its registered office in Luxembourg and is regulated by the Commission de Surveillance du Secteur Financier.
Past performance is no indication of future fund performance. This depends on the trends in markets, investment returns and exchange rates (if
relevant), and how successful the asset manager is in implementing the investment policy. The performance shown does not take account of any
commissions and costs charged when subscribing and redeeming units. Prices of shares and the income from them may fall as well as rise and
investors may not get back the amount originally invested.
This document is issued by Schroder Investment Management (Switzerland) AG, Central 2, 8001 Zurich For your security, communications may be taped or
monitored.
Third party data is owned or licensed by the data provider and may not be reproduced or extracted and used for any other purpose without the data provider's
consent. Third party data is provided without any warranties of any kind. The data provider and issuer of the document shall have no liability in connection with the
third party data. The Prospectus and/or www.schroders.ch contains additional disclaimers which apply to the third party data.
Important Information
36

This material was prepared by Schroder Investment Management, in response to a request from the client sent to Schroder and should not be understood as an
analysis of any securities, advertising material, offer to purchase or sell, offer or recommendation of any financial assets or investment. The purpose of this
material is exclusively informative and does not include investment objectives, financial conditions or the particular and specific needs of any shareholders or other
investors. The opinions stated in this material pertain to Schroder and may change at any time. The opinions are based on the date of their submission and do not
encompass any fact that may have arisen after this date, hence, Schroder is not compelled to update this material to reflect such provisions after the submission
of the same. This material is for exclusive Financial Intermediary, Institutional and Consultant and should not be used as support material by other individuals.
THIS MATERIAL IS HIGHLY CONFIDENTIAL AND SHOULD NOT BE REPRODUCED OR DISTRIBUTED, ENTIRELY OR PARTIALLY, TO PERSONS
OTHER THAN THE ORIGINAL RECIPIENTS. The Fund and the distribution of the shares of the same are not registered at the Brazilian Securities Commission
"CVM", and therefore do not meet certain requirements and procedures usually observed in public offerings of securities registered with the CVM, with which
investors in Brazilian capital markets may be familiar. For this reason, the access of the investors to certain information regarding the Fund may be restricted.
SCHRODER DOES NOT GUARANTEE PERFORMANCE.
Important information
37