The Importance of Default Options for Retirement Saving Outcomes: Evidence from … Beshears Choi...
39
The Importance of Default Options for Retirement Saving Outcomes: Evidence from the United States by John Beshears, Harvard University James J. Choi, Yale University David Laibson, Harvard University and NBER Brigitte C. Madrian, University of Pennsylvania and NBER First Draft: October 2005 Final Draft: September 2006 We thank Hewitt Associates for their help in providing the data analyzed in this and several previous papers that form the foundation for the arguments advanced in this paper. We are particularly grateful to Lori Lucas and Yan Xu, two of our many contacts at Hewitt Associates. We acknowledge individual and collective financial support from the National Institute on Aging (grants R01-AG021650 and T32-AG00186) and the U.S. Social Security Administration (grant #10-P-98363-1 to the National Bureau of Economic Research as part of the SSA Retirement Research Consortium). The opinions and conclusions expressed are solely those of the authors and do not represent the opinions or policy of NIA, SSA, any other agency of the U.S. Federal Government, or the NBER. Laibson also acknowledges financial support from the Sloan Foundation.
Transcript of The Importance of Default Options for Retirement Saving Outcomes: Evidence from … Beshears Choi...

The Importance of Default Options for Retirement Saving
Outcomes: Evidence from the United States
by
John Beshears, Harvard University
James J. Choi, Yale University
David Laibson, Harvard University and NBER
Brigitte C. Madrian, University of Pennsylvania and NBER
First Draft: October 2005
Final Draft: September 2006
We thank Hewitt Associates for their help in providing the data analyzed in this and several previous papers that form the foundation for the arguments advanced in this paper. We are particularly grateful to Lori Lucas and Yan Xu, two of our many contacts at Hewitt Associates. We acknowledge individual and collective financial support from the National Institute on Aging (grants R01-AG021650 and T32-AG00186) and the U.S. Social Security Administration (grant #10-P-98363-1 to the National Bureau of Economic Research as part of the SSA Retirement Research Consortium). The opinions and conclusions expressed are solely those of the authors and do not represent the opinions or policy of NIA, SSA, any other agency of the U.S. Federal Government, or the NBER. Laibson also acknowledges financial support from the Sloan Foundation.

The Importance of Default Options for Retirement Saving
Outcomes: Evidence from the United States
Abstract: This paper summarizes the empirical evidence on how defaults impact
retirement savings outcomes. After outlining the salient features of the various sources of
retirement income in the U.S., the paper presents the empirical evidence on how defaults impact
retirement savings outcomes at all stages of the savings lifecycle, including savings plan
participation, savings rates, asset allocation, and post-retirement savings distributions. The paper
then discusses why defaults have such a tremendous impact on savings outcomes. The paper
concludes with a discussion of the role of public policy towards retirement saving when defaults
matter.
John Beshears Department of Economics Harvard University Littauer Center Cambridge, MA 02138 [email protected]
James J. Choi Yale School of Management 135 Prospect Street P.O. Box 208200 New Haven, CT 06520-8200 [email protected]
David Laibson Department of Economics Harvard University Littauer Center Cambridge, MA 02138 [email protected]
Brigitte C. Madrian Kennedy School of Government Harvard University 79 JFK Street Cambridge, MA 02138 [email protected]

If transaction costs are small, standard economic theory would suggest that defaults
should have little impact on economic outcomes. Agents with well-defined preferences will opt
out of any default that does not maximize their utility, regardless of the nature of the default. In
practice, however, defaults can have quite sizeable effects on economic outcomes. Recent
research has highlighted the important role that defaults play in a wide range of settings: organ
donation decisions (Johnson and Goldstein 2003, Abadie and Gay 2004), car insurance plan
choices (Johnson et al. 1993), car option purchases (Park, Jun, and McInnis 2000), and consent
to receive e-mail marketing (Johnson, Bellman, and Lohse 2003).
This paper summarizes the empirical evidence on defaults in another economically
important domain: savings outcomes. The evidence strongly suggests that defaults impact
savings outcomes at every step along the way. To understand how defaults affect retirement
savings outcomes, one must first understand the relevant institutions. Because the empirical
literature on how defaults shape retirement savings outcomes focuses mostly on the United
States, we begin by describing the different types of retirement income institutions in the United
States and some of their salient characteristics. We then present empirical evidence from the
United States and other countries, including Chile, Mexico and Sweden, on how defaults
influence retirement savings outcomes at all stages of the savings lifecycle, including savings
plan participation, savings rates, asset allocation, and post-retirement savings distributions. Next
we examine why defaults have such a tremendous impact on savings outcomes. And finally, we
consider the role of public policy towards retirement saving when defaults matter.
I. Retirement income institutions in the United States
There are four primary sources of retirement income for individuals in the United States:
(1) social security payments from the government, (2) traditional employer-sponsored defined-
benefit pension plans, (3) employer-sponsored defined-contribution savings plans, and (4)
individual savings accounts that are tied neither to the government nor to private employers. We
will briefly describe each of these institutions in turn.1 1See the Employee Benefit Research Institute (2005) for a more detailed discussion of the U.S. retirement
income system.

The social security system in the United States provides retirement income to qualified
workers and their spouses. While employed, workers and their firms make mandatory
contributions to the social security system. Individuals are eligible to claim benefits when they
reach age 62, although benefit amounts are higher if individuals postpone their receipt until a
later age. Individuals must proactively enroll to begin receiving social security benefits, and most
individuals do so no later than age 65. The level of benefits is primarily determined by either an
individual’s own or his or her spouse’s earnings history, with higher earnings corresponding to
greater monthly benefit amounts according to a progressive benefits formula. Benefits are also
indexed to the cost of living and tend to increase over time because of this. They are paid until an
individual dies, with a reduced benefit going to a surviving spouse until his or her death.
On average, social security replaces about 40 percent of pre-retirement income, although
this varies widely across individuals. Replacement rates tend to be negatively related to income
due to the progressive structure of the benefits formula. Benefits are largely funded on a pay-as-
you-go basis, with the contributions of workers and firms made today going to pay the benefits
of currently retired individuals who worked and paid contributions in the past. There is no
private account component to the U.S. social security system, although this is something that has
received a great deal of discussion in recent years.
Traditionally the second largest component of retirement income has come from
employer-sponsored defined-benefit pension plans. These plans share many similarities with the
social security system. Benefits are determined by a formula, usually linked to a worker’s
compensation, age, and tenure. Benefits are usually paid out as a life annuity, or in the case of
married individuals as a joint-and-survivor annuity, although workers do have some flexibility in
selecting the type of annuity or in opting instead for a lump sum payout.
Because traditional defined-benefit pension plans are costly for employers to administer
and because they impose funding risk on employers, there has been a movement over the past
two decades away from traditional pensions and towards defined-contribution savings plans.
There are now more than twice as many active participants in employer-sponsored defined-
contribution savings plans as in defined-benefit pension plans, with total assets in defined
contribution plans exceeding those in defined benefit plans by more than 10 percent (U.S.
Department of Labor 2005).
These defined-contribution savings plans come in several different varieties. The most
common one, the 401(k), is named after the section of the U.S. tax code that regulates these
types of plans. The typical defined-contribution savings plan allows employees to make elective
pre-tax contributions to an account over which the employee retains investment control. Many
employers also provide matching contributions up to a certain level of employee contributions.
The retirement income ultimately derived by the retirees depends on how much they elected to
save while working, how generous the employer match was, and the performance of their
selected investment portfolios. At retirement, benefits are usually paid in the form of a lump-sum
distribution, although some employers offer the option of purchasing an annuity. Relative to
traditional defined-benefit pension plans, defined-contribution savings plans impose substantially
more risk on individuals while reducing the risks faced by employers.
The final significant source of retirement income comes from personal savings accounts
that are not tied to an employer (or the government). There are many different ways that
individuals can save on their own for retirement, but one particular vehicle, the IRA (for
Individual Retirement Account), is very popular because it receives favorable tax treatment.
After IRAs were first created, the primary source of funding came from direct individual
contributions. Over time, however, restrictions have been placed on the ability of higher-income
individuals to make direct tax-favored contributions, and the primary source of IRA funding has
shifted to rollovers—transfers of assets from a former employer’s defined-contribution savings
plan into an IRA. In general, individuals employed at a firm with a defined-contribution savings
plan that has an employer match would find that savings plan more attractive than directly
contributing to an IRA. Direct IRA contributions largely come from individuals whose
employers do not sponsor a defined-contribution savings plan, individuals who are not eligible
for their employer’s savings plan, or individuals who are not working.
The relatively low social security replacement rate (compared to other developed
countries) in conjunction with the recent shift towards defined-contribution savings plans and
IRAs in the United States has spurred much of the research interest into how defaults and other
plan design parameters affect savings outcomes. With individuals bearing greater responsibility
for ensuring their own retirement income security, understanding how to improve their savings
outcomes has become an important issue both for individuals themselves and for society at large.
II. The impact of defaults on retirement savings outcomes: Empirical evidence
We now turn to the evidence on how defaults affect retirement savings outcomes,
discussing first the effect of institutionally specified defaults, then ‘elective’ defaults—
mechanisms that are not a pure default, but that share similar characteristics with the
institutionally chosen defaults, in terms both of their structure and of their outcomes.
A. Savings plan participation
In a defined-contribution savings environment, savings plans—whether they are
employer-sponsored, government-sponsored, or privately sponsored—are only a useful tool to
the extent that employees actually participate. Recent research suggests that when it comes to
savings plan participation, the key behavioral question is not whether or not individuals
participate in a savings plan, but rather how long it takes before they actually sign up. The most
compelling evidence on the impact of defaults on savings outcomes comes from changes in the
default participation status of employees at firms with defined-contribution savings plans.
In most companies, savings plan participation requires an active election on the part of
employees. That is, if the employee does nothing, the default is that the employee will not be
enrolled in the savings plan (‘standard enrollment’). An alternative but less widely used approach
is to enroll employees in the savings plan automatically, requiring an active election on the part
of employees to opt out of participation.2 This simple change in the default participation status
that applies to employees who do nothing has a dramatic impact on participation outcomes.
To illustrate the effect of automatic enrollment on both participation and other savings
outcomes, we present the experience of a medium-sized U.S. chemicals company (Company A).
This particular firm has a standard defined-contribution savings plan: employees can direct up to
15 percent of pay into the plan; employee contributions are matched dollar-for-dollar up to 6
percent of pay; and employees have seven investment options from which to choose. This
2 In a recent survey of large U.S. employers, Hewitt Associates (2005) reports that 19 percent of companies
used automatic enrollment in their 401(k) plans in 2005, up from 7 percent in 1999. In another survey, the Profit
Sharing/401(k) Council of America (2005) reports that 8 percent of firms overall have automatic enrollment, but that
the likelihood of having automatic enrollment was much higher in large than in small firms (24 percent vs. 1
percent).
company is interesting to consider because it actually implemented automatic enrollment in two
different ways for three different groups of employees.
Company A initially adopted automatic enrollment in December 2000 with a default
contribution rate of 3 percent of pay. The first group of employees affected was new hires going
forward, which is how automatic enrollment is most commonly implemented. This firm,
however, also applied automatic enrollment to previously hired employees who were not then
participating in the plan. In October 2001, the company then increased its default contribution
rate to 6 percent of pay, a change that applied only to new hires going forward.
Figure 1 shows the impact of automatic enrollment on the participation rates of new hires
at Company A. For employees hired and observed prior to automatic enrollment, savings plan
participation is low initially and increases slowly with employee tenure. Under automatic
enrollment, however, participation jumps to approximately 95 percent of employees once it takes
effect (between one and two months after hire in this firm) and increases only slightly thereafter.
At low levels of tenure, the difference in participation rates under the standard enrollment and
automatic enrollment regimes is substantial, with a difference of 35 percentage points at three
months of tenure. As participation increases with tenure under standard enrollment, this
difference diminishes but remains sizeable even after a considerable period of time; for example,
at twenty-four months of tenure, employees under automatic enrollment have a participation rate
more than 25 percentage points higher than that of employees hired prior to automatic
enrollment. The impact of automatic enrollment when applied to existing non-participants is no
less dramatic, as shown in Figure 2. These differences are borne out in other firms as
documented in Madrian and Shea (2001), Choi et al. (2002, 2004a, and 2004b) and The
Vanguard Group (2001).
Most firms with automatic enrollment have adopted a relatively low default contribution
rate, typically 2-3 percent of pay (Profit Sharing/401(k) Council of America 2005). The reason
commonly cited for the low rate is a concern that more employees will opt out of the savings
plan with a higher default contribution rate. The experience of Company A as shown in Figure 1
suggests that this concern may be unfounded. The participation rate under automatic enrollment
is virtually identical with either a low 3 percent contribution rate or a higher 6 percent
contribution rate, a result corroborated for other firms in Choi et al. (2004a and 2004b). This
finding should not in fact be much of a surprise, as employee contributions up to 6 percent of pay

receive a generous dollar-for-dollar employer match at this firm. Most employees should thus
have a strong incentive to contribute at least this amount to the savings plan (even if
automatically enrolled at the lower 3 percent default contribution rate!).
B. Savings plan contributions
While automatic enrollment is effective in getting employees to participate in their
employer-sponsored savings plan, it is less effective at motivating them to make well-planned
decisions about how much to save for retirement. Consider, for example, the distribution of
contribution rates in Figure 3 for employees at Company A hired under automatic enrollment at a
3 percent default contribution rate (the black bars) versus that of employees hired under
automatic enrollment at a 6 percent default contribution rate (the gray bars). The sample under
both default regimes in Figure 3 is restricted to employees with the same level of tenure so that
the results are not confounded by differences in the time that employees have had to move away
from the default.
The distributions of contribution rates are strikingly different for the two regimes. Under
the 6 percent default regime, only 4 percent of employees have a 3 percent contribution rate; 49
percent of employees have a 6 percent contribution rate (the default); and fully 79 percent of
employees have a contribution rate at or above the 6 percent match threshold. In contrast, under
the 3 percent default regime, 28 percent of employees are contributing at the default 3 percent
contribution rate (a seven-fold increase relative to the 6 percent regime), while only 24 percent
are contributing 6 percent of pay (half the fraction in the 6 percent regime). Sixty-five percent of
employees overall are at or above the match threshold under the 3 percent regime, which is 14
percentage points lower in the 6 percent regime despite the very strong financial incentives to
contribute at least 6 percent of pay due to the generous employer match.
The influence of the 3 percent default contribution rate is somewhat smaller in Company
A than in other companies documented in the existing literature on automatic enrollment
(Madrian and Shea, 2001; Choi et al. 2002, 2004a, and 2004b). This circumstance is likely due
to the extremely generous employer match at Company A, which provides a stronger incentive
for employees at this firm relative to those at other firms to take action and increase their
contribution rate to the match threshold. But clearly, the default contribution rate still has a

sizeable impact on the savings outcomes of employees hired under automatic enrollment at
Company A.
This impact is even more apparent if we examine the distribution of contribution rates for
employees who were subject to automatic enrollment after being hired. Recall that employees
who were not currently participating in the 401(k) plan were subject to automatic enrollment in
December 2000 unless they specifically elected to opt out. Figure 4 compares the distribution of
contribution rates for employees who were not subject to automatic enrollment in December
2000 because they had already elected to participate in the 401(k) plan (the black bars) with that
of employees who were subject to automatic enrollment with a 3 percent default contribution rate
(the gray bars). Among employees who elected to participate in the 401(k) plan before automatic
enrollment, only 3 percent chose a 3 percent contribution rate, 31 percent chose to contribute at
the 6 percent match threshold, and fully 89 percent of these employees were contributing at or
above the match threshold. In contrast, among employees subject to automatic enrollment, 60
percent are contributing at the 3 percent automatic enrollment default, while only 5 percent are at
the 6 percent match threshold and 25 percent are at or above the match threshold.
The comparison between the two groups of employees in Figure 4 is not as clean as that
in Figure 3—we might expect the employees who were subject to automatic enrollment by virtue
of the fact that they had not yet enrolled in the 401(k) plan to be different from more savings-
motivated employees who were not subject to automatic enrollment. Nonetheless, the fraction of
those subject to automatic enrollment at the 3 percent default contribution is large indeed. The
general tenor of these results—the impact of the default contribution rate on the distribution of
savings rates, both for new hires and for existing employees—has been corroborated for other
firms in Madrian and Shea (2001) and Choi et al. (2002, 2004a, and 2004b).
C. Asset allocation
Just as automatic enrollment tends to anchor employee contribution rates on the
automatic enrollment default contribution rate, it also tends to anchor employee asset allocations
on the automatic enrollment default asset allocation. This is shown for Company A in Table 1,
which gives the fraction of participants with any balances in the default fund, all balances in the
default fund, and the combination of having all balances in the default fund along with the
default contribution rate (the default automatic enrollment asset allocation in Company A is a

money market fund). The employee groups shown are the same as those in Figure 3 (columns 1
and 2) and Figure 4 (columns 3 and 4).
Consider first the asset allocation of employees who were hired and initiated savings plan
participation before automatic enrollment (column 3) and who were thus not subject to automatic
enrollment. None of these employees is saving at the automatic enrollment default contribution
rate of 3 percent in conjunction with an asset allocation entirely invested in the automatic
enrollment default fund. Only 1 percent have all of their assets wholly invested in the default
fund at any contribution rate. Finally, only 10 percent have any of their assets invested in the
default fund. In general, investment in the automatic enrollment default fund is not widespread
among employees who had to elect participation in the Company A savings plan actively.
For those employees who were subject to automatic enrollment because they had not
initiated participation in the Company A savings plan by December 2000, the picture is very
different. A whopping 86 percent of these participants have some of their assets allocated to the
default fund (compared to 10 percent for their counterparts not subject to automatic enrollment),
with 61 percent having everything invested in the default fund (compared to 1 percent for those
not subject to automatic enrollment). Over half have retained both the default contribution rate of
3 percent and a 100 percent asset allocation in the default fund.
For employees subject to automatic enrollment as new hires, the impact of the default
fund on asset allocation outcomes is not quite as stark as that for existing but non-participating
employees subject to automatic enrollment, but it is nonetheless clear (columns 1 and 2).
Between 34 percent and 47 percent of these participants have something invested in the default
fund, and between 26 percent and 40 percent have everything invested in the default fund.
Interestingly, the default investment allocation is much more prevalent among those hired with a
6 percent default contribution rate than for those hired with a 3 percent default contribution rate.
The likely explanation has to do with the incentives for moving away from the automatic
enrollment defaults. Employees hired with the 3 percent default contribution rate have two
reasons to change their savings parameters: first, to choose a higher contribution rate to fully
exploit the employer match and, second, to choose a non-default asset allocation. For employees
hired with a 6 percent default contribution rate, the first of these motives is missing and the
cost/benefit calculation for making any change shifts towards doing nothing.
The automatic enrollment default asset allocation is not the only type of default that
affects employee portfolio outcomes. As noted earlier, most organizations in the U.S. that offer a
defined-contribution savings plan match employee contributions to some extent. In most of them,
the employer matching contributions are invested in the same manner as the employee’s own
contributions. In many large publicly traded companies, however, the match is directed into
employer stock, sometimes with restrictions on when employees can diversify their matching
balances out of employer stock, and sometimes not.3,4 Choi, Laibson, and Madrian (2005b and
2005d) document a strong flypaper effect when it comes to matching contributions that are
directed into employer stock: the money sticks where it lands, even when employees are free to
diversify.
A final example of how savings outcomes are impacted by a default asset allocation
comes from the defined contribution component of different social security systems. Cronqvist
and Thaler (2004) study the asset allocation outcomes of participants in the Swedish social
security system and find that despite heavy advertising encouraging Swedes to actively elect
their own asset allocation at the time that private accounts were instituted, one-third of the
investments of those who were initially enrolled were directed to the default fund. After the
initial roll-out, when advertising was much diminished, the contributions of over 90 percent of
new participants were invested in the default fund. Similarly, Rozinka and Tapia report that in
Chile, over 70 percent of participants have retained the default fund.
D. Pre-retirement cash distributions
Another phase in the retirement savings accumulation process is changing jobs. When
savings plan participants in the U.S. leave their employment, they may request a cash
distribution, a direct rollover of savings plan balances into a new employer’s savings plan, or a
rollover of plan balances into a qualified individual savings account (e.g. an IRA). If terminated
3 See Choi, Laibson, and Madrian et al.(2005b) for evidence that allowing employees to diversify out of a
match directed into employer stock has only a small effect on asset allocation outcomes relative to not being able to
diversify the match at all. 4 Because the companies that offer employer stock tend to be larger firms, 35 percent of participants in
401(k) plans have an investment menu that includes employer stock (Even and Macpherson 2004) even though only
10 percent of plans offer employer stock (Mitchell and Utkus 2003).

employees do not make an explicit request, the default treatment of those balances depends on
how large their accounts are. For balances in excess of $5,000, balances remain in the former
employer’s savings plan by default. For balances below the $5,000 threshold, employers have the
option to compel a cash distribution.5 Anecdotally, most employers choose the cash distribution
option as their default for terminated employees with balances under $5,000. Choi et al. (2002,
2004a, and 2004b) document the important relationship between balance size and the likelihood
that terminated employees receive a cash distribution. In an analysis of data from four different
firms, they find that more than 70 percent of terminated employees with small account balances
receive a cash distribution, the default for employees with balances below $5,000, whereas less
than one-third of terminated employees with larger account balances receive a cash distribution.
This can have important implications for whether these balances continue to be saved, or
whether they are consumed. Previous research suggests that the probability of receiving a cash
distribution and subsequently rolling it over into an IRA or another savings plan is very low
when the size of the distribution is small. Instead, these small distributions tend to be consumed.6
When employers compel a cash distribution and employees receive an unexpected check in the
mail, the path of least resistance is to simply consume the proceeds.
E. Post-retirement distributions
The final part of the retirement savings process is that of decumulation. There is ample
reason to believe that the type of retirement income distributions received by older individuals
from their retirement plans impacts economic outcomes. For example, Holden and Zick (2000)
find that incomes for older widows fall by 47 percent following the death of their husbands,
5 Beginning in January 2005, the threshold at which employers can compel a cash distribution for
terminated employees will fall from $5,000 to $1,000. For balances between $1,000 and $5,000, employers will
have two options absent other direction from the affected participants: retain the balances in their savings plan or
roll over the balances into an IRA. 6 Poterba, Venti, and Wise (1998) report that the probability that a cash distribution is rolled over into an
IRA or another employer’s savings plan is only 5 to 16 percent for distributions of less than $5,000. The overall
probability that a cash distribution is rolled over into an IRA or another employer’s savings plan or invested in some
other savings vehicle is slightly higher at 14 to 33 percent.

moving 17 percent of these women into poverty. Presumably, it would be possible to devise a
retirement income stream that does not propel one spouse into poverty when the other one dies.
The actual decumulation options that are available to older individuals vary widely across
different types of retirement income vehicles. For example, in the U.S. social security system,
payments do not begin until individuals actively sign up to begin receiving them, but there are no
options when it comes to the structure of the benefits. Recipients essentially receive an inflation-
protected life annuity that is based on an individual’s own earnings history and potentially that of
his or her spouse. For married couples, social security payments fall subsequent to the death of
one partner, but the surviving spouse continues to receive some benefits.
In a typical employer-sponsored defined-benefit savings plan in the U.S., retired
individuals have more options. Married individuals can take their retirement income as a single
annuity or as a joint-and-survivor annuity with a lower monthly benefit amount. In addition to
these different annuity options, some employers also offer the choice of a lump-sum payout.
The options in an employer-sponsored defined-contribution savings plan are different
still. In some companies, the only choice is a lump-sum distribution. In others, the employer may
retain the account balances, giving individuals the option to take periodic and variable
distributions. In still others, the employer may facilitate the purchase of annuities through a
private provider.
Just as in the retirement income accumulation phase, defaults also matter for the
retirement income decumulation phase. The most telling evidence comes from a government-
mandated change in the annuitization options that traditional defined-benefit pension plans must
offer their beneficiaries. The U.S. regulatory framework established for pensions in 1974
required that the default annuity option offered to married pension plan participants be a joint-
and-one-half-survivor annuity. Married beneficiaries could, however, opt out of this default,
choosing a single life annuity with higher monthly benefits during the retired worker’s lifetime.
In 1984, these regulations were amended to require the notarized signature of the spouse if a
retired worker decided to opt for a single life rather than the joint-and-survivor annuity.
Holden and Nicholson (1998) document the effect of this change in the default annuity
option on the annuitization outcomes among married men with traditional employer-sponsored
pensions. Before the institution of the joint-and-survivor default in 1974, they calculate that less
than half of married men elected the joint-and-survivor option. After the move to the joint-and-

survivor default, they estimate an increase in joint-and-survivor annuitization among married
men of over 25 percentage points. It is not clear how much of this shift is due to the change in
the default among retirees at firms that offered both the single life option and the joint-and-
survivor option before the regulatory mandate, and how much is due to the increased availability
of joint-and-survivor annuities at firms that were not previously offering them. Saku (2001),
however, examines only the impact of the 1984 amendment that requires explicit spousal consent
to opt out of a joint-and-survivor annuity. By this time, all firms would have been offering joint-
and-survivor options to their pension beneficiaries. He finds an increase in joint-and-survivor
annuitization of 5 to 10 percentage points following this strengthening of the default. One might
expect much larger effects from its initial implementation, so that the 25 percentage-point effect
estimated by Holden and Nicholson is likely mostly attributable to the change in the default
annuity option rather than an increase in the provision by employers of joint-and-survivor
annuities.
F. Elective defaults
The evidence presented so far all pertains to defaults that specify the savings outcome
that will occur if individuals take no action. There are, however, some interesting examples of
employer attempts to improve savings outcomes through the use of affirmative savings elections
that exploit features of some of the defaults discussed in the previous sections. For lack of a
better term, we refer to these as elective defaults, although this does stretch the typical usage of
the word ‘default.’
One particularly successful elective default is the contribution rate escalator popularized
by the Save More Tomorrow (SMarT) plan of Benartzi and Thaler (2004). With a contribution
escalator, participants elect to have their savings plan contribution rate increase in the future if
they take no further action; in other words, they opt into a default of increasing contributions.
The striking results of the first experiment with such a contribution escalator, in which
employees signed up for future contribution rate increases of 3 percentage points per year, are
reported in Benartzi and Thaler (2004) and Utkus and Young (2004). At the company studied,
employees who elected the contribution escalator feature saw their savings plan contributions
increase by 10.1 percentage points over four years, from 3.5 percent to 13.6 percent of pay. In
contrast, employees who did not sign up for the contribution escalator but who instead elected to

adopt immediately a savings rate recommended to them had higher initial contribution rates but
increased their savings plan contributions by only 4.4 percentage points over four years, from 4.4
percent to 8.8 percent of pay. Other companies that have subsequently incorporated a
contribution escalation feature into their savings plans have also seen increases in employee
contribution rates (Utkus 2002). Such contribution escalators are an interesting way to capitalize
on the widespread savings plan inertia documented thus far. They are also something that could
be easily incorporated as a proper savings plan default.
Choi, Laibson, and Madrian (2005c), Beshears et al. (2006), and Hewitt Associates
(2003) study another elective default dubbed Quick Enrollment. Quick Enrollment operates by
giving employees an easy way to elect a pre-selected contribution rate and asset allocation from
among the many other options that are available within an employer’s savings plan. Figure 5
shows the impact of Quick Enrollment on savings plan participation at two different firms (see
Choi, Laibson, and Madrian 2005c). At Company B, new hires were given Quick Enrollment
forms at orientation allowing them to check a box to be enrolled in their firm’s savings plan at a
2 percent contribution rate with a preselected asset allocation (50 percent in a money market
fund and 50 percent in a stable value fund). Participation rates for employees with four months
of tenure tripled under Quick Enrollment, from 9 percent of new hires to 34 percent. At
Company C, non-participating employees at all levels of tenure were mailed postage-paid Quick
Enrollment response cards allowing them to check a box to be enrolled in their firm’s savings
plan at a 3 percent contribution rate allocated entirely to a money market fund. Relative to the
enrollment trends of non-participants a year prior to the mailing, savings plan participation four
months later more than doubled, from 6 percent of non-participants enrolling to 16 percent. A
different implementation of Quick Enrollment at Company B directed towards existing non-
participants allowed them to choose any contribution rate allowed by the plan with the same pre-
selected asset allocation previously described. Fully 25 percent of non-participants signed up for
the savings plan over a four-month period following this version of Quick Enrollment (Besehars
et al. 2006).
Beyond its effects on savings plan participation, the impact of Quick Enrollment on other
savings outcomes is interesting because, like automatic enrollment, Quick Enrollment induces a
heavy clustering of enrollees at the employer-selected default contribution rate and asset
allocation. At Company B, no savings plan participants affirmatively elected the Quick

Enrollment default asset allocation prior to the implementation of Quick Enrollment. Among
those participants offered Quick Enrollment at the new hire orientations, 60 percent have the
Quick Enrollment default asset allocation. Among those who enrolled in the savings plan when
Quick Enrollment was offered to existing non-participants, 91 percent have the Quick
Enrollment default asset allocation. The picture is similar at Company C, where only 6 percent of
participants prior to Quick Enrollment affirmatively elected the Quick Enrollment default asset
allocation. In contrast, between 75 percent and 91 percent of existing non-participants who were
offered Quick Enrollment and became participants have the Quick Enrollment default asset
allocation.
The impact of Quick Enrollment on contribution rates is equally striking. At Company B,
the fraction of new hires at the Quick Enrollment default contribution rate of 2 percent of pay
increased from 1 percent of employees before Quick Enrollment to 14 percent of employees after
Quick Enrollment. At Company C, the fraction of newly participating employees at the Quick
Enrollment default contribution rate of 3 percent increased from less than 1 percent of employees
before Quick Enrollment to 12 percent of employees after Quick Enrollment. In both companies,
the fraction of savings plan participants at the Quick Enrollment defaults (as opposed to the
fraction of employees overall) is much higher because the participation rates among the impacted
groups are relatively low.
III. Explaining the impact of defaults on retirement savings outcomes
The substantial evidence presented in the preceding section of this paper on the impact of
defaults on savings outcomes is interesting for (at least) three reasons: first, in most of the
examples cited, switching from one default to another resulted in very different savings
outcomes even though the change in the default did not affect the menu of savings options
available to individuals; second, none of the defaults proscribed employees from effecting a
different savings outcome; and third, the direct transaction costs (filling out a form, or calling a
benefits hotline) for making savings plan changes were generally small.7
If direct transaction costs are not a plausible explanation for the persistence of savings
plan defaults, then what factors are? In this section of the paper, we consider three alternative 7See Choi, Laibson, and Madrian (2005a) for evidence on the magnitude of some of these direct transaction
costs.
explanations: (1) procrastination generated by the complexity of the decision-making task, (2)
procrastination generated by present-biased preferences, and (3) a perception of the default as an
endorsement for certain savings outcomes. Madrian and Shea (2001) discuss some alternative
explanations, but these three strike us as the most plausible given the existing empirical
evidence.
A. The complexity of making a non-default savings plan election
There are several sources of complexity involved in making an optimal savings plan
decision. Consider, for example, the array of participation options in a typical defined-
contribution savings plan. Individuals must first choose what fraction of compensation to
contribute to their savings plan, which in a typical plan would be anything from 1 to 15 percent
of compensation (in some plans even higher contribution rates are allowed). They must then
choose how to allocate that contribution among the available fund options. In a plan with ten
funds and a maximum contribution rate of 15 percent, the number of different savings plan
options is immense.
For some employees, a second source of complexity is learning how to evaluate this
myriad of savings plan options. Surveys of financial literacy consistently find that many
individuals are not well-equipped to make complicated financial decisions. For example, in a
recent survey of defined-contribution savings plan participants, John Hancock Financial Services
(2002) reports:
* 38 percent of respondents report that they have little or no financial knowledge;
* 40 percent of respondents believe that a money market fund contains stocks;
* two-thirds of respondents do not know that it is possible to lose money in government
bonds; and
* respondents on average believe that employer stock is less risky than a stock mutual
fund.
Given these results, it should not be surprising that two-thirds of these respondents also report
that they would be better off working with an investment advisor than managing retirement
investments solo.
The psychology literature has documented a tendency of individuals to put off making
decisions as the complexity of the task increases (Tversky and Shafir 1992, Shafir, Simonson,

and Tversky 1993, Dhar and Knowlis 1999, Iyengar and Lepper 2000). Evidence supporting the
notion that the complexity of the asset allocation task leads employees to delay savings plan
enrollment comes from a recent study by Iyengar, Huberman, and Jiang (2004). They document
a strong negative relationship between the number of funds offered in a 401(k) plan and the
401(k) participation rate: having an additional ten funds in the fund menu leads to a 1.5-2
percentage point decline in participation, a result that holds even among firms with a relatively
low number of funds. One suspects that this would also act as a deterrent to making asset
allocation changes after the initial participation decision has been made.
A likely reason that savings plan participation is so much higher under automatic
enrollment than with an opt-in enrollment mechanism is that automatic enrollment decouples the
savings plan participation decision from the contribution rate and asset allocation decision. The
initial participation decision is simplified from one that involves evaluating a myriad of options
to a simple comparison of two alternatives: non-participation (consumption or saving outside of
the savings plan) versus participating at a pre-specified contribution rate with a pre-specified
asset allocation. Furthermore, Madrian and Shea (2001) and Choi et al. (2004b) find that
automatic enrollment has its largest impact on participation for those workers who generally
have the least amount of financial sophistication—the young and those with low levels of tenure
(who would have less knowledge about their own particular savings plan). These are workers for
whom the complexity of the participation decision would be a greater deterrent to enrolling in
the savings plan under an opt-in regime.
Quick Enrollment works in much the same way as automatic enrollment, simplifying the
participation decision by giving individuals a pre-determined contribution rate and asset
allocation bundle(s) that need only be compared to non-participation. The effect of Quick
Enrollment on participation, however, is not as great as that of automatic enrollment, suggesting
that the participation increases under automatic enrollment are due to more than just the
simplification of the decision-making task.
B. Present-biased preferences and procrastination
Recent research in behavioral economics has fingered another reason for the observed
persistence in savings plan outcomes—individual problems with self-control (Laibson, Repetto,
and Tobacman 1998; O’Donoghue and Rabin 1999; Diamond and Koszegi 2003). As the adage

goes, why do today what you can put off until tomorrow? O'Donoghue and Rabin (1999)
propose a model in which, under certain conditions (specifically, naïveté about time-inconsistent
preferences), individuals may never reallocate their portfolios away from poor-performing
investments even when the direct transactions costs of doing so are relatively small. A similar
type of argument can be made for delays in savings plan enrollment. The possibility of the latter
is suggested by the fact that savings plan participation rates prior to automatic enrollment in
Company A and other firms that have been studied (Madrian and Shea 2001; Choi et al. 2002,
2004a, and 2004b) never exceed those under automatic enrollment, even at very high levels of
tenure. It is also suggested by the substantial fraction of automatic enrollees at Company A who
remained at the relatively low 3 percent default contribution rate two years after hire despite a
100 percent employer match on contributions up to 6 percent of pay. Additional corroborating
evidence comes from Choi, Laibson, and Madrian (2005a), who document that even among older
workers with very high average levels of tenure, roughly half fail to exploit the full match in
their employer-sponsored savings plan, leaving matching contributions equal to roughly 1.3
percent of pay unclaimed (in companies without automatic enrollment).
C. The default as an endorsement
Default options may also influence outcomes if individuals perceive the default as an
endorsement of a particular course of action (an endorsement effect). The lack of financial
sophistication on the part of many individuals discussed above may lead them to search for
advice without necessarily knowing the best place to find it. Because employer-sponsored
savings plans are supposed to be run for the benefit of employees (that, after all, is why they are
referred to as ‘employee benefits’), some individuals may incorrectly perceive that an employer-
specified default must be in the best interest of the firm’s employees.8
There are several pieces of evidence consistent with the notion that employees perceive
defaults in part as some sort of advice or recommendation from their employer. The first comes
from companies who have implemented automatic enrollment for only new hires going forward.
In these companies, none of the employees hired before automatic enrollment are directly
affected (that is, none of them are automatically enrolled), but some of them will have 8 While this may be true for some employer-specified defaults, in general firms weigh other issues such as
cost and legal liability in their selection of defaults, not only the potential benefit to employees.

affirmatively elected to participate in the savings plan before automatic enrollment was instituted
for anyone, whereas others will have affirmatively elected to participate only after automatic
enrollment was implemented for new hires going forward. Madrian and Shea (2001) show that
the fraction of assets allocated to the automatic enrollment default investment fund is more than
three times as high for the latter group as it is for the former (see Table 2).9 Interestingly,
Madrian and Shea do not find similar evidence for the contribution rates elected by these two
groups of employees: those employees hired before automatic enrollment but who enroll in their
savings plan only after automatic enrollment are not substantially more likely to choose the
automatic enrollment default contribution rate than are their counterparts who enrolled in the
savings plan before automatic enrollment. That the endorsement implicit in the automatic
enrollment defaults is more important for asset allocation outcomes than for contribution rate
outcomes is consistent with the notion that employees are much more uncertain about choosing
an appropriate asset allocation than about choosing an appropriate contribution rate (or, at least,
about choosing a contribution rate that garners the full employer match).10
Further evidence on the endorsement effect under automatic enrollment comes from the
savings outcomes of employees hired under automatic enrollment who choose to move away
from the automatic enrollment default. These individuals have overcome the forces of inertia and
taken action. Even so, their asset allocation continues to be much more heavily invested in the
automatic enrollment default fund than that of employees hired prior to automatic enrollment
(Madrian and Shea 2001; Choi et al. 2004b). Table 3 illustrates this tendency for employees at
Company A and Company D. The first column in Table 3 shows the importance of the automatic
enrollment default asset allocation for employees hired before automatic enrollment (and, for
company A, employees who elected to participate before automatic enrollment). The fraction of
these employees with anything in the default fund is 10 percent in Company A and 18 percent in
Company D. The fraction with everything invested in the default fund is lower still: 1 percent at
Company A and 5 percent at Company D. In contrast, those employees hired under automatic
9 The data for Company D in Table 2 comes from Madrian and Shea (2001). This company implemented
automatic enrollment with a 3 percent default contribution rate invested wholly in a money market fund. The match
threshold at this firm was 6 percent. 10 Choi, Laibson, and Madrian (2005c) discuss in greater detail reasons why the asset allocation task may
be more complicated for employees than the decision about how much to contribute to the savings plan.

enrollment who have made an active election to move away from the automatic enrollment
default, changing either their asset allocation or their contribution rate or both, are much more
heavily invested in the automatic enrollment default despite having incurred the transactions
costs of changing the parameters of their savings plan participation. Among automatic enrollees
who have made a change from the automatic enrollment default, the fraction with any balances
in the default fund is 86 percent at Company A, and 71 percent at Company D, much higher than
for the employees hired before automatic enrollment. The proportional differences for those with
everything in the automatic enrollment default fund are greater still. Clearly, the default fund
exerts an impact on the asset allocation of employees hired under automatic enrollment even
after these employees have elected to make a change. A final piece of evidence on the
endorsement effect of savings plan defaults comes from the fraction of employee contributions
invested in employer stock in companies where employer stock is included in the fund menu.
Benartzi (2001), Holden and VanDerhei (2001), and Brown, Liang, and Weisbenner (2006) all
find that when the employer directs matching contributions into employer stock, the fraction of
the employee’s own contributions allocated to employer stock is higher than when the match is
allocated according to the employee’s direction.
IV. Designing public policy when defaults matter
There are many goals associated with public policy. When it comes to retirement saving,
politicians, economists, and other social planners would largely agree that if governments are to
sponsor costly social welfare programs for individuals who are impoverished, they should also
promote institutions that provide sufficient income to individuals when retired in order to reduce
the reliance on costly social welfare programs. Because of the risks that defined-benefit
retirement income schemes impose on employers (through defined-benefit pensions) and
governments/taxpayers (through social security), there has been a broader trend towards defined-
contribution savings schemes through both private and government-sponsored institutions (e.g.
401(k) savings plans in the USA and the social security systems in Sweden and Chile). But if
defaults have the potential to significantly impact savings outcomes in these types of schemes,
what types of defaults should public policy encourage, especially if individuals have
heterogeneous savings needs? In this section, we discuss first some of the conceptual issues
associated with thinking about an ‘optimal’ default. We then give some examples of public

policy and defaults in practice, both those that seem sensible from the standpoint of promoting
better savings outcomes and those that do not.
A. Is there an ‘optimal’ default?
Choi et al. (2005) model the choice of an optimal default savings plan enrollment
mechanism from the perspective of a social planner interested in maximizing individual welfare.
In this model, defaults matter for three key reasons. First, individuals face a cost for opting out of
the chosen default. Second, this cost varies over time, creating an option value to waiting for a
low cost period to take action. Third, individuals with present-biased preferences may
procrastinate in their decision to opt out of the default, even in a low cost period, believe that
they are more likely to do so in the future. Three different potential enrollment defaults emerge
from the model: automatic enrollment, requiring an affirmative participation election (opt-in),
and requiring employees to actively make a decision so that there is, in essence, no default (but
all employees must bear the immediate transactions costs of deciding what to do). Choi et al.
(2005) refer to this latter outcome as the ‘active decision’ approach. Which of these enrollment
regimes is optimal varies according to the parameters in the model.
The conditions under which each of these approaches to savings plan enrollment is likely
to be optimal, from both a theoretical and a practical standpoint, are discussed in greater detail in
Choi et al. (2005), but we briefly describe them here. Defaults tend to be optimal when there is a
large degree of homogeneity in individual preferences and when decision-makers have limited
expertise. In the case of a firm with an employer match, if most employees would prefer to be
saving at the match threshold, then automatic enrollment with a default contribution rate equal to
the match threshold is likely to be optimal. Requiring an affirmative participation election, on the
other hand, is likely to be optimal if most individuals share a preference not to be participating in
the savings plan,11 or if individuals have very heterogeneous preferences and little tendency to
procrastinate. Requiring an active decision is more appropriate when individual heterogeneity
implies that one choice is not ideal for everyone but individuals do have a tendency to
procrastinate.
11 This could be true in a firm with a largely low-income workforce that has a high social security
replacement rate, or in a firm with a generous defined-benefit pension as the primary source of retirement income.

Although requiring the use of an active decision as an alternative to selecting a default is
uncommon in the context of savings plans, Choi et al. (2005) study the effect of just such an
approach on savings plan outcomes in one firm. They find that requiring employees to make an
active decision leads to substantially higher initial participation rates than those achieved under
an opt-in enrollment regime without any perverse effects on the distribution of contribution rates
such as is observed with mechanisms like automatic enrollment or Quick Enrollment.
For the purposes of this paper, the important point of the modeling effort in Choi et al. is
that there is no single optimal savings plan enrollment mechanism—the optimal default depends
importantly on parameters in the model, parameters that are likely to vary across both institutions
and individuals. More generally, the framework for thinking about an optimal savings plan
enrollment mechanism can be used to think about how sensible other types of economic defaults
are likely to be. We turn now to a few specific examples related to savings.
B. For better and for worse: Public policy and defaults in practice
There are many interesting examples of how public policy both encourages and
discourages better savings plan outcomes, some that have already been mentioned and others that
have not. The first is the legislative mandate that, in defined-benefit pension plans, the default
payout option for married individuals is a joint-and-survivor annuity. As discussed earlier, this
mandate resulted in a sizeable increase in the fraction of married defined-benefit pension
recipients with joint-and-survivor annuities. This mandate, which was a matter of public policy
rather than a matter of choice for pension plan providers, was adopted in order to improve the
financial security of widows after their husbands’ deaths. Whether it was successful at this
objective has not been examined. However, Johnson, Uccello, and Goldwyn (2003) show that
those married individuals who have opted out of this default appear to have had economically
sound reasons for doing so, such as having a spouse with either his or her own source of
retirement income or a shorter life expectancy than the pension beneficiary.
In the context of thinking about an optimal default, there are three particularly interesting
aspects of this joint-and-survivor annuity default. The first is that there are actually two different
default annuities: one for single individuals (a single life annuity) and the joint-and-survivor
annuity for married individuals. Opt-in vs. opt-out savings plan enrollment mechanisms, on the
other hand, are blanket defaults that apply to everyone (unless individuals opt out). Clearly there

is a need to think more carefully about the potential role of more nuanced defaults that apply
only to some individuals in certain situations. The second interesting feature of the joint-and-
survivor annuity default is that the decision to accept the default or to opt out of it is
irrevocable—once made it cannot be reversed. The third interesting feature, an extension of the
second, is that because the annuitization outcome is irreversible, individuals cannot forever delay
the decision about what type of annuity is most appropriate—any opt-out decision must be made
before the pension beneficiary can start receiving pension income. These two features reduce the
scope for procrastination due to present-biased preferences. Individuals for whom a single-life
annuity is better face strong incentives to take action to express those preferences quickly. This
consequence shares some similarities with the active decision approach to savings plan
participation discussed above. Although there is a default (in contrast to the active decision
approach discussed above), it is structured in such a way as to provide strong incentives to take
action immediately for those individuals who desire to opt-out.
Overall, many features of the joint-and-survivor annuity default seem to work well. The
one drawback, perhaps, is that for most individuals, understanding annuity options is no less
complicated than understanding asset allocation. Annuity providers are continuing to develop a
rich set of annuity products, some of which may be more appropriate to particular individuals
than the one-sized joint-and-survivor default specified for married pension beneficiaries. The
complexity of evaluating the different annuity products available in the market likely means that
any default will significantly influence realized outcomes simply because of the endorsement
effect.
Another interesting default to consider from a public policy perspective is the
composition of the default investment fund in the defined contribution component of various
social security systems. In contrast to the default asset allocation chosen by most employers that
have automatic enrollment in the U.S. which tends to be a single mutual fund, some countries
such as Sweden, Chile and Mexico have selected a default which is a portfolio of different types
of financial assets. For example, in Sweden the default includes exposure to domestic and
international equities, bonds, and the money market.12 Moreover, it is well diversified against 12 The specific asset allocation as reported in Cronqvist and Thaler (2004) is: Swedish stocks (17 percent),
non-Swedish stocks (65 percent), inflation-indexed bonds (10 percent), hedge funds (4 percent), and private equity
(4 percent).

geographical, industrial, and asset market shocks, and it comes with a relatively low expense
ratio of approximately 0.16 percent. Although it is difficult to say whether the Swedish social
security system could have chosen a better default asset allocation, Cronqvist and Thaler (2004)
show that the portfolio performance of those in the default fund exceeded that of individuals who
opted out of the default and selected their own asset allocation. On this metric, the default would
seem to have been relatively well chosen.
The default investment portfolios in the Chilean social security system and in the defined
contribution component of the Mexican social security system are interesting for another reason-
-in both countries the default investment fund for older workers differs from that for younger
workers (Rozinka and Tapia). In Chile, there are three different default asset allocations, one for
workers below age 35, a second for men aged 36 to 55 and women aged 36 to 50, and a third for
men age 56 and older and women age 51 and older. The Chilean default funds differ in their
relative exposure to equities (both foreign and domestic) and fixed income securities, with the
default portfolios holding fewer equities and more bonds as participants age. This pattern of
equity vs. bond holding is certainly consistent with what many financial planners would
recommend. In Mexico, the default funds differ largely in the type of fixed income investments
that they hold. In contrast to the Swedish default asset allocation, the defaults in both Chile and
Mexico are heavily weighted toward domestic securities. In Mexico, there are no foreign
investments in the default funds; in Chile, the highest foreign investment exposure in 34% in the
default fund for younger workers (Rozinka and Tapia). This is in contrast to Sweden, in which
two-thirds of the default portfolio is non-Swedish stocks, and probably represents inadequate
geographic diversification in the Chilean and Mexican defaults.
Another interesting default to consider from a policy perspective is the treatment of
savings plan balances following employee termination. This default shares one feature with the
default annuity options just discussed. Rather than having a single blanket default option, the
default outcome depends on the size of the terminated employee’s account balance: balances less
than $5,000 are sent to individuals as a cash distribution unless individuals direct the employer to
roll over the balances into another qualified savings plan, whereas balances more than $5,000 are
retained by the employer unless individuals direct otherwise. However, as previously noted,
there is significant leakage from the retirement system for employees with account balances
below the $5,000 threshold.

Policy-makers in the U.S. reached an interesting compromise to deal with this issue of
leakage. The cash distribution default is costly for employees because it reduces their long-term
retirement accumulations, but retaining small account balances is costly for employers because
of the fixed costs associated with retaining individual accounts. The public policy compromise
applies to the accounts of terminated employees with balances greater than $1,000 and less than
$5,000. For these accounts, employers cannot compel a cash distribution. Rather, they can keep
the accounts (as was being done all along for accounts of greater than $5,000), or they can roll
the accounts over into qualified individual savings plans (e.g. an IRA). Employers retain the
option to compel a cash distribution for accounts under $1,000 although they could change the
default for these accounts as well and roll the balances into an IRA. Because this change has not
taken effect at the time of this writing, it is too early to assess the outcome, but it at least seems
like an example of public policy promoting better savings outcomes. There is a catch, however:
the regulations pertaining to the default fund associated with these automatic IRA rollovers make
it highly unlikely that any employer will pick anything other than an extremely conservative
default fund (e.g. a money market fund). Thus, it is likely that the majority of $1,000-$5,000
account balances will be rolled over into an IRA following employee termination, where they
will languish over time earning a rate of return that barely keeps pace with inflation. Public
policy on this aspect of the default could probably do better.
Another area in which public policy could do better is with employer matches made in
the form of employer stock. As already noted, employer matching contributions made in
employer stock tend to stick where they land, which imposes greater financial risk on
employees—first, because their retirement savings portfolio itself is not well diversified and,
second, because much of the risk to their retirement savings portfolio is correlated with the risk
to their labor income. Unfortunately, many employees do not seem to understand these risks. The
John Hancock Financial Services Eighth Defined Contribution Plan Survey (2002) finds that
savings plan participants on average rate employer stock as less risky than an equity mutual fund.
Similarly, Benartzi et al. (2004) find that only 33 percent of savings plan participants believe that
their employer stock is riskier than a diversified stock fund, whereas 39 percent believe it is
equally risky and 25 percent believe it is safer. Furthermore, 20 percent of respondents say they
would prefer $1,000 in employer stock that they could not diversify until age 50 to $1,000 that
they could invest at their own discretion.

One could view public policy in this area as neutral: the government leaves companies to
run their savings plans as they see fit, and some establish a match in which contributions are
directed into employer stock. But contrast the approach here with the regulation of defined-
benefit pension plans, in which employer stock holdings are limited to no more than 10 percent
of total plan assets, or to the rather proactive joint-and-survivor annuity default. Public policy
could certainly greatly reduce the amount of employer stock held in defined-contribution savings
plans, either by precluding employer stock as an investment option altogether or by simply
mandating that matching contributions be defaulted to the asset allocation selected by the
employee.
V. Conclusion
This paper has demonstrated the tremendous influence that defaults exert on realized
savings outcomes at every stage of the savings lifecycle: savings plan participation,
contributions, asset allocation, rollovers, and decumulation. That defaults can so easily sway
such a significant economic outcome has important implications for understanding the
psychology of economic decision-making. But it also has important implications for the role of
public policy towards saving. Defaults are not neutral—they can either facilitate or hinder better
savings outcomes. Current public policies towards saving include examples of both.

References
Abadie, Alberto, and Sebastien Gay. 2004. ‘The Impact of Presumed Consent Legislation on Cadaveric Organ Donation: A Cross-Country Study.’ Journal of Health Economics 25(4): 599-620.
Benartzi, Shlomo. 2001. ‘Excessive Extrapolation and the Allocation of 401(k) Accounts to Company Stock.’ Journal of Finance, 56, no. 5: 1747-1764.
Benartzi, Shlomo, and Richard H. Thaler. 2004. ‘Save More Tomorrow™: Using Behavioral Economics to Increase Employee Saving.’ Journal of Political Economy 112(S1): S164-S187.
Benartzi, Shlomo, Richard Thaler, Stephen Utkus, and Cass Sunstein. 2004. ‘Company Stock, Market Rationality, and Legal Reform.’ Mimeo. University of Chicago Graduate School of Business.
Beshears, John, James J. Choi, David Laibson, and Brigitte C. Madrian. 2006. ‘Simplification and Saving.’ Mimeo. Harvard University.
Brown, Jeffrey R., Nellie Liang, and Scott Weisbenner. 2006. ‘401(k) Matching Contributions in Company Stock: Costs and Benefits for Firms and Workers.’ Journal of Public Economics 90(6-7): 1315-1346.
Choi, James J., David Laibson, and Brigitte C. Madrian. 2005a. ‘$100 Bills on the Sidewalk: Suboptimal Saving in 401(k) Savings Plans.’ NBER Working Paper 11554.
Choi, James J., David Laibson, and Brigitte C. Madrian. Forthcoming. 2005b. ‘Are Empowerment and Education Enough: Underdiversification in 401(k) Plans.’Brookings Papers on Economic Activity, 2:2005: 151-198.
Choi, James J., David Laibson, and Brigitte C. Madrian. 2005c. ‘Reducing the Complexity Costs of 401(k) Participation: The Case of Quick Enrollment.’ Harvard University Working Paper.
Choi, James J., David Laibson, and Brigitte C. Madrian. 2005d. ‘Flypaper and Active Decision Effects in 401(k) Asset Allocation.’ Yale University Working Paper.
Choi, James J., David Laibson, Brigitte C. Madrian, and Andrew Metrick. 2002. ‘Defined Contribution Pensions: Plan Rules, Participant Choices, and the Path of Least Resistance.’ In Tax Policy and the Economy, edited by James Poterba. Volume 16. Cambridge, Mass.: MIT Press.

Choi, James, David Laibson, Brigitte C. Madrian, and Andrew Metrick. 2004a. ‘For Better or For Worse: Default Effects and 401(k) Savings Behavior.’ In Perspectives in the Economics of Aging, edited by David A Wise. University of Chicago Press.
Choi, James, David Laibson, Brigitte C. Madrian, and Andrew Metrick. 2004b. ‘Employees’ Investment Decisions About Company Stock.’ In Pension Design and Structure: New Lessons from Behavioral Finance, edited by Olivia Mitchell and Stephen Utkus. Oxford: Oxford University Press.
Choi, James, David Laibson, Brigitte C. Madrian, and Andrew Metrick. 2005. ‘Optimal Defaults and Active Decisions.’ NBER Working Paper 11074.
Cronqvist, Henrik and Richard H. Thaler. 2004. ‘Design Choices in Privatized Social Security Systems: Learning from the Swedish Experience.’ American Economic Review Papers and Proceedings 94(2): 424-428.
Diamond, Peter, and Botond Koszegi. 2003. ‘Quasi-Hyperbolic Discounting and Retirement.’ Journal of Public Economics 87(9-10): 1839-1872.
Dhar, Ravi, and Stephen N. Nowlis. 1999. ‘The Effect of Time Pressure on Consumer Choice Deferral.’ Journal of Consumer Research 25(4): 369-84.
Employee Benefit Research Institute (2005). ‘The U.S. Retirement Income System,’ Washington DC: Employee Benefit Research Institute. (October 5, 2005). (http://www.ebri.org/pdf/publications/facts/0405fact.pdf).
Even, William E. and David A. Macpherson. 2004. ‘Company Stock in Pension Funds.’ National Tax Journal 56, no. 4: 299-313.
Hewitt Associates. 2003. ‘Increasing Participation Through Quick Enrollment,’ Lincolnshire, IL: Hewitt Associates.
Hewitt Associates. 2005. ‘Survey Highlights: Trends and Experience in 401(k) Plans 2005.’ Lincolnshire, IL: Hewitt Associates.
Holden, Karen C. and Kathleen Zick. 2000. ‘Distributional Changes in Income and Wealth upon Widowhood: Implications for Private Insurance and Public Policy.’ In Retirement Needs Framework. SOA Monograph M-RS00-1. Schaumburg, IL: Society of Actuaries.
Holden, Karen C. and Sean Nicholson. 1998. ‘Selection of a Joint-and-Survivor Pension,’ Institute for Research on Poverty Discussion Paper No. 1175-98. University of Wisconsin, Madison.
Holden, Sarah and Jack VanDerhei. 2001. ‘401(k) Plan Asset Allocation, Account Balances, and Loan Activity in 2000.’ ICI Perspective 7, no. 5: 1-27.
Iyengar, Sheena S., Gur Huberman, and Wei Jiang. 2004. ‘How Much Choice Is Too Much?: Contributions to 401(k) Retirement Plans.’ In Pension Design and Structure: New

Lessons from Behavioral Finance edited by Olivia Mitchell and Stephen Utkus. Oxford University Press.
Iyengar, Sheena S., and Mark Lepper. 2000. ‘When Choice is Demotivating: Can One Desire Too Much of a Good Thing?’ Journal of Personality and Social Psychology 79: 995-1006.
John Hancock Financial Services. 2002. Eighth Defined Contribution Plan Survey: Insight into Participant Investment Knowledge & Behavior. Boston: John Hancock Financial Services.
Johnson, Eric J., and Daniel Goldstein. 2003. ‘Do Defaults Save Lives?’ Science 302: 1338-1339.
Johnson, Eric J., John Hershey, Jacqueline Meszaros, and Howard Kunreuther. 1993. ‘Framing, Probability Distortions, and Insurance Decisions.’ Journal of Risk and Uncertainty 7(1): 35-53.
Johnson, Eric J., Steven Bellman, and Gerald L. Lohse. 2003. ‘Defaults, Framing and Privacy: Why Opting In-Opting Out.’ Marketing Letters 13(1): 5-15.
Johnson, Richard W., Cori E. Uccello, and Joshua H. Goldwyn. 2003. ‘Singe Life Vs. Joint and Survivor Pension Payout Options: How Do Married Retirees Choose?’ The Urban Institute, Washington DC.
Laibson, David I., Andrea Repetto, and Jeremy Tobacman. 1998. ‘Self-Control and Saving for Retirement.’ Brookings Papers on Economic Activity 1998(1): 91-196.
Madrian, Brigitte C. and Dennis F. Shea. 2001. ‘The Power of Suggestion: Inertia in 401(k) Participation and Savings Behavior.’ Quarterly Journal of Economics 116, no. 4: 11491525.
Mitchell, Olivia and Steven Utkus. 2003. ‘The Role of Company Stock in Defined Contribution Plans.’ In The Pension Challenge: Risk Transfers and Retirement Income Security, edited by Olivia Mitchell and Kent Smetters. London: Oxford University Press.
O'Donoghue, Ted, and Matthew Rabin. 1999. ‘Procrastination in Preparing for Retirement.’ In Behavioral Dimensions of Retirement Economics, edited by Henry Aaron. Washington D.C.: The Brookings Institute.
Park, C. Whan, Sung Y. Jun, and Deborah J. MacInnis. 2000. ‘Choosing What I Want Versus Rejecting What I Do Not Want: An Application of Decision Framing to Product Option Choice Decisions.’ Journal of Marketing Research 37(2): 187-202.
Poterba, James M., Steven F. Venti, and David A. Wise.1998. ‘Lump Sum Distributions from Retirement Savings Plans: Receipt and Utilization.’ In Inquiries in the Economics of Aging, edited by David A. Wise. Chicago: University of Chicago Press.

Profit Sharing/401(k) Council of America. 2005. ‘48th Annual Survey of Profit Sharing and 401(k) Plans’ (October 10, 2005). (http://www.psca.org/DATA/48th.html).
Rozinka, Edina and Waldo Tapia. “Survey of Investment Choice by Pension Fund Members.” OECD (http://www.oecd.org/dataoecd/46/61/36553753.pdf accessed September 7, 2006).
Saku, Aura. 2001. ‘Does the Balance of Power Within a Family Matter? The Case of the Retirement Equity Act.’ IGIER Working Paper 202. Milan, Italy: Innocenzo Gasparini Institute for Economic Research.
Shafir, Eldar and Amos Tversky. 1992. ‘Choice Under Conflict: The Dynamics of Deferred Decision.’ Stanford, CA: Stanford Center on Conflict and Negotiation, Stanford University.
Shafir, Eldar, Itamar Simonson, and Amos Tversky. 1993. ‘Reason-Based Choice.’ Cognition 49(1-2): 11-36.
U.S. Department of Labor, Employee Benefits Security Administration. 2005. Private Pension Plan Bulletin. (October 4, 2005) (http://www.dol.gov/ebsa/PDF/2000pensionplanbulletin.pdf).
Utkus, Stephen P. 2002. ‘A Recent Successful Test of the SMarT Program.’ Vanguard Center for Retirement Research: Valley Forge, PA.
Utkus, Stephen P. and Jean A. Young. 2004. ‘Lessons from Behavioral Finance and the Autopilot 401(k).’ Vanguard Center for Retirement Research: Valley Forge, PA.
The Vanguard Group. 2001. ‘Automatic Enrollment: Vanguard Client Experience.’ The Vanguard Group: Valley Forge, PA.

32
TABLE 1. Automatic Enrollment and Asset Allocation Outcomes: Company A
Hired after automatic enrollment (15-24 months tenure)
Hired before automatic enrollment (25-48 months tenure)
3% default contribution rate
6% default contribution rate
Participated before automatic enrollment
Participated after automatic enrollment
Any balances in default fund 33.8% 46.5% 9.9% 86.1%
All balances in default fund 25.6% 39.5% 1.4% 61.1%
100% default fund + default contribution rate 18.1% 32.6% 0.0% 52.8%
Source: Authors’ calculations.
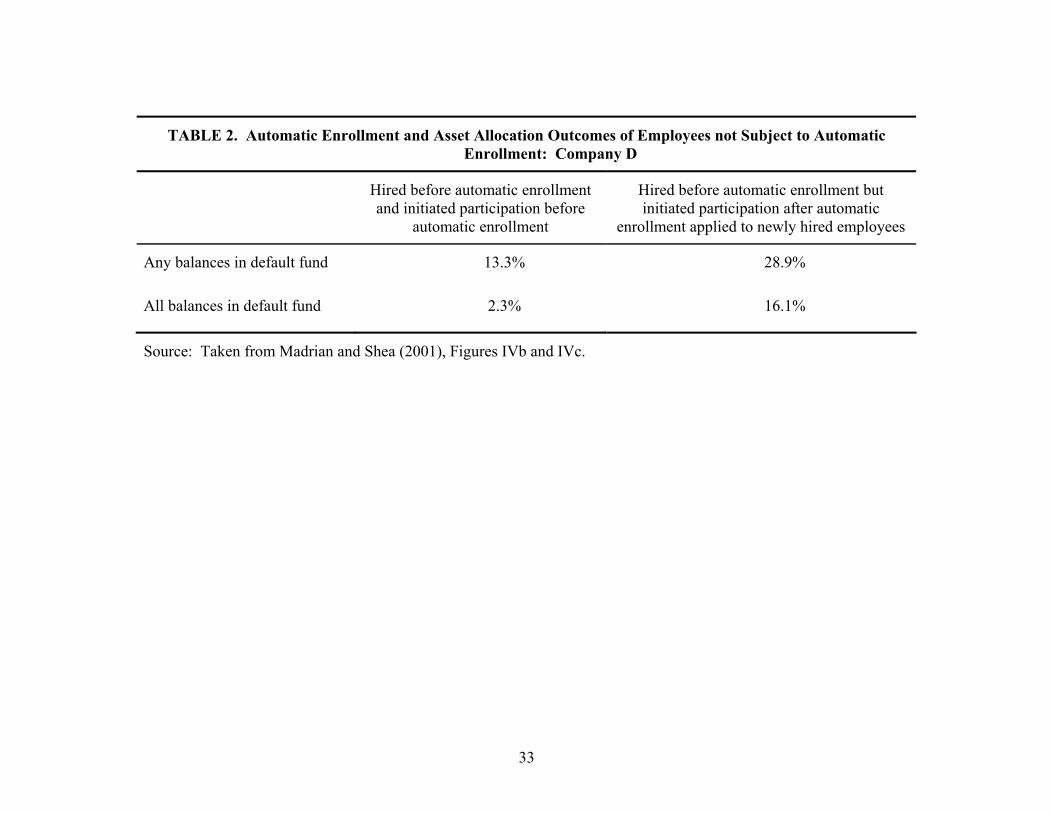
33
TABLE 2. Automatic Enrollment and Asset Allocation Outcomes of Employees not Subject to Automatic Enrollment: Company D
Hired before automatic enrollment and initiated participation before
automatic enrollment
Hired before automatic enrollment but initiated participation after automatic
enrollment applied to newly hired employees
Any balances in default fund 13.3% 28.9%
All balances in default fund 2.3% 16.1%
Source: Taken from Madrian and Shea (2001), Figures IVb and IVc.

34
TABLE 3. Automatic Enrollment and Asset Allocation Outcomes of Employees not at the Automatic Enrollment Default Asset Allocation and Contribution Rate: Companies A and D
Hired before automatic enrollment Hired after automatic enrollment
but not at the default asset allocation and contribution rate
Company A
Any balances in default fund 9.8% 86.1%
All balances in default fund 1.4% 61.1%
Company D
Any balances in default fund 18.2% 71.3%
All balances in default fund 5.2% 30.8%
Source: Authors’ calculations (Company A) and Madrian and Shea (2001) Table VII (Company D).

FIGURE 1. Automatic Enrollment for New Hires and Savings Plan Participation: Company A
0%
20%
40%
60%
80%
100%
0 6 12 18 24 30 36 42
Tenure (months)
Frac
tion
ever
pa
rtic
ipat
ed
Hired and observed before automatic enrollment Hired under automatic enrollment (3% default) Hired under automatic enrollment (6% default)
Source: Authors’ calculations.

36
FIGURE 2. Automatic Enrollment for Existing Non-Participants and Savings Plan Participation: Company A
0%
20%
40%
60%
80%
100%
0 6 12 18 24 30 36 42
Tenure (months)
Frac
tion
ever
par
ticip
ated
Hired before and observed before automatic enrollment Hired before but observed after automatic enrollment
Source: Authors’ calculations.

37
FIGURE 3. Automatic Enrollment for New Hires and the Distribution of 401(k) Contribution Rates:
Company A (15-24 months tenure)
41
28
3
2418
23
9 6 4 2
49
1713
0
10
20
30
40
50
60
0% 1-2% 3% 4-5% 6% 7-10% 11-15%
Contribution Rate
Frac
tion
of E
mpl
oyee
s
Hired under automatic enrollment (3% default) Hired under automatic enrollment (6% default)
Source: Authors’ calculations.

38
FIGURE 4. Automatic Enrollment for Existing Hires and the Distribution of 401(k) Contribution Rates:
Company A (25-48 months tenure)
4 2 3 3
31 30 28
10
60
05
10 10
30
10
20
30
40
50
60
70
0% 1-2% 3% 4-5% 6% 7-10% 11-15%
Contribution Rate
Frac
tion
of P
artic
ipan
ts
Initial participation before automatic enrollment Initial participation after automatic enrollment or never participated
Source: Authors’ calculations.

39
FIGURE 5. Quick Enrollment and Savings Plan Participation: Companies B and C
Before Quick Enrollment
9%Before Quick Enrollment
6%
After Quick Enrollment
34%
After Quick Enrollment
16%
0%
10%
20%
30%
40%
50%
Company B: 4 months after baseline Company C: 4 months after baseline
Frac
tion
Part
icip
atin
g in
Sav
ings
Pla
n
Source: Choi, Laibson and Madrian (2005c).