Financial Illiteracy, Education, and Retirement Saving
35
University of Pennsylvania University of Pennsylvania ScholarlyCommons ScholarlyCommons Wharton Pension Research Council Working Papers Wharton Pension Research Council 1996 Financial Illiteracy, Education, and Retirement Saving Financial Illiteracy, Education, and Retirement Saving B. Douglas Bernheim Follow this and additional works at: https://repository.upenn.edu/prc_papers Part of the Economics Commons Bernheim, B. Douglas, "Financial Illiteracy, Education, and Retirement Saving" (1996). Wharton Pension Research Council Working Papers. 604. https://repository.upenn.edu/prc_papers/604 The published version of this Working Paper may be found in the 1998 publication: Living with Defined Contribution Pensions. This paper is posted at ScholarlyCommons. https://repository.upenn.edu/prc_papers/604 For more information, please contact [email protected].
Transcript of Financial Illiteracy, Education, and Retirement Saving

University of Pennsylvania University of Pennsylvania
ScholarlyCommons ScholarlyCommons
Wharton Pension Research Council Working Papers Wharton Pension Research Council
1996
Financial Illiteracy, Education, and Retirement Saving Financial Illiteracy, Education, and Retirement Saving
B. Douglas Bernheim
Follow this and additional works at: https://repository.upenn.edu/prc_papers
Part of the Economics Commons
Bernheim, B. Douglas, "Financial Illiteracy, Education, and Retirement Saving" (1996). Wharton Pension Research Council Working Papers. 604. https://repository.upenn.edu/prc_papers/604
The published version of this Working Paper may be found in the 1998 publication: Living with Defined Contribution Pensions.
This paper is posted at ScholarlyCommons. https://repository.upenn.edu/prc_papers/604 For more information, please contact [email protected].

Financial Illiteracy, Education, and Retirement Saving Financial Illiteracy, Education, and Retirement Saving
Disciplines Disciplines Economics
Comments Comments The published version of this Working Paper may be found in the 1998 publication: Living with Defined Contribution Pensions.
This working paper is available at ScholarlyCommons: https://repository.upenn.edu/prc_papers/604

Living with DefinedContribution Pensions
Remaking Responsibility forRetirement
Edited byOlivia S. Mitchell and Sylvester J. Schieber
Published byThe Pension Research CouncilThe Wharton School of the University of PennsylvaniaandUniversity of Pennsylvania PressPhiladelphia

Copyright © 1998 The Pension Research Council of the Wharton School of the UniversityofPennsylvaniaAll rights reservedPrinted in the United States of America on acid-free paper
10 9 8 7 6 5 4 3 2
Published byUniversity of Pennsylvania PressPhiladelphia, Pennsylvania 19104-4011
Library of Congress Cataloging-in-Publication Data
Living with defined contribution pensions: remaking responsibilityfor retirement / edited by Olivia S. Mitchell and SylvesterJ. Schieber.
p. em."Pension Research Council publications."Includes bibliographical references and index.ISBN 0-8122-3439-1 (cloth: alk. paper)I. Defined contribution plans - United States. 2. Old age
pensions- United States-Finance. 3. Pension trusts- United StatesFinance. I. Mitchell, Olivia S. II. Schieber, SylvesterJ.HD7105.45.U6L58 1998331.25'2'0973-dc21 98-13584
CIP

Chapter 3Financial Illiteracy, Education, andRetirement Saving
B. Douglas Bernheim
Most Americans save too little to maintain their standards of living afterretirement. In the past, the typical worker has reached retirement withtotal savings insufficient to sustain his or her preretirement living standards (Diamond 1977; Hammermesh 1984).1 Since social security benefits provide rather modest earnings replacement, and since defined benefit plans supplement this income for a shrinking minority of Americanworkers, retirement income security has become increasingly dependenton the adequacy of personal saving. Yet recent research on the adequacyof saving has found that, through the combination of defined contribution plans and nonpension saving, the typical baby boom household issaving at slightly more than one-third the rate required to finance astandard ofliving during retirement comparable to the standard oflivingthat it enjoys before retirement (Bernheim 1993, 1994a, 1995a; Arthur D.Little, Inc. 1993).2 Even workers with defined benefit plans fall short ofthe mark. 3 It is important to emphasize that this calculation does not represent a "worst case" scenario. On the contrary, it is based on many optimistic assumptions concerning longevity, future rates of taxation, andanticipated social security benefits.' Even a moderate increase in futuretaxes would reduce relative saving adequacy below 30 percent, and amoderate reduction in social security benefits would depress it even further, to less than 20 percent. If social security benefits were eliminated,baby boomers would be saving only about one-tenth ofwhat is required toavoid a precipitous decline in standard ofliving after retirement.
The increasing popularity of 401 (k) accentuates these concerns, because it leaves critical decisions concerning participation, contributions,and investments in the hands of employees. Many employees choose tocontribute little, or nothing at all, while others invest heavily in safe, low-
B. Douglas Bernheim 39
return, fixed income funds. As a result, fewer than one-third of pensionplan sponsors believe that their employees will accumulate adequate planbalances."
Why do Americans make such poor financial decisions? One possibilityis that they lack the training, skill, and!or guidance to recognize financial vulnerabilities and to formulate prudent plans. Ifso, then educationpolicy may prove to be a powerful tool for stimulating rates of savingparticularly as 401 (k) plans continue to grow. This possibility led theDepartment of Labor in 1995 to launch a "national pension educationprogram aimed at drawing the attention of American workers to theimportance of taking personal responsibility for their retirement security" (Berg 1995). The desire to shape behavior through education isalso presumably behind the recent explosion of retirement education inthe workplace. As of 1994, 88 percent of large employers offered someform of financial education, more than two-thirds of which added theseprograms after 1990.6
In this chapter, I examine a series of questions central to the issuesdiscussed above. First, is low saving associated with a failure to appreciatefinancial vulnerabilities? Second, even if individuals were aware of theirvulnerabilities, would they typically possess the decision-making skills required to formulate sensible retirement plans? Third, when the requisitedecision-making skills are absent, do individuals obtain authoritative advice and guidance? Finally, iflow saving and poor investment choices areattributable in part to the absence of knowledge, skill, and guidance, is itpossible to address these problems effectively through programs of retirement education, particularly in the workplace?
In answering these questions, I review existing evidence and, whereappropriate, offer pertinent new evidence. Many of my conclusions arepessimistic: the typical household decision-maker underappreciates financial vulnerabilities, is ill equipped to formulate sensible retirementplans, and does not make significant use of authoritative guidance. However, I ultimately find considerable cause for optimism in the emergingbody of evidence on the effects of employer-based retirement education.
Do Households Appreciate Their FinancialVulnerabilities?
The extent to which households perceive their financial vulnerabilities,and the relation between these perceptions and accumulated wealth, isrevealed through an analysis of annual household survey data gatheredby Merrill Lynch, Inc. The first of these surveys was administered in two"waves" during the fall of 1993 to a random, nationally representativesample of individuals between the ages of 29 and 47 (the "baby boom"

40 Financial Illiteracy, Education, and Retirement Saving
cohort). Both waves contain a detailed battery of questions concerninghousehold assets, earnings, income, pension coverage, employment status, and demographic information. The first wave, which surveyed 1,209households, also contains various self-assessments of current financialstatus and of future financial needs, intended saving, and actual saving.Additionally, it measures beliefs and expectations concerning Social Security, including current and future benefit levels, and other informationon attitudes and expectations concerning unfunded government obligations. The second wave, which surveyed 806 households, assesses economic literacy, financial knowledge, developmental experiences thatmay be relevant to financial behavior, and sources of financial information and advice.?
The 1993 survey instrument contains several questions designed toelicit self-evaluations of financial status. These questions include thefollowing:
Would you describe the state of your own personal finances these days as veryshaky, fairly shaky, fairly secure, or very secure?
Overall, how well prepared do you think you are financially for your eventualretirement? (very well prepared, somewhat prepared, somewhat unprepared,very unprepared, or not prepared at all)
Do you expect to have a standard ofliving that is much worse, somewhat worse,somewhat better, much better, or have the same standard ofliving after you retireas you do today?
Overall, the answers to these questions indicate a fairly high degree ofoptimism about personal finances: 68 percent of respondents describedtheir personal finances as fairly secure or very secure, 58 percent believedthat they are very well prepared or somewhat prepared for retirement,while only 19 percent described themselves as very unprepared or not atall prepared. Virtually identical fractions of the population (31 percent)expected better and worse standards ofliving in retirement.
Provided that we have some objective measure of financial vulnerabilities, the answers to questions about personal financial status can beused to evaluate the extent to which individuals recognize these vulnerabilities. One possible measure of financial vulnerabilities is the ratioof wealth to earnings.B A lower value of the wealth-ta-earnings ratio doesnot, however, necessarily indicate greater vulnerability. A particular valueof this ratio may indicate vulnerability for households with certain characteristics, while indicating relative security for households with othercharacteristics.
I therefore separate the population into four "adjusted-wealth" quartiles (Bernheim 1995b). In tuitively, this approach amounts to dividing

B. Douglas Bernheim 4'
TABLE I Perceptions of Financial Security versus Household FinancialPreparation
Index ojfinancial preparedness(quartiles) (%)
1 2 3 4
State ojpersonalfinancesSecure I fairly secure 53.9 71.0 66.4 78.3ShakyIvery shaky 46.1 28.6 33.7 21.7
State ojpreparationJor retirementVery weillsomewhat 44.6 55.2 62.0 68.2Very unprepared I not at all 29.9 9.5 13.0 14.3
Standard ojliving during retirementBetterI much better 29.9 28.6 29.8 36.4Worse/much worse 37.3 32.9 31.7 23.0
Source: Bernheim (I995b). The sample is ",ken from the 1993 Merrill Lynch householdsurve)'.Nole: The "index of financial preparedness" is based on the ratio of wealth to earnings,adjusting for other household characteristics. Households falling into the first quartile havethe lowest level of financial preparedness (relative to similar households), while households falling into the fourth quartile have the highest level of financial preparedness.
the population into numerous subgroups based on age, earnings, gender, marital status, education, pension coverage, and number ofchildrenand then further subdividing each of the groups into quartiles based onwealth-to-earnings ratios. The first, or lowest, adjusted-wealth quartilecorresponds to those individuals in the lowest wealth-to-earnings quartile within each population subgroup. Those individuals in the lowestadjusted-wealth quartile thus have very low levels of wealth compared toother individuals with identical characteristics. The other three adjustedwealth quartiles are defined similarly.9
A household's adjusted-wealth quartile is a good measure of its financial vulnerability, relative to that of similar households. If individualsunderstand their financial vulnerabilities, then those in higher adjustedwealth quartiles should regard themselves as mOre secure than those inlower adjusted-wealth quartiles.
Table I examines this possibility, reporting answers to survey questionsconcerning household financial status, separately for each adjustedwealth quartile. The table exhibits a moderately strong relation betweenactual and perceived financial vulnerability. The fraction of the population that regards its personal finances as secure or fairly secure risessignificantly between the first and second adjusted-wealth quartiles, aswell as between the third and fourth quartiles. Oddly, this fraction de-

42 Financial illiteracy, Education, and Retirement Saving
clines slightly between the second and third quartiles. The fraction of thepopulation describing itself as very well or somewhat prepared for retirement rises monotonically with the household's adjusted-wealth quartile. The respondent's expected relative standard of living in retirementshows the weakest relationship to adjusted wealth. The fraction of thepopulation expecting a better standard of living in retiremen t is highestin the top adjusted-wealth quartile, but varies little across the first threequartiles. On the other hand, the fraction of the population expecting aworse standard of living in retirement falls significantly between the firstand second quartiles, and again between the third and fourth quartiles.(There is also a slight decline between the second and third quartiles.)
Although these results indicate some awareness of relative financialvulnerabilities, they also exhibit an unrealistic degree of optimism.Within the lowest adjusted-wealth quartile - a group that is poorly prepared by any objective measure of adequacy - more than half of therespondents (54%) regard their personal finances as secure or fairlysecure, 45 percent believe that they are very well or somewhat preparedfor retirement, and only 37 percent expect to achieve a lower standard ofliving after retirement.
To put these findings somewhat differently, among the least wellprepared segment of the population, nearly two-thirds believe that theirstandard of living during retirement will be as high or higher than it istoday. This is particularly surprising in light of the fact that most of theseindividuals acknowledge that they save significantly less than they shouldand express little or no confidence in Social Security (Bernheim 1995b).Thus, for a substantial fraction of the population, the failure to saveadequately may result in a failure to appreciate financial vulnerabibtiesadequately, coupled with possible self-deception.
Do Households Have Adequate Decision-Making Skills?
The existing literature contains a fair number ofstudies that shed considerable light on the general public's level of financial sophistication. Sophistication, or the lack thereof, is reflected in both knowledge andchoices.
Collectively, existing studies paint a rather bleak picture of Americans'economic and financial literacy. to For example, only 20 percent of adultscan determine correct change using prices from a menu, and many havetrouble determining whether a mortgage at 8.6 percent is better than amortgage at 8% percent.
The sophistication of choices has also been the subject of extensivestudy. Numerous authors have observed that decision making under uncertainty gives rise to a variety of behavioral anomalies (Kahneman,

B. Douglas Bernheim 43
Siovic, and Tversky 1982). A large number of papers provide formal testsof rational intenemporal choice, with many authors concluding that thelife cycle model does not accurately describe behavior (Shefrin andThaler 1983, 1988; Levin 1992; KotIikoff,johnson, and Samuelson 1987).Numerous authors have also identified particularly naive or unsophisticated patterns of financial behavior. Examples include: a widespreadfailure to take advantage of clear arbitrage opportunities (Warshawsky1987); the common practice of waiting until the end of a tax year to contribute to an IRA (Feenberg and Skinner 1989); the use of rough ruleof-thumb saving targets (Bernheim 1994b); the frequency of identifiableerrors in personal financial management, including insufficient diversification and excessive conservatism in selecting investments (O'Neill 1990,1993); limited familiarity with all but the simplest investment instruments (O'Neill 1993); the use of costly methods of borrowing (Hira1993); the frequency with which personal bankruptcy results from poorcredit management (Hira 1993); the prevalence of "compulsive spending addictions" (Faber and O'Guinn 1989); and the high frequency withwhich individuals fall prey to financial scams (Alliance Against Fraud inTelemarketing 1992).
In summary, the existing literature demonstrates that most Americansknow little about managing personal finances and their choices reflectthis ignorance. While these findings are useful and important, they leavemany central questions unanswered. In particular, it is important to knowwhether iden tifiable population subgroups are particularly at risk ofmaking uninformed or otherwise unsophisticated decisions, and whetherthis lack of information and sophistication relates systematically tobehavior.
In this section, [address these issues using information collected in the1993 Merrill Lynch household survey. The survey instrument containedeleven questions designed to assess the respondent's knowledge of economic matters. These questions are reproduced in the appendix. I havedivided the questions into two subcategories: those that concern financial issues, and those that concern macroeconomic issues. These permitus to examine (1) overall performance on these test questions, (2) variation in relative knowledge over identifiable population subgroups, (3) individuals' awareness of their own sophistication, and (4) preliminaryfindings concerning the relation between knowledge and behavior.
An Analysis ofAbsolute Performance
The sample of respondents surveyed generally performed poorly on economic and financial test questions. This is consistent with the evidencereviewed at the outset of this section. Even allowing for an appropriate

44 Financiallllit«!l'acy, Education, and Retirement Saving
margin of error on certain questions (such as the Dow Jones average),more than 80 percent of the sample answered at least five of the elevenquestions incorrectly.
It is possible LO characterize the nature of financial illiteracy moreprecisely. Nearly twa-thirds of the sample would not hazard a guess as tothe level of the Dow Jones average, despite the fact that this number isreported on the front page of virtually every business section in everydaily newspaper, as well as on ,~rtuallyevery national television and radionews program. The median answer for those professing knowledge was3,400 - more than 300 points below the true range of the average duringthe week of the survey.
More than 90 percent of the sample answered the questions concerning unemployment and inflation, but they overestimated both statistics.The median response concerning unemployment was 8 percent, compared to 6.7 percent nationally at the time of the survey, and roughly onethird named a figure of 10 percent or higher. Similarly, the median response concerning inflation was 4 percent, compared to a rate of 2.8percent at the time of the survey.
Respondents severely underestimated the size of the federal debt,with one-third of the sample reporting a number below $1 trillion.Among those answering this question, the median response was $3 trillion, whereas the correct answer was nearly $4.4 trillion. This discrepancymay be partially attributable to confusion about the differences betweenthe debt and the deficit, as well as to inadvertent errors in orders ofmagnitude (i.e., saying "billions" rather than "trillions"). The surveyseparately asked for the federal debt per household. In theory, this number is far more relevant to the typical taxpayer than the total federal debt,since it measures the amount of liabilities that the government has incurred on his or her behalf. It is therefore striking- but perhaps not toosurprising- that respondents were far more ignorant of the federal debtper household. Whereas 17 percent professed ignorance of the federaldebt, more than one-third, or nearly twice as many, would not hazard aguess as to the federal debt per household. Those answering the questionon debt per household severely underestimated this liability. The mediananswer was $18,000, compared with an actual liability of $45,700.
As noted in other studies, individuals tend to underestimate the powerof compound interest. Nearly one-third of the sample indicated that$1,000, left in the bank for 30 years at 8 percent interest, would earnless than $5,000, whereas the correct answer is more than $10,000.Many respondents also poorly understand common financial instruments. Roughly 42 percent could not identify the proper explanation forthe difference in average returns between mutual funds and federallyinsured CDs.
B. Douglas Bernheim 45
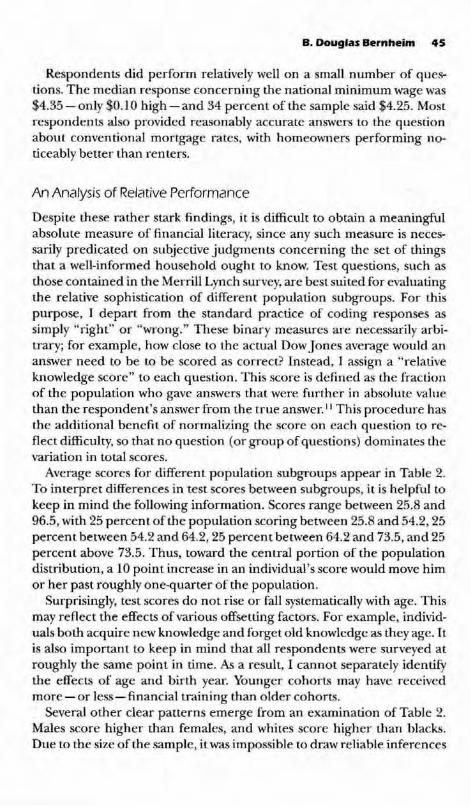
Respondents did perform relatively well on a small number of questions. The median response concerning the national minimum wage was$4.35 - only $0.1 0 high - and 34 percent of the sample said $4.25. Mostrespondents also provided reasonably accurate answers to the questionabout conventional mortgage rates, with homeowners performing noticeably better than renters.
An Analysis of Relative Performance
Despite these rather stark findings, it is difficult to obtain a meaningfulabsolute measure of financial literacy, since any such measure is necessarily predicated on subjective judgments concerning the set of thingsthat a well-informed household ought to know. Test questions, such asthose contained in the Merrill Lynch survey, are best suited for evaluatingthe relative sophistication of different population subgroups. For thispurpose, I depart from the standard practice of coding responses assimply "right" or "wrong." These binary measures are necessarily arbitrary; for example, how close to the actual Dow Jones average would ananswer need to be to be scored as correct? Instead, I assign a "relativeknowledge score" to each question. This score is defined as the fractionof the population who gave answers that were further in absolute valuethan the respondent's answer from the true answer. ll This procedure hasthe additional benefit of normalizing the score on each question to reflect difficulty, so that no question (or group ofquestions) dominates thevariation in total scores.
Average scores for different population subgroups appear in Table 2.To interpret differences in test scores between subgroups, it is helpful tokeep in mind the following information. Scores range between 25.8 and96.5, with 25 percent of the population scoring between 25.8 and 54.2, 25percent between 54.2 and 64.2, 25 percent between 64.2 and 73.5, and 25percent above 73.5. Thus, toward the central portion of the populationdistribution, a 10 point increase in an individual's score would move himor her past roughly one-quarter of the population.
Surprisingly, test scores do not rise or fall systematically with age. Thismay reflect the effects of various offsetting factors. For example, individuals both acquire new knowledge and forget old knowledge as they age. Itis also important to keep in mind that all respondents were surveyed atroughly the same point in time. As a result, I cannot separately identifythe effects of age and birth year. Younger cohorts may have receivedmore - or less - financial training than older cohorts.
Several other clear patterns emerge from an examination of Table 2.Males score higher than females, and whites score higher than blacks.Due to the size of the sample, it was impossible to draw reliable inferences

46 Financial Illiteracy. Education. and Retirement Saving
TABLE 2 Average Normalized Scores from a Test of Economic and FinancialKnowledge
Popuwtion Overall Financial Macroeconomicsubgroup score score scare
Age29-34 63.5 70.1 55.735-40 63.1 69.8 55.041-47 64.2 70.6 56.6
GenderMale 68.5 74.0 62.0Female 58.9 66.5 49.8
RaceWhite 64.3 71.0 56.3Black 55.9 62.0 48.6
EducationCollege degree 68.3 74.8 60.4No college degree 60.6 67.2 52.8
EarningsFirst quartile 59.4 65.8 51.8Second quartile 64.1 69.9 57.2Third quartile 65.5 72.4 57.1Fourth quartile 67.3 74.2 59.0
Source: Author's calculations. Sample taken from the 1993 Merrill Lynch household survey.Note: Test scores are normalized to lie on a scale of 0 to 1DO, based on relative performance.
for any other ethnic subgroup; indeed, even the sample of black respondents is relatively small, and a corresponding measure ofcaution is therefore warranted when evaluating differences between blacks and whites.Average scores rise with both education and income, although perhapsnot by as much as one might expect.
Similar patterns are observed for overall scores, financial scores, andmacroeconomic scores. This reflects the fact that financial and macroeconomic scores are very highly correlated (the correlation coefficient isquite large - 0.51- and highly statistically significant). This is reassuring, since it suggests that the questions are consistently measuring underlying characteristics.
One must exercise considerable caution when interpreting any of thepatterns described above. For example, since earnings, education, gender, and race are all correlated, it is impossible to discern from any givencomparison whether one is observing the incremental effect of changingthe characteristic in question. Proper interpretation of the data requires

B. Douglas Bemheim 47
TABLE 3 Regression Analysis of Normalized Scores from a Test of Economic andFinancial Knowledge
Explanatory Dependent variable
variable Overall score Financial score Macroeconomic score
Age/l0' 0.464 -2.27 3.74(8.44) (8.90) (11.4)
Gender 0.0800 0.0580 0.106(0.0094)* (0.0099)* (0.013)'
Black -0.0561 -0.0576 -0.0544(0.0232)t (0.0245)t (0.0315)
Earnings/IO' 1.39 3.19 -0.775(0.89) (0.91) * (1.17)
Employment status 0.0278 0.0261 0.0298(0.0139)t (0.0147) (0.0188)
High school only 0.0290 0.0409 0.0146(0.0289) (0.0302) (0.0388)
High school plus 0.0746 0.0848 0.0624(no college degree) (0.0283)* (0.0299)* (0.0383)
College degree 0.111 0.122 0.0977(0.028)* (0.030)* (0.0384)*
Constant 0.494 0.562 0.414(0.043)* (0.046) * (0.059)*
Source: Author's calculations. Sample taken from the 1993 Merrill Lynch household survey.*Denotes statistical significance at 1% level.tDenotes statistical significance at 5% level.Note: Forthe purpose of this table, the dependent variables (test scores) are normalized to ascale of 0 to I, rather than 0 to 100 (as for Table 2). Estimates are based on ordinary leastsquares regression. Standard errors are in parentheses.
the estimation of equations that explain test scores as a function of manydemographic and economic factors.
Regression results are presented in Table 3. With respect to overall testscores, virtually all the patterns noted in Table 2 hold up. There is nosystematic relation between test performance and age. Differences basedon gender and race are statistically significant, even holding other variables (such as education and earnings) constant. More educated individuals generally obtain higher scores, and these differences are also statistically significant. Higher earnings are also associated with higher testscores, even controlling for education (as well as the other explanatoryvariables), but this effect is not statistically significant at conventionallevels. In Table 3, I have also controlled for employment status, on thetheory that gainfully employed individuals may be more knowledgeableabout economic matters. Indeed, the estimates bear this out.
Further insight is obtained by examining results for financial knowledge and macroeconomic knowledge separately. These results are nearly

48 Financial illiteracy, Education, and Retirement Saving
identical, with one important exception: financial scores rise with earnings, and this increase is statistically significant, whereas earnings have essentially no effect on macroeconomic scores. Although macroeconomicscores are correlated with earnings (Table 2), this correlation disappearsonce one controls for education, gender, race, and employment status.This finding is intuitive. Individuals with higher earnings almost certainlyhave greater incentives to acquire financial knowledge. For example,those who are able to purchase homes are more likely to follow movements in mortgage rates, and those who own stock are certainly morelikely to follow the DowJones average. Thus, it is not surprising that I finda very strong positive relation between earnings and financial test scores,even when I control for education and other factors. However, those withgreater resources do not necessarily have greater incentives to acquiremacroeconomic information. Indeed, those with fewer resources aremore vulnerable to unemployment and may therefore may pay more attention to employment statistics. Likewise, they may be more concernedabout the minimum wage, and at least as worried about inflation. Thus, itis not surprising that, once one controls for education and other factors,there is essen tially no relation between earnings and macroeconomic testscores. This observation features prominently in the analysis below.
An Analysis of Self-Assessed Financial Knowledge
The 1993 Merrill Lynch household survey also contained an additionalquestion designed to elicit a self-assessment of financial literacy. Specifically, respondents were asked:
Do you consider yourself very financially knowledgeable, somewhat financiallyknowledgeable, only a little financially knowledgeable, or not at all financiallyknowledgeable?
Answers to this question reflect a blend of actual knowledge and selfconfidence. It is therefore of interest to evaluate the accuracy of selfassessments by comparing them with test scores, and to examine systematic differences in self-assessments across population subgroups.
Table 4 provides average test scores (overall, financial, and macroeconomic) bmken down by self-assessments of financial knowledge.This table reveals a strong correlation between self-assessments and testscores. Nevertheless, this correlation is, perhaps, less pronounced thanone might imagine. The average overall score among those pronouncingthemselves "very financially knowledgeable" was 67.1, corresponding tothe 57th percentile, whereas the average overall score among those describing themselves as "not at all financially knowledgeable" was 58.9,corresponding to the 38th percentile. It is noteworthy that those who are,

B. Douglas Bernheim 49
TABLE 4 Mean Normalized Scores from a Test of Economic and FinancialKnowledge versus Self-Assessed Financial Knowledge
Mean norrrulliz.ed score
Overall Financial MacroeconomicSelfasse.<.<ed knowledge score score score
Very financially knowledgeable 67.1 73.5 59.4Somewhat financially knowledgeable 64.2 70.8 56.3Only a little financially 59.7 65.9 52.3
knowledgeableNot at all financially knowledgeable 58.9 68.2 47.7
Source: Author's calculations. Sample taken from 'he 1993 Merrill Lynch household survey.Nole: Test scores are normalized to lie on a scale oCO to 100. based on relative performance.
by their own account, "not at all financially knowledgeable" actuallyobtained a higher average financial score than those who called themselves"only a little financially knowledgeable." In contrast, the average macroeconomic score rises monotonically with self-assessed knowledge. Thisobservation raises the possibility that self-assessments of financial knowledge might actually reflect macroeconomic knowledge more closely thanfinancial knowledge. I return to this issue below.
Table 5 provides summary statistics for self-assessed knowledge for various population subgroups. For each subgroup, I report the fraction ofrespondents describing themselves as either "very financially knowledgeable" or "somewhat financially knowledgeable." Most of the patternshere are similar to those noted for test scores (Table 2). There is noapparent relation between age and self-assessed financial knowledge; theyoungest and oldest baby boomers consider themselves equally well informed on financial matters. Males generally believe themselves to bemore financially knowledgeable than females, and self-assessed financialknowledge rises with education and earnings. There are, however, somenotable differences between the patterns exhibited in Tables 2 and 5.The quantitative impact of gender, education, and earnings are very similar in Table 2 (test scores). For example, average overall scores for malesand females differ by 9.6 points, scores for those with and without collegedegrees differ by 7.7 points, and scores for those in the top and bottomearnings quartiles differ by 7.9 points. In contrast, the relation betweenself-assessed knowledge and earnings is much more pronounced thanthe relation between self-assessed knowledge and education, which is inturn more pronounced than the relation between self-assessed knowledge and gender. Specifically, the difference between the summary statistics reported for those in the top and bottom earnings quartiles in Table 3is 0.201, compared to a difference of only 0.109 for those with and with-

50 FinancialllJiteracy. Education. and Retirement Saving
TABLE 5 Demographic Patterns in Self-Assessed Financial Knowledge
Population subgroup
Age29-3435-4041-47
GenderMaleFemale
RaceWhiteBlack
EducationCollege degreeNo college degree
EarningsFirst quartileSecond quartileThird quartileFourth quartile
Percent consid£ring themselves eithersomewhat or very financially knowledgeable
80.278.680.1
83.675.8
80.278.8
86.375.4
70.175.779.890.2
Source: AUlhor'scalculations. Sample taken from me 1993 Merrill Lynch Household Survey.
out college degrees, and a difference of 0.078 between men and women.In addition, there is practically no difference in self-assessed financialknowledge between whites and blacks, despite the differences in testscores noted in Table 2.
Of course, these preliminary observations are based on simple correlations. Estimates of probit specifications explaining high self-reportedfinancial knowledge are presented in Table 6. The central patterns observed in Table 5 are unchanged: men have higher self-assessed knowledge than women; self-assessed knowledge is essentially unrelated torace, but rises with education. Notably, self-assessed knowledge is stronglyrelated to earnings. Recall that, once other variables are controlled for,financial test scores are strongly related to earnings, while macroeconomic test scores are not. In this important respect, self-assessed financialknowledge behaves more like financial test scores than like macroeconomic test scores.
A comparison of the results in Tables 3 and 6 reveals that our explanatory variables affect test scores differently than they affect self-assessed

B. Douglas Bernheim 5'
TABLE 6 Probit Regression Analysis, Explaining High Self-Assessed FinancialKnowledge
Explanatory variable Coefficient
Age/104
Gender
Black
Earnings/10'
Employment status
High school only
High school plus(no college degree)
College degree
Constant
0.482(1.04)0.293(0.116)*0.0913(0.280)66.6(21.0) 1
0.0968(0.160)1.06(0.309) t
1.16(0.305)11.34(0.309)-1.07(0.505)*
Source: Author's calculations. Sample taken from the 1993 Merrill Lynch Household Survey.Note: Estimates are based on a probit regression. which explains the probability that selfassessed financial knowledge is high. The dependent variable is set equal to 1 when selfassessed financial knowledge is high, and zero otherwise. Standard errors are in parentheses.*Denotes statistical significance at5% level.tDenOles statistical significance at I% level.
knowledge. Under the obviously debatable assumption that test scoresaccurately measure economic and financial knowledge,'2 this suggeststhat certain population subgroups may systematically overestimate orunderestimate their financial sophistication. Young baby boomers are nomore likely to be excessively or insufficiently confident than older babyboomers. The most obvious candidates for overconfidence include thosewith high earnings, those with high school diplomas, the nonworking,and blacks (alternatively, low earners, those not finishing high school,workers, and whites may be underconfident). College-educated individuals and women may also, on average, be overconfident in their financialsophistication.
The Relation Between Saving and Financial Knowledge.
Thus far, I have argued that many individuals are relatively ignorant ofeconomic and financial matters, that they underappreciate their finan-

52 Financial Illiteracy. Education. and Retirement Saving
TABLE 7 Knowledge and Retirement Savings
Stock ojretirement savings as %ojannual earnings
Median Mean
Test SCOTe quartile432
Self-assessed financial knowUidgeVerySomewhatOnly a little bitNot at all
37.628.322.214.9
41.326.413.50.0
87.369.752.842.1
12662.433.231.6
Source: Author's calculations. Sample taken from the 1993 Merrill Lynch Household Survey.
cial vulnerabilities, and that they save too little. It is natural to conjecturethat these phenomena are related. If so, then there is reason to hope thatbehavior is responsive to education. I discuss direct evidence on therelation between education and behavior below. Here, I consider anintermediate question: does greater financial knowledge tend to promote more adequate saving?
There is, without any question, a powerful quantitative relation between economic knowledge and personal saving. As shown in Table 7, themedian ratio of retirement savings to earnings for those receiving thehighest test scores (those in the fourth quartile) was roughly two-anda-half times as large as the median ratio of retirement savings to earningsfor those receiving the lowest test scores (those in the first quartile).Similarly, the typical individual who describes him/herself as "very financially knowledgeable" has accumulated more than three times as muchas the typical individual who describes him/herself as "only a little financially knowledgeable." Moreover, among those who consider themselves"not at all financially knowledgeable," the median individual has accumulated nothing for retirement. Similar patterns are observed forsample means.
These results do not, however, establish that individuals save more inresponse to the acquisition of economic knowledge. They are equallyconsistent with the possibility that individuals acquire economic knowledge after accumulating significant wealth, in order to manage theirresources with greater competence. As observed above, people may paylittle attention to mortgage rates until they have accumulated sufficient
B. Douglas Bernheim 53
resources to purchase a house, and they may begin to follow the DowJones average only after making significant investments in the stock market. Consequently, the direction of causality in Table 7 is far from clear,and requires further analysis.
Although the accumulation ofwealth provides one possible motivationfor the acquisition of financial knowledge, the level of knowledge presumably varies significantly across the population for other reasons aswell. Ifone can identify a portion of the variation in financial literacy thatdoes not result from differences in wealth, then it should be possible todistinguish between the hypothesis that knowledge causes the accumulation of wealth, and the hypothesis that wealth causes the acquisition ofknowledge. This is done through the use of an instrumental variable. Inthis context, an instrumental variable must be correlated with financialliteracy, but must not itself be affected by wealth.
Above, I also noted that, although financial test scores are stronglyrelated to earnings, macroeconomic test scores are not. This result isintuitive, since those with greater resources do not necessarily havea greater incentive to acquire macroeconomic knowledge. Nevertheless, the correlation between financial knowledge and macroeconomicknowledge is extremely high. Thus, an individual's macroeconomic testscore is a plausible instrument for his or her financial test score.
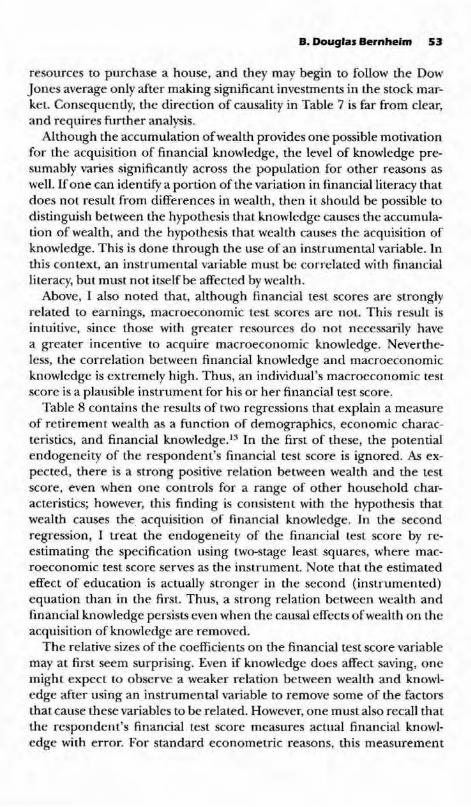
Table 8 contains the results of two regressions that explain a measureof retirement wealth as a function of demographics, economic characteristics, and financial knowledge. '3 In the first of these, the potentialendogeneity of the respondent's financial test score is ignored. As expected, there is a strong positive relation between wealth and the testscore, even when one controls for a range of other household characteristics; however, this finding is consistent with the hypothesis thatwealth causes the acquisition of financial knowledge. In the secondregression, I treat the endogeneity of the financial test score by reestimating the specification using two-stage least squares, where macroeconomic test score serves as the instrument. Note that the estimatedeffect of education is actually stronger in the second (instrumented)equation than in the first. Thus, a strong relation between wealth andfinancial knowledge persists even when the causal effects ofwealth on theacquisition of knowledge are removed.
The relative sizes of the coefficients on the financial test score variablemay at first seem surprising. Even if knowledge does affect saving, onemight expect to observe a weaker relation between wealth and knowledge after using an instrumental variable to remove some of the factorsthat cause these variables to be related. However, one must also recall thatthe respondent's financial test score measures actual financial knowledge with error. For standard econometric reasons, this measurement

54 Financial illiteracy. Education. and Retirement Saving
TABLE 8 Regression Analysis Explaining a Measure ofAccumulated RetirementWealth
Explanatary variable Ordinary least squares Tw(}-stage least squaresestimates estimates
Financial test score 4.26 7.26(1.35) * (2.94)'
Married 0.266 0.130(0.565) (0.579)
Single male 0.005 -0.143(0.657) (0.672)
Black 0.109 0.270(0.881) (0.896)
Respondent's age 0.040 0.0412(0.028) (0.0282)
Number of children -0.206 -0.219(0.140) (0.141)
Household earnings x 106 3.23 2.45(3.18) (3.27)
High school only 1.34 1.20(1.00) (1.01)
High school plus 1.53 1.24(0.99) (1.02)
College degree 2.82 2.37(1.00) * (1.08)'
Constant -9.69 -11.4(1.73)* (2.28)*
SoUTce: Author's calculations. Sample taken from the 1993 Merrill Lynch Household Survey.Notes: The dependent variable is In[ (RS + 1) / (EARN + I)], where In is the natural log. RSis the stock of retirement savings, and EARN is total annual household earnings. I take logsin recognition of me fact mat the distribution of wealth is extremely skewed, in order toreduce the influence of outliers. I add 1 to the numerator and denominator to assure thatthe argument is stricLly positive. Standard errors are in parentheses.Statistical Significance: * = I % level, t = 5% level.
error biases the coefficient of financial knowledge toward zero. The useof an instrument treats both the endogeneity problem and the measurement error problem. Since these effects work in opposite directions, thecoefficient of financial test score could, in theory, either rise or fall; inpractice, it rises.
While these finding are consistent with the hypothesis that greater financial knowledge stimulates saving, my analysis has not proven causality.Even if there is no direct causal relation (in either direction) betweenmacroeconomic knowledge and wealth, it is possible that these two variables are both systematically related to some unobserved third factor (e.g.,the respondent's innate interest in economic issues). For this reason, it isparticularly important to examine the effects ofeducation directly.

B. Douglas Bernheim 55
Do Households Obtain Authoritative Adviceand Guidance?
The fact that households are ill equipped to formulate complex, longterm financial plans does not necessarily imply that they will make poordecisions. In principle, individuals can seek advice and guidance from avariety of qualified sources, including professional financial planners. Inpractice, the market for professional guidance is highly imperfect (seeBernheim 1994b for a discussion of the reasons). Consequently, there isno reason to assume that the mere availability of qualified assistancetranslates into high-quality decision making. In this section, I examineempirical evidence concerning the extent to which households rely ondifferent forms ofguidance.
Table 9 summarizes data from the 1993 Merrill Lynch household survey concerning the relative importance of the five most common sourcesof financial information and advice (parents and other relatives, friends,personal judgment, financial professionals, and print media) .14 Ai; inprevious sections, the data are disaggregated by age, gender, race, education, and earnings. A number of interesting patterns are readily apparent. Younger baby boomers tend to rely more on parents and relativesand less on their personal judgment. The use of financial professionalsappears to peak between ages 35 and 40. For women, parents and relatives are by far the dominant source of financial information and advice.In contrast, for men, parents and relatives rank third behind personaljudgment, but these differences may not be representative given thesmall size of the black subsample. Surprisingly, college-educated individuals are, if anything, slightly less likely to rely on their own personaljudgment. Parents and relatives are also less important as sources offinancial information and advice for those with college degrees. Collegeeducation and earnings are both correlated with greater reliance onfinancial professionals and print media. Those with higher earnings alsotend to seek less information and advice from friends. Although those inthe lowest earnings quartile rely to a much greater extent on personaljudgment, and to a lesser extent on parents and relatives, earnings bearlittle systematic relation to the use of these sources beyond the lowestquartile.
Given the general state of financial literacy, it is worrisome that so manyindividuals rely primarily on their ownjudgment. In the majority ofcases,reliance on parents, relatives, and friends amounts to the blind leadingthe blind. It is therefore noteworthy that somewhere in the neighborhood of60 percent ofvirtually every population subgroup relies primarilyon parents, relatives, friends, and personal judgment. The fraction relying on financial professionals and print media does not exceed 40 per-

56 Financial Illiteracy, Education, and Retirement Saving
TABLE 9 Primary Sources of Financial Information and Advice
Parents/ Friends Personal Financial Printrelatives judgment professional media
Population subgroup (%) (%) (%) (%) (%)
Age29-34 34.9 7.8 22.6 9.1 17.735-40 27.1 6.3 25.6 16.5 17.341-47 23.0 8.0 29.3 11.1 20.2
GenderMale 21.5 7.2 29.9 11.5 23.8Female 34.6 7.7 22.2 13.1 13.3
RaceWhite 28.0 7.6 24.9 13.3 20.0Black 36.4 0.0 36.4 3.0 15.2
EducationCollege degree 23.6 9.3 24.0 15.3 23.3No college degree 31.1 6.2 27.3 10.4 15.3
EarningsFirst quartile 24.7 10.9 32.2 9.2 10.3Second quartile 29.5 11.0 18.5 12.1 19.1Third quartile 27.2 5.8 26.6 11.6 21.4Fourth quartile 29.5 4.6 23.1 15.6 24.3
Source: Author's calculations. Sample taken from the 1993 Merrill Lynch Household Survey.
cent for any population subgroup. Thus, it seems likely that most individuals lack an authoritative, reliable source of information and advice,
The Effects of Retirement Education in the Workplace
At this point, it is useful to summarize a number of key findings. MostAmericans are not making adequate financial preparations for their futures. As a result, financial vulnerabilities are widespread. Poor financialplanning tends to be associated with a failure to appreciate these vulnerabilities. Households generally exhibit an excessive degree of optimismconcerning their financial status, This perceptual failure may reflect amore general problem of financial illiteracy. Although those with highearnings and college degrees tend to obtain higher scores for financialliteracy, their scores still indicate substantial deficiencies. Finally, mosthouseholds do not compensate for the lack of financial decision-makingskills by seeking and obtaining assistance from qualified authorities.
In the past few years, numerous companies-particularly those that

B. Douglas Bernheim 57
sponsor participant-<iirected plans - have moved to bridge the financialliteracy gap by offering retirement education programs. In light of theevidence developed in the preceding sections, it is conceivable that theseprograms could have a significant impact on behavior. In this section, 1review some of the existing evidence on this topic, and provide some newevidence.
Previous Studies
Much of the evidence on the effects of retirement education in the workplace is derived from qualitative surveys and case studies. According toMilne et 'II. (1995),92 percent of 401 (k) participants say that they readmaterials provided by their employers; of those, 44 percent say that theyallocate their funds differently, and 33 percent say that they contributemore to their plans. Employers who enhanced their educational effortsalso tend to report increases in participation (A. Foster Higgins & Co.,Inc. 1994), and case studies frequently cite dramatic changes in behavior(Milne et 'II. 1995; Borleis and Wedell 1994) .
Two recent studies provide formal econometric evidence on the effectsof employer-based retirement education. One analysis, by Bernheim andGarrett (1996), is based on a fall 1994 Merrill Lynch household survey ofroughly 2,000 individuals between the ages of 30 and 48. The authorsexamine the relations between various measures of saving and two keyeducational variables. The first measures whether the respondent's employer offers some sort of retirement education program, while the second indicates whether the respondent actually makes use of the program.
Conceptually, it may seem more appropriate to control for participation in educational programs, rather than the mere availability of suchprograms. The authors are concerned, however, about the possible effects of endogeneity. They provide various kinds of evidence in supportof the proposition that education tends to be adopted as a remedialmeasure, and therefore is negatively correlated with factors th'lt predispose respondents to save more. This means that cross-sectional relations between saving and the availability of education are probably conservative, in the sense that they understate the causal effect of education.It is conceivable, however, that the usage of education, conditional onavailability, is positively correlated with the inclination to save. This couldproduce a spurious positive correlation between saving and educationalusage.
Bernheim and Garrett's measures of employer-based retirement education are obviously coarse. Unfortunately, the 1994 Merrill Lynch household survey did not gather detailed descriptions of program structureand content. One must therefore view their study as an investigation of

58 Financial Illiteracy, Education, and Retirement Saving
TABLE 10 The Effects of Retirement Education in the Workplace: Results Basedon a Survey of Households
Availability ofeducatilm,incremental effect
Usage ofeducation,incremental effect
Total saving rate (%)First quartile 1.29* 1.83*Median 1.65* 2.18*Third quartile 0.82 1.04
Retirement saving rate (%)First quartile 0.60t 1.50*Median 0.92* 1.83*Third quartile 0.94 1.62*
RespondRnt's 401(k)Participation rate (%) 11.8* 19.5*Balances, first quartile 1,113t 2,161 *Balances, median 2,5081 2,826*Balances, third quartile 6,084t 2,714
Spouse's 401(k)Participation rate (%) 9.5t 8.0t
Balances, first quartile 1,0221 1,069*Balances, median 420 1,205Balances, third quartile 466 436
Source: Bernheim and Garrett (1996). Sample taken from the 1994 Merrill Lynch Household Survey.Notes: Effects on saving rates and participation rates are measured in percentage points.Statistical significance: * = 99% level, t = 95% level, ' = 90% level.
the average effects of educational activities: it probably understates theeffects of the best programs,
Key findings from Bernheim-Garrett are summarized in Table 10, Several robust patterns emerge, One is that the availability of education hasa powerful effect on the typical respondent, raising the median totalsaving rate by 1,65 percent of income. This reflects a 28 percent increaseover the median saving rate among those who do not have access toretirement education in the workplace (6 percent of income), Similarly,the median retirement saving rate rises by 0,92 percent of income, whichis a 31 percent increase over the median retirement saving rate amongthose without access to employer-based retirement education (3 percentof income), Finally, median 401 (k) balances increase byjust over $2,500,which represents a 50 percent increase over median 401 (k) balancesamong those without access to retirement education ($5,000), These

B. Douglas Bernheim 59
effects represent large proportional changes, relative to those for whomeducation is unavailable.
Another conclusion is that the estimated effects for usage ofeducationare generally greater than those for availability. This stands to reason.However, it is worth reiterating that one should exercise caution wheninterpreting the results for usage. Perhaps the strongest results (both interms of proportional effect and in terms of statistical significance) areobtained for those who are least inclined to save (i.e., at the first savingquartile of the population distribution). In contrast, little or no effect isusually detected among those who are most inclined to save (i.e., those atthe third quartile). This is exactly what one expects to find. If educationnudges each household toward an appropriate mode of behavior, itsimpact on low and average savers should bear little resemblance to itsimpact on high savers; even the sign of the effect could be different. Oneexception is the substantial positive effect of educational availability onrespondents' 401 (k) balances among high savers ($6,084). It is particularly interesting that a stronger result is obtained for availability than forusage ($2,714). There is, however, a natural explanation. High savers maybe constrained by plan limits on 401 (k) contributions that are necessitated by nondiscrimination requirements. If education induces otheremployees to contribute more, then the respondent can contribute moreas well, irrespective of whether he or she makes use of the education.Under this hypothesis, the primary factor determining the effect of education on 401 (k) contributions at the third quartile would be availability,rather than usage, exactly as the results indicate.
Additional results illustrate that education has a particularly powerfuleffect on rates of participation in 401 (k) plans. This is consistent withother findings indicating that education is most effective at modifyingthe behavior of those who are least inclined to save. Finally, the availability (and usage) of education at the respondent's workplace appearsto have positive spillovers on choices made in the context of a spouse's401 (k) plan. The effects are, however, smaller than for respondents, andonly statistically significant among those least inclined to save (i.e., at thefirst quartile, and for participation rates).
A second study, by Bayer, Bernheim, and Scholz (1996), analyzes employer surveys fielded by KPMG Peat Marwick in 1993 and 1994. KPMGPeat Marwick annually surveys roughly 1,000 plan sponsors, approximately half of which have 401 (k) plans. There is an effort to survey thesame firms in consecutive years, so it is possible to use the surveys as ashort panel. The analysis of employer survey data is complementary toBernheim and Garrett's (1996) use of household survey data. With employer survey data, one cannot investigate the effects of education on
60 Financial Illiteracy, Education, and Retirement Saving
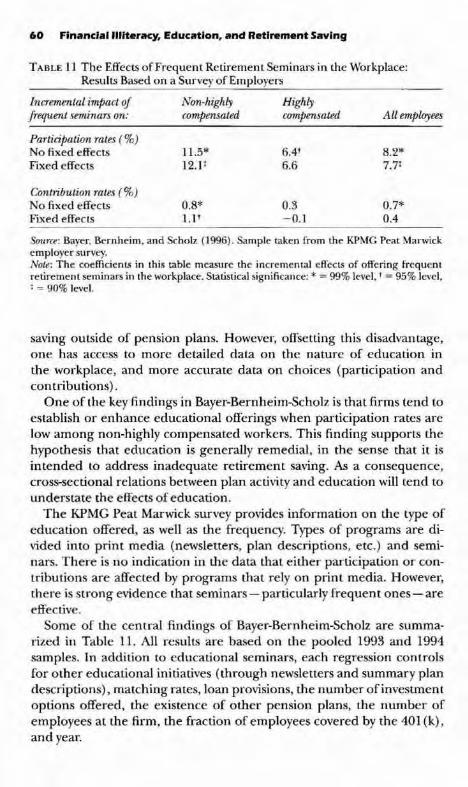
TABLE 11 The Effects of Frequent Retirement Seminars in the Workplace:Results Based on a Survey of Employers
Incremental impact oj Non-highly Highlyfrequent seminars on: compensated compensated AII employees
Participation rates (%)No fixed effects 11.5* 6.4t 8.2*Fixed effects 12.1 1 6.6 7.7:
Contribution rales (%)No fixed effects 0.8* 0.3 0.7*Fixed effects l.l t -O.l 0.4
Source: Bayer, Bernheim, and Scholz (1996). Sample taken from the KPMG Peat Marwickemployer survey.Nole: The coefficienL'i in this table measure the incremental effects of offering frequentretirement seminars in the workplace. Statistical significance: * = 99% level. -t = 95% level,: = 90% level.
saving outside of pension plans. However, offsetting this disadvantage,one has access to more detailed data on the nature of education inthe workplace, and more accurate data on choices (participation andcontributions) .
One of the key findings in Bayer-Bernheim-Scholz is that firms tend toestablish or enhance educational offerings when participation rates arelow among non-highly compensated workers. This finding supports thehypothesis that education is generally remedial, in the sense that it isintended to address inadequate retirement saving. As a consequence,cros~sectionalrelations between plan activity and education will tend tounderstate the effects ofeducation.
The KPMG Peat Marwick survey provides information on dle type ofeducation offered, as well as the frequency. Types of programs are divided into print media (newsletters, plan descriptions, etc.) and seminars. There is no indication in the data that either participation or contributions are affected by programs that rely on print media. However,there is strong evidence that seminars - particularly frequent ones - areeffective.
Some of the central findings of Bayer-Bernheim-Scholz are summarized in Table 11. All results are based on the pooled 1993 and 1994samples. In addition to educational seminars, each regression controlsfor other educational initiatives (through newsletters and summary plandescriptions), matching rates, loan provisions, the number of investmentoptions offered, the existence of other pension plans, the number ofemployees at the firm, the fraction of employees covered by the 401 (k),and year.
B. Douglas Bernheim 61
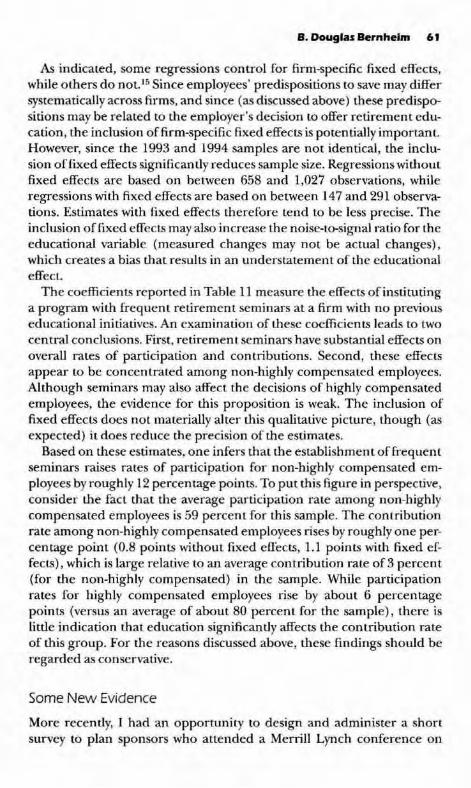
As indicated, some regressions control for firm-specific fixed effects,while others do not. 15 Since employees' predispositions to save may differsystematically across firms, and since (as discussed above) these predispositions may be related to the employer's decision to offer retirement education, the inclusion of firm-specific fixed effects is potentially important.However, since the 1993 and 1994 samples are not identical, the inclusion offixed effects significantly reduces sample size. Regressions withoutfixed effects are based on between 658 and 1,027 observations, whileregressions with fixed effects are based on between 147 and 291 observations. Estimates with fixed effects therefore tend to be less precise. Theinclusion of fixed effects may also increase the noise-to-signal ratio for theeducational variable (measured changes may not be actual changes),which creates a bias that results in an understatement of the educationaleffect.
The coefficients reported in Table 11 measure the effects of institutinga program with frequent retirement seminars at a firm with no previouseducational initiatives. An examination ofthese coefficients leads to twocentral conclusions. First, retirement seminars have substantial effects onoverall rates of participation and contributions. Second, these effectsappear to be concentrated among non-highly compensated employees.Although seminars may also affect the decisions of highly compensatedemployees, the evidence for this proposition is weak. The inclusion offixed effects does not materially alter this qualitative picture, though (asexpected) it does reduce the precision of the estimates.
Based on these estimates, one infers that the establishment offrequentseminars raises rates of participation for non-highly compensated employees by roughly 12 percentage points. To put this figure in perspective,consider the fact that the average participation rate among non-highlycompensated employees is 59 percent for this sample. The contributionrate among non-highly compensated employees rises by roughly one percentage point (0.8 points without fixed effects, 1.1 points with fixed effects), which is large relative to an average contribution rate of 3 percent(for the non-highly compensated) in the sample. While participationrates for highly compensated employees rise by about 6 percentagepoints (versus an average of about 80 percent for the sample), there islittle indication that education significantly affects the contribution rateof this group. For the reasons discussed above, these findings should beregarded as conservative.
Some New Evidence
More recently, I had an opportunity to design and administer a shonsurvey to plan sponsors who attended a Merrill Lynch conference on

62 Financial illiteracy, Education, and Retirement Saving
401 (k)s. Surveys were mailed to the participants in advance of the conference so that respondents would have access to relevant company records. Approximately 200 employers were represented at the conference,of which roughly 20 percent (40 companies) completed surveys. Whilethere is precedent in the academic literature for using small employersurveys to examine aspects of401 (k) plans (Papke, Petersen, and Poterba1993), it is certainly natural to wonder whether the current survey isrepresentative. It is possible to get some sense for this issue by comparingresponses to those obtained from broader surveys.
Reported rates of participation in 401 (k) plans averaged 71 percent,ranging from a low of 20 percent to a high of 98 percent; 89 percentmatch employee contributions, and 84 percent permit loans against planbalances. Of those providing education (78% of the total), 97 percentcover principles ofasset allocation, 83 percent discuss retirement incomeneeds, and 79 percent cover retirement income sources. All these numbers are similar to figures obtained from larger surveys that are regardedas representative.
Among respondents offering education, newsletters (69%) and otherwritten materials (86%) were the most common forms of employee communications. However, more than half (55%) used seminars, 38% provided one-{)n-one counseling, 21 percent offered interactive software,and 16 percent sponsored participatory workshops. The most importantreasons given for offering education, both among those with programsand among those thinking about establishing programs, were that "employees were not thinking enough about retirement" and to "increaseparticipation generally." This reinforces the finding that education isremedial (and hence that cross-sectional relations between participationand education understate the effects of education).
Table 12 reports three regressions based on this 1995 survey. The firstrelates 401 (k) participation rates to the availability of education, theavailability of an employer match, the ability to take loans against planbalances, and the vintage of the 401 (k) program (i.e., the number ofyears the program has been in effect). Despite the small size of the sample, the estimated effects of education and matching provisions are largeand highly significant. Controlling for other factors, participation is, onaverage, 18.5 percentage points higher in firms that offer education. Theestimated effects of matching and loan provisions are consistent withresults based on the much larger KPMG Peat Marwick surveys. The regression also indicates that participation rates tend to be higher for olderprograms.
As discussed above, the survey also contained information on the typeof education offered. Unfortunately, the sample size is too small to identify statistically significant differences between the effectiveness of differ-

B. Douglas Bernheim 63
TABLE 12 The Effects ofRetirement Education in the Workplace:New Regression Analysis
Dependent variable
Explanatory variable Participation rate Participation rate Change in(%) (%) participation rate
Education 18.5 13.2 12.0(7.6) * (8.2)! (4.8) *
High frequency 11.9(7.6)1
Match 23.6 22.5 5.0(9.81) * (9.6)* (4.4)
Loan -4.44 -9.1 -9.5(9.15) (9.4) (4.5) *
Vintage 0.62 0.46(0.35)1 (0.35)
Source: Author's calculations. Sample taken from the Merrill Lynch 401 (k) Plan SponsorSurvey.Note: The dependent variable is rate of participation. Effects are measured in percentagepoints. Statistical significance: * = 95% level, t = 90% level, : = 85% level.
ent approaches. The one exception to this concerns the frequency ofeducation interventions. Nearly one-third of respondents (32%) provideeducation monthly or quarterly, while 46 percent provide it at lowerfrequencies. The second regression in Table 12 adds a variable that indicates "high frequency" educational offerings, meaning programs withmonthly or quarterly activities. The coefficients of "education" and "highfrequency" are not estimated with a great deal of precision, owing to thesmall sample size. However, these estimates do provide some support forthe view that frequency is a key determinant of impact. While the provision of low-frequency education raises participation rates on average by13 percentage points, high-frequency education increases this rate onaverage by 25 points. This qualitative pattern is consistent with resultsbased on the KPMG Peat Marwick survey.
The final regression in Table 12 is based on retrospective questions,which ask whether there have been any changes in educational offerings,matching rates, or loan provisions during the preceding five years. Thesevariables are coded as +1 if the firm has become more aggressive orgenerous with respect to the activity in question, -1 if it has become lessaggressive or generous, and 0 if there has been no change. Firms alsoreported their participation rates from five years before the survey wastaken; using this response in combination with the current participationrate, I constructed the change in participation over a five-year period.This final regression is of considerable interest, since it removes one
64 Financial illiteracy. Education. and Retirement Saving
important source of potential bias by controlling for firm fixed effects. Insome ways, it is superior to the panel estimates based on the KPMGsample, in that it covers a longer time frame and in that differencing maynot have as large an effect on the noise-to-signal ratios for the independent variables (since the questions on current and past plan provisionsare answered by the same individual).
The results demonstrate that changes in education are strongly relatedto changes in participation. This finding is broadly consistent with theresult obtained from cross-sectional estimates. Notably, the coefficient ofeducation proves far more robust to differencing than the coefficients ofmatching provisions or loans. Once again, this result is qualitatively similar to that obtained with the KPMG Peat Marwick sample. '6
Conclusion
This chapter reviews existing evidence and presents new evidence concerning the financial status of American workers. This evidence depicts acrisis in financial planning. Most Americans are not making prudentfinancial decisions. To a large extent, they are unaware of their financialvulnerabilities, and they lack the knowledge, sophistication, and/or authoritative guidance required to set them on the right track. The evidence suggests that improvements in economic and financial educationand training could go a long way toward encouraging greater saving.
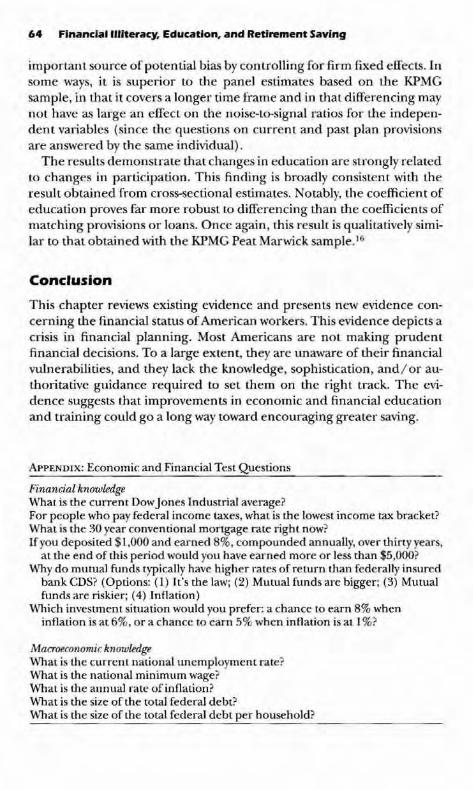
APPENDIX: Economic and Financial Test Questions
Financial knowledgeWhat is the current DowJones Industrial average?For people who pay federal income taxes, what is the lowest income tax bracket?What is the 30 year conventional mortgage rate right now?Ifyou deposited $1,000 and earned 8%, compounded annually, over thirty years,
at the end of this period would you have earned more or less than $5,000?'Nhy do mutual funds typically have higher rates of return than federally insured
bank CDS? (Options: (1) It's the law; (2) Mutualfunds are bigger; (3) Mutualfunds are riskier; (4) Inflation)
Which investment situation would you prefer: a chance to earn 8% wheninflation is at 6%, or a chance to earn 5% when inflation is at I %?
Macroeconomic knowledge"''hat is the current national unemployment rate?What is the national minimum wage?What is the annual rate of inflation?What is the size of the total federal debt?What is the size of the total federal debt per household?

B. Douglas Bernheim 65
I am indebted to Laurence Kotlikoff, Brett Hammond, Steven Ross,and Olivia Mitchell for valuable comments and suggestions. Financialsupport from National Science Foundation (Grant NumberSBR-9409043 and Grant Number SBR95-II321), Merrill Lynch, and ananonymous private foundation is gratefully acknowledged. I would alsolike to thank Merrill Lynch, Inc. for collecting much of the data requiredto conduct this study.
Notes
1. Although Kotlikoff, Spivak, and Summers (1982) dispute this finding, theyattribute the adequacy of retirement preparation to an enormous unanticipatedincrease in Social Security benefits, rather than to adequate saving.
2. Even if baby boomers are unable to maintain their preretirement standardsof living after retirement, they may still fare well in comparison to retirees ofprevious generations. According to a study conducted by the Congressional Budget Office (1993), baby boomers have significantly higher real incomes andgreater accumulated wealth than their parents did at comparable ages. Kingson (1992), Easterlin, Schaeffer. and Macunovich (1993), Cantor and Yuengert(1994), and Yakoboski and Silverman (1994) have reached similar conclusions.While these findings appear to suggest that baby boomers are on track to matchor exceed their parents' standard of living during retirement, caution is warranted for a number ofreasons; see Bernheim (1994·c).
3. See Bernheim (1993, 1994a, 1994b). Arthur D. Little, Inc. (1993) concursthat even those with pension plans typically will have only 50-60 percent of whatthey need to retire comfortably.
4. A study by Auerbach and Kotlikoff (1994) demonstrates that deep cuts inSocial Security, or steep increases in taxes, will be required to achieve long-runfiscal balance between revenues and expenditures. Bernheim (1994a, 1995a)analyzes the importance of these policy scenarios for the adequacy of saving bybaby boomers.
5. Shultz (1996). The article references a recently released survey of 520 plansponsors, conducted by RogersCasy, a pension-eonsulting firm.
6. Pensions and Investments (1995) .7. See Bernheim (1995b) and Bernheim and Garrett (1996) for discussions of
the accuracy and representativeness of the data contained in the Merrill Lynchhousehold surveys.
8. The measure of wealth used in this analysis is total nonhousing wealth,including financial assets, real property, and business interests, net of debt. Formarried couples, I use the combined earnings of both spouses.
9. Formally, this is accomplished by estimating three quantile regressions (median, first quartile, and third quartile), explaining the wealth-to-earnings ratioas a function of household characteristics. Households are then placed intoadjusted-wealth quartiles based on the relation between their actual wealth-toearnings ratios and the fitted ratios from the quantile regressions.
10. See for example Walstad and Soper (1988), Walstad and Larsen (1992),Jordon (1993), the Consumer Federation of America and the American ExpressCompany (1991), and Crenshaw (1993).

66 Financial Illiteracy, Education, and Retirement Saving
11. Suppose, for example, that we ask three individuals, A, B, and C, the samequestion. Suppose that the true answer is "5," that A answers "6," B answers "8,"and C answers "0." Then A would receive a score of 100, B would receive a score of67, and C would receive a score of 33.
12. The test of economic knowledge contained in the Merrill Lynch survey isobviously imperfect. Some discrepancies between self-assessed knowledge andtest scores may be attributable to subtle biases. In particular, cultural bias mayaccount for the disparate effects of race in Tables 3 and 6. Consider, for example,the question on the national unemployment rate. It is well known that surveyrespondents often reinterpret questions, providing answers that are more relevant to their own circumstances. Blacks might well report an unemploymentfigure that is accurate for blacks, but not for the general population. A closerinspection of answers to this particular question reveals that, although the median rate ofunemployment reported by blacks and whites is identical (8 percent),a far larger fraction of blacks report rates in excess of 15 percent. Thus, it appearsthat a sizable minority of black respondents may be interpreting the questiondifferently than intended, and providing an answer that is both more relevant,and more accurate, for their circumstances.
13. The dependent variable is In [(RS+I) / (EARN+ I)], where In is the naturallog, RS is retirement savings, and EARN is total household earnings. I take logs inrecognition of the fact that the distribution of wealth is extremely skewed, inorder to reduce the influence of outliers. I add 1 to the numerator and denominator to assure that the argument is strictly positive.
14. One notable omission from this list is information disseminated by government agencies (e.g., the Social Security Administration). As sources of information and advice on financial planning, government sources ranked behind" prayer," which was volunteered by a surprising number of respondents.
15. When firm-specific fixed effects are omitted, we correct the estimated standard errors by allowing for a correlation between observations on the same firm.
16. The estimated effects of education are generally larger for the MerrillLynch employer survey sample than for the KPMG Peat Marwick sample. It is certainly possible that firms in attendance at the Merrill Lynch conference tended tohave more aggressive education programs than the typical firm. It is also possiblethat the conference sample measures vendor-specific effects. In either case, theresults suggest that the impact of the best educational programs may be significantly larger than that of the average program, as inferred from the broaderKPMG Peat Marwick sample.
References
A. Foster Higgins & Co., Inc. "Survey of Employee Savings Plans, 1994, Report 2:Plan Participation and Discrimination Testing." Princeton, NJ.: A. Foster Higgins & Co., 1994.
Alliance Against Fraud in Telemarketing. "Top Emerging Scams of 1992." Washington, D.G: Alliance Against Fraud in Telemarketing, Winter 1992.
Arthur D. Little, Inc. "America's Retirement Crisis: The Search for Solutions."Final Report to Oppenheimer Management Corporation,June 1993.
Auerbach, Alan]. and Laurence]. Kotlikoff. "The United States' Fiscal and Saving Crises and Their Implications for the Baby Boom Generation." MerrillLynch, Pierce, Fenner & Smith, Inc., February 1994.

B. Douglas Bernheim 67
Bayer, Patrick]., B. Douglas Bernheim, and]. Karl Scholz. "The Effects of Financial Education in the Workplace: Evidence from a Survey of Employers." Stanford, Calif.: Dept of Economics, Stanford University, mimeo, 1996.
Berg, Olena. "DOL to Launch Savings and Pension Education Campaign." EBRJNotes,june 1995: 2.
Bernheim, B. Douglas. "Is the Baby Boom Generation Preparing Adequately forRetirement? Summary Report." New York: Merrill Lynch, Pierce, Fenner &Smith, Inc. ,january 1993.
--. "The Merrill Lynch Baby Boom Retirement lndex." New York: MerrillLynch, Pierce, Fenner & Smith, Inc. ,July 1994. 1994a.
--. "Personal Saving, Information, and Economic Literacy: New Directionsfor Public Policy." In Charles E. Walker, Mark Bloomfield and Margo Thorning, eds. Tax PolicyforEconomic Growth in the 1990s, Washington. D.C.: AmericanCouncil for Capital Formation, 1994: 53-78. 1994b.
--. "The Adequacy of Saving for Retirement: Are the Baby Boomers onTrack?" In Dallas Salisbury and Nora S. jones, eds., Retirement in the 21st Century: Read)' Ctr Not? Washington, D.C.: Employee Benefit Research Institute,1994;73-82. 1994c.
--. "The Merrill Lynch Baby Boom Retirement Index: Update '95." MerrillLynch, Pierce, Fenner & Smith, Inc., mimeo, 1995. 1995a.
--. "Do Households Appreciate Their Financial Vulnerabilities? An AnalysisofActions, Perceptions, and Public Policy." In Tax Policy and Economic Grawth inthe 1990s, Washington, D.C.: American Council for Capital Formation, 1995:3-30. 1995b.
Bernheim, B. Douglas and Daniel M. Garrett. "The Determinants and Consequences of Financial Education in the Workplace: Evidence from a Survey ofHouseholds." Stanford, Calif. Department of Economics: Stanford University,mimeo, 1996.
Borleis, Melvin W. and Kimberly K Wedell. "How to Spark Employee Interestwith Employer Matching Contributions." Profit Sharing,january 1994: 7-16.
Cantor, Richard and Andrew Yuengert. "The Baby Boom Generation and Aggregate Savings." New York: Federal Reserve Bank of New York, mimeo, 1994.
Congressional Budget Office (CBO). "Baby Boomers in Retirement: An EarlyPerspective." ACBO Study, Washington, D.C., September 1993.
Consumer Federation of America and the American Express Company. "HighSchool Competency Test Report of Findings." Working Paper, Washington,D.C., 1991.
Crenshaw, Albert B. "For Too Many, Managing Money Isn't Child's Play." WashingtonPost, October 3,1993: BI-B3.
Diamond, Peter A. "A Framework for Social Security Analysis." Journal ofPublicEconomics 8, 3 (December 1977); 275-98.
Easterlin, Richard A., Christine M. Schaeffer, and Diane]. Macunovich. "Will theBaby Boomers Be Less Well Off Than Their Parents? Income, Wealth, andFamily Circumstances over the Life Cycle." Los Angeles: University of Southern California, mimeo, 1993.
Faber, R. and T. O'Guinn. "Compulsive Consumption and Credit Abuse. "JaurnalofConsumer Policy II (1989): 97-109.
Feenberg, Daniel and Jonathan Skinner. "Sources of IRA Saving." Tax Policy andthe Econamy (1989); 25-46. V3
Hamermesh, Daniel S. "Consumption During Retirement: The Missing Link inthe Life Cycle." Review ofEcCtnomics and Statistics 66, 1 (February 1984): 1-7.

68 Finane/alllllteracy, Education, and Retirement Saving
Milne, Deborah, Jack Vanderhei and Paul Yakoboski. "Can We Save Enough toRetire? Participant Education in Defined Contribution Plans." EBRIIssue BriefNo. 160: Washington, D.C.: Employee Benefits Research Institute, April 1995:3-23.
Hira, Tahira K "Financial Management Knowledge and Practices: Implicationsfor Financial Health." Iowa State University, mimeo, 1993.
Jordan, Mary. "90 Million Lack Simple Literacy." Washington Post, September 9,]993: A], AS.
Kahneman, Daniel, Paul Slovic, and Amos Tversky. Judgment Under Uncertainty:HeU1istics and Biases. Cambridge: Cambridge University Press, ]982.
Kingson, Eric. "The Diversity of the Baby Boom Generation: Implications forTheir Retirement Years." American Association of Retired Persons, Monograph, Washington, D.C., April ]992.
Kotlikoff, Laurence, StevenJohnson, and William Samuelson. "Can People Compute? An Experimental Test of the Life Cycle Consumption Model." NBERWorking Paper No. 2183, 1987.
Kotlikoff, Laurence, Avia Spivak, and Laurence Summers. "The Adequacy ofSavings." American Economic Review 72,5 (December 1982): ]056-69.
Levin, Laurence. "Are Assets Fungible? Testing Alternative Theories ofLife-CycleSavings." Santa Clara, Calif.: Santa Clara University, mimeo, 1992.
O'Neill, Barbara. How Real Peopk Handk Their Money: 35 Financial Planning CaseStudies. New Brunswick, NJ.: Rutgers Cooperative Extension Publications,1990.
--. "Assessing America's FinanciallQ: Realities, Consequences, and Potentialfor Change." Rutgers Cooperative Extension, mimeo, 1993.
Papke, Leslie E., Mitchell Petersen, and James M. Poterba. "Did 401 (k) PlansReplace Other Employer Provided Pensions?" NBER Working Paper No. 4501,October 1993.
Pensions and Investments. "Employees Getting More: Investment Education, Planning Help on the Increase." January 23, 1995: 74.
Schultz, Ellen E. "Executives See Trouble in Employee's Nest Eggs." WaU StreetJournal, March 27, 1996: CI.
Shefrin, Hersh and Richard Thaler. "Life Cycle vs. Self-Control Theories of Saving: A Look at the Evidence." Unpublished mimeo, 1983.
--. "The Behavioral Life-Cycle Hypothesis." Economic Inquiry 26 (1988): 60943,
Walstad, William B. and Max Larsen. "A National Survey of American EconomicLiteracy." National Council on Economics Education, Monograph, Washington, D.C.,July 1992.
Walstad, William B. andJohn C. Soper. "A Report Card on the Economic Literacyof U.S. High School Students." American Economic Review 78, 2 (May 1988):251-56.
Warshawsky, Mark. "Sensitivity to Market Incentives: The Case of Policy Loans."Review ofEconomics and Statistics 69,2 (May 1987): 286~95.
Yakoboski, Paul and Celia Silverman. "Baby Boomers in Retirement: What AreTheir Prospects?" EBRI Special Report and Issue Brief No. 151. Washington, D.C.:Employee Benefits Research Institute,July 1994.