The Impacts of SSD in Your Storage System Author: David Dale, SNIA (NetApp)
32
The Impacts of SSD in Your Storage System Author: David Dale, SNIA (NetApp)
-
Upload
kristopher-hoover -
Category
Documents
-
view
215 -
download
0
Transcript of The Impacts of SSD in Your Storage System Author: David Dale, SNIA (NetApp)
The Impacts of SSD in Your Storage System
Author: David Dale, SNIA (NetApp)
2
SNIA Legal Notice
The material contained in this tutorial is copyrighted by the SNIA unless otherwise noted. Member companies and individual members may use this material in presentations and literature under the following conditions:
Any slide or slides used must be reproduced in their entirety without modificationThe SNIA must be acknowledged as the source of any material used in the body of any document containing material from these presentations.
This presentation is a project of the SNIA Education Committee.Neither the author nor the presenter is an attorney and nothing in this presentation is intended to be, or should be construed as legal advice or an opinion of counsel. If you need legal advice or a legal opinion please contact your attorney.The information presented herein represents the author's personal opinion and current understanding of the relevant issues involved. The author, the presenter, and the SNIA do not assume any responsibility or liability for damages arising out of any reliance on or use of this information.NO WARRANTIES, EXPRESS OR IMPLIED. USE AT YOUR OWN RISK.
Abstract
Solid State in Enterprise Storage Systems Targeted primarily at an IT audience, this session presents a brief overview of the solid state technologies which are being integrated into Enterprise Storage Systems today, including technologies, benefits, and price/performance.
It then goes on to describe where they fit into typical Enterprise Storage architectures today, with descriptions of specific use cases.
Finally the presentation speculates briefly on what the future will bring.
3

4
Agenda
Why flash in the datacenter? Why now?
Memory, cache and storage
Flash in enterprise storage todaySSD storage tierStorage controller-based cacheHost-based flashNetwork cache
What’s next
Conclusion
4
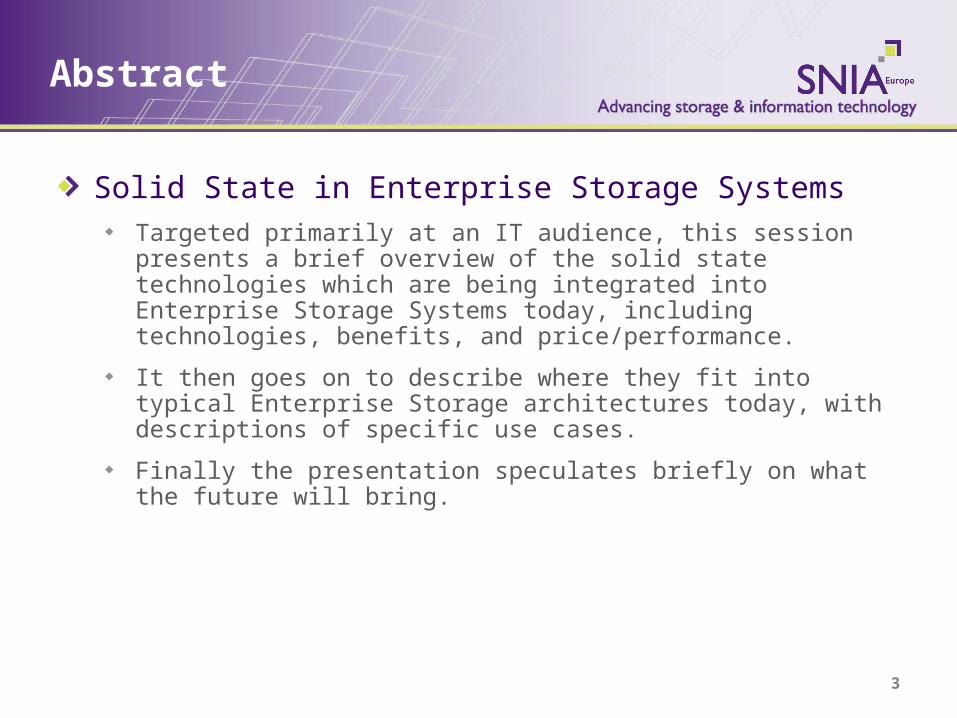
Remembering Jim Gray
“Flash is a better disk …, and disk is a better tape”~2006
Database and systems design pioneer, and co-creator of the Five Minute Rule (1987)
Lost at sea January 2007
5
6
Why Flash in the Data Center Now?
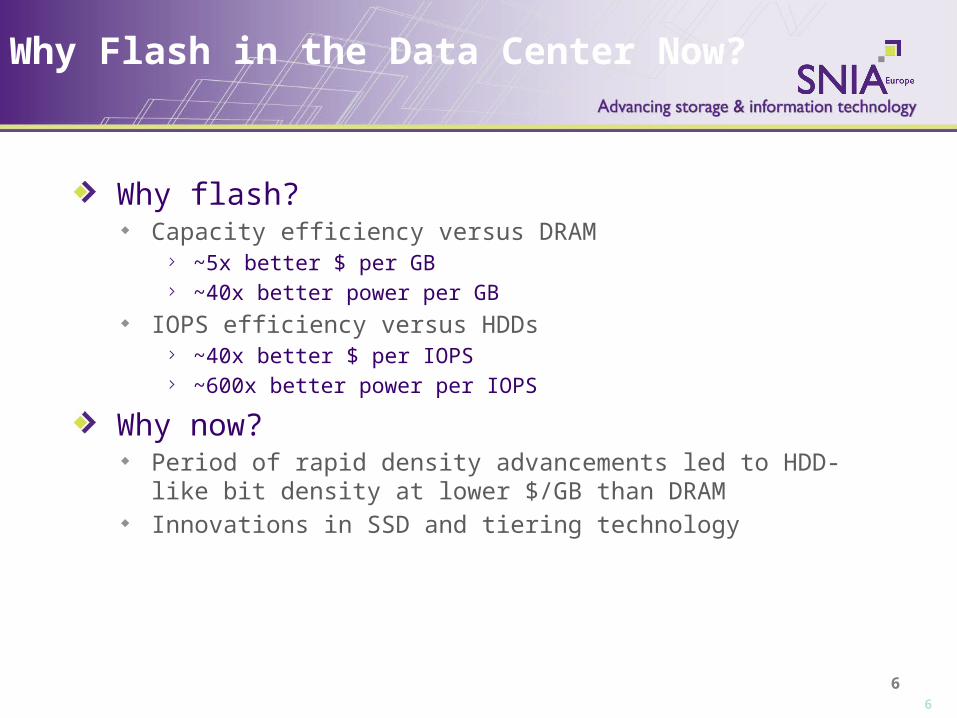
Why flash?Capacity efficiency versus DRAM
~5x better $ per GB~40x better power per GB
IOPS efficiency versus HDDs~40x better $ per IOPS~600x better power per IOPS
Why now?Period of rapid density advancements led to HDD-like bit density at lower $/GB than DRAMInnovations in SSD and tiering technology
6
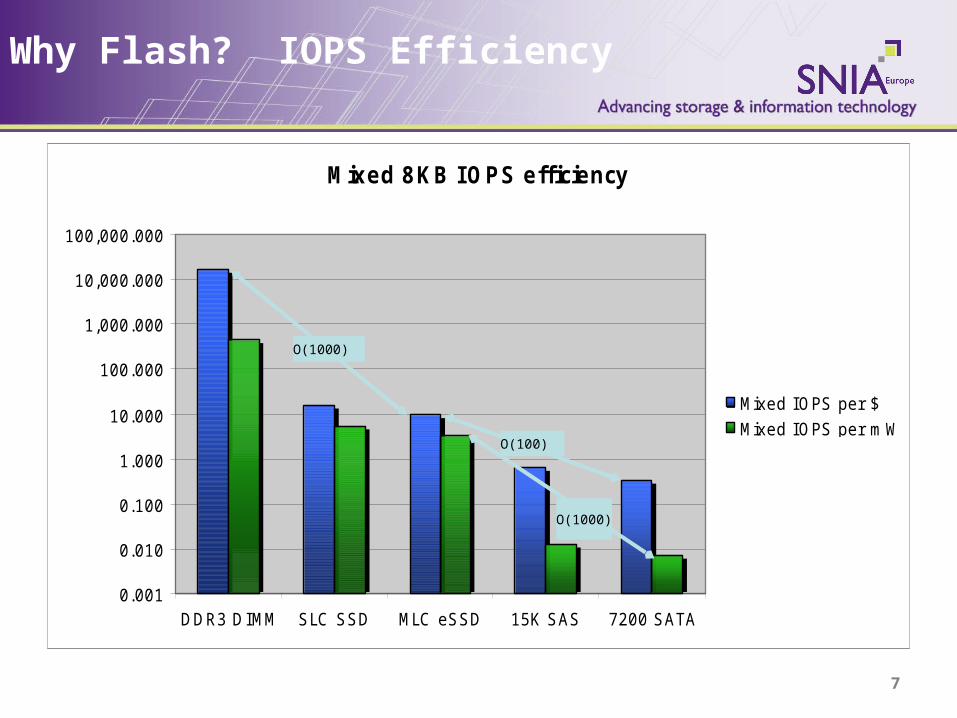
Mixed 8KB IOPS efficiency
0.001
0.010
0.100
1.000
10.000
100.000
1,000.000
10,000.000
100,000.000
DDR3 DI MM SLC SSD MLC eSSD 15K SAS 7200 SATA
Mixed I OPS per $
Mixed I OPS per mW
Why Flash? IOPS Efficiency
O(1000)
O(100)
O(1000)
7

Why Flash? An IOPS Density View
10
100
1,000
10,000
0.1
0
1.0
0
10
.00
10
0.0
0
10
00
.00
Mixed 8KB IOPS per GB
MB
pe
r $
DDR3 DIMM
SLC SSD
MLC eSSD
15K SAS
7200 SATA
Highest MB per $ at agiven IOPS density is best
8

Why Flash? Read Throughput per Watt
Sequential read efficiency
0.001
0.010
0.100
1.000
10.000
100.000
1,000.000
DDR3 DI MM SLC SSD MLC eSSD 15K SAS 7200 SATA
Read MB/sec per $
Read MB/sec per mW
No cost/perfadvantage … but big power &
space benefits
9
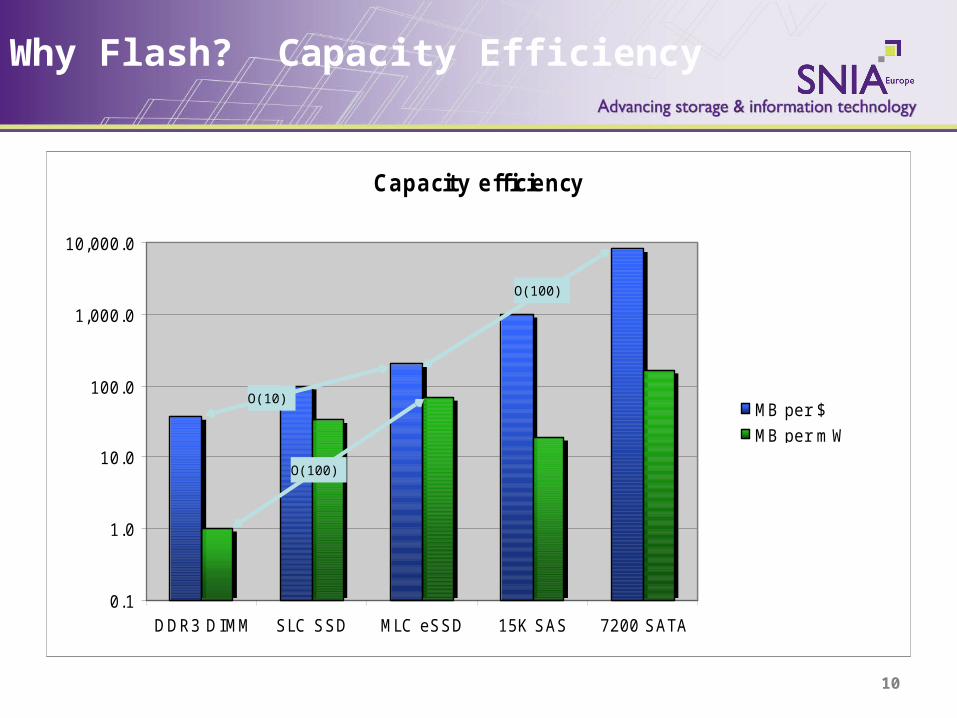
Capacity efficiency
0.1
1.0
10.0
100.0
1,000.0
10,000.0
DDR3 DI MM SLC SSD MLC eSSD 15K SAS 7200 SATA
MB per $
MB per mW
Why Flash? Capacity Efficiency
O(10)
O(100)
O(100)
10

Read latency to first 512 bytes
0.01
0.10
1.00
10.00
100.00
1000.00
10000.00
100000.00
DDR3 DIMM SLC SSD MLC eSSD 15K SAS 7200 SATA
Microseconds
Why Flash? Read Latency
O(100)
O(1000)
11
12
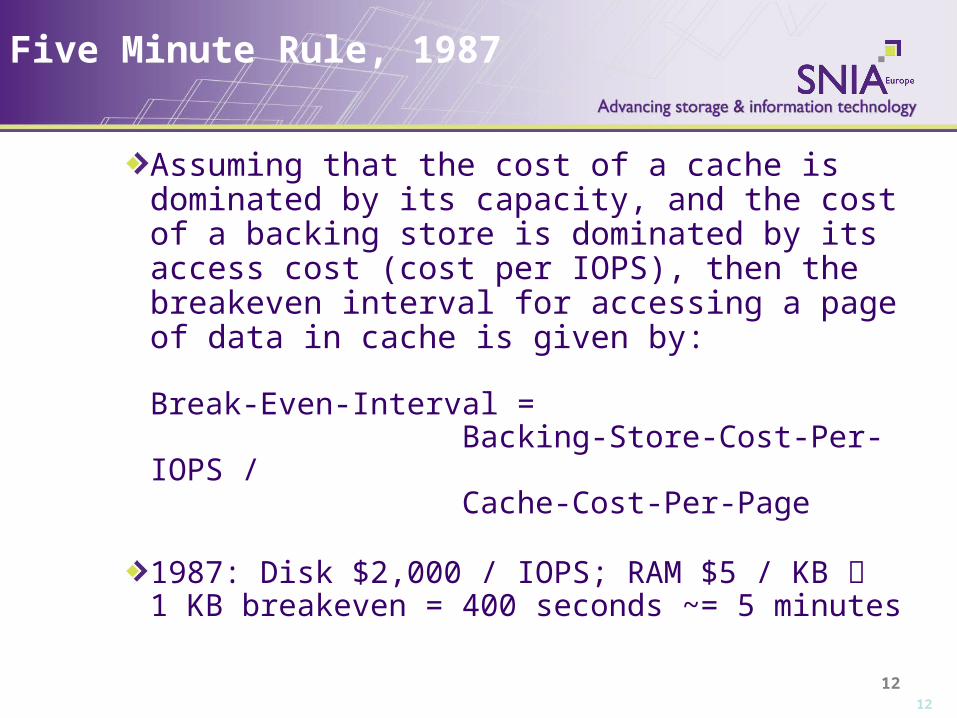
Five Minute Rule, 1987
Assuming that the cost of a cache is dominated by its capacity, and the cost of a backing store is dominated by its access cost (cost per IOPS), then the breakeven interval for accessing a page of data in cache is given by:
Break-Even-Interval = Backing-Store-Cost-Per-IOPS / Cache-Cost-Per-Page
1987: Disk $2,000 / IOPS; RAM $5 / KB 1 KB breakeven = 400 seconds ~= 5 minutes
12

13
Five Minute Rule, 2010: DRAM & HDD
Disk $1 / IOPS (2,000x reduction)
DRAM $25 / GB (200,000x reduction)
100 KB breakeven ~= 5 minutes8 KB breakeven ~= 1 hour1 KB breakeven ~= 10 hours as Gray predicted
200,000x / 2,000x = 100-fold decrease in breakeven access rate for a DRAM cache page backed by disk much bigger DRAM caches
13
14
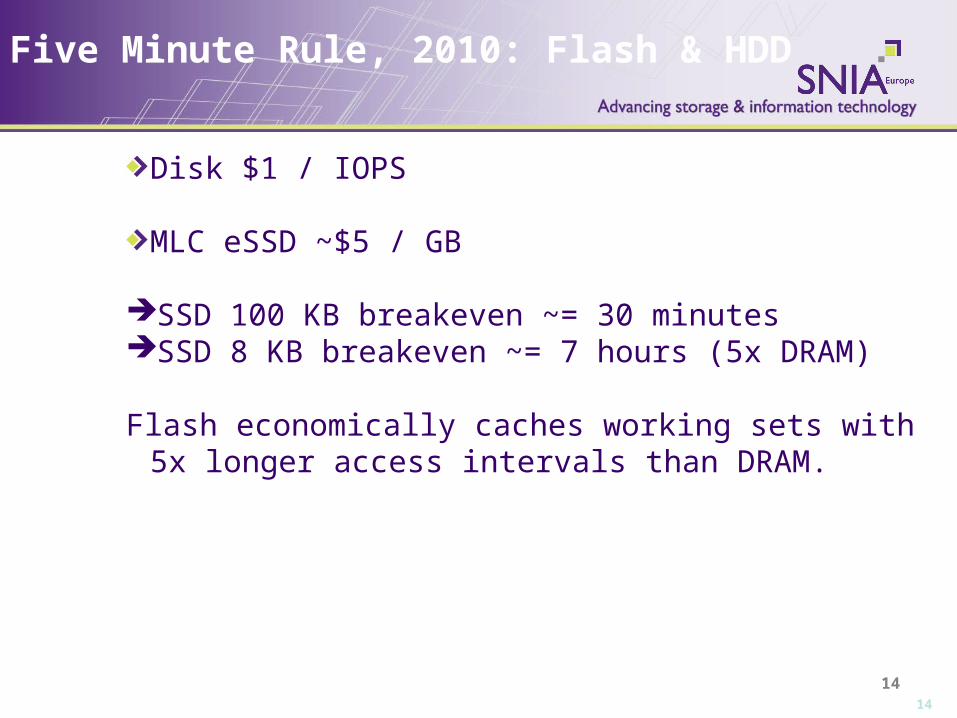
Five Minute Rule, 2010: Flash & HDD
Disk $1 / IOPS
MLC eSSD ~$5 / GB
SSD 100 KB breakeven ~= 30 minutesSSD 8 KB breakeven ~= 7 hours (5x DRAM)
Flash economically caches working sets with 5x longer access intervals than DRAM.
14
15
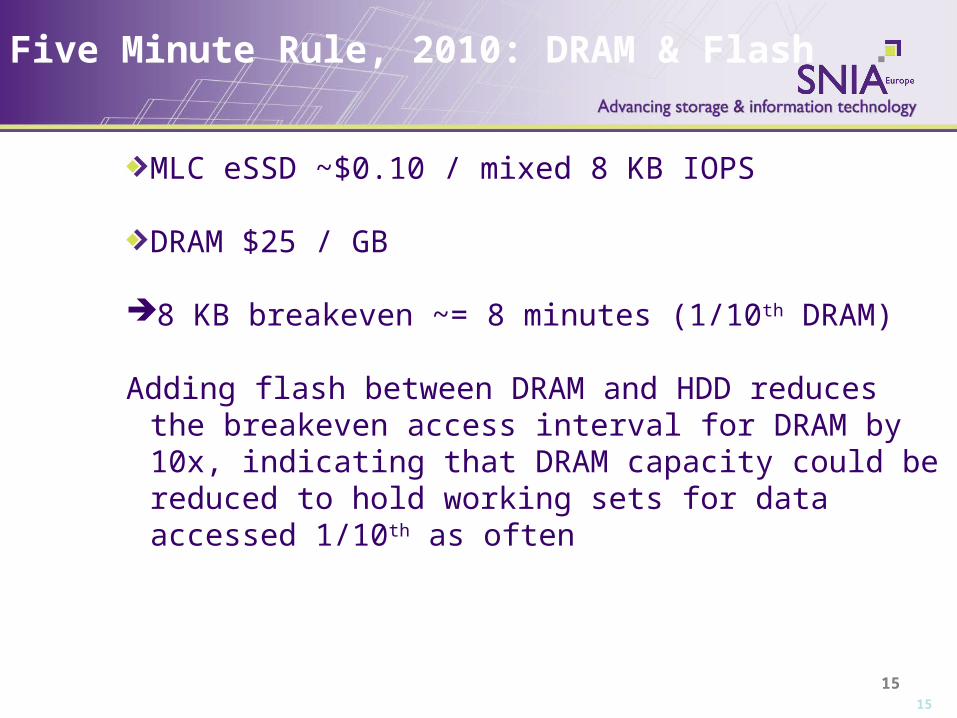
Five Minute Rule, 2010: DRAM & Flash
MLC eSSD ~$0.10 / mixed 8 KB IOPS
DRAM $25 / GB
8 KB breakeven ~= 8 minutes (1/10th DRAM)
Adding flash between DRAM and HDD reduces the breakeven access interval for DRAM by 10x, indicating that DRAM capacity could be reduced to hold working sets for data accessed 1/10th as often
15

16
Storage Networking with Flash
Storage Controllerwith Cache
(B) Flash Cache in Controller
Storage Controller
(A) Persistent Storage
Fewer FC drives
SATA
SSD Tier
Application andDatabase Servers
Fewer FC drives
SATA
Virtualization Clients
StorageNetwork
(D) Solid State Cache in Network
(C) Host–based Flash front end to shared storage array
Server(s) with PCIe-connected Flash

17
Pros Cons
Solid State Drives
Assured performance levels Low cost per IOPS Admin has direct control over
data stored in SSD tier
High cost per gigabyte Requires partitioning of hot data Limited practical applications at
current SSD costs
Controller Cache
Hot data automatically flows into cache – no admin required
Deployment non-disruptive Viable for common enterprise
applications
Cache must be populated before it becomes effective
Less predictable performance than static placement
Host-based Cache/tier
IOPS tier of storage on host; capacity tier on shared storage
Flash on host will become common
Cache and AST implementations
Big variations in implementation capabilities – block granularity ; AST software maturity; degree on admin required
Network Cache
Hot data automatically flows into the caching tier
Deployment relatively non-disruptive
Scalable solution for HPC apps
Cache must be populated before it becomes effective
In-network placement may constrain protocols or use cases
Available Solutions Compared
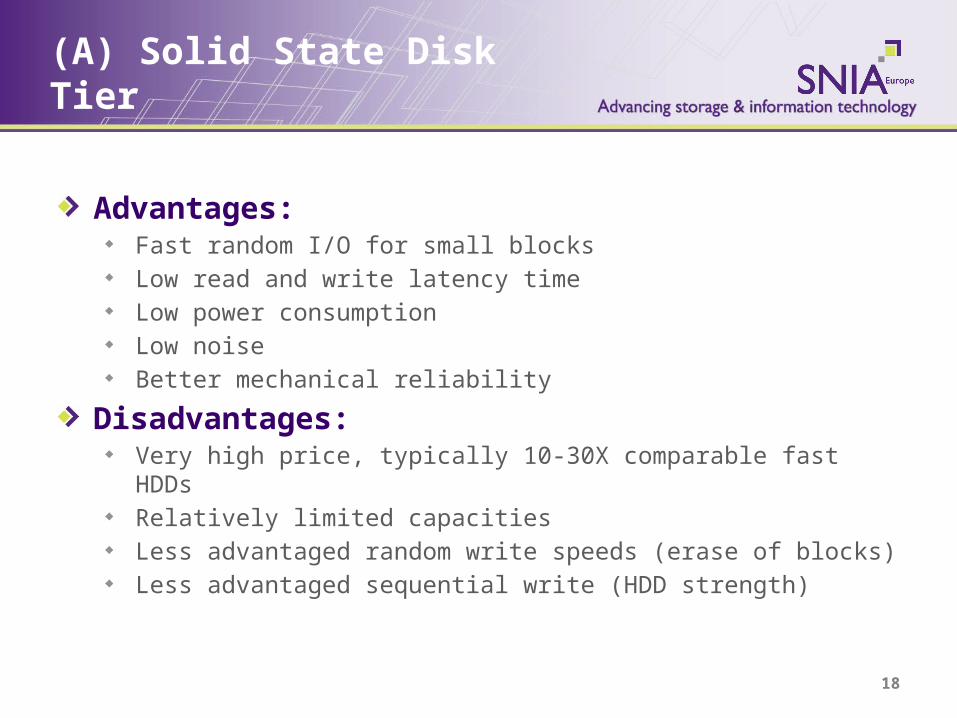
(A) Solid State Disk Tier
Advantages:Fast random I/O for small blocksLow read and write latency timeLow power consumptionLow noiseBetter mechanical reliability
Disadvantages:Very high price, typically 10-30X comparable fast HDDsRelatively limited capacitiesLess advantaged random write speeds (erase of blocks)Less advantaged sequential write (HDD strength)
18
19
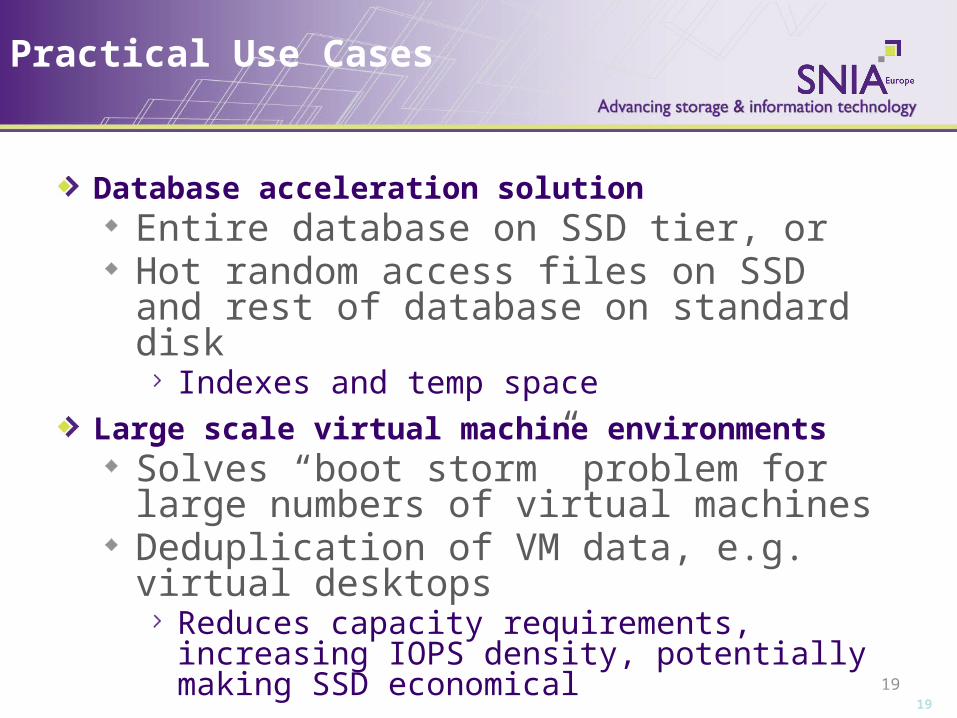
Practical Use Cases
Database acceleration solutionEntire database on SSD tier, orHot random access files on SSD and rest of database on standard disk
Indexes and temp space Large scale virtual machine environments
Solves “boot storm” problem for large numbers of virtual machinesDeduplication of VM data, e.g. virtual desktops
Reduces capacity requirements, increasing IOPS density, potentially making SSD economical
19

Automated Storage Tiering (AST)
Utilizing both SSD and HDD for any workload will be the most cost-efficient use of SSDs in over the next few year
Area of intense innovation among enterprise storage vendors
Media-spanning LUNsHybrid aggregates of volumesAutomated storage tiering software
Issue is to automate data placement and movementAutomated tieringPolicy-based; no administrator overhead imposed
Alternatively you can eliminate data movementCaching implementationsSome vendors refer to this as tier-less storage 20

21
Functions as an intelligent read cache for data and metadata
Automatically places active data where access can be fast
Provides more I/O throughput without adding high-performance disk drives to a disk-bound storage system
Effective for file services, OLTP databases, messaging, and virtual infrastructure
(B) Controller-based Flash Cache

22
Reduce Latency with Flash Cache
FlashCache
FlashCache
Cache hits can reduce latency by a factor of 10 or more

23
Use case: Scale Performance of Disk-bound Systems
Add SpindlesUse more disks to
provide more IOPsMay waste storage
capacityConsumes more
power and space
Starting Point:Need More IOPsPerformance is
disk-boundHave enough
storage capacityRandom read
intensive workload
Add Flash CacheUse cache to
provide more IOPs Improves response timesUses storage efficientlyAchieves cost savings for
storage, power, and space
+Flashcache

24
FC HDD plus Flash Cache Example
0
1
2
3
4
5
6 12 18 24 30 36 42 48 54 60
FC Baseline FC + PAM II
For more information, visit http://spec.org/sfs2008/results/sfs2008nfs.html. SPEC® and SPECsfs2008® are trademarks of the Standard Performance Evaluation Corp .
224 FC drives 64TB
56 FC drives16TB
FC BaselineConfiguration
FC + Flash CacheConfiguration Throughput (k-ops/sec)
Re
sp
on
se
Tim
e (
ms
)
BETTER
WORSE
Benchmarked Configurations SPECsfs2008 Performance
Purchase price is 50% lower for FC + Flash cache compared to Fibre Channel baseline
FC + Flash cache yields 67% power savings and 67% space savings
75% FewerSpindles
Flash cache
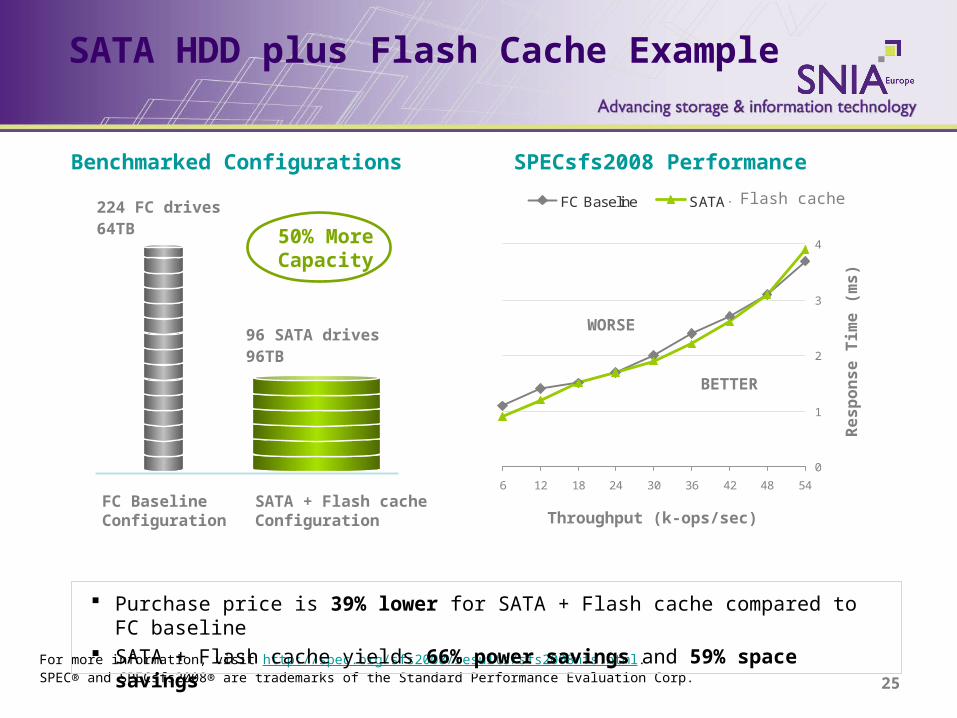
SATA HDD plus Flash Cache Example
0
1
2
3
4
6 12 18 24 30 36 42 48 54
FC Baseline SATA + PAM II
For more information, visit http://spec.org/sfs2008/results/sfs2008nfs.html. SPEC® and SPECsfs2008® are trademarks of the Standard Performance Evaluation Corp.
Throughput (k-ops/sec)
Re
sp
on
se
Tim
e (
ms
)
BETTER
WORSE
Benchmarked Configurations SPECsfs2008 Performance
Purchase price is 39% lower for SATA + Flash cache compared to FC baseline SATA + Flash cache yields 66% power savings and 59% space savings
224 FC drives 64TB
96 SATA drives 96TB
FC BaselineConfiguration
SATA + Flash cacheConfiguration
50% MoreCapacity
Flash cache
25

26
Flash card on PCI bus in host system
Can support storage semantics (SCSI) or device driver model
Acts as Tier 0 storage (IOPS tier) in front of networked storage (capacity tier)
Multiple implementations in development:
Requiring no data movement (caching)
Requiring data movement (AST)
Area of intense industry and standards activity
(C) Host-based Flash

(D) Network Cache Topology
Clients
Origin System
Origin Volume
Clients
NetworkCache
WAN
NetworkCache
WAN
27

28
Practical Use Cases
Network cache solutionsAll files on HDD in shared storage arrayAccelerated by SSD-based network cacheSelf–tuning write-through cache
Same pros and cons as SSD tier
Typical applicationsRenderingSeismicFinancial modelingASIC design
28

Cost Structure of Memory/Storage Technologies
Cost determined by
cost per wafer
# of dies/wafer
memory area per die [sq. mm]
memory density [bits per 4F2]
patterning density [sq. mm per 4F2]
C-22
Chart courtesy of Dr. Chung Lam, IBM Research updated version
of plot from 2008 IBM Journal R&D article
2015
$1 / GB
$10 / GB
$100 / GB
$1k / GB
$10k / GB
$100k / GB
$0.10 / GB
$0.01 / GB
NAND
DesktopHDD
DRAM
1990 1995 2000 2005 2010
EnterpriseHDD
29
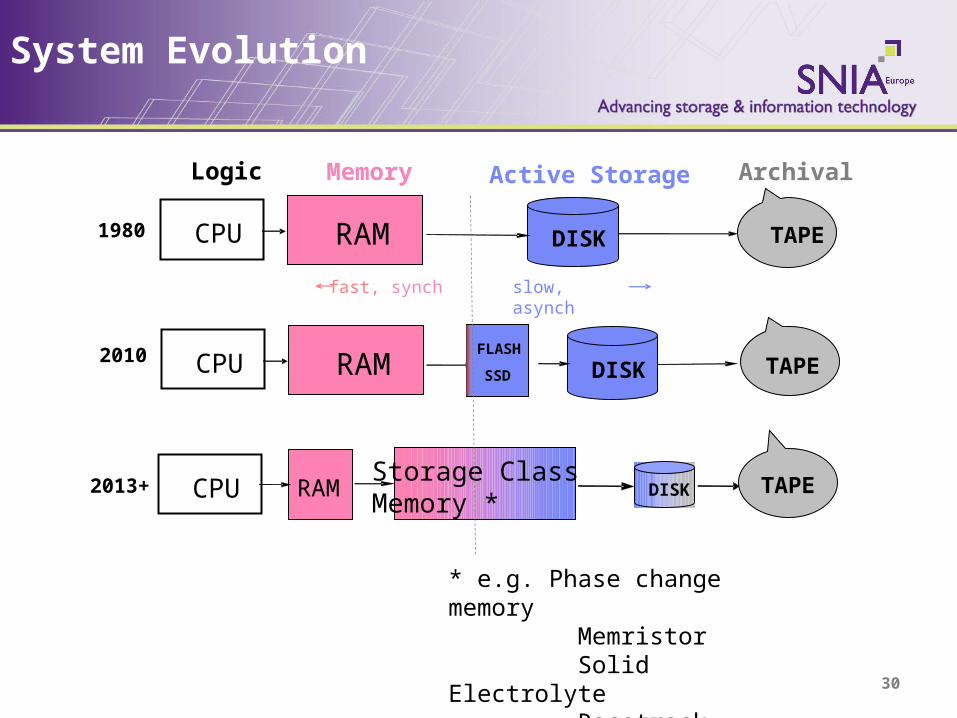
System Evolution
Archival
CPU RAM DISK
CPUStorage Class Memory *
TAPE
RAM
CPU DISK TAPE
2013+
Active StorageMemoryLogic
TAPEDISK
FLASH
SSDRAM
1980
2010
fast, synch slow, asynch
* e.g. Phase change memory Memristor Solid Electrolyte Racetrack memory
30

Summary
Over the next 5 years solid state technologies will have a profound impact on enterprise storageIt’s not just about replacing mechanical media with solid state mediaThe architectural balance of memory, cache and persistent storage will changeToday’s solid state implementations in enterprise storage demonstrate these changesIt’s still only the beginning…
31
32
Q&A / Feedback
Please send any questions or comments on this presentation to SNIA: add your track reflector here
Many thanks to the following individuals for their contributions to this tutorial.
- SNIA Education Committee
David Dale Amit ShahJeff Kimmel Mark WoodsChris Lionetti Alan YoderPhil Mills