THE IMPACT ON AUTO THEFT AND - State of Michigan · 3 The result of all these comprehensive and...
43
THE IMPACT OF AUTO THEFT TRENDS ON AUTO INSURANCE RATES A Report to the Michigan State Legislature Prepared by Michigan's Automobile Theft Prevention Authority July 2001
Transcript of THE IMPACT ON AUTO THEFT AND - State of Michigan · 3 The result of all these comprehensive and...
THE IMPACT OF AUTO THEFT TRENDS
ON AUTO INSURANCE RATES
A Report to the Michigan State Legislature
Prepared byMichigan's Automobile Theft Prevention Authority
July 2001
ii
AUTOMOBILE THEFT PREVENTION AUTHORITY714 South Harrison RoadEast Lansing, MI 48823
Telephone: (517) 336-6197www.miatpa.org
Colonel Michael D. RobinsonChair, Automobile Theft Prevention Authority
Executive Director:
Mr. Valdis A. Vitols
Developed by:
David Tjepkema, Program Coordinator(Please contact him with any comments. E-mail address: [email protected])
250 copies reproduced @ $1.16 per copy, total of $290.00
iii
TABLE OF CONTENTS
Purpose and Scope of the Report . . . . . . . . . . . . . . . . . . . . . . . . . . . . . . . 1
Introduction and Background . . . . . . . . . . . . . . . . . . . . . . . . . . . . . . . . . 2
Executive Summary . . . . . . . . . . . . . . . . . . . . . . . . . . . . . . . . . . . . . . . . . 4
Michigan's Motor Vehicle Theft Experience . . . . . . . . . . . . . . . . . . . . . . 5
Automobile Theft Prevention Authority . . . . . . . . . . . . . . . . . . . . . . . . . 12
Department of Corrections . . . . . . . . . . . . . . . . . . . . . . . . . . . . . . . . . . . . 15
Department of State. . . . . . . . . . . . . . . . . . . . . . . . . . . . . . . . . . . . . . . . . . 19
H.E.A.T. - Help Eliminate Auto Theft Program . . . . . . . . . . . . . . . . . . . 22
Private Sector Technology. . . . . . . . . . . . . . . . . . . . . . . . . . . . . . . . . . . . . 24
Insurance Division. . . . . . . . . . . . . . . . . . . . . . . . . . . . . . . . . . . . . . . . . . . 25
Appendices . . . . . . . . . . . . . . . . . . . . . . . . . . . . . . . . . . . . . . . . . . . . . . . . 31
1
PURPOSE AND SCOPE OF THE REPORT
The Michigan Automobile Theft Prevention Authority has conducted a review of auto theftrates and auto theft insurance rates in Michigan. Data was obtained from the MichiganDepartment of State Police, the Department of Consumer and Industry Services (InsuranceDivision), the Department of Corrections, and the Department of State, which administers thetitling of vehicles and the licensing and regulation of vehicle dealers and vehicle service repairfacilities. The national and other state auto theft data were obtained from Federal Bureau ofInvestigation (FBI) publications.
This report was developed pursuant to the mandate set forth in the Michigan Insurance code(Public Act 10) as amended by Public Act 174 of 1992, which provides in pertinent part:
Sec. 6111. By July of every odd numbered year, the automobile theft preventionauthority shall prepare a report that details the theft of automobiles occurring in thisstate for the previous 2 years, assesses the impact of the thefts on rates charged forautomobile insurance, summarizes prevention programs, and outlines allocationsmade by the authority. The director of the department of state police, insurers, thestate court administrative office, and the commissioner shall cooperate in thedevelopment of the report as requested by the automobile theft prevention authorityand shall make available records and statistics concerning automobile thefts,including the number of automobile thefts, number of prosecutions and convictionsinvolving automobile thefts, and automobile theft recidivism. The automobile theftprevention authority shall evaluate the impact automobile theft has on the citizens ofthis state and the costs incurred by the citizens through insurance, police enforcement,prosecution, and incarceration due to automobile thefts. The report required by thissection shall be submitted to the senate and house of representatives standingcommittees on insurance and the commissioner.
This report specifically addresses the period of 1997 to 1999 and compares auto theft crimetrends both nationally and in Michigan. To provide the broad perspective and continuity withprevious reports, some data is also presented for the period from 1986 to 1995. The reportincludes a brief summary of the major components of Michigan's comprehensive andcooperative effort against auto theft.
2
INTRODUCTION AND BACKGROUND
In 1985, 75,123 motor vehicles were stolen from Michigan residents--the fourth highest statetotal in the nation. At that time, Michigan's theft rate of 828 per 100,000 population was thesecond highest in the nation. Residents demanded that government focus its resources tocombat this serious problem, but additional tax revenues were not available.
On their own initiative, the Michigan Anti-Car Theft Campaign Committee (ACT) had beendeveloping a coalition to increase public awareness of the auto theft problem and possiblesolutions. ACT's coalition included representatives from community groups, lawenforcement, banking, insurance, car rental agencies, automotive manufacturers, prosecutors,judiciary, and the general public. It was ACT's view that cooperation and trust between allthose groups would assist in resolving Michigan's auto theft problem.
In response to the public's reaction to the stress of losing their personal means oftransportation and the resulting higher insurance premiums to pay for the vehicles whichdisappeared, Michigan's legislature developed (P.A. 10 of 1986) an Automobile TheftPrevention Authority (ATPA) and provided funding for the ATPA by collecting one dollarfrom each non-commercial private passenger vehicle insured in Michigan. Those funds(approximately $5.8 million annually) would be collected by insurance companies with theirnormal premiums and passed on to the ATPA once each year.
From 1986 through 2000, the ATPA program has provided nearly $78 million to grantprograms that focus on all aspects of the auto theft problem. Non-profit groups have beenfunded to teach theft prevention techniques to residents and assist the police to identify thelocation of thieves or chop shops. Law enforcement consortiums have been allowed tospecifically focus on the investigation and apprehension of car thieves. Prosecutors have beenable to concentrate on the intricacies of auto theft cases and to convince judges/juries of theseriousness of those crimes.
Fortunately, the objectives of the ATPA have been enhanced by activity in other areas. Thelegislature has built additional prisons that can house convicted auto thieves for longer periodsof time. The Department of State has implemented programs that have successfully closedsome loopholes in the salvage vehicle title area and monitor the use of stolen parts byautomotive repair facilities. Most automobile manufacturers have taken steps to make it moredifficult for thieves to steal vehicles. Many insurance companies have developed their ownspecial auto theft investigation units and have funded a hot-line program (H.E.A.T.) wherebypeople can be rewarded for information which leads to the arrest of an auto thief. Manyvehicle owners have taken advantage of new technological devices to keep their vehicles safe--with alarms, kill switches, electronic tracking systems, and steering wheel locks.
3
The result of all these comprehensive and cooperative efforts has dramatically reducedMichigan's auto theft problem. In 1999, Michigan residents experienced 54,018 motor vehiclethefts--a reduction of 25% from 1986's total of 72,021. In relation to other states, Michigan(1986-1999) is still number five in total thefts, but has fallen from first in theft rate per100,000 population to 6th (1984-1999). From 1986 to 1999, Michigan’s theft rate has beenreduced by 30.5%. In contrast to Michigan's success story, national auto thefts have fallen 6%since 1986, and the national auto theft rate per 100,000 has decreased 17%. The 1999 FBIUniform Crime Report indicates 1,147,305 thefts in the nation, which means a vehicle theftoccurred about every 20 seconds, and the value of stolen vehicles was more than $7 billion.
Michigan's success against auto theft has kept the comprehensive insurance premiums manyof our motorists pay lower than they could be. Even though the average price of newautomobiles has probably doubled since 1987, major insurers have only raised the rate theycharge for comprehensive coverage (that portion of vehicle insurance which pays off aninsured if their vehicle is stolen) by 30% during that time period.
4
EXECUTIVE SUMMARY
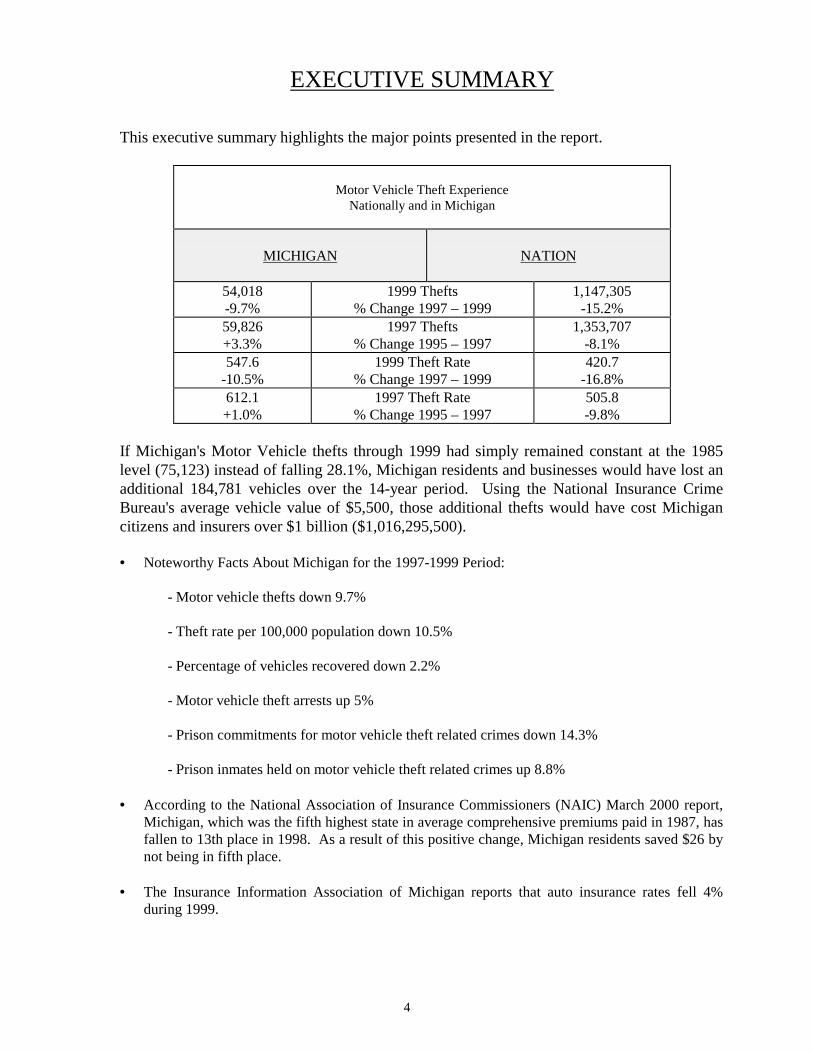
This executive summary highlights the major points presented in the report.
Motor Vehicle Theft ExperienceNationally and in Michigan
MICHIGAN NATION
54,018-9.7%
1999 Thefts% Change 1997 – 1999
1,147,305-15.2%
59,826+3.3%
1997 Thefts% Change 1995 – 1997
1,353,707-8.1%
547.6-10.5%
1999 Theft Rate% Change 1997 – 1999
420.7-16.8%
612.1+1.0%
1997 Theft Rate% Change 1995 – 1997
505.8-9.8%
If Michigan's Motor Vehicle thefts through 1999 had simply remained constant at the 1985level (75,123) instead of falling 28.1%, Michigan residents and businesses would have lost anadditional 184,781 vehicles over the 14-year period. Using the National Insurance CrimeBureau's average vehicle value of $5,500, those additional thefts would have cost Michigancitizens and insurers over $1 billion ($1,016,295,500).
• Noteworthy Facts About Michigan for the 1997-1999 Period:
- Motor vehicle thefts down 9.7%
- Theft rate per 100,000 population down 10.5%
- Percentage of vehicles recovered down 2.2%
- Motor vehicle theft arrests up 5%
- Prison commitments for motor vehicle theft related crimes down 14.3%
- Prison inmates held on motor vehicle theft related crimes up 8.8%
• According to the National Association of Insurance Commissioners (NAIC) March 2000 report,Michigan, which was the fifth highest state in average comprehensive premiums paid in 1987, hasfallen to 13th place in 1998. As a result of this positive change, Michigan residents saved $26 bynot being in fifth place.
• The Insurance Information Association of Michigan reports that auto insurance rates fell 4%during 1999.
5
MICHIGAN'S
MOTOR VEHICLE THEFT EXPERIENCE
NUMBER OF THEFTS
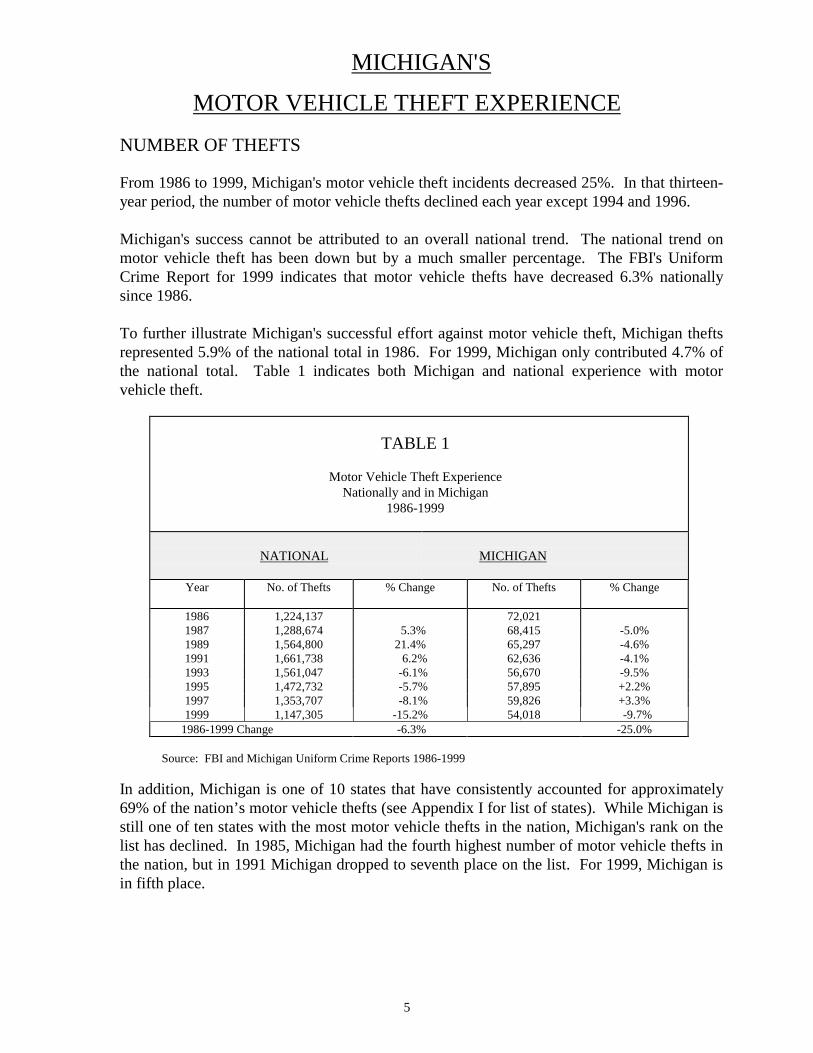
From 1986 to 1999, Michigan's motor vehicle theft incidents decreased 25%. In that thirteen-year period, the number of motor vehicle thefts declined each year except 1994 and 1996.
Michigan's success cannot be attributed to an overall national trend. The national trend onmotor vehicle theft has been down but by a much smaller percentage. The FBI's UniformCrime Report for 1999 indicates that motor vehicle thefts have decreased 6.3% nationallysince 1986.
To further illustrate Michigan's successful effort against motor vehicle theft, Michigan theftsrepresented 5.9% of the national total in 1986. For 1999, Michigan only contributed 4.7% ofthe national total. Table 1 indicates both Michigan and national experience with motorvehicle theft.
TABLE 1
Motor Vehicle Theft ExperienceNationally and in Michigan
1986-1999
NATIONAL MICHIGAN
Year No. of Thefts % Change No. of Thefts % Change
1986 1,224,137 72,0211987 1,288,674 5.3% 68,415 -5.0%1989 1,564,800 21.4% 65,297 -4.6%1991 1,661,738 6.2% 62,636 -4.1%1993 1,561,047 -6.1% 56,670 -9.5%1995 1,472,732 -5.7% 57,895 +2.2%1997 1,353,707 -8.1% 59,826 +3.3%1999 1,147,305 -15.2% 54,018 -9.7%
1986-1999 Change -6.3% -25.0%
Source: FBI and Michigan Uniform Crime Reports 1986-1999
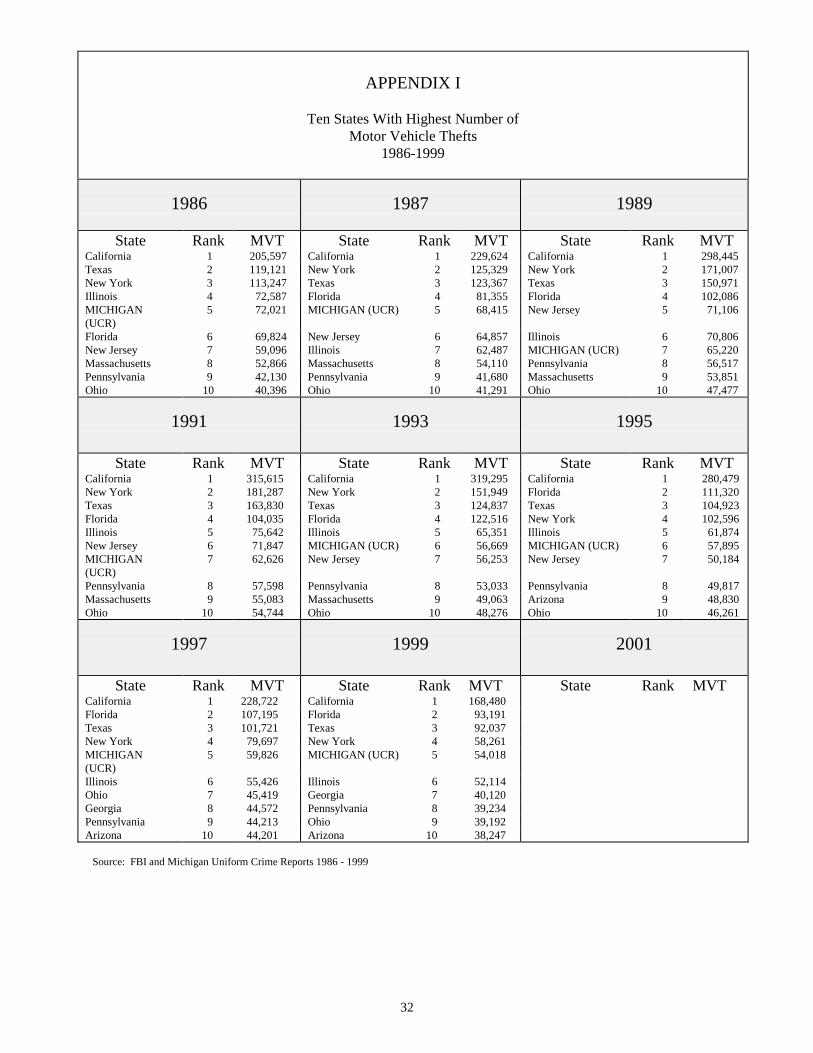
In addition, Michigan is one of 10 states that have consistently accounted for approximately69% of the nation’s motor vehicle thefts (see Appendix I for list of states). While Michigan isstill one of ten states with the most motor vehicle thefts in the nation, Michigan's rank on thelist has declined. In 1985, Michigan had the fourth highest number of motor vehicle thefts inthe nation, but in 1991 Michigan dropped to seventh place on the list. For 1999, Michigan isin fifth place.
6
THEFT RATE PER 100,000 POPULATION
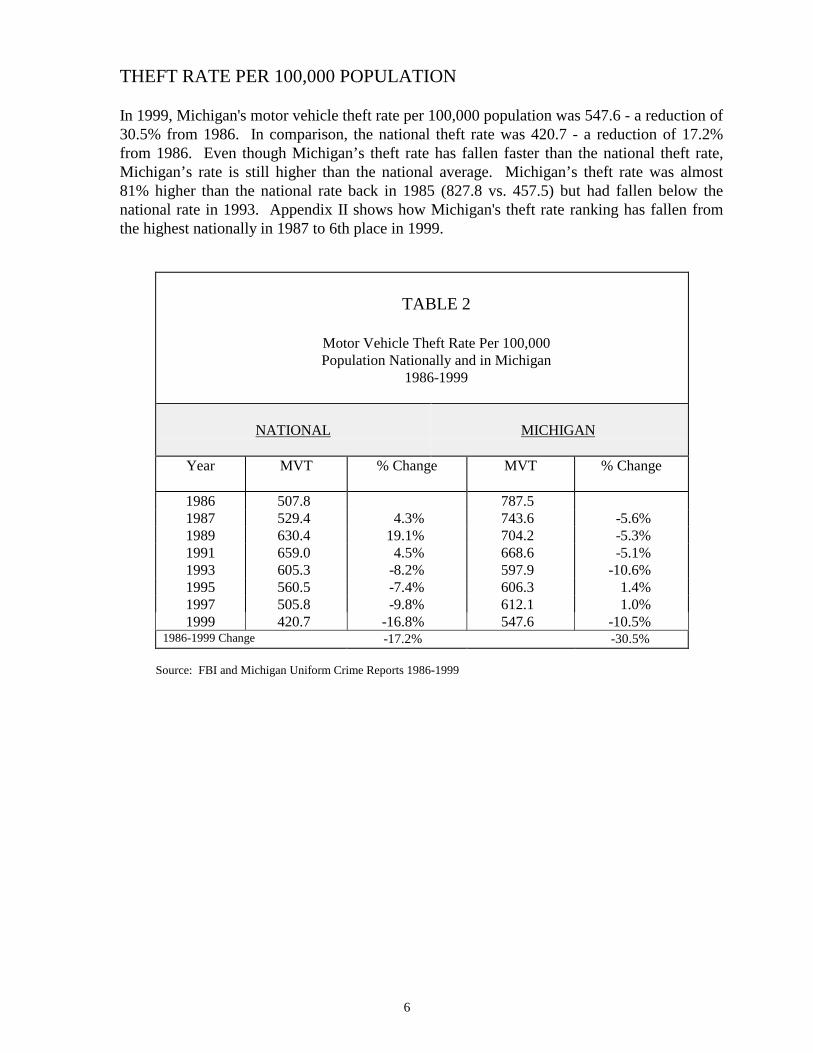
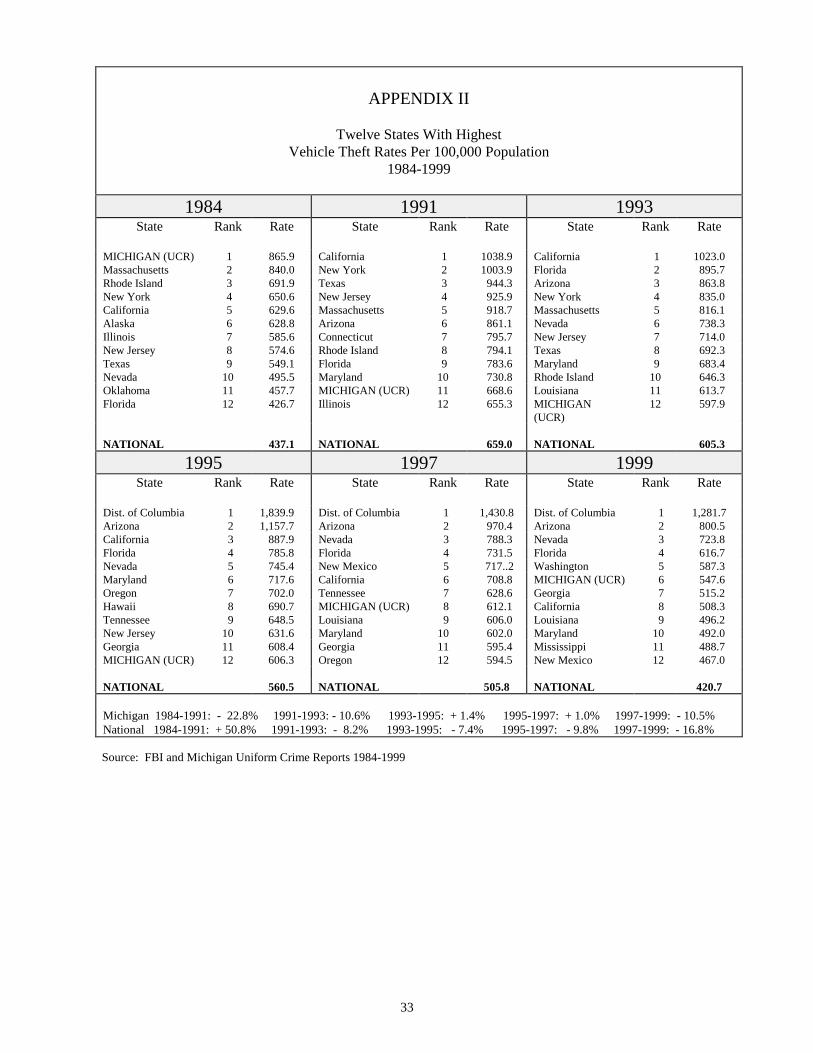
In 1999, Michigan's motor vehicle theft rate per 100,000 population was 547.6 - a reduction of30.5% from 1986. In comparison, the national theft rate was 420.7 - a reduction of 17.2%from 1986. Even though Michigan’s theft rate has fallen faster than the national theft rate,Michigan’s rate is still higher than the national average. Michigan’s theft rate was almost81% higher than the national rate back in 1985 (827.8 vs. 457.5) but had fallen below thenational rate in 1993. Appendix II shows how Michigan's theft rate ranking has fallen fromthe highest nationally in 1987 to 6th place in 1999.
TABLE 2
Motor Vehicle Theft Rate Per 100,000Population Nationally and in Michigan
1986-1999
NATIONAL MICHIGAN
Year MVT % Change MVT % Change
1986 507.8 787.51987 529.4 4.3% 743.6 -5.6%1989 630.4 19.1% 704.2 -5.3%1991 659.0 4.5% 668.6 -5.1%1993 605.3 -8.2% 597.9 -10.6%1995 560.5 -7.4% 606.3 1.4%1997 505.8 -9.8% 612.1 1.0%1999 420.7 -16.8% 547.6 -10.5%
1986-1999 Change -17.2% -30.5%
Source: FBI and Michigan Uniform Crime Reports 1986-1999
7
TABLE 3
Motor Vehicle Thefts forTop 25 Michigan Counties
1986-1999
COUNTY1986
MVT
1993
MVT
1995
MVT
1997
MVT
1999
MVT
%CHANGE
1993 - 1995
%CHANGE
1995 - 1997
%CHANGE
1997 - 1999
WAYNE 43,300 34,949 37,538 40,985 34,106 7 9 (17) OAKLAND 9,310 4,830 4,198 3,383 3,466 (13) (19) 2 GENESEE 3,290 3,296 3,020 4,005 3,252 (8) 33 (19) MACOMB 5,832 3,182 2,965 2,179 2,572 (7) (27) 18 KENT 1,778 1,691 1,284 1,557 1,415 (24) 21 (9)
MUSKEGON 331 611 470 416 1,079 (23) (11) 159 WASHTENAW 1,449 882 1,075 921 912 22 (14) (1) KALAMAZOO 591 775 836 609 738 8 (27) 21 INGHAM 812 1,084 1,077 622 648 (1) (42) 4 SAGINAW 569 468 593 597 609 27 1 2
CALHOUN 244 402 499 564 503 24 13 (11) BERRIEN 408 511 561 317 429 10 (43) 35 JACKSON 308 278 272 368 394 (2) 35 7 MONROE 279 370 354 396 321 (4) 12 (19) ST. CLAIR 261 249 239 257 296 (4) 8 15
OTTAWA 194 210 145 251 264 (26) 73 5 BAY 175 208 260 176 227 25 (32) 29 LIVINGSTON 204 159 151 160 223 (5) 6 39 VAN BUREN 150 176 168 139 162 (5) (17) 17 EATON 122 187 85 168 135 (55) 98 (20)
ALLEGAN 74 125 107 125 122 (14) 17 (2) GRAND TRAVERSE 99 48 68 84 113 42 24 35 MONTCALM 79 88 73 82 98 (17) 12 20 LAPEER 131 72 97 44 94 35 (55) 114 ISABELLA 48 18 78 71 88 333 (9) 24
STATE TOTAL 72,021 56,670 57,895 59,826 54,018 2 3 (10)
Source: Michigan Uniform Crime Reports 1986-1999
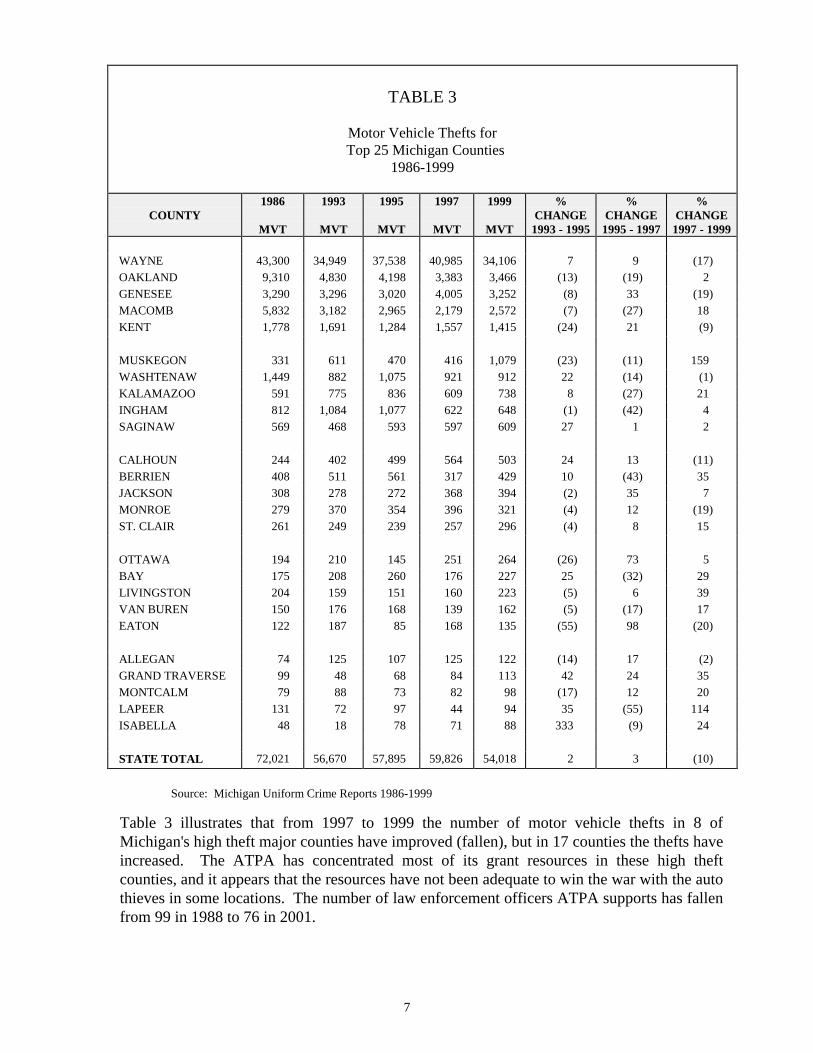
Table 3 illustrates that from 1997 to 1999 the number of motor vehicle thefts in 8 ofMichigan's high theft major counties have improved (fallen), but in 17 counties the thefts haveincreased. The ATPA has concentrated most of its grant resources in these high theftcounties, and it appears that the resources have not been adequate to win the war with the autothieves in some locations. The number of law enforcement officers ATPA supports has fallenfrom 99 in 1988 to 76 in 2001.
8
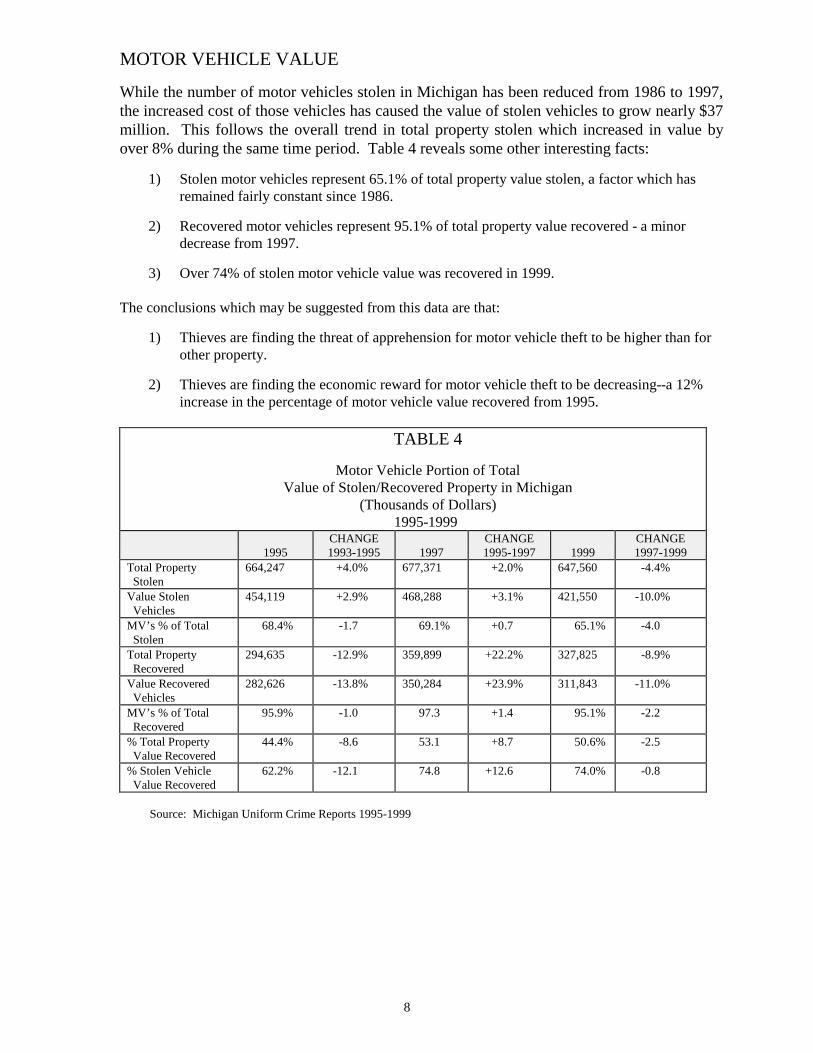
MOTOR VEHICLE VALUE
While the number of motor vehicles stolen in Michigan has been reduced from 1986 to 1997,the increased cost of those vehicles has caused the value of stolen vehicles to grow nearly $37million. This follows the overall trend in total property stolen which increased in value byover 8% during the same time period. Table 4 reveals some other interesting facts:
1) Stolen motor vehicles represent 65.1% of total property value stolen, a factor which hasremained fairly constant since 1986.
2) Recovered motor vehicles represent 95.1% of total property value recovered - a minordecrease from 1997.
3) Over 74% of stolen motor vehicle value was recovered in 1999.
The conclusions which may be suggested from this data are that:
1) Thieves are finding the threat of apprehension for motor vehicle theft to be higher than forother property.
2) Thieves are finding the economic reward for motor vehicle theft to be decreasing--a 12%increase in the percentage of motor vehicle value recovered from 1995.
TABLE 4
Motor Vehicle Portion of TotalValue of Stolen/Recovered Property in Michigan
(Thousands of Dollars) 1995-1999
1995CHANGE1993-1995 1997
CHANGE1995-1997 1999
CHANGE1997-1999
Total Property Stolen
664,247 +4.0% 677,371 +2.0% 647,560 -4.4%
Value Stolen Vehicles
454,119 +2.9% 468,288 +3.1% 421,550 -10.0%
MV’s % of Total Stolen
68.4% -1.7 69.1% +0.7 65.1% -4.0
Total Property Recovered
294,635 -12.9% 359,899 +22.2% 327,825 -8.9%
Value Recovered Vehicles
282,626 -13.8% 350,284 +23.9% 311,843 -11.0%
MV’s % of Total Recovered
95.9% -1.0 97.3 +1.4 95.1% -2.2
% Total Property Value Recovered
44.4% -8.6 53.1 +8.7 50.6% -2.5
% Stolen Vehicle Value Recovered
62.2% -12.1 74.8 +12.6 74.0% -0.8
Source: Michigan Uniform Crime Reports 1995-1999
9
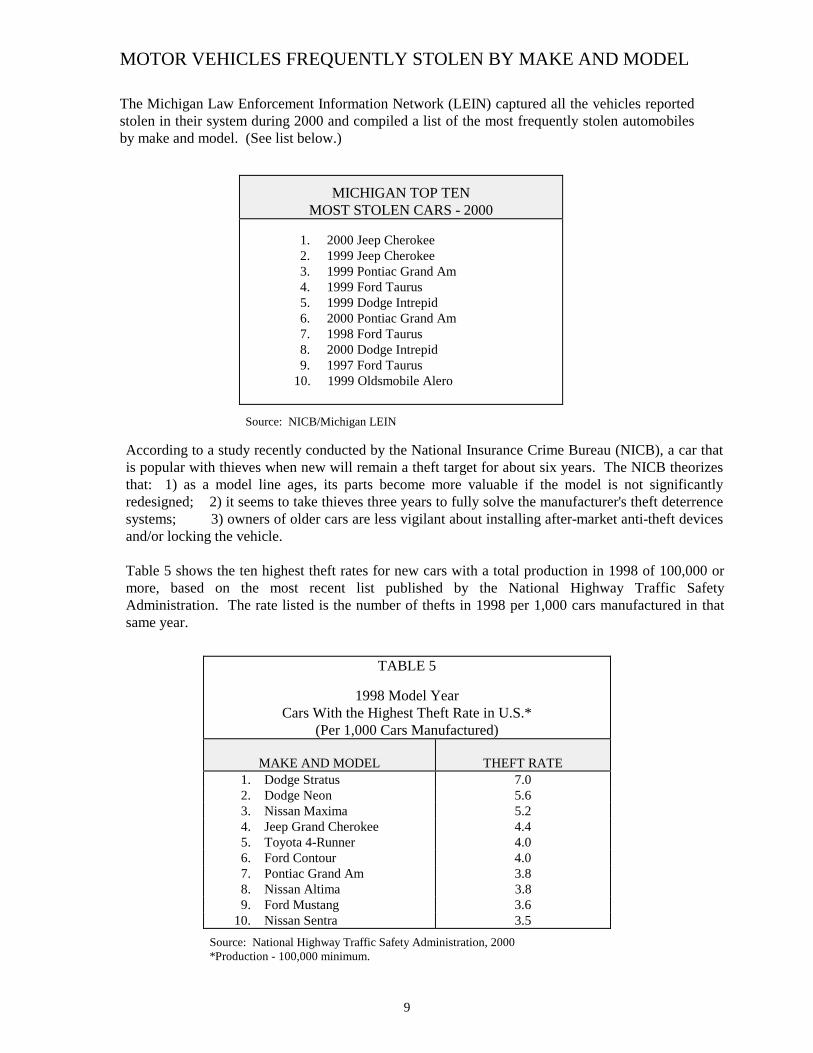
MOTOR VEHICLES FREQUENTLY STOLEN BY MAKE AND MODEL
The Michigan Law Enforcement Information Network (LEIN) captured all the vehicles reportedstolen in their system during 2000 and compiled a list of the most frequently stolen automobilesby make and model. (See list below.)
MICHIGAN TOP TENMOST STOLEN CARS - 2000
1. 2000 Jeep Cherokee 2. 1999 Jeep Cherokee 3. 1999 Pontiac Grand Am 4. 1999 Ford Taurus 5. 1999 Dodge Intrepid 6. 2000 Pontiac Grand Am 7. 1998 Ford Taurus 8. 2000 Dodge Intrepid 9. 1997 Ford Taurus
10. 1999 Oldsmobile Alero
Source: NICB/Michigan LEIN
According to a study recently conducted by the National Insurance Crime Bureau (NICB), a car thatis popular with thieves when new will remain a theft target for about six years. The NICB theorizesthat: 1) as a model line ages, its parts become more valuable if the model is not significantlyredesigned; 2) it seems to take thieves three years to fully solve the manufacturer's theft deterrencesystems; 3) owners of older cars are less vigilant about installing after-market anti-theft devicesand/or locking the vehicle.
Table 5 shows the ten highest theft rates for new cars with a total production in 1998 of 100,000 ormore, based on the most recent list published by the National Highway Traffic SafetyAdministration. The rate listed is the number of thefts in 1998 per 1,000 cars manufactured in thatsame year.
TABLE 5
1998 Model YearCars With the Highest Theft Rate in U.S.*
(Per 1,000 Cars Manufactured)
MAKE AND MODEL THEFT RATE 1. Dodge Stratus 7.0 2. Dodge Neon 5.6 3. Nissan Maxima 5.2 4. Jeep Grand Cherokee 4.4 5. Toyota 4-Runner 4.0 6. Ford Contour 4.0 7. Pontiac Grand Am 3.8 8. Nissan Altima 3.8 9. Ford Mustang 3.6 10. Nissan Sentra 3.5Source: National Highway Traffic Safety Administration, 2000*Production - 100,000 minimum.
10
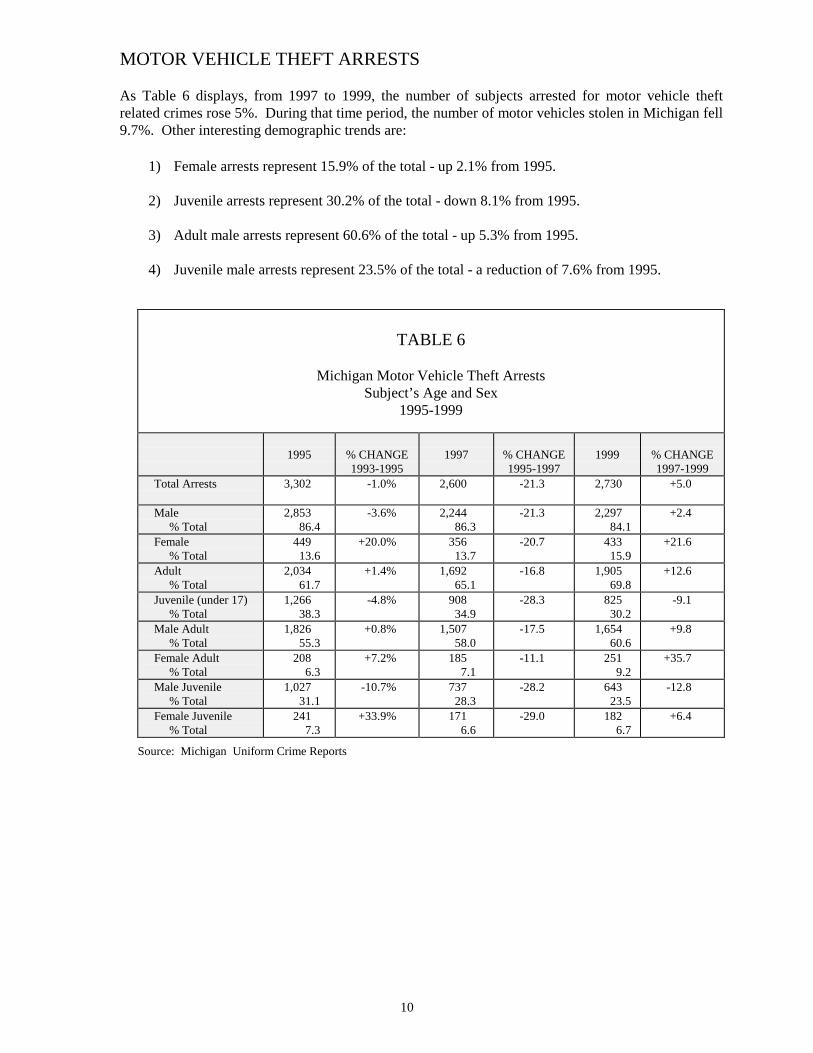
MOTOR VEHICLE THEFT ARRESTS
As Table 6 displays, from 1997 to 1999, the number of subjects arrested for motor vehicle theftrelated crimes rose 5%. During that time period, the number of motor vehicles stolen in Michigan fell9.7%. Other interesting demographic trends are:
1) Female arrests represent 15.9% of the total - up 2.1% from 1995.
2) Juvenile arrests represent 30.2% of the total - down 8.1% from 1995.
3) Adult male arrests represent 60.6% of the total - up 5.3% from 1995.
4) Juvenile male arrests represent 23.5% of the total - a reduction of 7.6% from 1995.
TABLE 6
Michigan Motor Vehicle Theft ArrestsSubject’s Age and Sex
1995-1999
1995 % CHANGE1993-1995
1997 % CHANGE1995-1997
1999 % CHANGE1997-1999
Total Arrests 3,302 -1.0% 2,600 -21.3 2,730 +5.0
Male % Total
2,85386.4
-3.6% 2,24486.3
-21.3 2,29784.1
+2.4
Female % Total
44913.6
+20.0% 35613.7
-20.7 43315.9
+21.6
Adult % Total
2,03461.7
+1.4% 1,69265.1
-16.8 1,90569.8
+12.6
Juvenile (under 17) % Total
1,26638.3
-4.8% 90834.9
-28.3 82530.2
-9.1
Male Adult % Total
1,82655.3
+0.8% 1,50758.0
-17.5 1,65460.6
+9.8
Female Adult % Total
2086.3
+7.2% 1857.1
-11.1 2519.2
+35.7
Male Juvenile % Total
1,02731.1
-10.7% 73728.3
-28.2 64323.5
-12.8
Female Juvenile % Total
2417.3
+33.9% 1716.6
-29.0 1826.7
+6.4
Source: Michigan Uniform Crime Reports
11
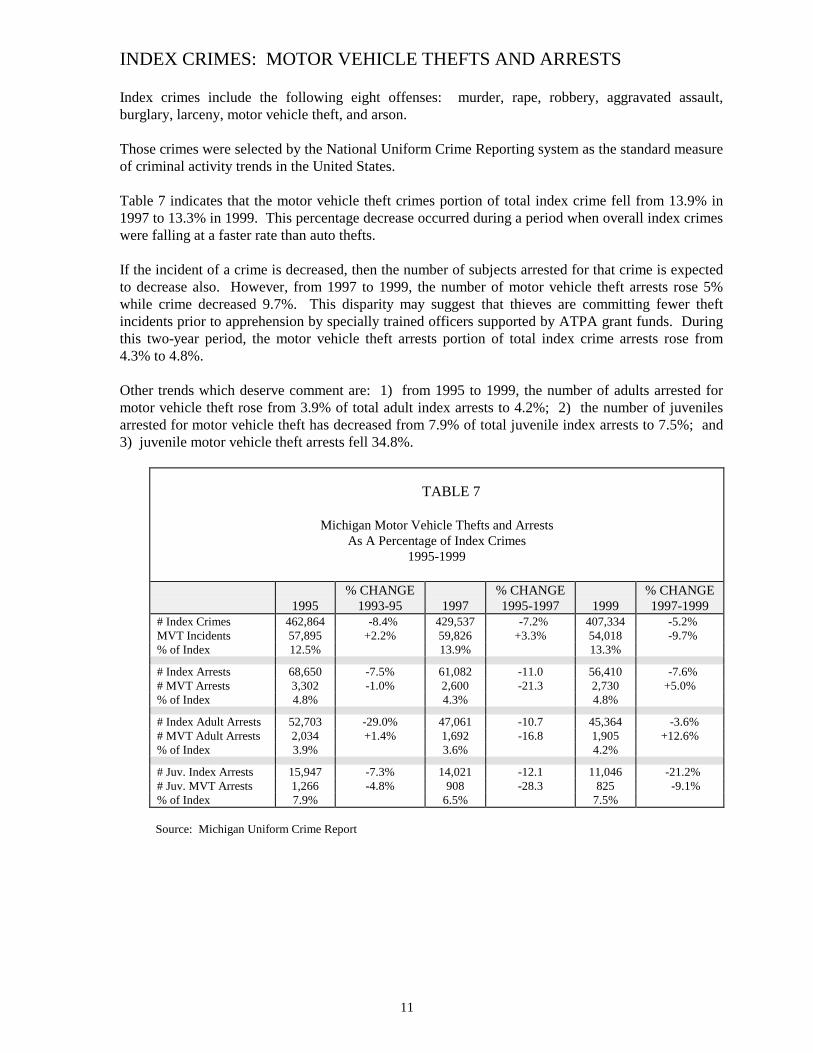
INDEX CRIMES: MOTOR VEHICLE THEFTS AND ARRESTS
Index crimes include the following eight offenses: murder, rape, robbery, aggravated assault,burglary, larceny, motor vehicle theft, and arson.
Those crimes were selected by the National Uniform Crime Reporting system as the standard measureof criminal activity trends in the United States.
Table 7 indicates that the motor vehicle theft crimes portion of total index crime fell from 13.9% in1997 to 13.3% in 1999. This percentage decrease occurred during a period when overall index crimeswere falling at a faster rate than auto thefts.
If the incident of a crime is decreased, then the number of subjects arrested for that crime is expectedto decrease also. However, from 1997 to 1999, the number of motor vehicle theft arrests rose 5%while crime decreased 9.7%. This disparity may suggest that thieves are committing fewer theftincidents prior to apprehension by specially trained officers supported by ATPA grant funds. Duringthis two-year period, the motor vehicle theft arrests portion of total index crime arrests rose from4.3% to 4.8%.
Other trends which deserve comment are: 1) from 1995 to 1999, the number of adults arrested formotor vehicle theft rose from 3.9% of total adult index arrests to 4.2%; 2) the number of juvenilesarrested for motor vehicle theft has decreased from 7.9% of total juvenile index arrests to 7.5%; and3) juvenile motor vehicle theft arrests fell 34.8%.
TABLE 7
Michigan Motor Vehicle Thefts and ArrestsAs A Percentage of Index Crimes
1995-1999
1995% CHANGE
1993-95 1997% CHANGE1995-1997 1999
% CHANGE1997-1999
# Index Crimes 462,864 -8.4% 429,537 -7.2% 407,334 -5.2%MVT Incidents 57,895 +2.2% 59,826 +3.3% 54,018 -9.7%% of Index 12.5% 13.9% 13.3%
# Index Arrests 68,650 -7.5% 61,082 -11.0 56,410 -7.6%# MVT Arrests 3,302 -1.0% 2,600 -21.3 2,730 +5.0%% of Index 4.8% 4.3% 4.8%
# Index Adult Arrests 52,703 -29.0% 47,061 -10.7 45,364 -3.6%# MVT Adult Arrests 2,034 +1.4% 1,692 -16.8 1,905 +12.6%% of Index 3.9% 3.6% 4.2%
# Juv. Index Arrests 15,947 -7.3% 14,021 -12.1 11,046 -21.2%# Juv. MVT Arrests 1,266 -4.8% 908 -28.3 825 -9.1%% of Index 7.9% 6.5% 7.5%
Source: Michigan Uniform Crime Report
12
AUTOMOBILE THEFT PREVENTION AUTHORITYThe Automobile Theft Prevention Authority (ATPA) was established as a temporary programby Act 10, P.A. of 1986, to reduce economic automobile theft in the State of Michigan. As aresult of the program's success, it was given permanent status by Act 174, P.A. of 1992. TheAuthority is directed by a seven-member board of directors appointed by the Governor withconsent of the Senate. This seven-member board contains: two representatives of automobileinsurance purchasers; two representatives from Michigan insurance companies; tworepresentatives from law enforcement agencies; and the director of the Department of StatePolice. The board of directors meets quarterly at various locations around the state, and noticeof the time, date, and place is published in accordance with the open meetings act.
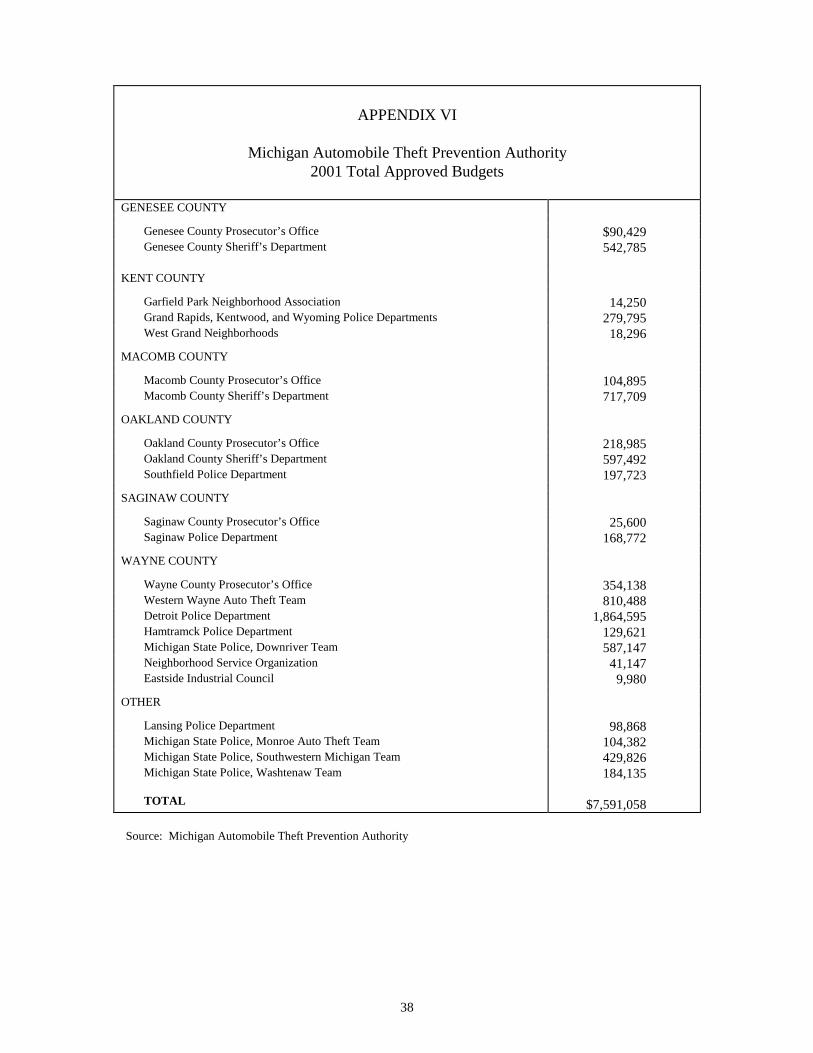
The activities of the Authority are funded by annual assessments on automobile insurancecompanies of $1 per private passenger car premium earned in the previous year. Those funds(annual revenues of $5.8 million) are collected from policyholders and passed on to the ATPAeach year. The ATPA board provides financial support to non-profit tax-exemptorganizations (law enforcement agencies, county prosecutors, and neighborhood orcommunity organizations) that show a good potential for fulfilling the Authority's mission ofreducing auto theft. (Appendix VI lists 2001 projects and the funding provided.)
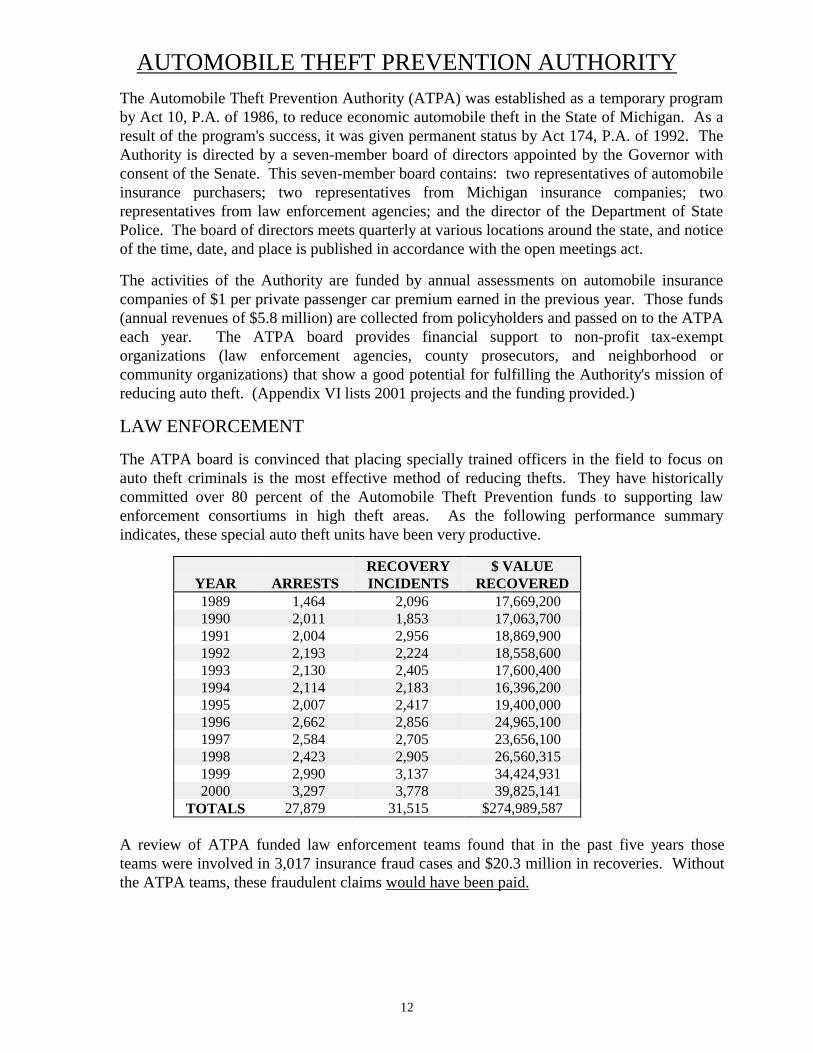
LAW ENFORCEMENT
The ATPA board is convinced that placing specially trained officers in the field to focus onauto theft criminals is the most effective method of reducing thefts. They have historicallycommitted over 80 percent of the Automobile Theft Prevention funds to supporting lawenforcement consortiums in high theft areas. As the following performance summaryindicates, these special auto theft units have been very productive.
YEAR ARRESTSRECOVERYINCIDENTS
$ VALUERECOVERED
1989 1,464 2,096 17,669,2001990 2,011 1,853 17,063,7001991 2,004 2,956 18,869,9001992 2,193 2,224 18,558,6001993 2,130 2,405 17,600,4001994 2,114 2,183 16,396,2001995 2,007 2,417 19,400,0001996 2,662 2,856 24,965,1001997 2,584 2,705 23,656,1001998 2,423 2,905 26,560,3151999 2,990 3,137 34,424,9312000 3,297 3,778 39,825,141
TOTALS 27,879 31,515 $274,989,587
A review of ATPA funded law enforcement teams found that in the past five years thoseteams were involved in 3,017 insurance fraud cases and $20.3 million in recoveries. Withoutthe ATPA teams, these fraudulent claims would have been paid.
13
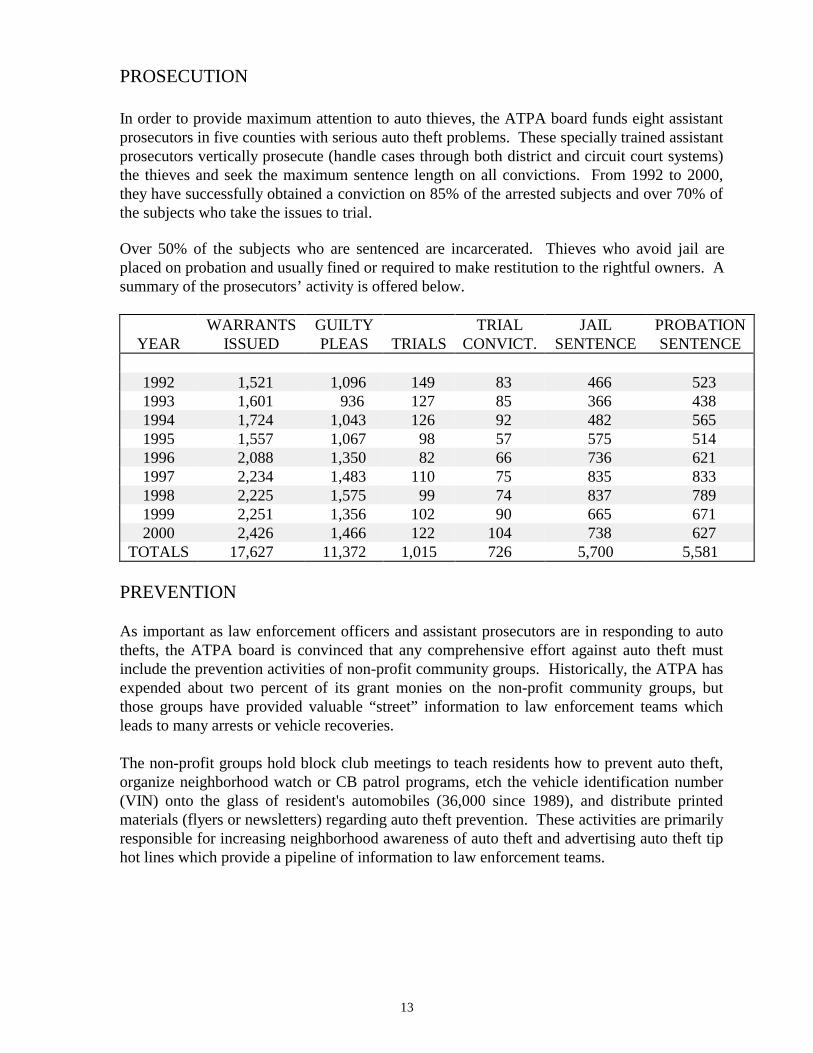
PROSECUTION
In order to provide maximum attention to auto thieves, the ATPA board funds eight assistantprosecutors in five counties with serious auto theft problems. These specially trained assistantprosecutors vertically prosecute (handle cases through both district and circuit court systems)the thieves and seek the maximum sentence length on all convictions. From 1992 to 2000,they have successfully obtained a conviction on 85% of the arrested subjects and over 70% ofthe subjects who take the issues to trial.
Over 50% of the subjects who are sentenced are incarcerated. Thieves who avoid jail areplaced on probation and usually fined or required to make restitution to the rightful owners. Asummary of the prosecutors’ activity is offered below.
YEARWARRANTS
ISSUEDGUILTYPLEAS TRIALS
TRIALCONVICT.
JAILSENTENCE
PROBATIONSENTENCE
1992 1,521 1,096 149 83 466 5231993 1,601 936 127 85 366 4381994 1,724 1,043 126 92 482 5651995 1,557 1,067 98 57 575 5141996 2,088 1,350 82 66 736 6211997 2,234 1,483 110 75 835 8331998 2,225 1,575 99 74 837 7891999 2,251 1,356 102 90 665 6712000 2,426 1,466 122 104 738 627
TOTALS 17,627 11,372 1,015 726 5,700 5,581
PREVENTION
As important as law enforcement officers and assistant prosecutors are in responding to autothefts, the ATPA board is convinced that any comprehensive effort against auto theft mustinclude the prevention activities of non-profit community groups. Historically, the ATPA hasexpended about two percent of its grant monies on the non-profit community groups, butthose groups have provided valuable “street” information to law enforcement teams whichleads to many arrests or vehicle recoveries.
The non-profit groups hold block club meetings to teach residents how to prevent auto theft,organize neighborhood watch or CB patrol programs, etch the vehicle identification number(VIN) onto the glass of resident's automobiles (36,000 since 1989), and distribute printedmaterials (flyers or newsletters) regarding auto theft prevention. These activities are primarilyresponsible for increasing neighborhood awareness of auto theft and advertising auto theft tiphot lines which provide a pipeline of information to law enforcement teams.
14
ANTI-THEFT DEVICES
The Automobile Theft Prevention Authority was charged in Act 10, P.A. 1986, with theresponsibility for approving automobile theft prevention devices. Therefore, the ATPA boarddecided to address devices in broad general terms so that it would not have to revise the list ofdevices every time a new one was introduced to the market.
On March 23, 1987, the Authority approved interim standards for automobile theft preventiondevices. Installation of those devices qualified the insured for a reduction in the automobile'scomprehension insurance premium. Each company determines the amount of the reduction.
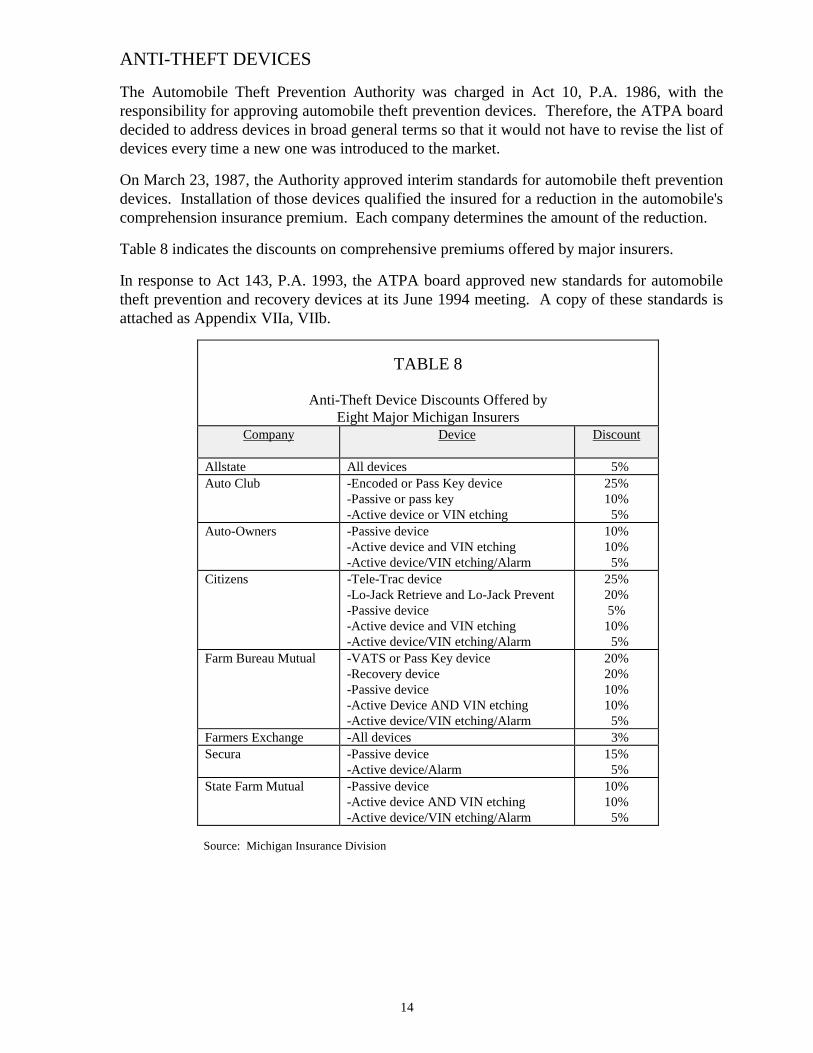
Table 8 indicates the discounts on comprehensive premiums offered by major insurers.
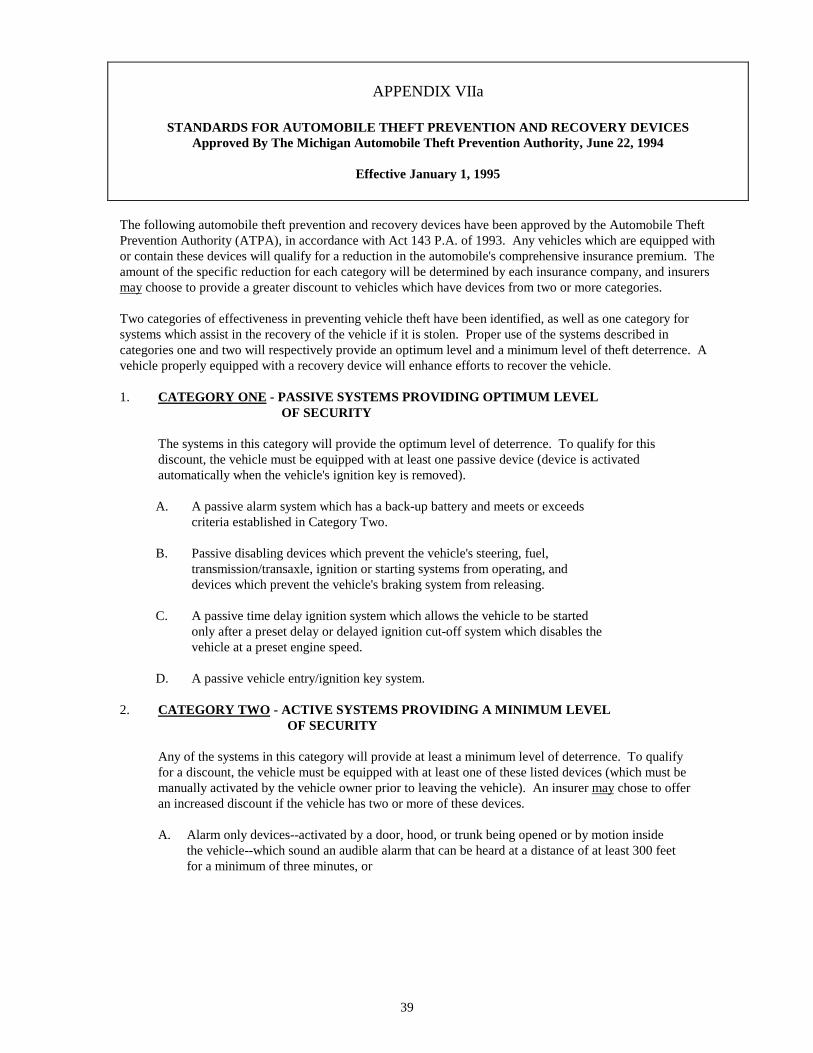
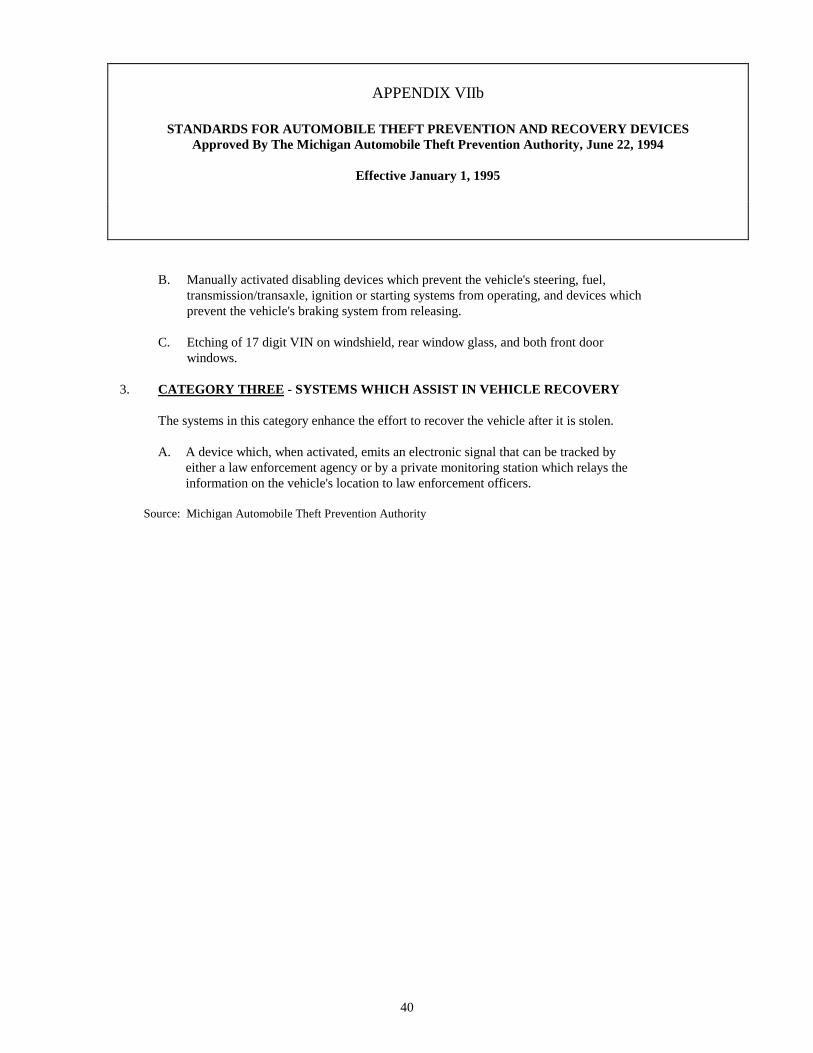
In response to Act 143, P.A. 1993, the ATPA board approved new standards for automobiletheft prevention and recovery devices at its June 1994 meeting. A copy of these standards isattached as Appendix VIIa, VIIb.
TABLE 8
Anti-Theft Device Discounts Offered byEight Major Michigan Insurers
Company Device Discount
Allstate All devices 5%Auto Club -Encoded or Pass Key device
-Passive or pass key-Active device or VIN etching
25%10% 5%
Auto-Owners -Passive device-Active device and VIN etching-Active device/VIN etching/Alarm
10%10% 5%
Citizens -Tele-Trac device-Lo-Jack Retrieve and Lo-Jack Prevent-Passive device-Active device and VIN etching-Active device/VIN etching/Alarm
25%20%5%
10% 5%
Farm Bureau Mutual -VATS or Pass Key device-Recovery device-Passive device-Active Device AND VIN etching-Active device/VIN etching/Alarm
20%20%10%10% 5%
Farmers Exchange -All devices 3%Secura -Passive device
-Active device/Alarm15% 5%
State Farm Mutual -Passive device-Active device AND VIN etching-Active device/VIN etching/Alarm
10%10% 5%
Source: Michigan Insurance Division
15
DEPARTMENT OF CORRECTIONS
Most law enforcement officers and special prosecutors involved with auto theft believe theirefforts are successful if the thief is taken off the street and put into prison for as long aspossible. From 1985 to 1990, Michigan's legislature funded the construction of 17 new statecorrectional facilities with a capacity for an additional 10,043 prisoners. While the buildingprogram made extra space available for auto thieves, new prisons are very expensive andjudges quickly sentenced more than enough criminals to fill them. Prison population grew 76percent from 1986 to 1991 (20,742 to 36,448).
Since 1991, the state has slowed the construction of new correctional facilities andimplemented a new strategy for diverting non-violent/low-risk offenders to appropriateparole/probation supervision at the community level. State prison space is reserved for theviolent and chronic property offenders who pose the greatest risk to the public. However, ahigh percentage of those on parole/probation commit new crimes or violate the terms of theirpunishment and are sent to prison.
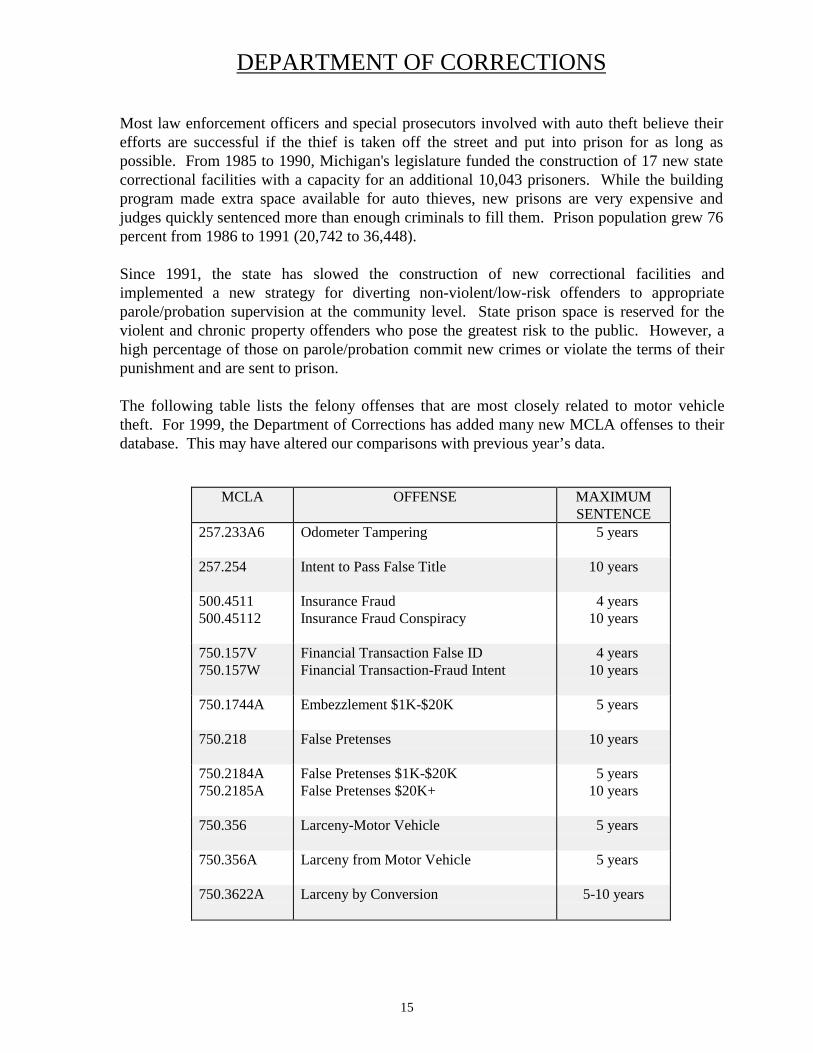
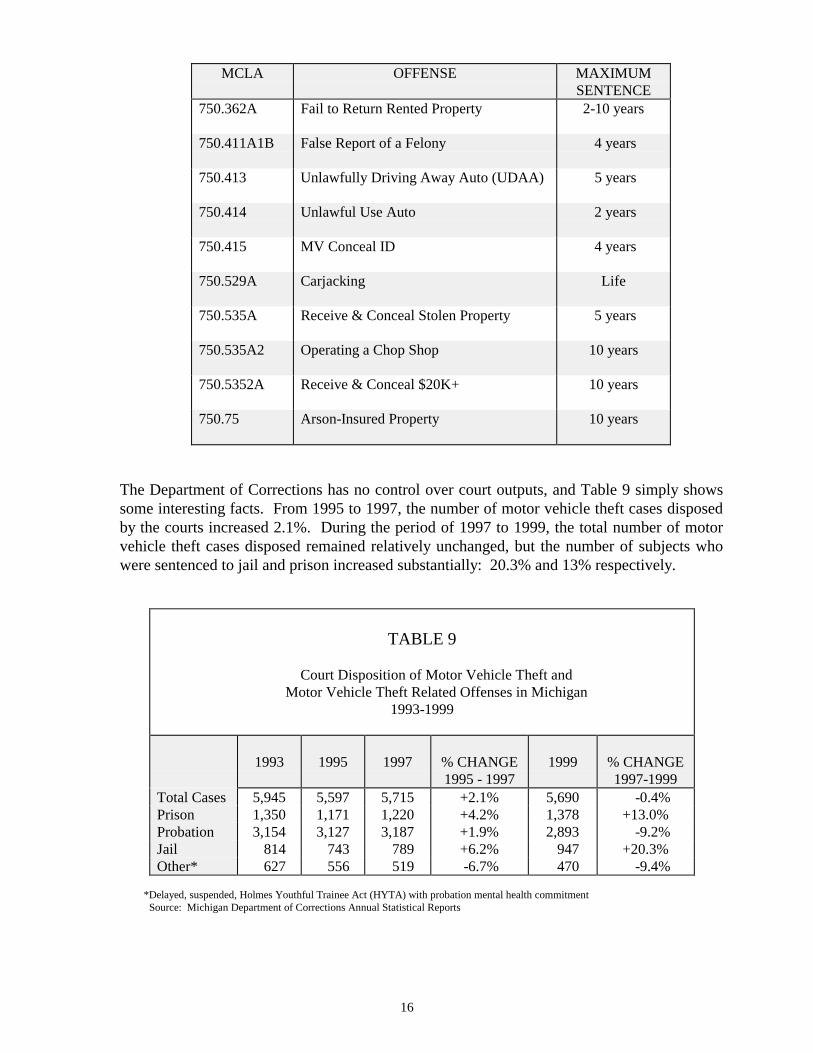
The following table lists the felony offenses that are most closely related to motor vehicletheft. For 1999, the Department of Corrections has added many new MCLA offenses to theirdatabase. This may have altered our comparisons with previous year’s data.
MCLA OFFENSE MAXIMUMSENTENCE
257.233A6 Odometer Tampering 5 years
257.254 Intent to Pass False Title 10 years
500.4511500.45112
Insurance FraudInsurance Fraud Conspiracy
4 years10 years
750.157V750.157W
Financial Transaction False IDFinancial Transaction-Fraud Intent
4 years10 years
750.1744A Embezzlement $1K-$20K 5 years
750.218 False Pretenses 10 years
750.2184A750.2185A
False Pretenses $1K-$20KFalse Pretenses $20K+
5 years10 years
750.356 Larceny-Motor Vehicle 5 years
750.356A Larceny from Motor Vehicle 5 years
750.3622A Larceny by Conversion 5-10 years
16
MCLA OFFENSE MAXIMUMSENTENCE
750.362A Fail to Return Rented Property 2-10 years
750.411A1B False Report of a Felony 4 years
750.413 Unlawfully Driving Away Auto (UDAA) 5 years
750.414 Unlawful Use Auto 2 years
750.415 MV Conceal ID 4 years
750.529A Carjacking Life
750.535A Receive & Conceal Stolen Property 5 years
750.535A2 Operating a Chop Shop 10 years
750.5352A Receive & Conceal $20K+ 10 years
750.75 Arson-Insured Property 10 years
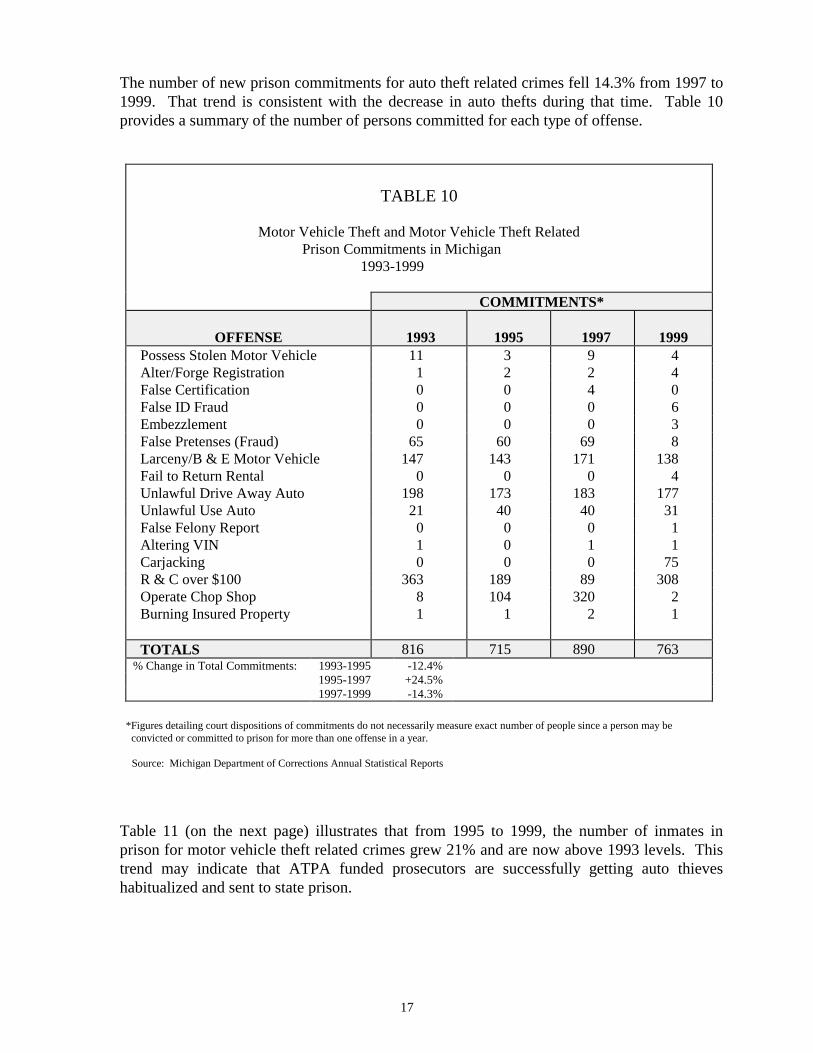
The Department of Corrections has no control over court outputs, and Table 9 simply showssome interesting facts. From 1995 to 1997, the number of motor vehicle theft cases disposedby the courts increased 2.1%. During the period of 1997 to 1999, the total number of motorvehicle theft cases disposed remained relatively unchanged, but the number of subjects whowere sentenced to jail and prison increased substantially: 20.3% and 13% respectively.
TABLE 9
Court Disposition of Motor Vehicle Theft andMotor Vehicle Theft Related Offenses in Michigan
1993-1999
1993 1995 1997 % CHANGE1995 - 1997
1999 % CHANGE1997-1999
Total Cases 5,945 5,597 5,715 +2.1% 5,690 -0.4%Prison 1,350 1,171 1,220 +4.2% 1,378 +13.0%Probation 3,154 3,127 3,187 +1.9% 2,893 -9.2%Jail 814 743 789 +6.2% 947 +20.3%Other* 627 556 519 -6.7% 470 -9.4%
*Delayed, suspended, Holmes Youthful Trainee Act (HYTA) with probation mental health commitment Source: Michigan Department of Corrections Annual Statistical Reports
17
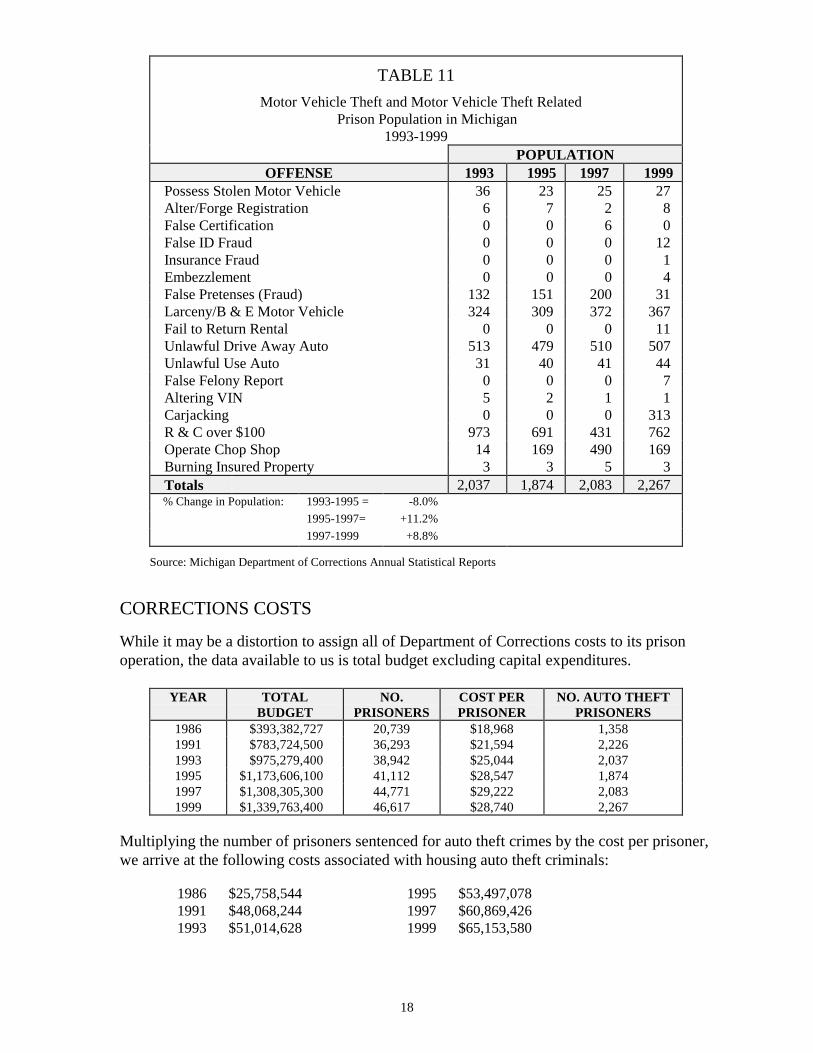
The number of new prison commitments for auto theft related crimes fell 14.3% from 1997 to1999. That trend is consistent with the decrease in auto thefts during that time. Table 10provides a summary of the number of persons committed for each type of offense.
TABLE 10
Motor Vehicle Theft and Motor Vehicle Theft Related Prison Commitments in Michigan
1993-1999
COMMITMENTS*
OFFENSE 1993 1995 1997 1999 Possess Stolen Motor Vehicle 11 3 9 4 Alter/Forge Registration 1 2 2 4 False Certification 0 0 4 0 False ID Fraud 0 0 0 6 Embezzlement 0 0 0 3 False Pretenses (Fraud) 65 60 69 8 Larceny/B & E Motor Vehicle 147 143 171 138 Fail to Return Rental 0 0 0 4 Unlawful Drive Away Auto 198 173 183 177 Unlawful Use Auto 21 40 40 31 False Felony Report 0 0 0 1 Altering VIN 1 0 1 1 Carjacking 0 0 0 75 R & C over $100 363 189 89 308 Operate Chop Shop 8 104 320 2 Burning Insured Property 1 1 2 1
TOTALS 816 715 890 763% Change in Total Commitments: 1993-1995 -12.4%
1995-1997 +24.5%1997-1999 -14.3%
*Figures detailing court dispositions of commitments do not necessarily measure exact number of people since a person may be convicted or committed to prison for more than one offense in a year.
Source: Michigan Department of Corrections Annual Statistical Reports
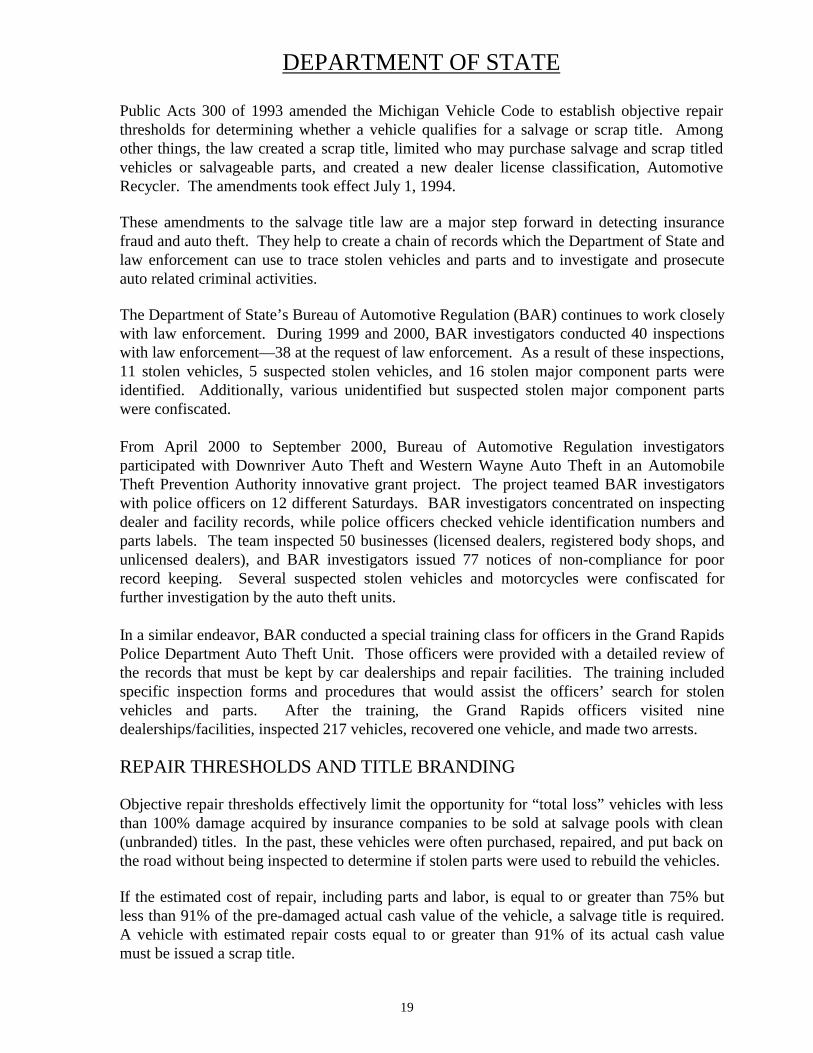
Table 11 (on the next page) illustrates that from 1995 to 1999, the number of inmates inprison for motor vehicle theft related crimes grew 21% and are now above 1993 levels. Thistrend may indicate that ATPA funded prosecutors are successfully getting auto thieveshabitualized and sent to state prison.
18
TABLE 11 Motor Vehicle Theft and Motor Vehicle Theft Related Prison Population in Michigan
1993-1999POPULATION
OFFENSE 1993 1995 1997 1999 Possess Stolen Motor Vehicle 36 23 25 27 Alter/Forge Registration 6 7 2 8 False Certification 0 0 6 0 False ID Fraud 0 0 0 12 Insurance Fraud 0 0 0 1 Embezzlement 0 0 0 4 False Pretenses (Fraud) 132 151 200 31 Larceny/B & E Motor Vehicle 324 309 372 367 Fail to Return Rental 0 0 0 11 Unlawful Drive Away Auto 513 479 510 507 Unlawful Use Auto 31 40 41 44 False Felony Report 0 0 0 7 Altering VIN 5 2 1 1 Carjacking 0 0 0 313 R & C over $100 973 691 431 762 Operate Chop Shop 14 169 490 169 Burning Insured Property 3 3 5 3 Totals 2,037 1,874 2,083 2,267 % Change in Population: 1993-1995 = -8.0%
1995-1997= +11.2%1997-1999 +8.8%
Source: Michigan Department of Corrections Annual Statistical Reports
CORRECTIONS COSTS
While it may be a distortion to assign all of Department of Corrections costs to its prisonoperation, the data available to us is total budget excluding capital expenditures.
YEAR TOTALBUDGET
NO.PRISONERS
COST PERPRISONER
NO. AUTO THEFTPRISONERS
1986 $393,382,727 20,739 $18,968 1,3581991 $783,724,500 36,293 $21,594 2,2261993 $975,279,400 38,942 $25,044 2,0371995 $1,173,606,100 41,112 $28,547 1,8741997 $1,308,305,300 44,771 $29,222 2,0831999 $1,339,763,400 46,617 $28,740 2,267
Multiplying the number of prisoners sentenced for auto theft crimes by the cost per prisoner,we arrive at the following costs associated with housing auto theft criminals:
1986 $25,758,544 1995 $53,497,0781991 $48,068,244 1997 $60,869,4261993 $51,014,628 1999 $65,153,580
19
DEPARTMENT OF STATE
Public Acts 300 of 1993 amended the Michigan Vehicle Code to establish objective repairthresholds for determining whether a vehicle qualifies for a salvage or scrap title. Amongother things, the law created a scrap title, limited who may purchase salvage and scrap titledvehicles or salvageable parts, and created a new dealer license classification, AutomotiveRecycler. The amendments took effect July 1, 1994.
These amendments to the salvage title law are a major step forward in detecting insurancefraud and auto theft. They help to create a chain of records which the Department of State andlaw enforcement can use to trace stolen vehicles and parts and to investigate and prosecuteauto related criminal activities.
The Department of State’s Bureau of Automotive Regulation (BAR) continues to work closelywith law enforcement. During 1999 and 2000, BAR investigators conducted 40 inspectionswith law enforcement—38 at the request of law enforcement. As a result of these inspections,11 stolen vehicles, 5 suspected stolen vehicles, and 16 stolen major component parts wereidentified. Additionally, various unidentified but suspected stolen major component partswere confiscated.
From April 2000 to September 2000, Bureau of Automotive Regulation investigatorsparticipated with Downriver Auto Theft and Western Wayne Auto Theft in an AutomobileTheft Prevention Authority innovative grant project. The project teamed BAR investigatorswith police officers on 12 different Saturdays. BAR investigators concentrated on inspectingdealer and facility records, while police officers checked vehicle identification numbers andparts labels. The team inspected 50 businesses (licensed dealers, registered body shops, andunlicensed dealers), and BAR investigators issued 77 notices of non-compliance for poorrecord keeping. Several suspected stolen vehicles and motorcycles were confiscated forfurther investigation by the auto theft units.
In a similar endeavor, BAR conducted a special training class for officers in the Grand RapidsPolice Department Auto Theft Unit. Those officers were provided with a detailed review ofthe records that must be kept by car dealerships and repair facilities. The training includedspecific inspection forms and procedures that would assist the officers’ search for stolenvehicles and parts. After the training, the Grand Rapids officers visited ninedealerships/facilities, inspected 217 vehicles, recovered one vehicle, and made two arrests.
REPAIR THRESHOLDS AND TITLE BRANDING
Objective repair thresholds effectively limit the opportunity for “total loss” vehicles with lessthan 100% damage acquired by insurance companies to be sold at salvage pools with clean(unbranded) titles. In the past, these vehicles were often purchased, repaired, and put back onthe road without being inspected to determine if stolen parts were used to rebuild the vehicles.
If the estimated cost of repair, including parts and labor, is equal to or greater than 75% butless than 91% of the pre-damaged actual cash value of the vehicle, a salvage title is required.A vehicle with estimated repair costs equal to or greater than 91% of its actual cash valuemust be issued a scrap title.
20
When an insurance company acquires ownership through payment of a claim of a late modelvehicle that has been stolen and recovered and the vehicle has even one major component partremoved, missing, destroyed, or damaged and not salvageable, the insurance company isrequired to apply for a salvage title even if the estimated cost of repair is less than 75%.
Title washing is deterred by ensuring that title brands follow the vehicle into our state. Anyvehicle brought into Michigan from another state that has a rebuilt, salvage, scrap, orcomparable title issued by that state will be issued a rebuilt, salvage, or scrap title by theMichigan Department of State.
The Department of State reviews title documents and contacts current owners to see if theywere aware that they had purchased previously salvage titled vehicles. From Fiscal Year 1989to Fiscal Year 2000, BAR’s Customer Information Services Section has contacted 11,293consumers regarding the salvage status of their vehicles. Some 3,720 or 33% of theconsumers contacted had not been made aware that their vehicles previously had salvage titles.
SCRAP TITLES
The amended salvage law created a scrap title with strict limitations for its assignment. Scraptitles may only be assigned to used vehicle parts dealers, automotive recyclers, scrap metalprocessors, or foreign salvage vehicle dealers. These dealers may reassign a scrap title only toa vehicle scrap metal processor. When a scrap title is issued to a vehicle, the VIN is “dead”and that vehicle cannot be titled or registered again. A person cannot rebuild or repair a scrap-titled vehicle and allow it to keep the original VIN.
A scrap-titled vehicle may only be shredded for recycling of the metal or dismantled and usedfor parts. Similar to a salvage title, the scrap title lists non-salvageable major componentparts.
The law provides for an automatic 30-day suspension of the dealer license if a dealer removesa scrap-titled vehicle from Michigan to rebuild the vehicle or sells it as a unit for the purposeof rebuilding it. During 1997, the Michigan Secretary of State imposed 30-day summarysuspensions on two foreign salvage vehicle dealers from Kentucky. One dealer demanded animmediate administrative hearing to challenge the suspension. The administrative hearingdecision ruled that the suspension was proper, and the dealer served the full 30 days.
LIMITED ADMITTANCE TO SALVAGE POOLS
The new law requires salvage pools and auctions to restrict who attends during the sale ofsalvage and scrap vehicles. This was done to help eliminate unlicensed agents, auto thieves,and the like from the pools and the bidding process.
Only licensed salvage vehicle agents, Department of State personnel, insurance companyrepresentatives, and government or law enforcement officials may attend a salvage pool orauction during the sale of salvage or scrap-titled vehicles or salvageable parts. Repairfacilities are no longer permitted to purchase salvage vehicles or salvageable parts fromsalvage pools or auctions.
21
AUTOMOTIVE RECYCLER AND SALVAGE VEHICLE AGENT CREATED
An additional class of vehicle dealer—automotive recycler—was created, as was a salvagevehicle agent. An automotive recycler is a dealer primarily engaged in the sale of late modelmajor component parts. A salvage vehicle agent is authorized by the Secretary of State to dealin distressed late-model vehicles, scrap vehicles, or salvageable parts through a salvage pool.
Only licensed used vehicle parts dealers, automotive recyclers, or foreign salvage vehicledealers may have salvage vehicle agents. A salvage vehicle agent may only work for onelicensed dealer, and a dealer may only have two salvage vehicle agents. Part of the licensingprocess for salvage vehicle agents is applicant fingerprinting. The fingerprints are sent to theMichigan State Police and the FBI to check for auto-related criminal activity.
REBUILT SALVAGE RECERTIFICATION INSPECTIONS
Effective July 1, 1994, the fee for a police inspection of a rebuilt salvage vehicle is $50. Thefee is paid to the police agency doing the inspection and is used for law enforcement purposesrelating to stolen vehicles, stolen vehicle parts, and salvage vehicle inspections.
Only inspectors certified by the Department of State may perform rebuilt salvage inspections.As of December 2000, the total number of certified salvage inspectors is 173.
Inspectors focus their attention on the major component parts that have been replaced.Certification training explains the inspection process, which includes recording the enginenumber, body VIN, frame/police number, VIN from the Federal Certificate Label, andtransmission number. Recording of part numbers from the major component parts labels isalso required under the inspection standards.
22
HELP ELIMINATE AUTO THEFT (H.E.A.T.) PROGRAM
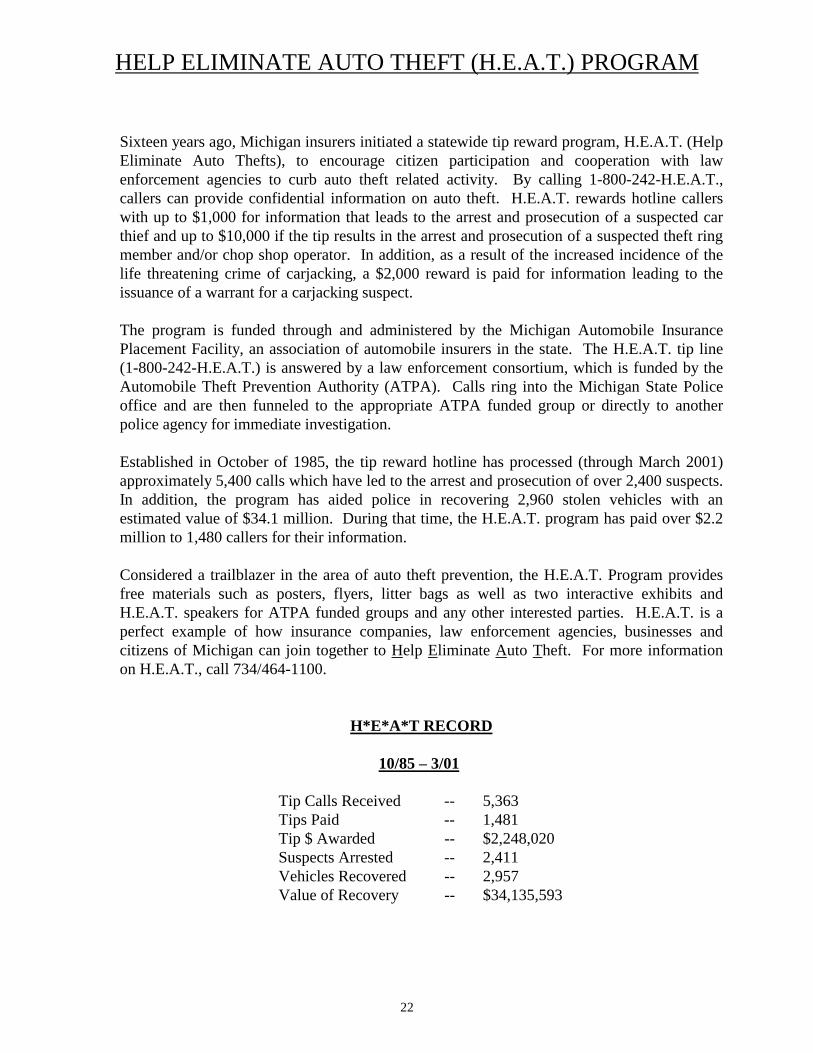
Sixteen years ago, Michigan insurers initiated a statewide tip reward program, H.E.A.T. (HelpEliminate Auto Thefts), to encourage citizen participation and cooperation with lawenforcement agencies to curb auto theft related activity. By calling 1-800-242-H.E.A.T.,callers can provide confidential information on auto theft. H.E.A.T. rewards hotline callerswith up to $1,000 for information that leads to the arrest and prosecution of a suspected carthief and up to $10,000 if the tip results in the arrest and prosecution of a suspected theft ringmember and/or chop shop operator. In addition, as a result of the increased incidence of thelife threatening crime of carjacking, a $2,000 reward is paid for information leading to theissuance of a warrant for a carjacking suspect.
The program is funded through and administered by the Michigan Automobile InsurancePlacement Facility, an association of automobile insurers in the state. The H.E.A.T. tip line(1-800-242-H.E.A.T.) is answered by a law enforcement consortium, which is funded by theAutomobile Theft Prevention Authority (ATPA). Calls ring into the Michigan State Policeoffice and are then funneled to the appropriate ATPA funded group or directly to anotherpolice agency for immediate investigation.
Established in October of 1985, the tip reward hotline has processed (through March 2001)approximately 5,400 calls which have led to the arrest and prosecution of over 2,400 suspects.In addition, the program has aided police in recovering 2,960 stolen vehicles with anestimated value of $34.1 million. During that time, the H.E.A.T. program has paid over $2.2million to 1,480 callers for their information.
Considered a trailblazer in the area of auto theft prevention, the H.E.A.T. Program providesfree materials such as posters, flyers, litter bags as well as two interactive exhibits andH.E.A.T. speakers for ATPA funded groups and any other interested parties. H.E.A.T. is aperfect example of how insurance companies, law enforcement agencies, businesses andcitizens of Michigan can join together to Help Eliminate Auto Theft. For more informationon H.E.A.T., call 734/464-1100.
H*E*A*T RECORD
10/85 – 3/01
Tip Calls Received -- 5,363 Tips Paid -- 1,481 Tip $ Awarded -- $2,248,020 Suspects Arrested -- 2,411 Vehicles Recovered -- 2,957 Value of Recovery -- $34,135,593
23
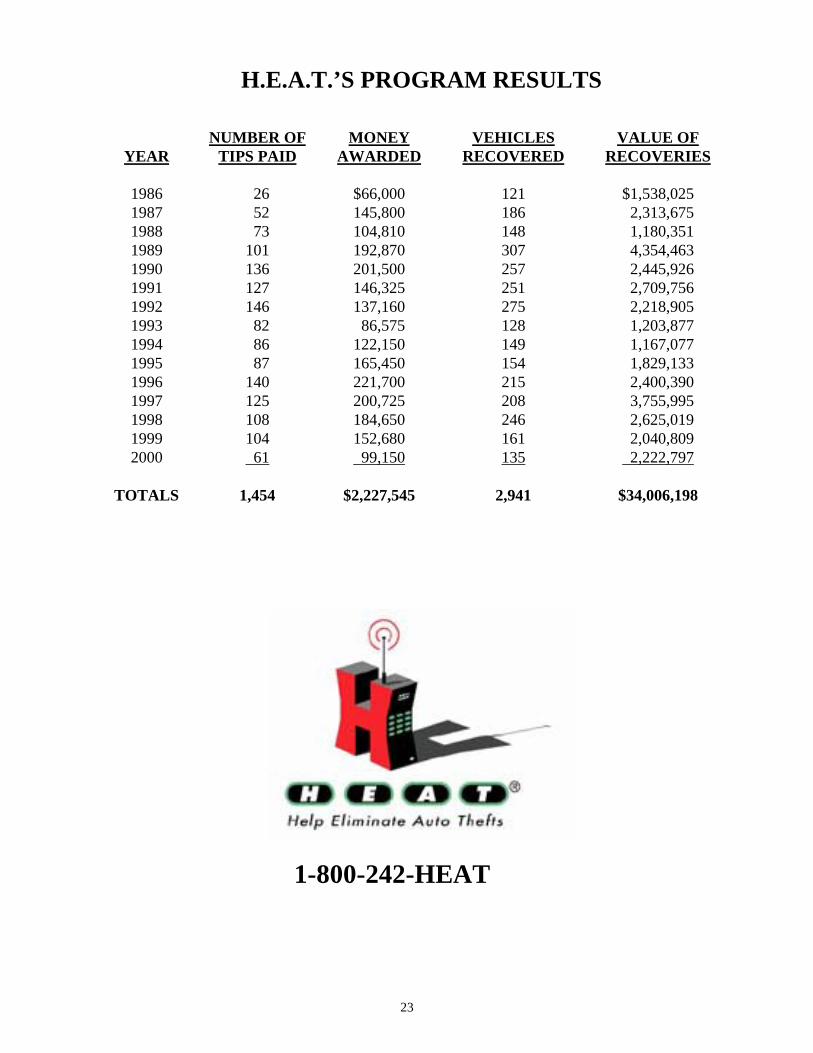
H.E.A.T.’S PROGRAM RESULTS
YEARNUMBER OF
TIPS PAIDMONEY
AWARDEDVEHICLES
RECOVEREDVALUE OF
RECOVERIES
1986 26 $66,000 121 $1,538,0251987 52 145,800 186 2,313,6751988 73 104,810 148 1,180,3511989 101 192,870 307 4,354,4631990 136 201,500 257 2,445,9261991 127 146,325 251 2,709,7561992 146 137,160 275 2,218,9051993 82 86,575 128 1,203,8771994 86 122,150 149 1,167,0771995 87 165,450 154 1,829,1331996 140 221,700 215 2,400,3901997 125 200,725 208 3,755,9951998 108 184,650 246 2,625,0191999 104 152,680 161 2,040,8092000 61 99,150 135 2,222,797
TOTALS 1,454 $2,227,545 2,941 $34,006,198
1-800-242-HEAT
24
PRIVATE SECTOR TECHNOLOGY
TECHNOLOGICAL ASSISTS TO THEFT PREVENTION
Since 1986, several innovations have provided some additional protection or theft deterrenceto automobile owners. Manufacturers have strengthened door locks and made the lockingmechanisms more difficult to defeat. Steering wheel columns have been redesigned andstrengthened to make the thieves’ job more time consuming. Ignition switches have beenreinforced and relocated so they are more difficult to defeat. Microcomputer chips have beenadded to ignition keys so the vehicle will not start unless the vehicle's computer reads aunique electronic code on the key.
The after market has successfully marketed many auto theft prevention techniques: steeringwheel locks, metal column wraps, alarms, kill switches, and electronic tracking devices. Thetracking devices are able to either provide police with the exact location of the vehicle orallow police to find the vehicle with a homing device. Either way the vehicle is usuallyrecovered in a matter of hours. Even side window glass can be strengthened with a clear filmwhich prevents the glass from disintegrating into glass pellets when a thief hits it with a hardobject.
Since 1986 the federal government has required that manufacturers of high theft vehiclesplace a tag with the vehicle identification number on 13 major component parts of the vehicle.The tags are usually white and are glued to the parts. Thieves’ attempts to remove and replacethis parts marking with computer generated ones are hampered by special tear away glues,logos hidden in the tags, and chemical footprints left behind if the tag is removed.
The State Police Automated Fingerprint Identification System (AFIS) has assisted in theidentification of the auto thieves. Prior to this system being implemented, auto theftinvestigators would dust a recovered vehicle for prints, but if the prints were not manuallymatched with a known local suspect, they were not able to follow up on the lead. With AFIS,auto theft investigators can access a statewide computer database of fingerprints and have abetter chance of identifying a suspect.
25
INSURANCE DIVISION
IMPACT ON INSURANCE PREMIUM COSTS
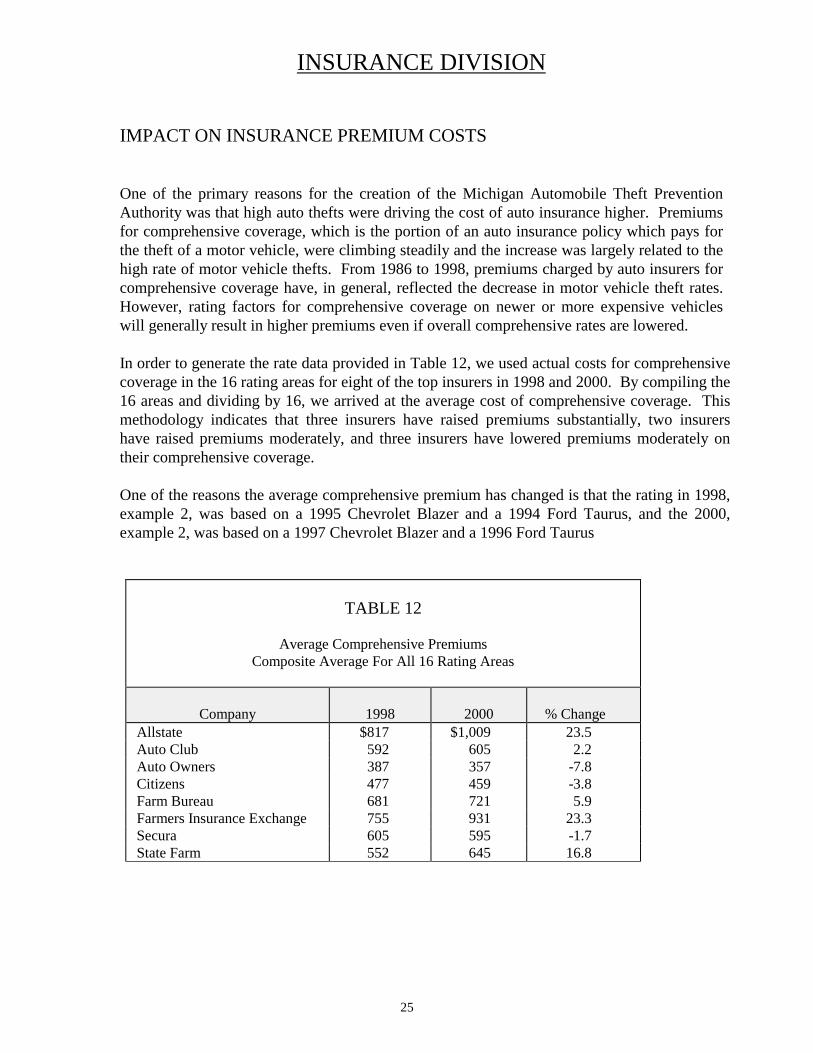
One of the primary reasons for the creation of the Michigan Automobile Theft PreventionAuthority was that high auto thefts were driving the cost of auto insurance higher. Premiumsfor comprehensive coverage, which is the portion of an auto insurance policy which pays forthe theft of a motor vehicle, were climbing steadily and the increase was largely related to thehigh rate of motor vehicle thefts. From 1986 to 1998, premiums charged by auto insurers forcomprehensive coverage have, in general, reflected the decrease in motor vehicle theft rates.However, rating factors for comprehensive coverage on newer or more expensive vehicleswill generally result in higher premiums even if overall comprehensive rates are lowered.
In order to generate the rate data provided in Table 12, we used actual costs for comprehensivecoverage in the 16 rating areas for eight of the top insurers in 1998 and 2000. By compiling the16 areas and dividing by 16, we arrived at the average cost of comprehensive coverage. Thismethodology indicates that three insurers have raised premiums substantially, two insurershave raised premiums moderately, and three insurers have lowered premiums moderately ontheir comprehensive coverage.
One of the reasons the average comprehensive premium has changed is that the rating in 1998,example 2, was based on a 1995 Chevrolet Blazer and a 1994 Ford Taurus, and the 2000,example 2, was based on a 1997 Chevrolet Blazer and a 1996 Ford Taurus
TABLE 12
Average Comprehensive PremiumsComposite Average For All 16 Rating Areas
Company 1998 2000 % Change Allstate $817 $1,009 23.5 Auto Club 592 605 2.2 Auto Owners 387 357 -7.8 Citizens 477 459 -3.8 Farm Bureau 681 721 5.9 Farmers Insurance Exchange 755 931 23.3 Secura 605 595 -1.7 State Farm 552 645 16.8
26
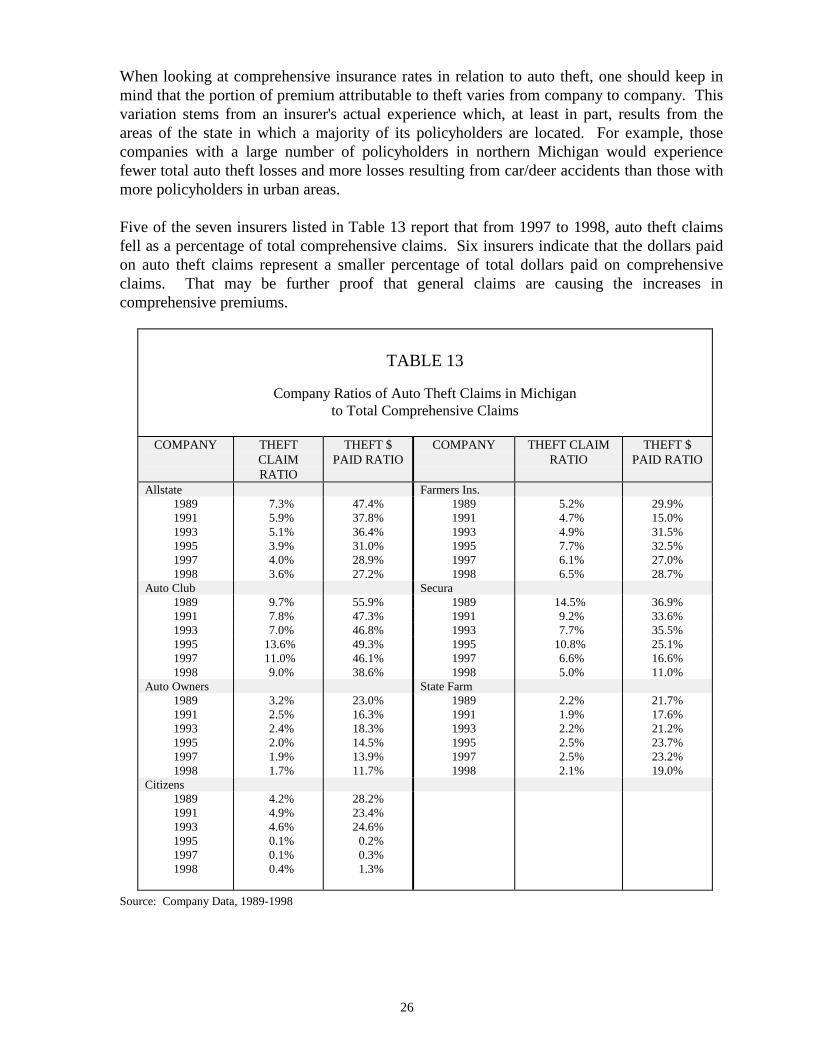
When looking at comprehensive insurance rates in relation to auto theft, one should keep inmind that the portion of premium attributable to theft varies from company to company. Thisvariation stems from an insurer's actual experience which, at least in part, results from theareas of the state in which a majority of its policyholders are located. For example, thosecompanies with a large number of policyholders in northern Michigan would experiencefewer total auto theft losses and more losses resulting from car/deer accidents than those withmore policyholders in urban areas.
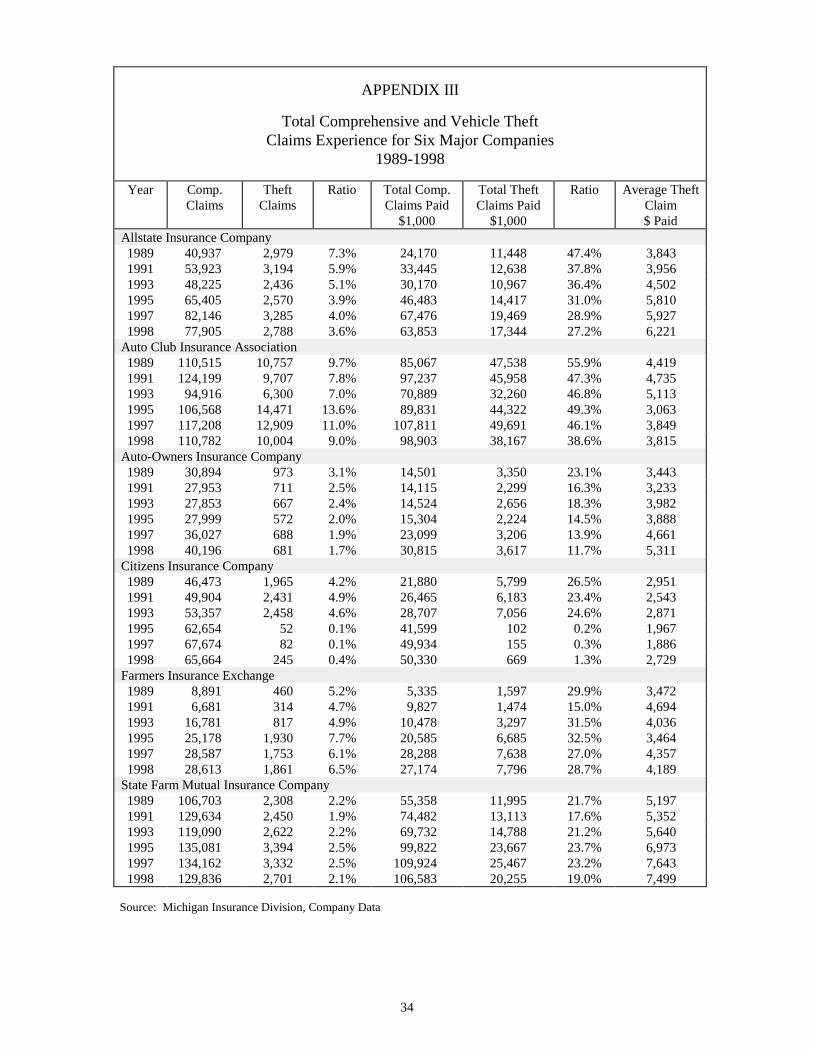
Five of the seven insurers listed in Table 13 report that from 1997 to 1998, auto theft claimsfell as a percentage of total comprehensive claims. Six insurers indicate that the dollars paidon auto theft claims represent a smaller percentage of total dollars paid on comprehensiveclaims. That may be further proof that general claims are causing the increases incomprehensive premiums.
TABLE 13
Company Ratios of Auto Theft Claims in Michiganto Total Comprehensive Claims
COMPANY THEFTCLAIMRATIO
THEFT $PAID RATIO
COMPANY THEFT CLAIMRATIO
THEFT $PAID RATIO
Allstate Farmers Ins.198919911993199519971998
7.3% 5.9% 5.1% 3.9% 4.0% 3.6%
47.4%37.8%36.4%31.0%28.9%27.2%
198919911993199519971998
5.2% 4.7% 4.9% 7.7% 6.1% 6.5%
29.9%15.0%31.5%32.5%27.0%28.7%
Auto Club Secura1989 9.7% 55.9% 1989 14.5% 36.9%1991 7.8% 47.3% 1991 9.2% 33.6%1993 7.0% 46.8% 1993 7.7% 35.5%1995 13.6% 49.3% 1995 10.8% 25.1%19971998
11.0% 9.0%
46.1%38.6%
19971998
6.6% 5.0%
16.6%11.0%
Auto Owners State Farm198919911993199519971998
3.2% 2.5% 2.4% 2.0% 1.9% 1.7%
23.0%16.3%18.3%14.5%13.9%11.7%
198919911993199519971998
2.2% 1.9% 2.2% 2.5% 2.5% 2.1%
21.7%17.6%21.2%23.7%23.2%19.0%
Citizens198919911993199519971998
4.2% 4.9% 4.6% 0.1% 0.1% 0.4%
28.2%23.4%24.6% 0.2% 0.3% 1.3%
Source: Company Data, 1989-1998
27
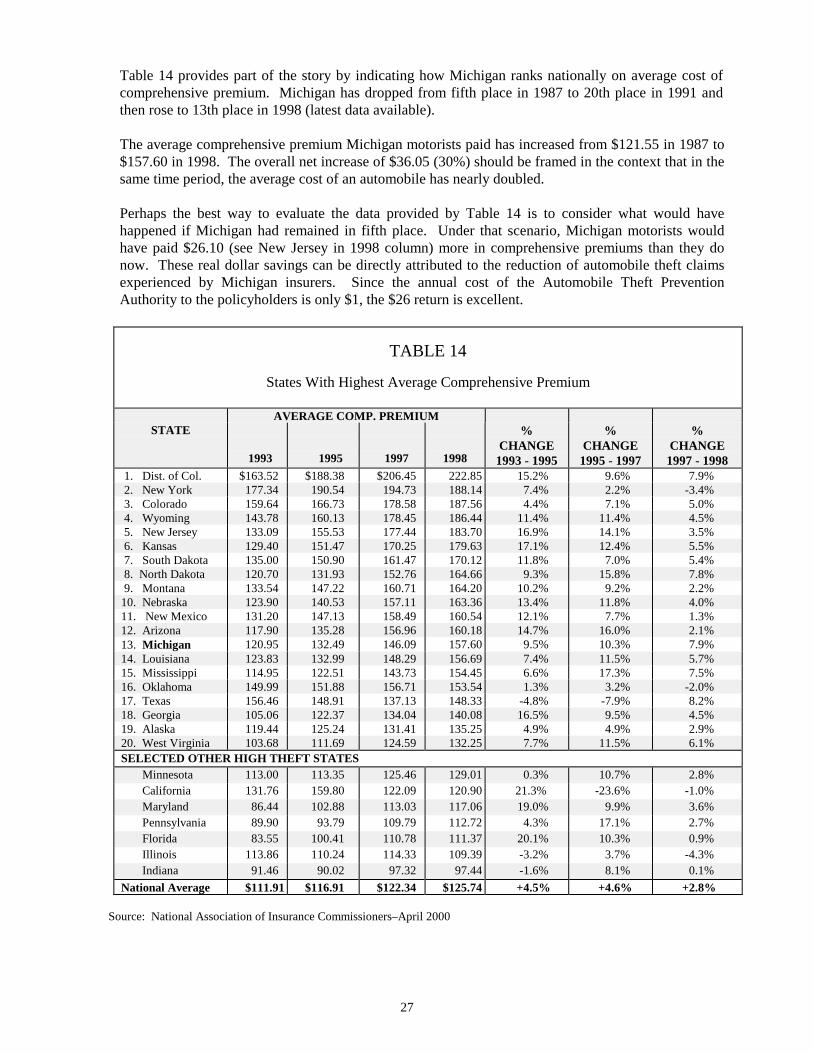
Table 14 provides part of the story by indicating how Michigan ranks nationally on average cost ofcomprehensive premium. Michigan has dropped from fifth place in 1987 to 20th place in 1991 andthen rose to 13th place in 1998 (latest data available).
The average comprehensive premium Michigan motorists paid has increased from $121.55 in 1987 to$157.60 in 1998. The overall net increase of $36.05 (30%) should be framed in the context that in thesame time period, the average cost of an automobile has nearly doubled.
Perhaps the best way to evaluate the data provided by Table 14 is to consider what would havehappened if Michigan had remained in fifth place. Under that scenario, Michigan motorists wouldhave paid $26.10 (see New Jersey in 1998 column) more in comprehensive premiums than they donow. These real dollar savings can be directly attributed to the reduction of automobile theft claimsexperienced by Michigan insurers. Since the annual cost of the Automobile Theft PreventionAuthority to the policyholders is only $1, the $26 return is excellent.
TABLE 14
States With Highest Average Comprehensive Premium
AVERAGE COMP. PREMIUMSTATE
1993 1995 1997 1998
%CHANGE
1993 - 1995
%CHANGE
1995 - 1997
%CHANGE
1997 - 1998 1. Dist. of Col. $163.52 $188.38 $206.45 222.85 15.2% 9.6% 7.9% 2. New York 177.34 190.54 194.73 188.14 7.4% 2.2% -3.4% 3. Colorado 159.64 166.73 178.58 187.56 4.4% 7.1% 5.0% 4. Wyoming 143.78 160.13 178.45 186.44 11.4% 11.4% 4.5% 5. New Jersey 133.09 155.53 177.44 183.70 16.9% 14.1% 3.5% 6. Kansas 129.40 151.47 170.25 179.63 17.1% 12.4% 5.5% 7. South Dakota 135.00 150.90 161.47 170.12 11.8% 7.0% 5.4% 8. North Dakota 120.70 131.93 152.76 164.66 9.3% 15.8% 7.8% 9. Montana 133.54 147.22 160.71 164.20 10.2% 9.2% 2.2%10. Nebraska 123.90 140.53 157.11 163.36 13.4% 11.8% 4.0%11. New Mexico 131.20 147.13 158.49 160.54 12.1% 7.7% 1.3%12. Arizona 117.90 135.28 156.96 160.18 14.7% 16.0% 2.1%13. Michigan 120.95 132.49 146.09 157.60 9.5% 10.3% 7.9%14. Louisiana 123.83 132.99 148.29 156.69 7.4% 11.5% 5.7%15. Mississippi 114.95 122.51 143.73 154.45 6.6% 17.3% 7.5%16. Oklahoma 149.99 151.88 156.71 153.54 1.3% 3.2% -2.0%17. Texas 156.46 148.91 137.13 148.33 -4.8% -7.9% 8.2%18. Georgia 105.06 122.37 134.04 140.08 16.5% 9.5% 4.5%19. Alaska 119.44 125.24 131.41 135.25 4.9% 4.9% 2.9%20. West Virginia 103.68 111.69 124.59 132.25 7.7% 11.5% 6.1%SELECTED OTHER HIGH THEFT STATES Minnesota 113.00 113.35 125.46 129.01 0.3% 10.7% 2.8% California 131.76 159.80 122.09 120.90 21.3% -23.6% -1.0% Maryland 86.44 102.88 113.03 117.06 19.0% 9.9% 3.6% Pennsylvania 89.90 93.79 109.79 112.72 4.3% 17.1% 2.7% Florida 83.55 100.41 110.78 111.37 20.1% 10.3% 0.9% Illinois 113.86 110.24 114.33 109.39 -3.2% 3.7% -4.3% Indiana 91.46 90.02 97.32 97.44 -1.6% 8.1% 0.1%National Average $111.91 $116.91 $122.34 $125.74 +4.5% +4.6% +2.8%
Source: National Association of Insurance Commissioners–April 2000
28
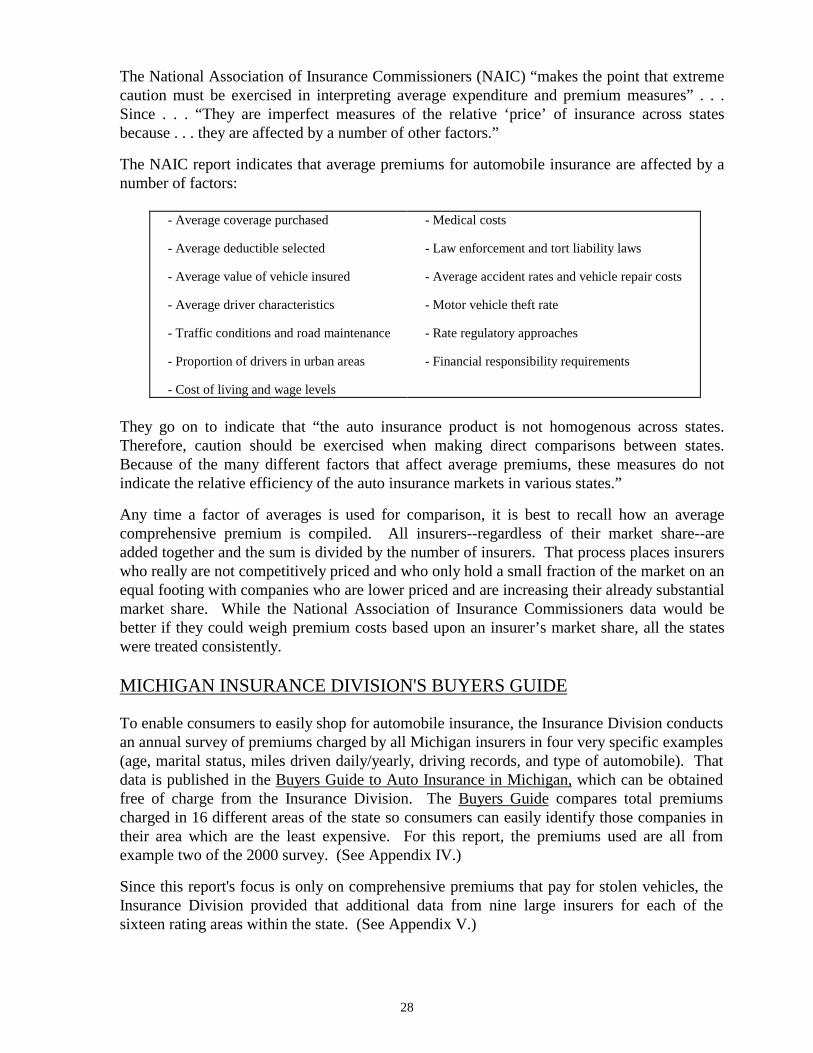
The National Association of Insurance Commissioners (NAIC) “makes the point that extremecaution must be exercised in interpreting average expenditure and premium measures” . . .Since . . . “They are imperfect measures of the relative ‘price’ of insurance across statesbecause . . . they are affected by a number of other factors.”
The NAIC report indicates that average premiums for automobile insurance are affected by anumber of factors:
- Average coverage purchased
- Average deductible selected
- Average value of vehicle insured
- Average driver characteristics
- Traffic conditions and road maintenance
- Proportion of drivers in urban areas
- Cost of living and wage levels
- Medical costs
- Law enforcement and tort liability laws
- Average accident rates and vehicle repair costs
- Motor vehicle theft rate
- Rate regulatory approaches
- Financial responsibility requirements
They go on to indicate that “the auto insurance product is not homogenous across states.Therefore, caution should be exercised when making direct comparisons between states.Because of the many different factors that affect average premiums, these measures do notindicate the relative efficiency of the auto insurance markets in various states.”
Any time a factor of averages is used for comparison, it is best to recall how an averagecomprehensive premium is compiled. All insurers--regardless of their market share--areadded together and the sum is divided by the number of insurers. That process places insurerswho really are not competitively priced and who only hold a small fraction of the market on anequal footing with companies who are lower priced and are increasing their already substantialmarket share. While the National Association of Insurance Commissioners data would bebetter if they could weigh premium costs based upon an insurer’s market share, all the stateswere treated consistently.
MICHIGAN INSURANCE DIVISION'S BUYERS GUIDE
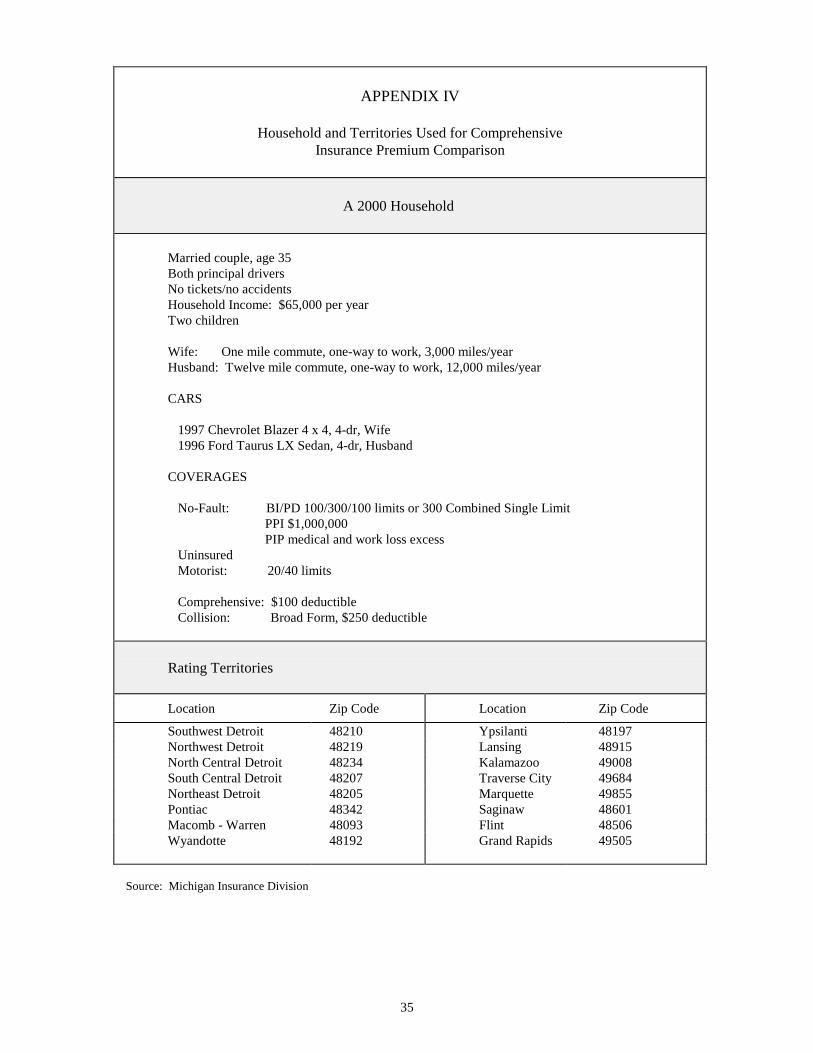
To enable consumers to easily shop for automobile insurance, the Insurance Division conductsan annual survey of premiums charged by all Michigan insurers in four very specific examples(age, marital status, miles driven daily/yearly, driving records, and type of automobile). Thatdata is published in the Buyers Guide to Auto Insurance in Michigan, which can be obtainedfree of charge from the Insurance Division. The Buyers Guide compares total premiumscharged in 16 different areas of the state so consumers can easily identify those companies intheir area which are the least expensive. For this report, the premiums used are all fromexample two of the 2000 survey. (See Appendix IV.)
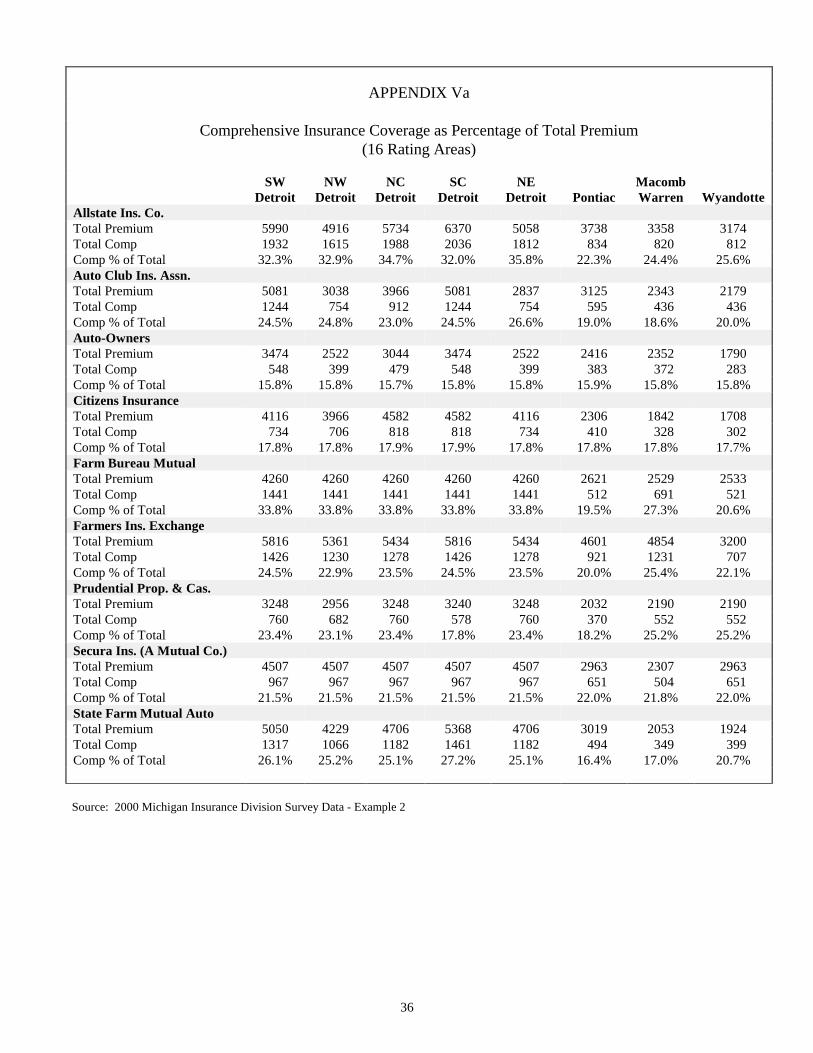
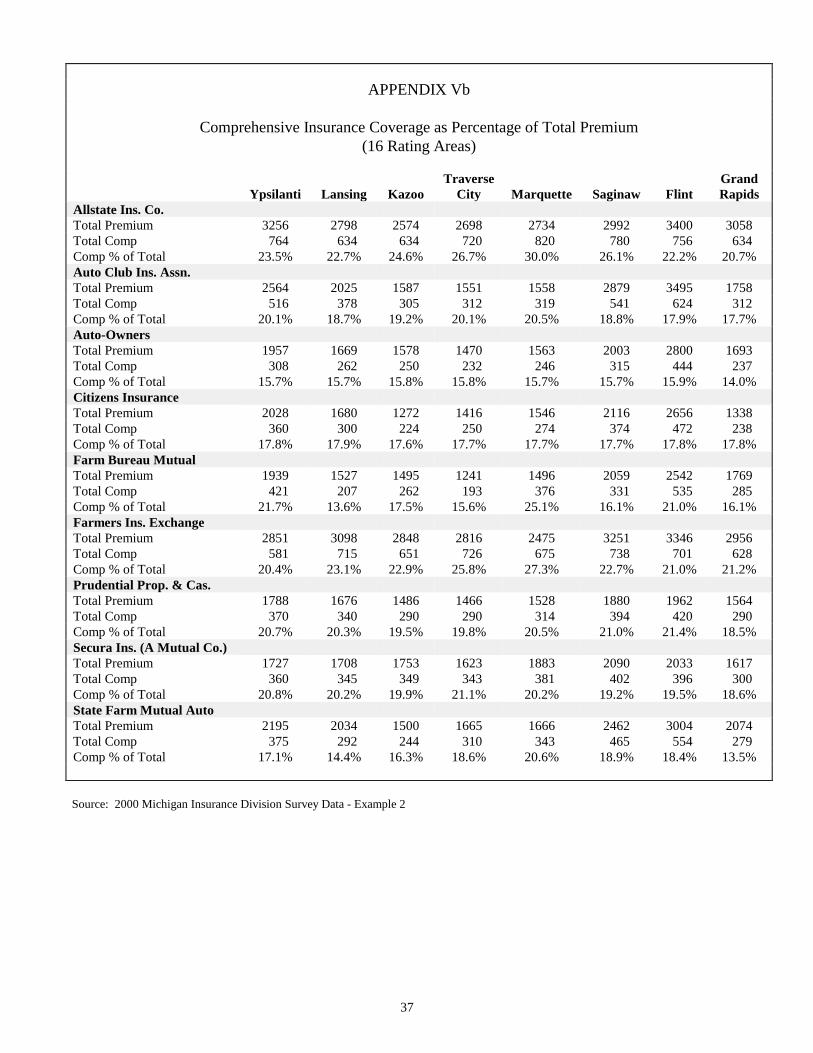
Since this report's focus is only on comprehensive premiums that pay for stolen vehicles, theInsurance Division provided that additional data from nine large insurers for each of thesixteen rating areas within the state. (See Appendix V.)
29
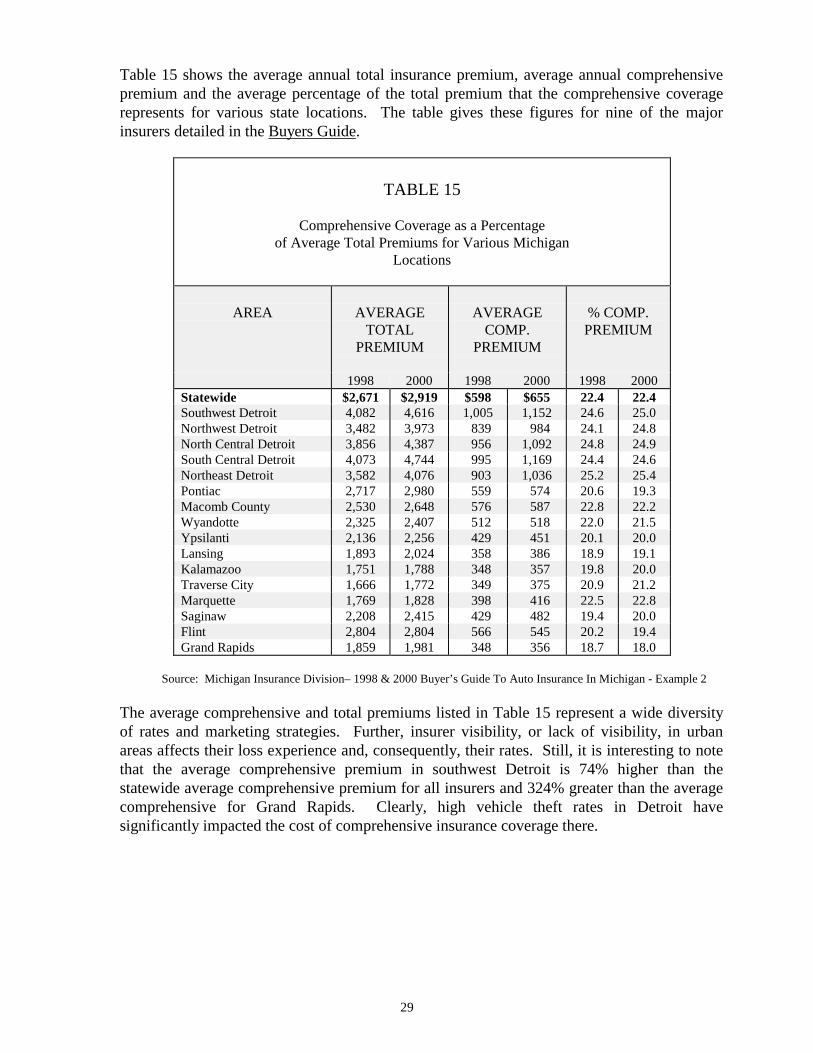
Table 15 shows the average annual total insurance premium, average annual comprehensivepremium and the average percentage of the total premium that the comprehensive coveragerepresents for various state locations. The table gives these figures for nine of the majorinsurers detailed in the Buyers Guide.
TABLE 15
Comprehensive Coverage as a Percentageof Average Total Premiums for Various Michigan
Locations
AREA AVERAGETOTAL
PREMIUM
AVERAGECOMP.
PREMIUM
% COMP.PREMIUM
1998 2000 1998 2000 1998 2000Statewide $2,671 $2,919 $598 $655 22.4 22.4Southwest Detroit 4,082 4,616 1,005 1,152 24.6 25.0Northwest Detroit 3,482 3,973 839 984 24.1 24.8North Central Detroit 3,856 4,387 956 1,092 24.8 24.9South Central Detroit 4,073 4,744 995 1,169 24.4 24.6Northeast Detroit 3,582 4,076 903 1,036 25.2 25.4Pontiac 2,717 2,980 559 574 20.6 19.3Macomb County 2,530 2,648 576 587 22.8 22.2Wyandotte 2,325 2,407 512 518 22.0 21.5Ypsilanti 2,136 2,256 429 451 20.1 20.0Lansing 1,893 2,024 358 386 18.9 19.1Kalamazoo 1,751 1,788 348 357 19.8 20.0Traverse City 1,666 1,772 349 375 20.9 21.2Marquette 1,769 1,828 398 416 22.5 22.8Saginaw 2,208 2,415 429 482 19.4 20.0Flint 2,804 2,804 566 545 20.2 19.4Grand Rapids 1,859 1,981 348 356 18.7 18.0
Source: Michigan Insurance Division– 1998 & 2000 Buyer’s Guide To Auto Insurance In Michigan - Example 2
The average comprehensive and total premiums listed in Table 15 represent a wide diversityof rates and marketing strategies. Further, insurer visibility, or lack of visibility, in urbanareas affects their loss experience and, consequently, their rates. Still, it is interesting to notethat the average comprehensive premium in southwest Detroit is 74% higher than thestatewide average comprehensive premium for all insurers and 324% greater than the averagecomprehensive for Grand Rapids. Clearly, high vehicle theft rates in Detroit havesignificantly impacted the cost of comprehensive insurance coverage there.
30
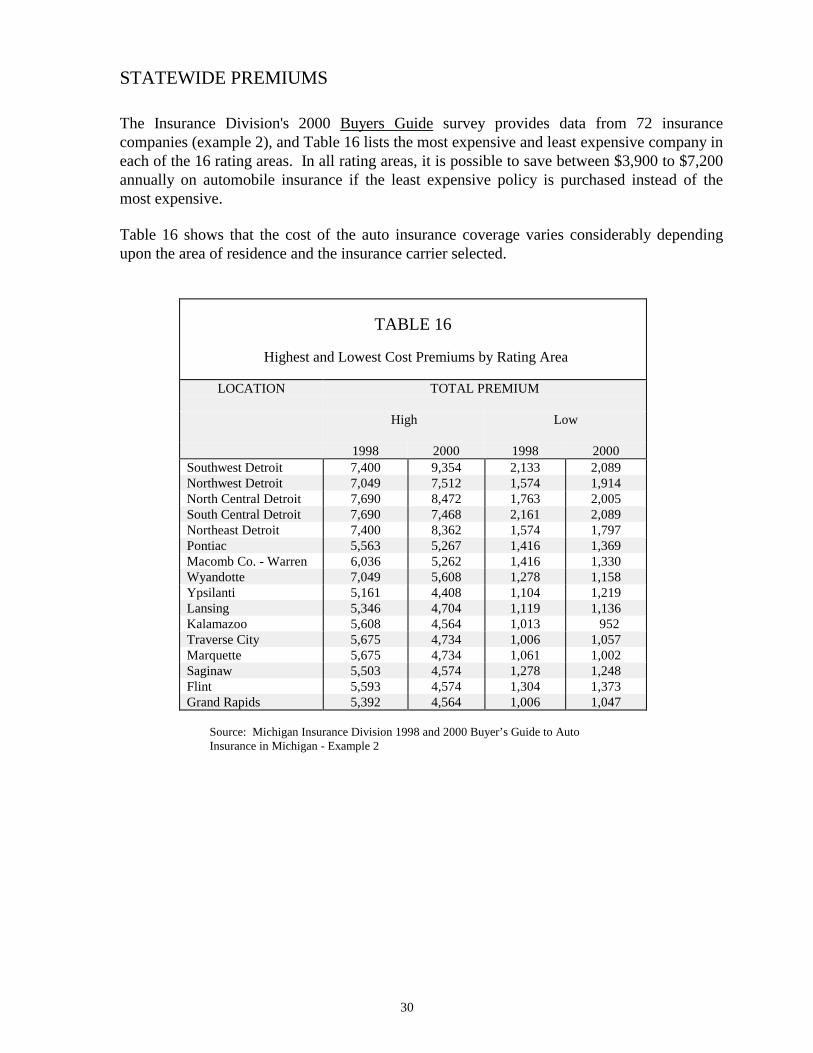
STATEWIDE PREMIUMS
The Insurance Division's 2000 Buyers Guide survey provides data from 72 insurancecompanies (example 2), and Table 16 lists the most expensive and least expensive company ineach of the 16 rating areas. In all rating areas, it is possible to save between $3,900 to $7,200annually on automobile insurance if the least expensive policy is purchased instead of themost expensive.
Table 16 shows that the cost of the auto insurance coverage varies considerably dependingupon the area of residence and the insurance carrier selected.
TABLE 16
Highest and Lowest Cost Premiums by Rating Area
LOCATION TOTAL PREMIUM
High Low
1998 2000 1998 2000Southwest Detroit 7,400 9,354 2,133 2,089Northwest Detroit 7,049 7,512 1,574 1,914North Central Detroit 7,690 8,472 1,763 2,005South Central Detroit 7,690 7,468 2,161 2,089Northeast Detroit 7,400 8,362 1,574 1,797Pontiac 5,563 5,267 1,416 1,369Macomb Co. - Warren 6,036 5,262 1,416 1,330Wyandotte 7,049 5,608 1,278 1,158Ypsilanti 5,161 4,408 1,104 1,219Lansing 5,346 4,704 1,119 1,136Kalamazoo 5,608 4,564 1,013 952Traverse City 5,675 4,734 1,006 1,057Marquette 5,675 4,734 1,061 1,002Saginaw 5,503 4,574 1,278 1,248Flint 5,593 4,574 1,304 1,373Grand Rapids 5,392 4,564 1,006 1,047
Source: Michigan Insurance Division 1998 and 2000 Buyer’s Guide to AutoInsurance in Michigan - Example 2

31
APPENDICES
32
APPENDIX I
Ten States With Highest Number ofMotor Vehicle Thefts
1986-1999
1986 1987 1989
State Rank MVT State Rank MVT State Rank MVTCalifornia 1 205,597 California 1 229,624 California 1 298,445Texas 2 119,121 New York 2 125,329 New York 2 171,007New York 3 113,247 Texas 3 123,367 Texas 3 150,971Illinois 4 72,587 Florida 4 81,355 Florida 4 102,086MICHIGAN(UCR)
5 72,021 MICHIGAN (UCR) 5 68,415 New Jersey 5 71,106
Florida 6 69,824 New Jersey 6 64,857 Illinois 6 70,806New Jersey 7 59,096 Illinois 7 62,487 MICHIGAN (UCR) 7 65,220Massachusetts 8 52,866 Massachusetts 8 54,110 Pennsylvania 8 56,517Pennsylvania 9 42,130 Pennsylvania 9 41,680 Massachusetts 9 53,851Ohio 10 40,396 Ohio 10 41,291 Ohio 10 47,477
1991 1993 1995
State Rank MVT State Rank MVT State Rank MVTCalifornia 1 315,615 California 1 319,295 California 1 280,479New York 2 181,287 New York 2 151,949 Florida 2 111,320Texas 3 163,830 Texas 3 124,837 Texas 3 104,923Florida 4 104,035 Florida 4 122,516 New York 4 102,596Illinois 5 75,642 Illinois 5 65,351 Illinois 5 61,874New Jersey 6 71,847 MICHIGAN (UCR) 6 56,669 MICHIGAN (UCR) 6 57,895MICHIGAN(UCR)
7 62,626 New Jersey 7 56,253 New Jersey 7 50,184
Pennsylvania 8 57,598 Pennsylvania 8 53,033 Pennsylvania 8 49,817Massachusetts 9 55,083 Massachusetts 9 49,063 Arizona 9 48,830Ohio 10 54,744 Ohio 10 48,276 Ohio 10 46,261
1997 1999 2001
State Rank MVT State Rank MVT State Rank MVTCalifornia 1 228,722 California 1 168,480Florida 2 107,195 Florida 2 93,191Texas 3 101,721 Texas 3 92,037New York 4 79,697 New York 4 58,261MICHIGAN(UCR)
5 59,826 MICHIGAN (UCR) 5 54,018
Illinois 6 55,426 Illinois 6 52,114Ohio 7 45,419 Georgia 7 40,120Georgia 8 44,572 Pennsylvania 8 39,234Pennsylvania 9 44,213 Ohio 9 39,192Arizona 10 44,201 Arizona 10 38,247
Source: FBI and Michigan Uniform Crime Reports 1986 - 1999
33
APPENDIX II
Twelve States With HighestVehicle Theft Rates Per 100,000 Population
1984-1999
1984 1991 1993State Rank Rate State Rank Rate State Rank Rate
MICHIGAN (UCR) 1 865.9 California 1 1038.9 California 1 1023.0Massachusetts 2 840.0 New York 2 1003.9 Florida 2 895.7Rhode Island 3 691.9 Texas 3 944.3 Arizona 3 863.8New York 4 650.6 New Jersey 4 925.9 New York 4 835.0California 5 629.6 Massachusetts 5 918.7 Massachusetts 5 816.1Alaska 6 628.8 Arizona 6 861.1 Nevada 6 738.3Illinois 7 585.6 Connecticut 7 795.7 New Jersey 7 714.0New Jersey 8 574.6 Rhode Island 8 794.1 Texas 8 692.3Texas 9 549.1 Florida 9 783.6 Maryland 9 683.4Nevada 10 495.5 Maryland 10 730.8 Rhode Island 10 646.3Oklahoma 11 457.7 MICHIGAN (UCR) 11 668.6 Louisiana 11 613.7Florida 12 426.7 Illinois 12 655.3 MICHIGAN
(UCR)12 597.9
NATIONAL 437.1 NATIONAL 659.0 NATIONAL 605.3
1995 1997 1999State Rank Rate State Rank Rate State Rank Rate
Dist. of Columbia 1 1,839.9 Dist. of Columbia 1 1,430.8 Dist. of Columbia 1 1,281.7Arizona 2 1,157.7 Arizona 2 970.4 Arizona 2 800.5California 3 887.9 Nevada 3 788.3 Nevada 3 723.8Florida 4 785.8 Florida 4 731.5 Florida 4 616.7Nevada 5 745.4 New Mexico 5 717..2 Washington 5 587.3Maryland 6 717.6 California 6 708.8 MICHIGAN (UCR) 6 547.6Oregon 7 702.0 Tennessee 7 628.6 Georgia 7 515.2Hawaii 8 690.7 MICHIGAN (UCR) 8 612.1 California 8 508.3Tennessee 9 648.5 Louisiana 9 606.0 Louisiana 9 496.2New Jersey 10 631.6 Maryland 10 602.0 Maryland 10 492.0Georgia 11 608.4 Georgia 11 595.4 Mississippi 11 488.7MICHIGAN (UCR) 12 606.3 Oregon 12 594.5 New Mexico 12 467.0
NATIONAL 560.5 NATIONAL 505.8 NATIONAL 420.7
Michigan 1984-1991: - 22.8% 1991-1993: - 10.6% 1993-1995: + 1.4% 1995-1997: + 1.0% 1997-1999: - 10.5%National 1984-1991: + 50.8% 1991-1993: - 8.2% 1993-1995: - 7.4% 1995-1997: - 9.8% 1997-1999: - 16.8%
Source: FBI and Michigan Uniform Crime Reports 1984-1999
34
APPENDIX III
Total Comprehensive and Vehicle TheftClaims Experience for Six Major Companies
1989-1998
Year Comp.Claims
TheftClaims
Ratio Total Comp.Claims Paid
$1,000
Total TheftClaims Paid
$1,000
Ratio Average TheftClaim$ Paid
Allstate Insurance Company1989 40,937 2,979 7.3% 24,170 11,448 47.4% 3,8431991 53,923 3,194 5.9% 33,445 12,638 37.8% 3,9561993 48,225 2,436 5.1% 30,170 10,967 36.4% 4,5021995 65,405 2,570 3.9% 46,483 14,417 31.0% 5,8101997 82,146 3,285 4.0% 67,476 19,469 28.9% 5,9271998 77,905 2,788 3.6% 63,853 17,344 27.2% 6,221
Auto Club Insurance Association1989 110,515 10,757 9.7% 85,067 47,538 55.9% 4,4191991 124,199 9,707 7.8% 97,237 45,958 47.3% 4,7351993 94,916 6,300 7.0% 70,889 32,260 46.8% 5,1131995 106,568 14,471 13.6% 89,831 44,322 49.3% 3,0631997 117,208 12,909 11.0% 107,811 49,691 46.1% 3,8491998 110,782 10,004 9.0% 98,903 38,167 38.6% 3,815
Auto-Owners Insurance Company1989 30,894 973 3.1% 14,501 3,350 23.1% 3,4431991 27,953 711 2.5% 14,115 2,299 16.3% 3,2331993 27,853 667 2.4% 14,524 2,656 18.3% 3,9821995 27,999 572 2.0% 15,304 2,224 14.5% 3,8881997 36,027 688 1.9% 23,099 3,206 13.9% 4,6611998 40,196 681 1.7% 30,815 3,617 11.7% 5,311
Citizens Insurance Company1989 46,473 1,965 4.2% 21,880 5,799 26.5% 2,9511991 49,904 2,431 4.9% 26,465 6,183 23.4% 2,5431993 53,357 2,458 4.6% 28,707 7,056 24.6% 2,8711995 62,654 52 0.1% 41,599 102 0.2% 1,9671997 67,674 82 0.1% 49,934 155 0.3% 1,8861998 65,664 245 0.4% 50,330 669 1.3% 2,729
Farmers Insurance Exchange1989 8,891 460 5.2% 5,335 1,597 29.9% 3,4721991 6,681 314 4.7% 9,827 1,474 15.0% 4,6941993 16,781 817 4.9% 10,478 3,297 31.5% 4,0361995 25,178 1,930 7.7% 20,585 6,685 32.5% 3,4641997 28,587 1,753 6.1% 28,288 7,638 27.0% 4,3571998 28,613 1,861 6.5% 27,174 7,796 28.7% 4,189
State Farm Mutual Insurance Company1989 106,703 2,308 2.2% 55,358 11,995 21.7% 5,1971991 129,634 2,450 1.9% 74,482 13,113 17.6% 5,3521993 119,090 2,622 2.2% 69,732 14,788 21.2% 5,6401995 135,081 3,394 2.5% 99,822 23,667 23.7% 6,9731997 134,162 3,332 2.5% 109,924 25,467 23.2% 7,6431998 129,836 2,701 2.1% 106,583 20,255 19.0% 7,499
Source: Michigan Insurance Division, Company Data
35
APPENDIX IV
Household and Territories Used for ComprehensiveInsurance Premium Comparison
A 2000 Household
Married couple, age 35Both principal driversNo tickets/no accidentsHousehold Income: $65,000 per yearTwo children
Wife: One mile commute, one-way to work, 3,000 miles/yearHusband: Twelve mile commute, one-way to work, 12,000 miles/year
CARS
1997 Chevrolet Blazer 4 x 4, 4-dr, Wife 1996 Ford Taurus LX Sedan, 4-dr, Husband
COVERAGES
No-Fault: BI/PD 100/300/100 limits or 300 Combined Single Limit PPI $1,000,000 PIP medical and work loss excess Uninsured Motorist: 20/40 limits
Comprehensive: $100 deductible Collision: Broad Form, $250 deductible
Rating Territories
Location Zip Code Location Zip Code
Southwest Detroit 48210 Ypsilanti 48197Northwest Detroit 48219 Lansing 48915North Central Detroit 48234 Kalamazoo 49008South Central Detroit 48207 Traverse City 49684Northeast Detroit 48205 Marquette 49855Pontiac 48342 Saginaw 48601Macomb - Warren 48093 Flint 48506Wyandotte 48192 Grand Rapids 49505
Source: Michigan Insurance Division
36
APPENDIX Va
Comprehensive Insurance Coverage as Percentage of Total Premium(16 Rating Areas)
SWDetroit
NWDetroit
NCDetroit
SCDetroit
NEDetroit Pontiac
MacombWarren Wyandotte
Allstate Ins. Co.Total Premium 5990 4916 5734 6370 5058 3738 3358 3174Total Comp 1932 1615 1988 2036 1812 834 820 812Comp % of Total 32.3% 32.9% 34.7% 32.0% 35.8% 22.3% 24.4% 25.6%Auto Club Ins. Assn.Total Premium 5081 3038 3966 5081 2837 3125 2343 2179Total Comp 1244 754 912 1244 754 595 436 436Comp % of Total 24.5% 24.8% 23.0% 24.5% 26.6% 19.0% 18.6% 20.0%Auto-OwnersTotal Premium 3474 2522 3044 3474 2522 2416 2352 1790Total Comp 548 399 479 548 399 383 372 283Comp % of Total 15.8% 15.8% 15.7% 15.8% 15.8% 15.9% 15.8% 15.8%Citizens InsuranceTotal Premium 4116 3966 4582 4582 4116 2306 1842 1708Total Comp 734 706 818 818 734 410 328 302Comp % of Total 17.8% 17.8% 17.9% 17.9% 17.8% 17.8% 17.8% 17.7%Farm Bureau MutualTotal Premium 4260 4260 4260 4260 4260 2621 2529 2533Total Comp 1441 1441 1441 1441 1441 512 691 521Comp % of Total 33.8% 33.8% 33.8% 33.8% 33.8% 19.5% 27.3% 20.6%Farmers Ins. ExchangeTotal Premium 5816 5361 5434 5816 5434 4601 4854 3200Total Comp 1426 1230 1278 1426 1278 921 1231 707Comp % of Total 24.5% 22.9% 23.5% 24.5% 23.5% 20.0% 25.4% 22.1%Prudential Prop. & Cas.Total Premium 3248 2956 3248 3240 3248 2032 2190 2190Total Comp 760 682 760 578 760 370 552 552Comp % of Total 23.4% 23.1% 23.4% 17.8% 23.4% 18.2% 25.2% 25.2%Secura Ins. (A Mutual Co.)Total Premium 4507 4507 4507 4507 4507 2963 2307 2963Total Comp 967 967 967 967 967 651 504 651Comp % of Total 21.5% 21.5% 21.5% 21.5% 21.5% 22.0% 21.8% 22.0%State Farm Mutual AutoTotal Premium 5050 4229 4706 5368 4706 3019 2053 1924Total Comp 1317 1066 1182 1461 1182 494 349 399Comp % of Total 26.1% 25.2% 25.1% 27.2% 25.1% 16.4% 17.0% 20.7%
Source: 2000 Michigan Insurance Division Survey Data - Example 2
37
APPENDIX Vb
Comprehensive Insurance Coverage as Percentage of Total Premium(16 Rating Areas)
Ypsilanti Lansing KazooTraverse
City Marquette Saginaw FlintGrandRapids
Allstate Ins. Co.Total Premium 3256 2798 2574 2698 2734 2992 3400 3058Total Comp 764 634 634 720 820 780 756 634Comp % of Total 23.5% 22.7% 24.6% 26.7% 30.0% 26.1% 22.2% 20.7%Auto Club Ins. Assn.Total Premium 2564 2025 1587 1551 1558 2879 3495 1758Total Comp 516 378 305 312 319 541 624 312Comp % of Total 20.1% 18.7% 19.2% 20.1% 20.5% 18.8% 17.9% 17.7%Auto-OwnersTotal Premium 1957 1669 1578 1470 1563 2003 2800 1693Total Comp 308 262 250 232 246 315 444 237Comp % of Total 15.7% 15.7% 15.8% 15.8% 15.7% 15.7% 15.9% 14.0%Citizens InsuranceTotal Premium 2028 1680 1272 1416 1546 2116 2656 1338Total Comp 360 300 224 250 274 374 472 238Comp % of Total 17.8% 17.9% 17.6% 17.7% 17.7% 17.7% 17.8% 17.8%Farm Bureau MutualTotal Premium 1939 1527 1495 1241 1496 2059 2542 1769Total Comp 421 207 262 193 376 331 535 285Comp % of Total 21.7% 13.6% 17.5% 15.6% 25.1% 16.1% 21.0% 16.1%Farmers Ins. ExchangeTotal Premium 2851 3098 2848 2816 2475 3251 3346 2956Total Comp 581 715 651 726 675 738 701 628Comp % of Total 20.4% 23.1% 22.9% 25.8% 27.3% 22.7% 21.0% 21.2%Prudential Prop. & Cas.Total Premium 1788 1676 1486 1466 1528 1880 1962 1564Total Comp 370 340 290 290 314 394 420 290Comp % of Total 20.7% 20.3% 19.5% 19.8% 20.5% 21.0% 21.4% 18.5%Secura Ins. (A Mutual Co.)Total Premium 1727 1708 1753 1623 1883 2090 2033 1617Total Comp 360 345 349 343 381 402 396 300Comp % of Total 20.8% 20.2% 19.9% 21.1% 20.2% 19.2% 19.5% 18.6%State Farm Mutual AutoTotal Premium 2195 2034 1500 1665 1666 2462 3004 2074Total Comp 375 292 244 310 343 465 554 279Comp % of Total 17.1% 14.4% 16.3% 18.6% 20.6% 18.9% 18.4% 13.5%
Source: 2000 Michigan Insurance Division Survey Data - Example 2
38
APPENDIX VI
Michigan Automobile Theft Prevention Authority2001 Total Approved Budgets
GENESEE COUNTY
Genesee County Prosecutor’s Office $90,429Genesee County Sheriff’s Department 542,785
KENT COUNTY
Garfield Park Neighborhood Association 14,250Grand Rapids, Kentwood, and Wyoming Police Departments 279,795West Grand Neighborhoods 18,296
MACOMB COUNTY
Macomb County Prosecutor’s Office 104,895Macomb County Sheriff’s Department 717,709
OAKLAND COUNTY
Oakland County Prosecutor’s Office 218,985Oakland County Sheriff’s Department 597,492Southfield Police Department 197,723
SAGINAW COUNTY
Saginaw County Prosecutor’s Office 25,600Saginaw Police Department 168,772
WAYNE COUNTY
Wayne County Prosecutor’s Office 354,138Western Wayne Auto Theft Team 810,488Detroit Police Department 1,864,595Hamtramck Police Department 129,621Michigan State Police, Downriver Team 587,147Neighborhood Service Organization 41,147Eastside Industrial Council 9,980
OTHER
Lansing Police Department 98,868Michigan State Police, Monroe Auto Theft Team 104,382Michigan State Police, Southwestern Michigan Team 429,826Michigan State Police, Washtenaw Team
TOTAL
184,135
$7,591,058
Source: Michigan Automobile Theft Prevention Authority
39
APPENDIX VIIa
STANDARDS FOR AUTOMOBILE THEFT PREVENTION AND RECOVERY DEVICESApproved By The Michigan Automobile Theft Prevention Authority, June 22, 1994
Effective January 1, 1995
The following automobile theft prevention and recovery devices have been approved by the Automobile TheftPrevention Authority (ATPA), in accordance with Act 143 P.A. of 1993. Any vehicles which are equipped withor contain these devices will qualify for a reduction in the automobile's comprehensive insurance premium. Theamount of the specific reduction for each category will be determined by each insurance company, and insurersmay choose to provide a greater discount to vehicles which have devices from two or more categories.
Two categories of effectiveness in preventing vehicle theft have been identified, as well as one category forsystems which assist in the recovery of the vehicle if it is stolen. Proper use of the systems described incategories one and two will respectively provide an optimum level and a minimum level of theft deterrence. Avehicle properly equipped with a recovery device will enhance efforts to recover the vehicle.
1. CATEGORY ONE - PASSIVE SYSTEMS PROVIDING OPTIMUM LEVELOF SECURITY
The systems in this category will provide the optimum level of deterrence. To qualify for this discount, the vehicle must be equipped with at least one passive device (device is activated
automatically when the vehicle's ignition key is removed).
A. A passive alarm system which has a back-up battery and meets or exceedscriteria established in Category Two.
B. Passive disabling devices which prevent the vehicle's steering, fuel,transmission/transaxle, ignition or starting systems from operating, anddevices which prevent the vehicle's braking system from releasing.
C. A passive time delay ignition system which allows the vehicle to be startedonly after a preset delay or delayed ignition cut-off system which disables thevehicle at a preset engine speed.
D. A passive vehicle entry/ignition key system.
2. CATEGORY TWO - ACTIVE SYSTEMS PROVIDING A MINIMUM LEVELOF SECURITY
Any of the systems in this category will provide at least a minimum level of deterrence. To qualifyfor a discount, the vehicle must be equipped with at least one of these listed devices (which must bemanually activated by the vehicle owner prior to leaving the vehicle). An insurer may chose to offeran increased discount if the vehicle has two or more of these devices.
A. Alarm only devices--activated by a door, hood, or trunk being opened or by motion insidethe vehicle--which sound an audible alarm that can be heard at a distance of at least 300 feetfor a minimum of three minutes, or
40
APPENDIX VIIb
STANDARDS FOR AUTOMOBILE THEFT PREVENTION AND RECOVERY DEVICESApproved By The Michigan Automobile Theft Prevention Authority, June 22, 1994
Effective January 1, 1995
B. Manually activated disabling devices which prevent the vehicle's steering, fuel,transmission/transaxle, ignition or starting systems from operating, and devices whichprevent the vehicle's braking system from releasing.
C. Etching of 17 digit VIN on windshield, rear window glass, and both front doorwindows.
3. CATEGORY THREE - SYSTEMS WHICH ASSIST IN VEHICLE RECOVERY
The systems in this category enhance the effort to recover the vehicle after it is stolen.
A. A device which, when activated, emits an electronic signal that can be tracked byeither a law enforcement agency or by a private monitoring station which relays theinformation on the vehicle's location to law enforcement officers.
Source: Michigan Automobile Theft Prevention Authority