The Impact of Schadenfreude as an Emotional Frame in ...
137
Syracuse University Syracuse University SURFACE SURFACE Mass Communications - Dissertations S.I. Newhouse School of Public Communications 5-2013 The Impact of Schadenfreude as an Emotional Frame in Crisis The Impact of Schadenfreude as an Emotional Frame in Crisis Communications on Perception of Corporate Reputation Communications on Perception of Corporate Reputation Kristi Gilmore Syracuse University Follow this and additional works at: https://surface.syr.edu/com_etd Part of the Mass Communication Commons Recommended Citation Recommended Citation Gilmore, Kristi, "The Impact of Schadenfreude as an Emotional Frame in Crisis Communications on Perception of Corporate Reputation" (2013). Mass Communications - Dissertations. 93. https://surface.syr.edu/com_etd/93 This Dissertation is brought to you for free and open access by the S.I. Newhouse School of Public Communications at SURFACE. It has been accepted for inclusion in Mass Communications - Dissertations by an authorized administrator of SURFACE. For more information, please contact [email protected].
Transcript of The Impact of Schadenfreude as an Emotional Frame in ...

Syracuse University Syracuse University
SURFACE SURFACE
Mass Communications - Dissertations S.I. Newhouse School of Public Communications
5-2013
The Impact of Schadenfreude as an Emotional Frame in Crisis The Impact of Schadenfreude as an Emotional Frame in Crisis
Communications on Perception of Corporate Reputation Communications on Perception of Corporate Reputation
Kristi Gilmore Syracuse University
Follow this and additional works at: https://surface.syr.edu/com_etd
Part of the Mass Communication Commons
Recommended Citation Recommended Citation Gilmore, Kristi, "The Impact of Schadenfreude as an Emotional Frame in Crisis Communications on Perception of Corporate Reputation" (2013). Mass Communications - Dissertations. 93. https://surface.syr.edu/com_etd/93
This Dissertation is brought to you for free and open access by the S.I. Newhouse School of Public Communications at SURFACE. It has been accepted for inclusion in Mass Communications - Dissertations by an authorized administrator of SURFACE. For more information, please contact [email protected].

ABSTRACT
This dissertation expands on the recent research focus on the role of stakeholder emotions in
crisis communications. Using a 2x2 experimental design, this study explores the emotions of
sadness and anger, as well as the concept of schadenfreude in relationship to stakeholders’
perceptions of corporate reputation. In addition to using the previously tested emotions of
sadness and anger in this context, the concept of schadenfreude (the feeling of pleasure one
experiences when a person or organization suffers a misfortune or set back) was re-introduced to
the field to better assess its potential role in the crisis communication process, specifically its
relationship with perceived corporate reputation. Additionally, both third-person effect and social
identity theory were introduced to explore their presence, and potential application, in future
crisis communications. While the stimulus materials were unsuccessful in creating significantly
different emotions in the subjects, there was an indication that schadenfreude as a concept is
present in crisis communication scenarios and that it may have a distinctly different effect on
perceived reputation than its more negative counterparts of anger and sadness. The presence of a
third-person effect, a previously under-studied concept in crisis communications, was found and
social identity theory held true, predicting perceived reputation based on identification with one
or another party/group. Finally, in an effort to control for demographic variables, gender was
found to have had a mitigating effect on reputation.
Keywords: Crisis Communications, Schadenfreude

ii
THE IMPACT OF SCHADENFREUDE AS AN EMOTIONAL FRAME IN CRISIS
COMMUNICATIONS ON PERCEPTION OF CORPORATE REPUTATION
By
Kristi Suzanne Gilmore, APR
B.A. Birmingham-Southern College, 1987
M.A. University of West Florida, 2009
DISSERTATION
Submitted in partial fulfillment of the requirement of the degree of Doctor of Philosophy in
Mass Communications in the Graduate School of Syracuse University
May 2013

iii
Copyright 2013 Kristi S. Gilmore
All Rights Reserved

iv
Acknowledgements
This adventure began under a wave of uncertainty that I could, after a 20-year hiatus, pick
up the books and take all the steps necessary to get my Ph.D. I have been accompanied on this
journey by so many people, without whom I would have given up a long time ago.
I am forever grateful to…
my dissertation advisor, Dennis Kinsey, who gave me the guidance and
encouragement I needed to push through the program and who became a mentor and
friend along the way;
my dissertation committee: Makana Chock, Bruce Dayton, James Tsao, Michael
Meath, and Ravi Shukla, who unselfishly lent their time and advice to me;
Barbara Fought, Brenda Wrigley, the PR faculty, and my fellow FPP participants, who
provided me with incredible teaching experiences and welcomed me as a colleague;
my fellow doctoral students (especially John, Gina, Val, Jen, Hinda, Cory, Sherri,
Kyu, Greg, Rachel, Brian, Linda, and Laura) who led the way, made me laugh, shared
my successes and failures, kept me relatively sane through classes (good and bad), and
made life in the doctoral carrels feel like home for three years; and
my wonderful friends, former co-workers, and family “back home” who encouraged
me to follow my dream, supported me in this mid-life transition, provided me with
lifelines through phone calls and emails, and “helped keep me together and believed
without a doubt.”
Most importantly, I dedicate this dissertation to my parents, Chris and Berniece. They put
up with a lot from me including my willingness to play the piano only when an audience was
present; my crazy college days complete with all my wonderful (life-long) college friends; my
constant moving around the country; my many different careers; my occasional crises (personal
and professional); and my triumphs along the way. Through it all they have cheered on my
independence; loved me unconditionally; supported me without reservation; and instilled in me
the confidence and belief that I can accomplish anything. I am truly blessed and I love you both
very much.
iv
v
Table of Contents
Abstract ............................................................................................................................................ i
Acknowledgements ........................................................................................................................ iv
Table of Contents .............................................................................................................................v
List of Tables ............................................................................................................................... viii
List of Figures ..................................................................................................................................x
Chapter 1: Introduction ....................................................................................................................1
Chapter 2: Evolution of Crisis Communication Research ...............................................................3
History and Theory of Crisis Communications Research..............................................4
Role of Emotions in Crisis Communications Research ...............................................10
Chapter 3: Defining and Operationalizing Schadenfreude ............................................................14
Roots of Schadenfreude Research ...............................................................................14
Schadenfreude in Groups/Social Identity Theory ........................................................18
Schadenfreude in Crisis Communications Research ...................................................19
Operationalization of Schadenfreude ...........................................................................20
Chapter 4: Defining and Operationalizing Corporate Reputation .................................................23
Defining Reputation .....................................................................................................23
Defining Stakeholders ..................................................................................................25
Operationalization of Reputation ................................................................................27
Consistency in Disciplines ...........................................................................................30
Hypotheses/Research Question ......................................................................................................33
Chapter 5: Methods ........................................................................................................................35
Research Design...........................................................................................................35
v

vi
Sampling ......................................................................................................................35
Stimulus .......................................................................................................................36
Experimental Procedure ...............................................................................................38
Measures ......................................................................................................................38
Chapter 6: Results ..........................................................................................................................41
Reliability of Indices ....................................................................................................42
Stimulus Materials and Emotion ..................................................................................47
Emotions and Reputation .............................................................................................50
Third-Person Effect on Schadenfreude ........................................................................52
Social Identity in Crisis ................................................................................................52
Demographic Variables ...............................................................................................54
Chapter 7: Discussion ....................................................................................................................55
Framing Effect on Emotions ........................................................................................55
Emotions/Schadenfreude on Reputation ......................................................................58
Third-Person Effect on Crisis ......................................................................................62
Social Identity Theory in Crisis ...................................................................................63
Gender Differences ......................................................................................................64
Study Limitations ........................................................................................................65
Conclusions and Future Research ................................................................................66
Tables .............................................................................................................................................69
Figures............................................................................................................................................97
Appendices ...................................................................................................................................103
A. Stimulus Material .................................................................................................104
vi

vii
B. PANAS Scale .......................................................................................................107
References ....................................................................................................................................108
Curriculum Vitae .........................................................................................................................121
vii
viii
List of Tables
Table 1: Descriptive Statistics and Census Comparison
Table 2: Descriptive Statistics for PANAS Adapted Emotion Indices
Table 3: Pearson Correlation Coefficients for Anger Index
Table 4: Pearson Correlation Coefficients for Sadness Index
Table 5: Pearson Correlation Coefficients for Happiness Index
Table 6: Descriptive Statistics on Transformation of Happiness Subscale Variable
Table 7: Contribution to Cronbach’s Alpha: Item by Item Analysis of Emotion Indices
Table 8: Descriptive Statistics for Reputation Index and Subscales
Table 9: Pearson Correlation Coefficients for Attitude Subscale
Table10: Pearson Correlation Coefficients for Buying Intentions Subscale
Table 11: Descriptive Statistics on Transformation of Buying Subscale Variable
Table 12: Contribution to Cronbach’s Alpha: Item by Item Analysis of Reputation Index
Table 13: ANOVA for Framed Articles on Emotional Indices
Table 14: ANOVA for Anger-Inducing and Sadness-Inducing Articles on Emotional Indices
Table 15: ANOVA for No-Consequences and Consequences Articles on Emotional Indices
Table 16: ANOVA for Anger and Sadness-Inducing Articles on Individual Emotional Variables
Table 17: ANOVA for No Consequences and Consequences for Company on Individual
Emotional Variables
Table 18: Pearson Correlation Coefficients for Angry and Reputation
Table 19: Pearson Correlation Coefficients for Sad and Reputation
Table 20: Pearson Correlation Coefficients for Happy and Reputation
Table 21: Hierarchical Regression Results: Reputation
viii

ix
Table 22: Paired-Sample t Test for Self and Other Reports of Schadenfreude
Table 23: Pearson Correlation Coefficients for Second Schadenfreude Measure and Reputation
Table 24: Pearson Correlation Coefficients for Identify with CEO and Reputation
Table 25: Pearson Correlation Coefficients for Identify with Parents and Reputation
ix

x
List of Figures
Figure 1: Jin, Pang and Cameron’s ICM Model
Figure 2: Demographic Comparisons between Sample and 2010 Census Data
Figure 3: Third-Person effect of Schadenfreude in Crisis (Uncollapsed and Collapsed Categories)
x

1
Chapter 1: Introduction
Research in the field of crisis communication is only a couple of decades old, but a
number of variables have already been identified by scholars as influential factors in an
company’s successful navigation of a crisis – the type of crisis, the company’s role in creating
the crisis, the company’s response to the crisis, and the reputation and perception of the company
by its stakeholders prior to the crisis. The company’s stakeholders play an important role in this
process, as their respective relationships with the company and their perceptions of the
company’s reputation is often at risk during a crisis. Tim Coombs (2007) emphasized the
stakeholder role in his definition of crisis saying, “It is the perception of stakeholders that helps
to define an event as a crisis” (p. 3).
Stakeholder perceptions about the cause of the crisis (the degree to which the company
should be held responsible), the company’s response to the crisis, and the resulting reputation of
the company post-crisis have all been examined in communications literature. However, only
recently have stakeholder emotions been introduced as potential predictors of stakeholder
perceptions of reputation during and after a crisis.
The first study of emotion in this context appears to be Coombs and Holladay’s (2005)
examination of whether or not a crisis “type” would have an impact on stakeholder emotions.
They determined that when a crisis was attributable to something other than the organization or
company in question (natural disaster, sabotage, etc.), it triggered a different feeling in
stakeholder groups (sympathy) than when the organization was perceived to be at fault (anger).
The 2005 study also looked at the concept of schadenfreude, deriving pleasure from someone
else’s pain or misfortune, in this context and found that stakeholders said they would feel

2
“happy” if something bad happened to the organization if the crisis was “intentional” (i.e. if the
crisis was attributable to the organization).
Despite its initial promise of having an impact, the concept of schadenfreude cannot be
found in crisis communication research since 2005. Rather, the more recent studies on the role of
stakeholder emotions in crisis have focused on the negative feelings – anger, sadness, fear, and
anxiety – most often associated with crisis events (e.g. Coombs, 2010; Jin, Pang & Cameron,
2007; Jin & Pang, 2010; Kim & Cameron, 2011).
This study further explores the link between stakeholder emotions and effective crisis
communications by continuing the research conducted by others. It also re-introduces the
concept of schadenfreude, exploring the difference more positive emotions, such as happiness or
pleasure, may have on stakeholder perceptions of a company in crisis. In addition, it explores the
potential impact of third-person effect and social identity theory on stakeholder perceptions of a
company in a crisis situation.
The future applications of this study in practice lies in the potential for practitioners to
better understand how the emotions of stakeholders will impact perceptions of their respective
company’s reputation during an organizational crisis. While there is still considerable work to be
done before this is possible, once researchers identify how stakeholder emotions impact
immediate perceptions of reputation, as well as how the same emotions effect the efficacy of
specific company responses in a crisis situation, practitioners may be more confident in their
decisions to communicate with stakeholder groups during crises and be better prepared to
implement company responses to protect the long-term reputations of their organizations.

3
Chapter 2: Evolution of Crisis Communications Research
While the term “crisis” can be defined in a number of ways, there are relevant concepts
included in most definitions used by crisis communications researchers including the
unexpectedness of the event and the ability of the event to pose a credible threat to the
organization. (Coombs, 2007; Coombs & Holladay, 2010; Fearn-Banks, 2006). For the purposes
of this study, the following working definition from Ulmer, Sellnow and Seeger (2011) is used:
“An organizational crisis is a specific, unexpected, and nonroutine event or series of events that
create high levels of uncertainty and simultaneously present an organization with both
opportunities for and threats to its high-priority goals” (p. 7). Likewise the definition of “crisis
communications” used in this study is as follows: “Crisis communications is concerned with the
transferring of information to significant persons (publics) to either help avoid or prevent a crisis
(or negative occurrence), recover from a crisis, and maintain or enhance reputation” (Fearn-
Banks, 2009, p. 2).
The potential impact a crisis can have on a company is enormous, as evidenced
throughout history with events such as the sinking of the Titanic, which caused such damage to
the reputation of its cruise line, the White Star, that it never fully recovered (Butler, 2003;
Ziakas, 1999). The recent proliferation of massive crises involving corporations including BP,
Toyota, and Goldman Sachs (Holmes & Sudhaman, 2011), has generated an unprecedented
amount of media coverage and interest. Yet, in their meta-analysis of public relations literature
from 1997-2006, An and Chen (2010) suggest that as late as the mid-1990s, there had been very
little research focused on crisis communications with nothing at all prior to 1987. Consequently,
while crisis communications is a relatively new field of study, it is a rapidly growing area of
interest for both crisis communicators and academic researchers.
4
History and Theory of Crisis Communications Research
There are several theories and concepts that have shaped the field of crisis
communications including apologia, image restoration theory, attribution theory, excellence
theory, contingency theory, situational crisis communications theory, framing theory, and third-
person effect.
Apologia.
Apologia is rooted in interpersonal communications as a rhetorical communication tool
for defending oneself from a personal attack. Dionisopoulos and Vibbert (1988) were the first to
introduce this at the organizational level in which corporate apologia is defined as the
organizations’ efforts to defend itself from an attack. In 1995, Hearit took this a step further,
applying case study methodology from the public relations practitioners’ point of view to the
concept of corporate apologia. He used the Exxon and Dominos cases to explore not only how
the companies defended themselves, but how individuals managed to separate themselves from
the wrongdoing (Hearit, 1995). Hearit then took this information and tried to use it to teach other
practitioners, but the use of case studies limited his work as it didn’t provide practitioners with
the information necessary to generalize the findings to other situations.
Allen and Caillouet (1994) also studied corporate apologia using content analysis and
discovered that institutional players (specifically the government) could have a major impact on
strategic communications during a crisis. They also introduced the use of ingratiation as a tool in
crisis communication (probably more commonly referred to as “schmoozing”) where individuals
don’t just defend their actions, but strive to have stakeholders “like” them.
Image restoration theory.

5
Benoit (1997) introduced image restoration theory (IRT), which posits that maintaining
or rebuilding a company’s reputation after a crisis is the primary goal of communications. In his
view, there is a reputational threat in the crisis communications arena if 1) there has been a crisis
event and 2) the stakeholders hold the organization responsible. He proposed a series of
formalized corporate response strategies that could be used to protect or rebuild a reputation post
crisis. They are as follows (p. 177):
Denial
o Simple – “We didn’t do it.”
o Shifting the Blame – “Somebody else did it.”
Evading Responsibility
o Provoked – “They made us do it by doing something to us.”
o Defeasibility – “We were unable to stop it.”
o Good Intentions – “We were trying to do something good and this happened
as a byproduct of our actions.”
Reducing the Offense
o Minimizing – “This isn’t a big issue.”
o Differentiating –“This isn’t bad compared to what others have done.”
o Bolstering – “We did something bad, but look at all the good things we have
done.”
o Transference – “We did it, but in the big scheme of things it’s not important.”
o Attack Accuser – “We did it, but what they did was so much worse.”
o Compensation – “We did it, but we are making it right with the victims.”
Corrective Action – “We have taken steps so that this never happens again.”

6
Mortification – “We did it, we accept full responsibility and we are sorry.”
IRT offer solutions, but is limited in its ability to offer the means by which a crisis
situation should be analyzed. Practitioners do use it in practice, often implementing these
responses through a trial and error method (trying the easiest or most time-efficient one first for
practical purposes, reaching for another response only if the first doesn’t work).
Attribution theory.
Another theory often adapted in crisis communications research is attribution theory,
which is deeply rooted in psychology (Heider, 1958). This theory posits that the cause of an
event has an influence on how people respond to the event. In the case of crisis communications,
this means that the cause of a crisis will determine how stakeholders respond to the crisis.
Weiner (1985) was the first to look at this in the context of crisis communications, examining the
three main elements used to determine attribution: stability (whether the event was caused by
something that remained consistent or was unusual), control (whether the event was controllable
or not), and locus of control (whether the event was caused by something external or internal). In
1998, Hartel, McColl-Kennedy and McDonald brought this to another level, looking at both the
cognitive and affective elements of attribution and determining that, as it applied to consumer
behavior (buying intentions), both of these were very important.
Excellence.
James Grunig’s (1992) theory of excellence is probably the most recognized theory in the
field of public relations and is based on interviews conducted by Grunig and his colleagues with
both practitioners and organizational leaders. The purpose of the study was to paint a picture of
what “excellent” public relations really looked like. They found that the ideal form of public
relations is a “two-way symmetrical” model in which an organization maintains a two-way

7
dialogue with stakeholders in an effort to achieve “mutually beneficial” outcomes for both the
organization and its publics. Larissa Grunig (1992) has done additional work with the theory,
specifically in the crisis communications field as it relates to dealing with advocacy groups and
balancing the needs of them against the organization.
Fearn-Banks (2006) is also a big proponent of excellence theory, saying good public
relations is equivalent to good crisis communications. She explores crisis communication
through case studies and evaluates the communications in an effort to then take the “best
practices” and provide that information to other practitioners under the assumption that those
practices can be transferred to other situations.
Contingency theory.
In opposition to excellence theory, Cancel, Cameron, Sallot and Mitrook (1997)
introduced contingency theory which suggests that Grunig’s theory (1992) may not the best
approach for all situations. Rather, they suggest that public relations activities run on a
continuum from complete advocacy for the client to complete accommodation of the stakeholder
needs. When to use which? It depends. According to contingency theory, there are five
components (which include a total of 86 variables) that must be evaluated for every situation
before determining where on the continuum the public relations focus should be (advocacy vs.
accommodation). The five areas are external threats, and characteristics of the publics, the
organization, the public relations department, and the dominant coalition (Cancel et al., 1997).
Situational crisis communication theory.
Timothy Coombs is recognized for the development of situational crisis communications
theory (2007) or SCCT, the first theory created specifically for use in the study of crisis
communications. SCCT posits that characteristics of the situation influence the attribution

8
(blame for the situation) people assign to the company or organization and that the attribution, in
turn, influences people’s reputational perceptions, affects, and behavioral intentions toward the
organization. Only then, by knowing these things, can practitioners apply the appropriate
response strategy (deny, diminish, rebuild, or use bolstering as a secondary response) to best
manage the reputational threat to the company.
Coombs (2007) says the situational characteristics that can be evaluated to determine the
reputational threat are:
1. Attribution – Whether the organization is to blame depends on three crisis types. Was the
organization a “victim” of an external event outside their control (natural disaster,
terrorism)? Was the event an “accident” in which the company could not have predicted
the crisis such as a technical glitch that they were unaware of? Or, was the event
something that was either done intentionally (corporate malfeasance) or could have been
prevented (ignoring safety warnings)?
2. Crisis History – Is this something new for the organization or does it have a history of
similar events? For example, have they been cited for years about faulty wiring, which
has now caused a fire?
3. Prior Reputational Relationships – Did the organization have good relationships with its
stakeholder prior to the crisis that will help them navigate through the crisis?
Most of the research in recent years has built on SCCT and its components of crisis
attribution and organizational response as determinants of stakeholder reputation after a crisis.
Framing theory.
Framing theory suggests that the “frame” or lens through which information is presented
can have an effect on the audience. Entman (1993) said that, “To frame is to select some aspects

9
of a perceived reality and make them more salient in a communicating text, in such a way as to
promote a particular problem definition, causal interpretation, moral evaluation, and/or treatment
recommendation for the item described” (p. 52). One of the examples he uses is the “cold war”
frame in which all stories at the time offered moral judgments through a frame that favored
capitalistic over communist beliefs and ideals. Likewise, in a corporate crisis involving a labor
dispute, the articles written by “pro-union” writers are often framed very differently than those
who write with a “pro-management” background. Readers, in turn, are affected by those frames
as they form opinions about the company involved in the crisis.
Third-person effect.
Davison (1983) first introduced the concept of a third-person effect, saying people
believe that communication messages have a greater impact on “others” than they do on
themselves. In other words, when a message is delivered via a communication medium, people
do not think the message will have as much influence on their own perceptions as they believe it
will influence other people’s perceptions. He also said, ironically enough, that because we
believe the information will have an influence on others, we often change our own behavior in
response to the influence we believe the message has on others. For example, we may decide to
buy or sell stock based, not on the messages we receive about the company, but on how we
believe others will perceive and react to the same information (Davison, 1983).
Perloff (1993) outlined some of the contributing factors that impact third-person effect in
his review of the first decade of literature on the subject, saying that the perceived differences in
impact to “self” and “other” depend on whether the message is good or bad; whether the “self”
deems the topic to be important; if the “self” believes the source to be credible; if “other” is of a
lower socioeconomic status; or if the “other” is not known to the “self.” Others have highlighted
10
additional situational parameters such as whether the information is viewed as positive or
negative, if the “other” is perceived as more distant, or if the information is presented at a faster
pace (Chock, Fox, Angelini, Lee & Lang, 2007; Duck & Mullin, 2006).
Third-person effect has been measured in a variety of communication arenas from health
communications (Chock, et. al, 2007; Scherr & Reinemann, 2011; Shin & Kim, 2011) to
interpersonal relationships (Chia & Wen, 2010; Chock, 2011; Lo & Wei, 2002). Recently, Kim,
Kim and Cameron (2011) were some of the first to examine the potential role third-person effect
might have on corporate crisis communications. They found that, in crisis situations, people tend
to perceive that members of other stakeholder groups will be more affected by the crisis than
themselves. However, as is true in much of the crisis communication literature, these perceptions
are often tied to the attribution of the crisis in that there were bigger differences between
perception of “self” and “other” in situations with an internal locus of control than one with an
external locus of control. This implies an opportunity for practitioners to be aware of the third-
person effect in crisis situations and to respond accordingly, but exactly what the response
should be is yet to be determined.
Role of Emotions in Crisis Communications Research
As noted earlier, the evolution of crisis communications research has introduced a
number of potential variables that impact, or have the potential to impact, the effectiveness of
crisis communications including how stakeholders attribute blame for the crisis, the company’s
crisis history and prior reputation, and how the company responds to the crisis. More recently,
the emotions experienced by the stakeholders before, during, and after a crisis have been
considered as a contributing factor to the effectiveness of crisis communications (e.g. Choi &

11
Lin, 2009; Coombs & Holladay, 2005; Jin, 2010; Jin, Liu & Austin, 2011; Jin, Pang & Cameron,
2007; Kim & Kiousis, 2012; Liu, Austin & Jin, 2011; Moon & Rhee, 2012).
Coombs and Holladay first introduced the potential importance of emotions to crisis
communications literature in 2005. They examined the amount of sympathy, anger, and
schadenfreude (pleasure) individuals expressed when they were presented with a variety of
crisis types and causes. They found significantly strong relationships between “crisis
responsibility” and all three emotions studied. They noted, “This exploratory study is the first
step toward integrating affect into the study of post-crisis communication. More research is
needed to understand how affect impacts the effectiveness of various response strategies” (p.
277). Additional research has been done since that time, but none of it has included the concept
of schadenfreude, one of the emotions Coombs and Holladay (2005) found to be “most salient”
(p. 276).
More recently, others have acknowledged the role emotions should play in crisis
communications research and application. Jin and Pang (2010) stated that,
despite the importance of affect in persuasion and strategic decision making in crisis
communication, there remains a lack of a systematic and integrated approach to
understanding how publics’ emotional experience in crisis influence their crisis
information processing and behavioral tendencies, which will eventually determine the
success or failure of any organization’s crisis communication practice. (p. 677)
They also suggested the use of the “integrated crisis mapping model (ICM),” which was
introduced by Jin, Pang and Cameron (2007) as an aid for future research (see Figure 1). This
model is an “… emotion-driven perspective to crisis communication modeling, mapping

12
different crisis types and underpinning them with two continua, the organization’s involvement
with the crisis issue and primary public’s coping strategy” (p. 81).
Other emotion-focused crisis studies include Jin’s (2010) work with how stakeholder
appraisals of a crisis effect their emotions, coping strategies, and responses to crisis and Choi and
Lin’s (2009) look at which emotions were evoked by stakeholders after a recall by toy-maker,
Mattel. Jin, Liu, an Austin (2011) explored which emotions might be triggered by exposure to
crisis information and whether the information form, source or origin was influential. Finally,
Moon and Rhee (2012) touched on emotions in crisis as they studied the effect of crisis
attribution and corporate responses on stakeholders’ willingness to forgive an organization post-
crisis.
The only study that was found to incorporate framing theory and the framing of the crisis
information was Kim and Cameron’s (2011) look at the emotional framing of news articles
related to corporate crisis. This is based largely on the work of Robin Nabi (2003), who found
that emotions can serve as the frames we use for decision making. Her examination of how
people responded to information about drunk driving and gun control, determined by the framing
of the articles they read, was seminal in this area of study. She found that people’s affect has an
influence on information accessibility, information seeking behaviors, and policy decisions. In
this case, she was looking at fear and anger and the differences in behaviors.
Kim and Cameron (2011) focused on the importance of these frames on audience
perceptions in a crisis situation. The results of their study indicated that the emotions elicited by
different news frames had an impact on the subjects’ processing of the information and on their
subsequent responses to the company’s crisis response strategies. Specifically, “… those exposed
to anger-inducing news tended to have more negative attitudes toward the responsible company

13
(M = 2.03, SD = 1.00) than those exposed to sadness-inducing news (M = 2.36, SD = 1.13), even
though the contents regarding the crisis situation were identical between the two groups …”
(Kim & Cameron, 2011, p. 842).
Since 2005, all of the studies involving emotions in crisis communications have dealt
with the perceived or potential negative emotions stakeholders have during a company’s crisis
(e.g. sadness, fright, anger, anxiety, apprehension, disgust, contempt, embarrassment, guilt,
shame, alert, worry, confusion, and sympathy). This despite the fact that, according to Coombs
and Holladay (2005), schadenfreude or “taking joy from the pain of the organization” (p. 265)
was one of the three “most salient emotions from Application Theory for application to post-
crisis communiations” (p. 276). This study re-introduces the concept of shadenfreude to the
study of crisis communications and it’s potential impact on stakeholder perceptions.
14
Chapter 3: Defining and Operationalizing Schadenfreude
Schadenfreude is the feeling of pleasure one sometimes experiences when another person
or an organization suffers a misfortune or setback. Most commonly cited in interpersonal
literature when one person takes pleasure at the pain or misfortune of another, schadenfreude
also appears in sociology when one group enjoys the failure of another group (e.g. sports fans
from one team love to see a rival team fail, even when their own team won’t benefit from the
loss). And, while it has not been the subject of much academic research, anecdotal evidence
suggests that schadenfreude exists in the area of crisis communications as members of an
organization’s stakeholder group often appear to take pleasure at seeing the company or its
leaders suffer in the aftermath of a crisis, especially if the stakeholders hold the company
accountable.
For example, schadenfreude was expressed in an online comment posted by a reader in
response to the BP oil spill that read, “We would actually enjoy seeing their stock holders [sic]
lose their shirts...because stock holders [sic] have abandoned their ownership responsibilities, in
favor of making money.” (Condon, 2010). Or, in a recent Facebook post about the Tennessee
Valley Authority having financial problems one customer commented, “Good. I'm glad they are
losing money. Maybe they shouldn't charge all the fuel cost adjustments so they can have more
money in their greedy hands” (WRCB, 2012).
Roots of Schadenfreude Research
To say that schadenfreude is a recently-discovered emotion would be incorrect. In fact, at
one point Plato quoted Socrates as saying, “Did we not say that pleasure in the misfortunes of
friends was caused by envy?” (Smith, Powell, Combs, & Schurtz, 2009, p. 158). Yet,
schadenfreude doesn’t appear to have been explored in depth until 1989 when a psychology

15
professor from Australia, N.T. Feather, published a series of three studies designed to look at
attitudes toward “tall poppies” or those who have achieved at a high level to rise above others
(overachievers), and feelings of either sympathy or pleasure experienced by others when the tall
poppies fell.
Feather (1989) found that subjects were likely to be more pleased when the “tall poppies”
fell than when people of average achievement failed, yet he noted that there were a number of
mediating variables, such as the reason for the fall (self-inflicted or a result of the environment)
and perceptions about how the “tall poppy” reached a level of high achievement (through hard
work or luck). In other words, people asked the question, “Did they deserve it?”
Many scholars since Feather have linked the concept or emotion of schadenfreude with
another emotion that has been around for a very long time – envy (Hareli & Weiner, 2002; Smith
et al., 1996). Envy is the “painful or resentful awareness of an advantage enjoyed by another,
joined with a desire to possess the same advantage” (Envy, 2012). Research shows that envy and
schadenfreude act as antonyms – one unpleasant and one pleasant. According to Smith et al.
(1996), “Although envy is painful and Schadenfreude is pleasurable, we hypothesize that envy
creates the conditions under which Schadenfreude should occur – if a misfortune befalls the
envied person” (p. 158). These studies assume that the individual experiencing schadenfreude
believes the envied party to be undeserving of the advantages for which they are envied and,
therefore, the feelings of schadenfreude are justified. The envious party sees themselves as
equally deserving and feels justified in wanting “justification of lots” (Heider, 1958) or, in
essence, coveting the advantage for them. Heider goes on to say that schadenfreude isn’t just
pleasurable, it is malicious. His argument is that schadenfreude is a “discordant” reaction to

16
sympathy and that it builds antagonism between parties and can be harmful to individual
relationships.
In their 2009 article, Smith, Power, Combs and Schutz reviewed the literature and
identified three conditions under which schadenfreude occurs: as a result of personal gain, as a
result of deserved misfortunes, and as a result of envy.
The “personal gains” condition assumes that the suffering/loss to one group or individual
means an advantage/win for another group or individual (Smith et al., 2009). The argument here
is that if an individual or group will benefit from another’s loss, the group that benefits is happy.
In this case, there is little malice against the suffering “other.” Rather, the focus is on the benefits
to “self.”
The second condition, schadenfreude resulting from deserved misfortunes, offers a new
perspective because it does not require prior feelings of perceived benefit to self or feelings of
envy. Rather, the feelings of schadenfreude are “righteous satisfaction” (p. 537). In this case, the
“fallen” is often perceived to be hypocritical such as the company that promotes itself to be the
“environmentally-friendly” alternative and is then fined for egregious pollution or the TV
evangelist who preaches against extra-marital affairs and is then caught engaged in an
inappropriate relationship. This comes full-circle back to Feather’s (1989) discussion on
deservedness in which he says the “valence of the outcome fits with or is consistent with the
valence of the action that led to it” (p. 40).
Finally, Smith, et al.’s (2009) last condition, schadenfreude as a result of envy, reiterates
the findings of previous scholars, but notes a unique relationship between the concepts of envy
and self-benefit, noting that “ a misfortune befalling the envied person is likely to lead to
competitive gain as well as the relief from the unpleasant emotion of envy itself” (p. 540).

17
Hareli and Weiner (2002) furthered this research, noting that envy is only one negative
emotion that might elicit feelings of schadenfreude. They posit that other negative emotions
toward an individual or group may also serve as antecedents for schadenfreude including
“hatred, anger, dislike, contempt, and disgust” (p. 258). Their results indicate that, not only are
these “other-directed negative emotions” strong indicators of schadenfreude at the misfortune of
another individual or group, but that they may have a stronger relationship with schadenfreude
than envy. These findings also suggest a great reason to look at schadenfreude in the context of
corporate crisis communication because, while an individual or stakeholder group may not
“envy” an organization, there could very well be other negative feelings toward a company or
organization that may precipitate feelings of schadenfreude during a crisis and should be taken
into account.
More recently, Wilco van Dijk and his colleagues (van Dijk, Ouwerkerk, van
Koningsbruggen, & Wesseling, 2012; van Dijk, Ouwerkerk, Wesseling, & van Koningsbruggen,
2011; van Dijk, van Koningsbruggen, Ouwerkerk, & Wesseling, 2011) have focused on other
reasons why some individuals experience schadenfreude instead of sympathy when someone else
suffers or fails. Their studies focus on relationships between self-esteem and self-affirmation
with schadenfreude, even in situations where the effect is based on watching someone fail on
television. The model they present indicates that there is a negative relationship between self-
esteem and feelings of schadenfreude, but that the relationship exists only when there is an
opportunity for increased self-affirmation (van Dijk et al., 2011). In addition, they found that
feelings of schadenfreude were intensified if there was a prior perception of self-threat to the
observer by the “high achiever” that fell (p. 1445). Specifically, van Dijk et al. (2012) found that

18
people who reported lower self-evaluations were more pleased than others when contestants in
the early rounds of TV’s American Idol did poorly and were ridiculed by the judges.
One of the first studies to explore schadenfreude and its impact on relationships between
groups of people, rather than individuals, was published in 2003 by Leach, Spears, Branscombe,
and Doosje. The study examined the feelings of schadenfreude experienced by sports fans of one
country’s football (soccer) team when another country’s team suffered a big loss. In this study,
they borrowed from the German philosopher Frederick Nietzche (1887/1967), who contrasted
the passive observation of watching someone suffer at the hands of a third party to watching
someone suffer at your own hands through the normal course of competition.
Schadenfreude in Groups/Social Identity Theory
The study of schadenfreude in group settings can be tied closely to social identity theory,
which recognizes the human tendency to search for people who are like themselves and a need
for self and group esteem that motivates people to evaluate their own group (the in-group) more
favorable than they do other groups (the out-group). (Tajfel, 1974; Cuhadar & Dayton, 2011).
In their study if group behavior, Leach, et al. (2003) proposed three factors that would
impact feelings of schadenfreude between groups. The factors described include: “domain of
interest” or the need for the in-group to share an interest with the out-group relevant to the
observed suffering; “threat of inferiority” or the need for the in-group to perceive themselves as
superior and the suffering of the out-group to have the ability to change their own status; and
“legitimate circumstances” or the need for the out-group’s advantages to be perceived by the in-
group as undeserved. They found that “domain of interest” was the most important factor and
concluded that “intergroup schadenfreude may constitute a covert or insidious form of prejudice
that is used in the maintenance of group identity and self-worth” (p. 942). Leach and Spears

19
(2008, 2009) went on to look at the role of in-group dejection or pain in feelings of
schadenfreude toward an out-group. Their findings indicate that the feeling stems from inferior
feelings about the in-group (similar to the work van Dijk, et al., 2012, did with individuals)
rather than feelings of hatred or dislike of the out-group (envy).
Cikara and Fiske (2012) have added to the research in this area, relating schadenfreude to
social identity theory with their look at the role stereotypes play in the process. They base this on
the perceptions an in-group may have toward an out-group (are they warm, competitive, friendly,
etc.) and how these perceptions, in turn, might affect the potential for schadenfreude at the
sudden misfortune of the out-group. Their results, which are applicable to crisis communicators,
indicate that “perceived status and competition can determine when and which targets are most
likely to evoke schadenfreude” (p. 70).
Finally, Sundie, Ward, Beal, Chin and Geiger-Oneto (2009) explored the concept of
schadenfreude in scenarios where a company’s product fails. Their hypothesized model
illustrates the antecedent conditions often considered to be important in the study of
schadenfreude: an advantaged or high performing target (a “tall poppy”), feelings of envy, and
feelings of hostility.
This also has the potential to be applicable for practitioners as product failure is, in fact,
one of the many crises a company can face. While Sundie, et al. (2009) were not studying the
concept from the viewpoint of a crisis communicator, their results indicate that schadenfreude
could have an impact, not only on stakeholder feelings, but on stakeholder’s perception of an
company and its products or services.
Schadenfreude in Crisis Communications Research
Again, the determination of how likely it is that a stakeholder group feels schadenfreude

20
when something negative happens to an organization would appear to be very applicable to the
practice of crisis communications. After all, numerous crisis communications studies are
steeped in the tradition of attribution theory (Allen and Caillouet, 1994; Benoit, 1997; Coombs,
2007, 2010; Dean, 2004; Hartel, McColl-Kennedy, & McDonald, 1998), a theory of motivation
and emotion that suggests the cause of an event has a key influence on an individual’s
perception of and reaction to a given event (Weiner, 1985).
As noted earlier, Coombs and Holladay introduced the potential importance of emotions
to crisis communications literature in 2005 with a study that incorporated the concept of
schadenfreude. They examined the amount of sympathy, anger, and schadenfreude individuals
expressed by individuals who were presented with a variety of crisis types and causes and found
that there were significantly strong relationships between “crisis responsibility” and all three
emotions.
Operationalization of Schadenfreude
Before additional efforts are made to measure the potential impact of schadenfreude in
crisis communications research, there should be some consistency in how the emotion is
measured. To date, schadenfreude has been operationalized in a number of ways, almost all of
which involve the subjects self-reporting their own feelings of pleasure after some stimulus in
which a high achiever experiences some level of suffering or failure.
In Feather’s seminal work on schadenfreude (1989), he used a four-variable measure to
describe subjects’ perceptions “after the fall.” The first variable, “deserve to fall,” was
measured on a seven-point scale from “John (Anne) didn’t deserve what he (she) got” to “John
(Anne) got what he (she) deserved.” There were similar measures for the other three variables:
the respondents’ satisfaction with the fall, the subjects’ perception of the stimulus person’s
21
satisfaction with the fall, and whether or not the respondents felt more or less friendly toward
the stimulus person after the fall. (p. 246-47).
Smith et al. (1996) added six items designed to measure schadenfreude and six items
designed to measure sympathy to an existing mood scale, which assumed that respondents
would feel one or the other, but not both. Some of the added items include: “schadenfreude –
‘happy because of how things have turned out for the student, especially since the interview’
and ‘delighted because of how things have turned out for the student since the interview’;
sympathy – ‘sad because of how things have turned out for the student since the interview’ and
‘sorry for the student because of what has happened to him since the interview’” (p. 162).
Van Dijk et al. (2011 & 2012) used a five-item assessment in which the subject chose a
one of the following statements (personalized by study) in their study on response to American
Idol contestants: “‘I enjoy what happened to Eliza,’ ‘I’m satisfied with what happened to Eliza,’
‘I couldn’t resist a little smile,’ ‘I actually had to laugh a little bit,’ and ‘I felt schadenfreude.’”
(p. 171).
Two of the reviewed scales, Hareli and Weiner’s (2002) and Sundie et al.’s (2009),
measured combinations of terms designed to indirectly measure schadenfreude. Sundie et al.
(2009) used a four-item scale that measured the related emotions of “happy, joyful, satisfied,
and glad” on a nine-point scale from “not at all” to “extremely” (p. 360), while Hareli and
Weiner (2002) used a combined measure of “joy, pleasure, happiness, and content” (p. 261).
In Cikara and Fiske (2012), the measurement was unique in that it assessed subjects’
response to a combined photo and caption as opposed to a full-text scenario. In this case, after
seeing the photo and the caption describing the pictured individual, subjects were asked to
answer two questions: “How GOOD [BAD] would each make your feel?” and “As viewed by
22
society, how COMPETENT/WARM is this person?”
And, Takahashi, et al. (2009) measured schadenfreude physiologically, examining the
neurocognitive mechanisms of both schadenfreude and envy with magnetic resonance imaging
(MRI). As subjects were presented with scenarios, they self-reported feelings of envy and
schadenfreude on six-point scales (1 = no envy, 6 = extremely envious and 1 = no pleasure, 6 =
extremely pleasant) while undergoing an MRI. The results showed “a correlation between the
mean rating of schadenfreude” (p. 938) and the degree of activation found in the ventral
striatum, part of the brain associated with pleasure.
In their seminal crisis communications-related study on schadenfreude, Coombs and
Holladay (2005) used an eight-item, seven point scale to measure “sympathy, anger,
schadenfreude, and crisis responsibility” (p. 272). The one item they designed to measure
schadenfreude was “I actually feel a little happy that something bad happened to x, the company
deserves it.” An adaptation of this question is used for this study. In addition, an adaptation of
the index used to measure “joviality” on the Positive and Negative Affect Scale (PANAS)
(Watson, Clark, & Tellegen, 1988) is used in an attempt to further develop a reliable
measurement of schadenfreude in the context of crisis communications. “Joviality” is measured
using a combination of terms, much like those use in previous studies (Hareli & Weiner, 2002;
Sundie et al., 2009), which include happy, joyful, delighted, cheerful, excited, enthusiastic,
lively, and energetic.

23
Chapter 4: Defining and Operationalizing Corporate Reputation
Corporate reputation -- every company is reported to have one, companies devote vast
resources to protect them, researchers study the effects on them, and crisis managers work
diligently to rebuild them. But what is corporate reputation? Who determines what a
corporation’s reputation is in the marketplace? What elements do people measure to determine
whether a corporation’s reputation is either positive or negative and is there a comprehensive
definition that remains constant across situations and disciplines?
Defining Reputation
These questions are not new. In the inaugural issue of Corporate Reputation Review,
Fombrun and Van Riel (1997) called for an inter-disciplinary approach to corporate reputation
research and a comprehensive definition. At that time, they proposed Fombrun’s 1996 definition
of the concept which states that,
A corporate reputation is a collective representation of a firm’s past actions and results
that describe the firm’s ability to deliver valued outcomes to multiple stakeholders. It
gauges a firm’s relative standing both internally with employees and externally with its
stakeholder, in both its competitive and institutional environments (Fombrun & Van Riel,
p.10).
This definition has been used by many scholars, but has never been adopted across the
board. Today, the call for an agreed-upon, consistent definition remains unanswered. Yet, there
does seem to be an increased sense of urgency as corporate reputation has become a mainstream
concept, dominating news coverage and gaining in popularity as a topic of scholarly research.
Barnett, Jermier and Laffery (2006) point out that the number of studies focused on
corporate reputation has increased dramatically in recent years. They found that “the average

24
number of scholarly articles on corporate reputation published during the period 2001-2003 is
nearly five times as large as is the average for the period 1990-2000” (p. 27). They attribute this
increase to the numerous high-profile events that have been profiled in the press and garnished
so much attention.
Carter (2006) points out that the concept has also become more common in board rooms.
Corporate executives have become more interested in managing corporate reputation because
they have seen some companies lauded for their performance in seemingly reputation-damaging
situations while have been criticized for damaging reputations in relatively positively
circumstances. There has also been an exponential growth of citizen journalism and the ability of
key publics to broadcast their views to the masses via social media, which may have also played
a role in pushing the issue to the forefront.
Yet, even with a seemingly growing interest in the need for reputation management, there
is still no consensus on a comprehensive definition. Rather, Walker (2010) found that fewer than
half of the well-cited articles in his analysis, all of which specifically examined corporate
reputation, even attempted to define the term. Perhaps it would help to begin with the
dictionary’s definition.
“Reputation” is defined in Merriam Webster’s online dictionary (Reputation, 2010) as
the “overall quality or character as seen or judged by people in general … recognition by other
people of some characteristic or ability … or … a place in public esteem or regard … a good
name.” The focus on the terms “people” or “public” indicates that reputation is determined by a
corporation’s stakeholders as opposed to something the corporation itself dictates. The plethora
of definitions used by scholars across disciplines appears to be consistent with this point.
However, that is where much of the agreement ends.

25
Under the assumption that a corporation’s reputation is determined by its stakeholders,
the differences in the definitions of corporate reputation research appear to be in three primary
areas: which stakeholder group(s) determine a corporation’s reputation; which dimensions or
elements of a corporation’s performance should be considered in the evaluation of a reputation
and subsequent determination of whether it is positive or negative; and whether a reputation
remains consistent across disciplines and situations.
Defining Stakeholders
Whether a company’s reputation is good or bad has to be determined by somebody and,
as Mahon (2002) points out, the models used to measure corporate reputation vary significantly
as to which of a corporation’s stakeholder(s) are given this responsibility.
Miriam Webster’s online dictionary (Stakeholder, 2010) defines “stakeholder” as “one
that has a stake in an enterprise or one who is involved in or affected by a course of action.” In
the field of public relations, the “stakeholders” or “publics,” terms used interchangeably for the
purpose of this paper, are generally understood to be the groups or subgroups with the potential
to impact the corporation, either positively or negatively. In addition, these groups can be either
internal or external and, depending on a number of factors, can differ in the amount of influence
they have on the corporation at any given time or in any given situation.
This means there is a seemingly infinite number of groups or subgroups that could be
considered a public or stakeholder for any given corporation. They could include the most
obvious of groups, such as a publicly traded corporation’s institutional investors, or the most
obscure of groups, such as a small group of advocates whose agenda doesn’t appear to include
items affiliated with the corporation or its policies.

26
The challenge this poses to the development of a consistent definition of corporate
reputation is paramount. Which stakeholder(s) perceptions or beliefs should be taken into
account? Which stakeholder or combination of stakeholders determines a corporation’s
reputation?
It further complicates the issue when each of these diverse groups has its own
expectations from the company. For example, elements or dimensions of a corporation’s
performance that may improve its reputation with one or more of the stakeholders (such as high
profit margins with shareholders) may actually hurt its reputation with other stakeholders
(consumers). After all, shareholders expect a return on their investment while customers expect a
good product or service at a fair price. Whose expectations should be met in order to have a
“good” corporate reputation? The answer isn’t simple, as the research indicates.
Fombrun (1996) in Fombrun and Gardberg (2000) takes an inclusive approach to this
dilemma stating that, “by ‘reputation’ I mean the net perceptions of a company's ability to meet
the expectations of all its stakeholders.” This inclusion of all potential stakeholders in the
definition is ambitious if taken literally. Chun (2005) took a more conservative approach,
suggesting that corporate reputation should be seen as a “summary view of the perceptions held
by all relevant stakeholders of an organization” (p. 105). Of course, that begs the question as to
who is relevant and whether that answer remains consistent over time.
The well-respected Fortune magazine’s “Most Admired Corporations” ranking limits
their stakeholder list to only senior executives, outside directors, and financial analysts (Mahon,
2002). While some may argue that this list of group of stakeholders is too exclusive to get a true
measure of corporate reputation, it is specific and consistent from year to year.
27
Others seem to focus on a single stakeholder without being specific. This suggests that a
corporation could have numerous and potentially divergent, reputations at any given time,
depending on which stakeholder’s perception they are consulting or measuring. For example,
Wartick (1992) defines corporate reputation as “the aggregation of a single stakeholder’s
perception of how well organizational responses are meeting the demands and expectations of
many corporate stakeholders” (p. 34). Which stakeholder? Likewise, after a comprehensive
review of several definitions, Gotsi and Wilson (2001) suggested that corporate reputation is “a
stakeholder’s overall evaluation of a company over time” and the evaluation should be “based on
the stakeholder’s direct experiences with the company” (p. 25).
In practice, the Reputation Institute, a well-respected private research firm affiliated with
the peer-reviewed, scholarly journal, Corporate Reputation Review, publishes annual reputation
measurements for the largest companies in the United States (Reputation Institute, 2010). Again,
their evaluations are based on a single stakeholder – the respective corporations’ consumers.
Operationalization of Reputation
In order to fully define corporate reputation, it’s not enough to know how many or which
stakeholders are included in the evaluation. It’s also important to know what factors might shape
their decision – a corporation’s financial performance, the treatment of employees, level of social
responsibility, customer satisfaction results, or something else? Is it a combination of elements
and, if so, which ones?
Scholars and practitioners across disciplines are currently using a multitude of models,
each with their own combination of “key” dimensions, to evaluate corporate reputation.
In the case of the Reputation Institute (2010), they use more than one model for different
projects. Their annual listing of corporations uses four indicators -- trust, esteem, admiration, and
28
“good feeling” -- to evaluate and rank the country’s top achievers of corporate reputation. Yet,
the proprietary tool they use with clients, RepTrak (2010), employs 23 performance values
around seven dimensions – “products and services, innovation, workplace, governance,
citizenship, leadership, and performance” (Reputation Institute, 2010, para. 4). Similarly, Walsh
and Beatty (2007) tested a corporate reputation scale with five dimensions including “customer
orientation, good employer, reliable and financially strong company, product and service quality,
and social and environmental responsibility” (p. 127).
While there are a plethora of evaluation models, some are more popular than others.
Hillenbrand and Money’s (2007) examination of the measurement tools designed to assess
corporate reputation indicated that the most common models include “variations of Fortune's
Most Admired Companies List (MAC); the Reputation Quotient (RQ); the Corporate Personality
Scale; and the Stakeholder Performance Indicator and Relationship Improvement Tool
(SPIRIT)” (Hillenbrand & Money, 2007), all of which have their own, very distinct evaluation
dimensions.
Fortune magazine’s annual ranking of the country’s most admired companies is one of
the most commonly used measurement tools (Kiousis, Popescu, & Mitrook, 2007). It includes
“innovation, financial soundness, employee talent, use of corporate assets, long-term investment
value, social responsibility, quality of management, quality of products and services”
(Hillenbrand & Money, 2007). The Fortune scorecard, however, has a number of critics. While
Fryxell and Wang (1994) recognize a “corporate reputation element” in Fortune’s evaluation,
they found that the measurements used were more of a determinant of how well a company was
reaching its financial goals. Brown and Perry (1994) claim that the “financial halo” must be
removed from the Fortune listing before it can be used in other research. Dowling (2004) notes

29
that he was unable to find any academic research that indicated that the predictors used by
Fortune would “predict an independent measure of a company’s reputation” (p. 197).
Additionally, Mahon (2002) points out that having an assessment depend so much on financial
performance negates its use as a measure of overall reputation.
The “Reputation Quotient” created by Fombrun uses his six pillars of reputation:
corporate appeal, products and services, financial performance, workplace environment, and
social responsibility (Fombrun & Gardberg, 2000). In this model, he also takes into consideration
that some of the pillars may be more important to some audiences.
Davies, Chun, Da Silva, and Roper’s (2003) Corporate Personality Scale relies on how
customers and employees, one internal and one external stakeholder group, view the “corporate
character” of an organization. Their model has seven, personality-driven dimensions:
agreeableness, enterprise, competence, chic, ruthlessness, machismo, and informality. This
connection to personal characteristics is also found in Dutton, Dukerich, and Harquail (1994) as
they employ impression management to measure people’s impressions of an organization. They
note that “a person is strongly identified with an organization … when his or her self-concept has
many of the same characteristics he or she believes define the organization as a social group” (p.
239).
MacMillan, Money, Downing, and Hillenbrand (2004) use the SPIRIT measurement
tools which start with a common set of questions that are then customized to meet the specific
needs of the businesses being measured. The first part of the two-part SPIRIT measurement tool,
the Stakeholder Performance Indicator (SPI), is designed to “demonstrate a business’
responsibility and reputation to others” (p. 28). The second part of the tool, the Relationship
Improvement Tool (RIT), then applies techniques such as regression analysis to the data from the

30
SPI to give the business information on which items are the most important “in bringing about
positive or negative outcomes.” The specific dimensions measured include “experiences
(communication, material benefits, experience of outside influences); feelings (trust and positive
emotions); and intentions (supportive behaviors such as advocacy and retention of stakeholders
towards a business)” (MacMillan, et al., 2004)
The models become even more complex when other related, yet sometimes overlapping,
concepts come into play. Coombs (2007), in a discussion of corporate reputation management
says, “most of the information stakeholders collect about organization is derived from the news
media” (p. 164). This would indicate that media coverage, either positive or negative, would
have to be considered as a dimension of corporate reputation. And, in fact, Wartick (1992)
looked at the effect of intense media coverage on changes in a corporation’s reputation and noted
some association between the two.
Once again, the numerous evaluation models being used to measure the concept suggest
there is virtually no agreement as to which dimensions should be considered in a comprehensive
definition of corporate reputation. Some of them rely heavily on financial performance, while
others don’t even include it in the measure.
Consistency in Disciplines
The final area of differences in definition of corporate reputation seems to be whether the
definition allows for consistency across disciplines. Mahon (2002) suggests that any progress
made in researching the term corporate reputation will be incremental unless scholars find a way
to collaborate across disciplines and, in Fombrun and Van Riel’s (1997) call for inter-
disciplinary cooperation, they said that corporate reputation was the “crossroads of converging
disciplines” (p.5). They aren’t alone in this assessment.

31
Chun (2005) says corporate reputation is now recognized as an independent area of study,
but is “dogged by its origins in a number of separate disciplines” (p. 91). She goes on to further
analyze Fombrun and Van Riel’s (1997) six categories of literature which outline their view of
the disciplines involved and the differences in defining corporate reputation:
accountancy - reputation seen as an intangible asset and one that can or should be given
financial worth;
economics - reputation viewed as traits or signals. Perception held of the organization by
an organization’s external stakeholders;
marketing - viewed from the customer or end-user’s perspective and concentrating on the
manner in which reputations are formed;
organizational - viewed as the sense-making experiences of employees or the perception
of the organization held by an organization’s internal stakeholders;
sociology - viewed as an aggregate assessment of a firm’s performance relative to
expectation and norms in an institutional context; and
strategy - reputation viewed as assets and mobility barriers. (Fombrun & Van Riel, 1997,
in Chun, 2005, p. 92).
. This extensive listing, however, doesn’t include all of the disciplines using the term. For
example, Carmeli (2005) applied corporate reputation to organizational studies by combining
two definitions: one with a focus on internal and the other external stakeholders. Fombrun and
Van Riel’s (1997) list does not include public relations, the discipline that is probably most often
responsible for managing a corporation’s reputation.
While the concept of corporate reputation is applicable to many disciplines, it is crucial to
the study of public relations and crisis communications as so many people believe practitioners

32
should be evaluated on how well they manage corporate reputations or how their efforts impact a
corporation’s reputation before, during and after a crisis.
The confusion surrounding a comprehensive definition is also evident in public relations
scholarship. For example, as Kiousis, et al. (2007) studied the relationships between public
relations efforts and corporate reputation using the Relationship Quotient. They noted in their
manuscript that there is a great deal of diversity in evaluation methods and, “although some
consensus exists regarding the importance of reputation as a concept, operational definitions of
how to measure it have varied” (p. 149). They also acknowledge the challenge this dilemma
poses to scholars, saying their study “highlights the need for further explication of corporate
reputation given the use of the Reputation Quotient as opposed to other indicators employed in
prior analysis” (p. 162).
Other public relations scholars have applied definitions from across disciplines in their
work. Grunig and Hunt (2000) in Yang and Grunig (2005) applied a psychology approach in
their study and defined “reputation of organizations” as “the distribution of cognitive
representations that members of a collectivity hold about an organization, representations that
may, but do not always, include evaluative components” (p.308). This illustrates the wide
variances in definitions of corporate reputation not just across disciplines, but within certain
disciplines.
For the purposes of this study, corporate reputation will be determined through a
combination of three dimensions: crisis blame attributions, attitude toward the company, and
behavioral intentions. The measurements for each of these are adapted from Kim and Cameron’s
2011 study on the effect of emotional framing in crisis communications.

33
Hypotheses/Research Question
Based on the previous work done with framing and emotions in crisis and to re-introduce
schadenfreude to the study of crisis communications, the first two categories of hypotheses for
this study are related to the framing of the traditionally studied emotions of anger and sadness
and the introduction of happiness as an emotional indication of schadenfreude.
Emotional Framing of Articles
H1a: Subjects exposed to the anger-inducing articles will be angrier than those who were
exposed to the sadness-inducing articles.
H1b: Subjects exposed to the sadness-inducing articles will be sadder than those who were
exposed to the anger-inducing article.
H1c: Subjects exposed to articles with company consequences will be happier than those
exposed to the articles with no company consequences (schadenfreude).
Effect of Emotions in Crisis Communications
H2a: The angrier a subject is, the more likely they will be to perceive the company’s reputation
as negative.
H2b: The sadder a subject is, the more likely they will be to perceive the company’s reputation
as negative.
H2c: The happier a subject is, the more likely they will be to perceive the company’s
reputation as positive.
The final two categories of hypotheses/research questions posited for this study are tied
directly to the concept of schadenfreude in crisis. The first is based on the recent study (Kim,
Kim & Cameron, 2012) that found third-person effect in crisis and the recent work into the

34
presence of schadenfreude in groups (Cikara & Fiske, 2012; Sundie, et al., 2009) that suggest a
link between social-identity and perceptions or behaviors in crisis.
Third-Person Effect
H3: Subjects will predict that other people are more likely than themselves to experience
schadenfreude if something bad happens to the company.
Social Identity Effect
R1: Is there an effect on a subjects’ perception of company reputation if the subject identifies
with either company representatives or victims in the article?

35
Chapter 5: Methods
Research Design
A 2x2 between-subjects online experiment with four conditions was conducted to test the
hypotheses and research questions. The first independent variable was the emotional frame of the
article (anger-inducing/sadness-inducing). The second independent variable is whether or not the
company faced consequences for causing the crisis (company consequences/no company
consequences). This second variable is based on the premise that company consequences will be
happiness-inducing and, thus, create a schadenfreude experience. The dependent variable was
perception of corporate reputation using three dimensions: blame attribution; attitude toward
company; and behavioral intentions.
Sampling
A total of 213 subjects were recruited, of which 173 completed the study. These subjects
were recruited through the online survey company, SurveyMonkey.
SurveyMonkey provides a “SurveyMonkey Audience” service to users, in which users
pay SurveyMonkey for respondents to their surveys. These respondents are recruited from the
30+ million people who answer SurveyMonkey surveys every month (SurveyMonkey, 2012).
They currently have approximately 1 million members as part of the program, all of whom agree
to take surveys and are rewarded for their participation with a 50 cent donation to the charity of
their choice and a chance to win $100. SurveyMonkey states that the “audience is, overall, a
diverse group of people and is reflective of the U.S. population (and of other country populations
for our international members). However, it is comprised of people who have Internet access and
have joined a program to take surveys” (SurveyMonkey, 2012). The program automatically

36
collects demographic information including age, gender, education level, income level, and
geographic location for each of the respondents.
As noted above, the sample used was not a randomly-selected subset of the population
and, therefore, the results cannot be generalized to the entire population. However, the sample is
appropriate for this study as the study is a correlational study. That is, the study is designed to
explore the relationships (co-variation) between variables within the sample and not to generalize
the results to the entire population of the United States.
Stimulus
Based on the research done by Nabi (2003) and Kim and Cameron (2011), the stimuli for
the first two conditions of the experiment were variations of an online news article about a
company crisis. One variation of the article was framed to induce anger in the subjects and the
other to induce sadness. The variations used to induce anger and sadness in the articles were
based on the criteria noted by Kim and Cameron (2011) in their study, using the same emotional
frames. These variations consist of the following: the crisis type was the type most often used in
crisis communications studies, a technical error accident (An & Cheng, 2010) and the topic was
fictitious because the level of prior reputation needed to be controlled. Also, following the lead
of Kim and Cameron (2011) and based on Nabi’s (2003) research, the facts presented in both the
anger and sadness inducing articles were the same. However, the framing of the stories differed
in that the anger-inducing article focused on the intentional wrongdoing or negligence of the
company, while the sadness-inducing article focused on the victims and their personal stories.
Both of these articles were written by an experienced journalist to better ensure that the article
was written in a more realistic, journalistic tone. (See APPENDIX A)

37
For the second two conditions, those designed to induce happiness in the subjects through
the inclusion of company consequences, the first two variations of the article were repeated with
the addition of a paragraph in each that indicated the company was facing consequences for its
wrongdoing. The additional paragraph read as follows: “***Story Update: In the weeks
following this incident, OSHA referred the Brightly case to the Department of Justice for
criminal prosecution. The DOJ charged both the company and Brightly CEO Dewayne Arnold
with willfully violating OSHA safety standards. This morning, the company was fined $147
million and Arnold was found guilty and sentenced to seven years in federal prison.”
Stimulus pretest.
The inducement of emotions in all four conditions was pretested with 25 respondents
utilizing a snowball sample of adults. While the sample size for the pretest was too small to test
for statistical significance, the results trended in a manner that indicated the stimulus materials
were successfully inducing the emotions intended.
The pretest subjects who were exposed to the anger-inducing articles reported being more
angry (M = 19.0, SD = 4.57) than those exposed to the sadness-inducing articles (M = 16.55, SD
= 6.12). Similarly, the pretest subjects who were exposed to the sadness-inducing articles
reported being more sad (M = 12.92, SD = 4.39) than those exposed to the anger-inducing
articles (M = 11.42, SD = 3.18).
The pretest results also indicated that the stimulus materials for the second condition (having the
company receive no consequences or receive negative consequences in an attempt to stimulate
happiness/schadenfreude) were going to be successful. Pretest subjects who were exposed to
articles in which there were consequences for the company reported being more happy (M =
7.21, SD = 2.29) than those exposed to the articles in which the company received no
38
consequences (M = 6.0, SD = .000). The trends in the pretest results indicated that no changes
needed to be made to the stimulus materials prior to the implementation of the full study.
Experimental Procedure
Subjects recruited by the SurveyMonkey Audience program were asked to take an online
“survey.” The first page of the survey was an informed consent that explained the study and
required that subjects indicate their voluntary willingness to participate. The survey was
designed in a manner that randomly assigned one of the four conditions (anger or sadness-
inducing article/with or without company consequences) to each subject. On the second page of
the “survey,” each subject read the article that was been randomly assigned to them. Once they
read the article, they responded to a series of questions that measured their emotions toward the
situation. Following the self-reported measurement for emotion, each subject was asked a series
of questions that measured their perception of the company’s reputation based on blame
attributions, attitude toward the company, and behavioral intentions. They were also asked
questions to ascertain any third-person effect as well as whether or not they identified with
company representatives or victims in the scenario.
Measures
Emotions.
The independent variable (emotion induced in the subject after reading one of the three
versions of the framed crisis news article) was measured using an adaptation of the Positive and
Negative Affect Scale (PANAS) (Watson & Clark, 1994; Watson, Clark, & Tellegen, 1988). The
emotions being induced were expected to be sadness, anger (designated as hostility on the
PANAS scale) and happiness/schadenfreude. Since schadenfreude is defined as happiness or
pleasure as a result of someone else’s pain or misfortune, the PANAS scale for joviality was

39
used. Subjects were asked to indicate, on a scale from 1 (very slightly or not at all) to 5
(extremely), to what extent each of the adjectives listed in a series described their emotions after
reading the article randomly assigned to them. The adjectives in the series represent the items on
the PANAS scale used to measure hostility/anger (angry, hostile, irritable, scornful, disgusted,
and loathing), sadness (sad, blue, downhearted, alone, lonely), and joviality/happiness (happy,
joyful, delighted, cheerful, excited, enthusiastic, lively, and energetic).
Third-person effect/schadenfreude.
Each subject was asked to rate, on a scale from 1 (very slightly or not at all) to 5
(extremely), the following statement adapted from Coombs and Holladay (2005) “To what
degree do YOU agree with this statement? I would be happy if something bad happened to the
company after this incident – they deserved it.” They were then asked to rate, on the same scale,
“To what degree do you believe MOST PEOPLE would be happy if something bad happened to
the company after this incident – they deserved it.”
Social identity.
At the end of the survey, each subject was asked to rate, on a scale from 1 (don’t identify
at all) to 7 (completely identify), the following statement “To what degree did you identify with
the CEO in this article?” They were then asked to rate, on the same scale, “To what degree did
you identify with the PARENTS in this article.”
Reputation.
The subjects’ perception of company reputation is a combination of three measurement
tools, designed to assess blame attribution, attitude toward the company, and behavioral
intentions.

40
Blame attributions. The degree to which the subject blames the company for the crisis, a
variable that has been linked in numerous studies to stakeholder perception of corporate
reputation (Coombs, Fediuk & Holladay, 2007; Coombs & Holladay, 2005; Kim, Kim &
Cameron, 2009), was measured using a scale adopted by Kim and Cameron (2011) from
Malhotra and Kuo (2009). Subjects were asked to what extent they think the company should be
blamed for the incident on a seven-point scale from 1 (not at all) to 7 (very much).
Attitude. The subjects’ attitude toward the company was measured using a scale adopted
by Kim and Cameron (2011) from MacKenzie and Lutz (1989). The scale consists of three items
measured on a seven-point semantic differential scale and include good-bad, favorable-
unfavorable, and pleasant-unpleasant (p. 840).
Behavioral/buying intentions. The subjects’ future behavioral intentions toward the
company were measured on the scale adopted by Lyon and Cameron (2004). Subjects were
asked to determine the likelihood of their participating in a series of three behaviors on a seven-
point, Likert-type scale. The behaviors include: I would purchase the products of this company if
I have the opportunity in the future; I would invest in this company if I have the opportunity in
the future; and I would recommend this company’s products to a friend if I have the opportunity
in the future. (p. 841).
41
Chapter 6: Results
The raw data from the survey were downloaded from the SurveyMonkey software and
imported into SPSS, a statistical software package. As shown in Table 1, of the 173 subjects that
completed this study, 51.4 percent of them were female and 48.6 percent were male. The
subjects’ age was reported by category with 14.9 percent between the ages of 18 and 29, 15.4
percent between the ages of 30 and 44, more than a third of the sample (37.1 percent) between
the ages of 45 and 60, and another third (32.6 percent) over the age of 60. Sixty percent of them
reported an annual household income of more than $50,000 while 64 percent of them held a
college degree. The subjects represented all nine U.S. geographic locations that make up the four
regions: Northeast (21.1 percent), Midwest (28 percent), South (27.5 percent) and the West (23.4
percent).
As mentioned earlier, the method utilized to recruit the sample for this study was not
random. Rather, the sample is made up of SurveyMonkey users who have agreed (self-selected)
to participate in additional surveys in exchange for having small donations made to charities of
the participant’s choosing (SurveyMonkey, 2012). Because of this, the results of the study cannot
be generalized to the population as a whole. However, in an effort to determine how close the
sample demographics were to the population, a comparison was made between the sample
demographics and the results of the 2010 U.S. Census (U.S. Census Bureau, March, 2011; May,
2011; 2012; September, 2012; 2013) as seen in Table 1 and illustrated in Figure 2.
The sample’s gender makeup appears fairly similar to the census data with 48.6 of the
sample reporting as male compared to 49.2 percent of the population.
The sample is slightly older, have a little higher annual household income, and a little
higher education than the general population. Nearly 10 percent more of the sample group was
over the age of 60 while more than 10 percent fewer of them were between the ages of 30 and 44

42
(U.S. Census Bureau, May 2011). The sample population’s annual household is come is higher
with a lower total percentage of subjects falling into the two categories under the $50,000 -
$99,999 group than the general population (39.4 vs. 49.9 percent) and a higher total percentage
of subjects falling into the two categories over the $50,000 - $99,999 group (27.1 vs. 21 percent)
(U.S. Census Bureau, Sept. 2012). And, the sample population does have a higher educational
attainment level than the general population with 89.1 percent of the sample attending college or
higher compared to only 57 percent of those in the general population with the same attainment
level (U.S. Census Bureau, Jan 2013).
The geographical distribution of the sample is slightly different than the general
population with only 27.5 percent of subjects located in the South, compared to 37.1 percent of
the general population and slightly lower representation of the sample in the Midwest (27.5
percent compared to 37.1 percent) and the Northeast (21.1 percent compared to 17.9 percent)
(U.S. Census Bureau, March 2011).
Reliability of Indices
Emotion indices.
The three emotional indices used in this study were adapted subsets of the Positive and
Negative Affect Scales (PANAS) (Watson & Clark, 1994; Watson, Clark, & Tellegen, 1988).
The subsets adapted included hostility (anger), sadness, and joviality (happiness). For the
purposes of this study, these were named the anger, sadness and happiness indices and
descriptive statistics were run for each (see Table 2).
Anger. The anger index consisted of six items (angry, disgusted, hostile, irritable,
loathing, and scornful) with a Cronbach’s alpha of .865, indicating a strong inter-correlation
between the items. The range of scores in the index was from 6 to 30 (M = 16.65) with a

43
skewness of .121 (close to zero) which indicated a relatively normal distribution of scores around
the mean, and a kurtosis of -.557 (less than zero), indicating that the distribution was flatter than
normal. In addition, a Pearson’s correlation test was run and, as seen in Table 3, showed that the
relationships between each of the variables in the anger index was significant at the p < .01 level.
Sadness. The sadness index consisted of five items (alone, blue, downhearted, lonely,
and sad) with a Cronbach’s alpha of .750, indicating a relatively strong inter-correlation between
the items. The range of scores in the index was from 5 to 21 (M = 11.17) with a skewness of .281
(relatively close to zero), which indicated a relatively normal distribution of scores around the
mean, and a kurtosis of -.700 (less than zero) which indicated that the distribution was flatter
than normal. In addition, a Pearson’s correlation test was run and, as seen in Table 4, indicated
that the relationships between each of the variables in the sadness index was significant at the p <
.01 level.
Happiness. The happiness scale consisted of eight items (cheerful, delighted, energetic,
enthusiastic, excited, happy, joyful, and lively) with a Cronbach’s alpha of .969, indicating a
very strong inter-correlation between the items. The range of scores in the index was from 8 to
38 (M = 10.48) with a skewness of 2.85 (much higher than zero), indicating that the distribution
of scores around the mean is far from normal. Rather, more than 70 percent of the scores actually
landed on the minimum score of 8, which is at the bottom of the range, denoting that there are a
number of outliers with higher scores pulling the mean in a more positive direction. In addition,
the kurtosis of distribution for the index was 7.62, indicating that the peak in the distribution was
much steeper than normal and reinforcing the fact that a large percentage scores in this
distribution fell at the bottom of the range. A Pearson’s correlation test was run and, as seen in
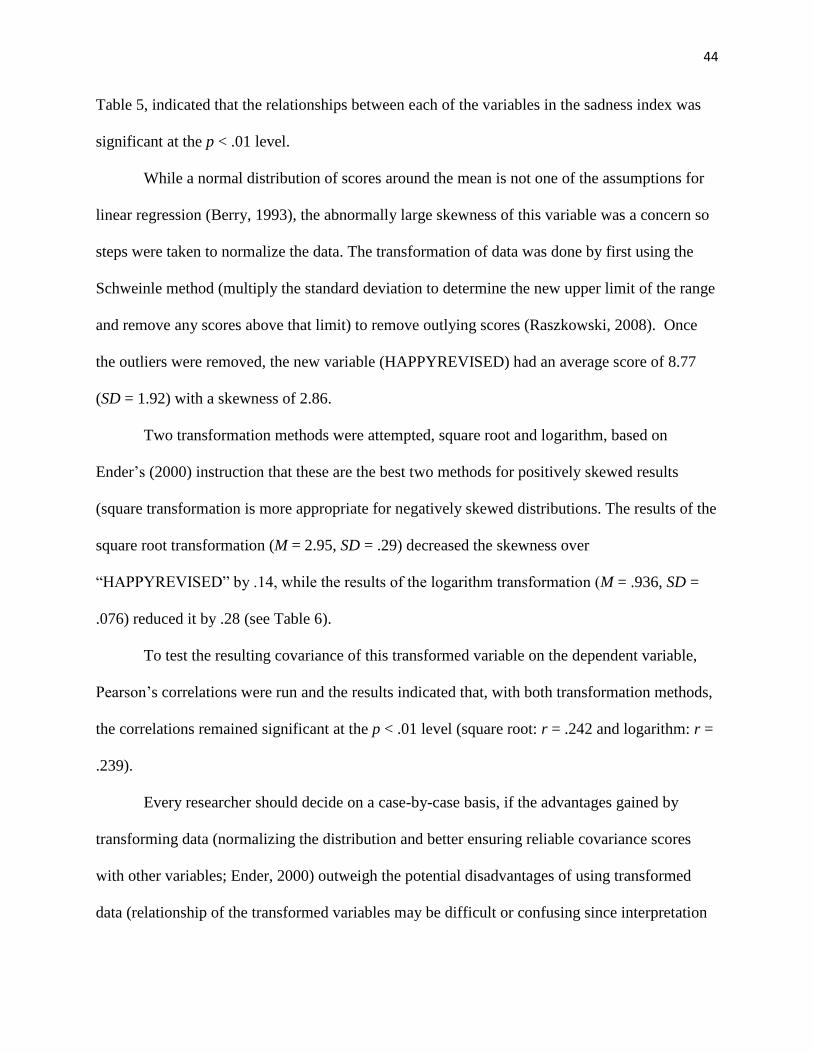
44
Table 5, indicated that the relationships between each of the variables in the sadness index was
significant at the p < .01 level.
While a normal distribution of scores around the mean is not one of the assumptions for
linear regression (Berry, 1993), the abnormally large skewness of this variable was a concern so
steps were taken to normalize the data. The transformation of data was done by first using the
Schweinle method (multiply the standard deviation to determine the new upper limit of the range
and remove any scores above that limit) to remove outlying scores (Raszkowski, 2008). Once
the outliers were removed, the new variable (HAPPYREVISED) had an average score of 8.77
(SD = 1.92) with a skewness of 2.86.
Two transformation methods were attempted, square root and logarithm, based on
Ender’s (2000) instruction that these are the best two methods for positively skewed results
(square transformation is more appropriate for negatively skewed distributions. The results of the
square root transformation (M = 2.95, SD = .29) decreased the skewness over
“HAPPYREVISED” by .14, while the results of the logarithm transformation (M = .936, SD =
.076) reduced it by .28 (see Table 6).
To test the resulting covariance of this transformed variable on the dependent variable,
Pearson’s correlations were run and the results indicated that, with both transformation methods,
the correlations remained significant at the p < .01 level (square root: r = .242 and logarithm: r =
.239).
Every researcher should decide on a case-by-case basis, if the advantages gained by
transforming data (normalizing the distribution and better ensuring reliable covariance scores
with other variables; Ender, 2000) outweigh the potential disadvantages of using transformed
data (relationship of the transformed variables may be difficult or confusing since interpretation

45
of the regression involves a transformed version of the original variable – Horn, 2008). In this
case, since the lack of variation in the variable was not significantly modified through the
transformation process, it was decided to do the analysis using the original variable. Limitations
of the study due to this abnormally distributed variable are discussed later in the “Limitations
and Future Research” section of this paper.
While the Cronbach’s alpha for each of the three emotional indices showed a strong inter-
correlation between the related variables, an additional analysis was run to see if the deletion of
one or more variables would further strengthen the measure. Results of this analysis, as shown in
Table 7, indicated that the removal of any one of the variables would, in fact, weaken its
respective index. Therefore, no variables were removed.
Reputation index.
The subjects’ perception of the dependent variable, company reputation, was a
combination of three measurement tools designed to assess the following: blame attribution (Kim
& Cameron, 2011), attitude toward the company, and behavioral intentions (Lyon & Cameron,
2004). Descriptive statistics were run for each (see Table 8).
Attribution. As the attribution portion of the reputation index consisted of only one item,
there was no analysis of the inter-correlation of items. However, the variable did have to be
reverse-coded before using it in the analysis. After the recoding, the range of responses on the
item measure from 1 to 7 with an average score of 1.95 (SD = 1.23). The responses had a
skewness of 1.345, indicating that there were more cases on the lower end of the curve, and a
kurtosis of 1.484 indicating that the curve was a little more steep than normal.
Attitude. The attitude subscale consisted of three items (bad/good, unfavorable/favorable,
and unpleasant/pleasant) with a Cronbach’s alpha of .873, indicating a strong inter-correlation

46
between the items. The range of scores in the index was from 3 to 20 (M = 6.13) with a skewness
of 1.082 (above zero), which showed that the distribution of scores around the mean was not
normally distributed, and a kurtosis of 7.638, indicating a distribution curve that was relatively
normal in relation to its peakedness. In addition, a Pearson’s correlation test was run and, as seen
in Table 9, indicated that the relationships between each of the variables in the sadness index was
significant at the p < .01 level.
Buying intention. The buying intentions subscale consisted of three items (intent to
purchase, invest, and recommend to others) with a Cronbach’s alpha of .964, indicating a very
strong inter-correlation between the items. The range of scores in the index was from 3 to 21 (M
= 4.54, SD = 3.23) with a skewness of 2.595 (much higher than zero), indicating that the
distribution of scores around the mean was not normally distributed (again, with more scores at
the bottom of the range), and a kurtosis of 7.638, indicating that the peak in the distribution is
much steeper than normal and reinforcing the fact that a large percentage scores in this
distribution fell at the bottom of the range. However, a Pearson’s correlation test was run and, as
seen in Table 10, indicated that the relationships between each of the variables in the sadness
index was significant at the p < .01 level.
Once again, while a normal distribution of scores around the mean is not one of the
assumptions for linear regression (Berry, 1993), the abnormally large skewness of this variable
was a concern so steps were taken to normalize the data. The transformation of data was done by
first using the Schweinle method (multiply the standard deviation by 2.5 to determine the new
upper limit of the range and remove any scores above that limit) to remove outlying scores
(Raszkowski, 2008). Once the outliers were removed, the new variable (BUYREVISED) had an
average score of 3.43 (SD = 1.10) with a skewness of 2.78.

47
Two transformation methods were attempted, square root and logarithm, based on
Ender’s (2000) instruction that these are the best two methods for positively skewed results
(square transformation is more appropriate for negatively skewed distributions. The results of the
square root transformation (M = 1.83, SD = .25) decreased the skewness over “BUYREVISED”
by .22, while the results of the logarithm transformation (M = .52, SD = .10) reduced it by .40
(see Table 11).
To test the resulting covariance of this transformed variable on the dependent variable,
Pearson’s correlations were run and the results indicated that, with both transformation methods,
the correlations remained significant at the p < .001 level (square root: r = .659 and logarithm: r
= .652).
Again, it was decided that the advantages gained by transforming this data did not
outweigh the potential disadvantages of using transformed data and, therefore, the original
variable was used. Limitations of the study due to this abnormally distributed variable are
discussed later in the “Limitations and Future Research” section of this paper.
While the tests for attribution/blame, attitude toward the company and behavioral
intention showed a strong inter-correlation between the related variables, an additional analysis
was run to see if the deletion of one or more variables would further strengthen the measure.
Results of this analysis (see Table 12) indicated that the removal of any one of the variables
would, in fact, weaken its respective index. Therefore, no variables were removed from the
reputation index.
Stimulus Materials and Emotion
The first three hypotheses are related to the stimulus materials and whether the framed
articles successfully stimulated the emotions expected – H1a: Subjects exposed to the anger-

48
inducing articles will be angrier than those who were exposed to the sadness-inducing articles.;
H1b: Subjects exposed to the sadness-inducing articles will be sadder than those who were
exposed to the anger-inducing articles., and H1c: Subjects exposed to articles with company
consequences will be happier than those exposed to the articles with no company consequences -
schadenfreude.
The stimulus materials were designed to induce the emotions of anger, sadness, or
happiness in the subjects. Two articles, one anger-inducing and one sadness-inducing, were
produced (Appendix A) and subjects in the first condition were exposed to the anger-producing
article while subjects in the second condition were exposed to the sadness-inducing article. For
conditions three and four, the first two conditions were replicated with the addition of company
consequences (the company was required to pay a fine for their wrongdoing and the CEO was
found criminally liable and was given a seven-year prison sentence.)
A one-way analysis of variance (ANOVA) was run with all four conditions on the three
emotional indices of anger, sadness and happiness. As seen in Table 13, the results indicate that
the four conditions did not have a significant effect on the emotional indices: main effect of the
stimuli on the anger index, F (3, 176) = 1.702, p = n.s.; main effect of the stimuli on the sadness
index, F (3, 176) = .882, p = n.s.; and the main effect of the stimuli on the happiness index, F (3,
176) = .816, p = n.s.
To further analyze the potential impact of the stimulus on the subjects’ emotion, as
defined by the emotional indices, responses from subjects exposed to the two anger-inducing
articles were combined into one group and responses from subjects exposed to the two sadness-
inducing articles were combined into another. A one-way ANOVA was run using the resulting
two groups (anger vs. sadness articles) to see if there was an effect on the three emotion indices.

49
As shown in Table 14, there was a main effect of anger-inducing or sadness-inducing article on
anger F (1,178) = .041 at the p < .05 level. However, there was still no significance found for
either sadness F (1, 178) = .016, p = n.s. or happiness F (1, 178) = .025, p = n.s. and, therefore,
while H1a was supported, H1b was not.
To assess the impact that consequences for wrongdoing would have on stakeholder
emotion, as defined by the emotional indices, responses from subjects in the two conditions
without consequences were combined into one group and responses from subjects in the two
conditions with consequences were combined into another. A one-way ANOVA was run using
the resulting two groups (no consequences vs. consequences) to see if there was an effect on the
three emotion indices. As shown in Table 15, the results indicated that there were no significant
effects on any of the three emotional indices: anger F (1,178) = .1.010, p = n.s.; sadness F (1,
178) = .371, p = n.s.; and happiness F (1, 178) = .506, p = n.s. Therefore, H1c was not
supported.
Since the only significant finding of the stimulus material on the emotional indices was
an effect of the anger-inducing vs. sadness-inducing articles on the anger index, one last look at
any additional effect of the stimulus material on emotion was explored. A one-way ANOVA on
the anger and sadness-inducing articles on each of the emotional variables, rather than the
indices, was run. As shown in Table 16, the only significant main effect of anger-inducing vs.
sadness-inducing articles on these individual emotional variables were on “angry” F (1, 178) =
6.111, p < .05 and “disgusted” F (1, 178) = 4.560, p < .05, both of which are variables in the
anger index for which the main effect for these groups was also significant and further supports
H1a. The only other independent variables that approached significance also were variables on
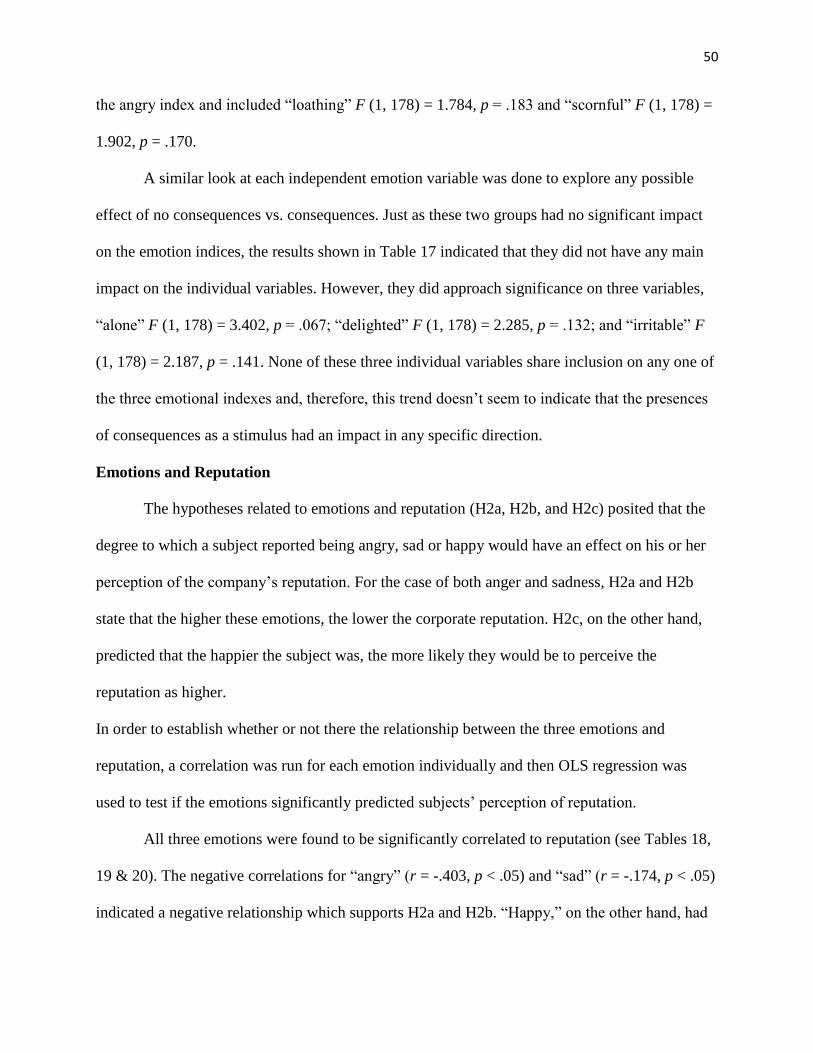
50
the angry index and included “loathing” F (1, 178) = 1.784, p = .183 and “scornful” F (1, 178) =
1.902, p = .170.
A similar look at each independent emotion variable was done to explore any possible
effect of no consequences vs. consequences. Just as these two groups had no significant impact
on the emotion indices, the results shown in Table 17 indicated that they did not have any main
impact on the individual variables. However, they did approach significance on three variables,
“alone” F (1, 178) = 3.402, p = .067; “delighted” F (1, 178) = 2.285, p = .132; and “irritable” F
(1, 178) = 2.187, p = .141. None of these three individual variables share inclusion on any one of
the three emotional indexes and, therefore, this trend doesn’t seem to indicate that the presences
of consequences as a stimulus had an impact in any specific direction.
Emotions and Reputation
The hypotheses related to emotions and reputation (H2a, H2b, and H2c) posited that the
degree to which a subject reported being angry, sad or happy would have an effect on his or her
perception of the company’s reputation. For the case of both anger and sadness, H2a and H2b
state that the higher these emotions, the lower the corporate reputation. H2c, on the other hand,
predicted that the happier the subject was, the more likely they would be to perceive the
reputation as higher.
In order to establish whether or not there the relationship between the three emotions and
reputation, a correlation was run for each emotion individually and then OLS regression was
used to test if the emotions significantly predicted subjects’ perception of reputation.
All three emotions were found to be significantly correlated to reputation (see Tables 18,
19 & 20). The negative correlations for “angry” (r = -.403, p < .05) and “sad” (r = -.174, p < .05)
indicated a negative relationship which supports H2a and H2b. “Happy,” on the other hand, had

51
a positive correlation, (r = .448, p < .05), which indicated that the happier the subject, the better
the perceived reputation. Therefore, H2c was also supported.
The emotions were also included in an OLS regression model (see Table 21) to further
test their potential relationship with the concept of reputation. The overall model (which included
demographic variables, measures of social identity and the three emotional variables) was
significant at the p < .001 level (F = 13.804). The R2 of .467 indicates that nearly half of the
variance in corporate reputation can be explained by the overall model and the R2Δ of Model 3
(.129) indicates that nearly 13 percent of that variance is attributable to additional of the
emotional variables in the model.
Specifically, there was a significant negative relationship between subjects who indicated
that they were angry and their perceived reputation of the company (b = -.312, p < .01),
indicating that someone who is angrier will have a more negative perception of the company’s
reputation. This further supports H2a.
The regression model also showed a significant positive relationship between subjects
who indicated that they were happy and their perceived reputation of the company (b = .335, p <
.001). This indicates that someone who is happier will have a more positive perception of the
company’s reputation and further supports H2c. In fact, happy is the strongest coefficient in the
overall regression model with a standardized beta of .283.
The model does not show a significant relationship between subjects who indicated that
they were sad and their perceived reputation of the company (b = -.086, p = n.s.) so, as before,
there is no support for H2b.

52
Third-Person Effect on Schadenfreude
H3 predicted that subjects believed they would be less likely to experience schadenfreude
(being happy if something bad happened to the company in crisis) than other people. To test for
the presence of third-person effect of schadenfreude in crisis, subjects were asked to what degree
they agreed with the two following statements: “You would be happy if something bad happened
to the company.” And “OTHERS would be happy if something happened to the company.” This
was measured on a scale from 1 (Completely Disagree) to 5 (Completely Agree). To compare the
differences in means between “self” (M = 2.93, SD = 1.33) and “other” (M = 3.61, SD = 1.02), a
paired sample t-test was run. As seen in Table 22, the results indicate that there is a significant
difference between the means, t(172) = 8.47, p < .001. Therefore, H3 was supported.
Since this is the second measure of schadenfreude in the study, an effort was made to
replicate the findings above where “happiness,” as the primary measure of schadenfreude was
found to have a significant, positive correlation with perceived reputation (r = .448, p < .05). To
accomplish this comparison, a correlation was run for the “self” measure of schadenfreude where
subjects were asked to what degree they would be happy if something bad happened to the
company. As shown in Table 23, the correlation for this second measure of schadenfreude was
also significant, but the relationship with perceived reputation was negative (r = -.316, p < .001).
This contradicts the valence of the relationship found with the primary measure of
schadenfreude. If this had been the primary measure, H2c would not have been supported.
Social Identity in Crisis
R1 asked whether there was a difference in perception of reputation between people who
claimed to identify more with either the CEO or parents in this crisis situation. The degree of
identity for both were measured on a scale from 1 (Don’t Identify at All) to 7 (Completely

53
Identify). Correlations between reputation and both “Identify with CEO” (M = 1.88, SD = 1.30)
and “Identify with Parents” (M = 5.31, SD = 1.63), as seen in Table 24 and Table 25, indicate
that there is a relationship between identifying with the players in the crisis and perceived
reputation.
Specifically, the results indicate a significant positive relationship between identification
with the CEO and perceived reputation (r = .274, p < .01). Conversely, there is a significant
negative relationship between identification with the parents in the situation and perceived
reputation (r = -.442, p < .01).
As shown in Table 21, the role of social identity was further explored through OLS
regression by introducing the social identity variables as moderating variables to emotions on
reputation in Model 2. This model, which included both demographic variables and
identification with either the CEO or parents is significant at the p < .001 level (F = 12.298) and
is stronger than Model 1 with an R2 of .337, indicating that 34 percent of the variance in
subjects’ perception of reputation is attributable to the combination of the demographic variables
and their identification with either the CEO or the parents in the article.
This model reiterates the positive relationship between subjects who indicated that they
identified with the CEO and their perceived reputation of the company (b = .1411, p < .001),
which indicates that someone who identifies more with the CEO will have a more positive
perception of the company’s reputation. Model 2 also shows the negative relationship between
subjects who indicated they identified with the parents and their perceived reputation of the
company (b = -1.707, p < .001), which indicates that someone who identifies more with the
parents will have a more negative perception of the company’s reputation. This further supports
the answer to R1: there is an impact of social identify on reputation.

54
Demographic Variables
In an effort to control for demographic variables in the overall OLS regression model,
Model 1 tool all of the interval or ratio-level dependent variables into account including, gender,
age, household income, and education. As shown in Table 21, Model 1 indicates that these
variables alone account for 12.5 percent of the variance in stakeholder perceived reputation with
an R2 of .125 (F = 13.804, p < .01). While Model 1 is significant, only one of the coefficients is
independently shown to be a significant predictor of reputation: gender.
The coefficient of gender is significant (b = -4.235, p < .001), indicating a negative
relationship with perceived reputation. Since the reference group is male, this beta score
indicates that that being female makes a subject more likely to have negative perceptions of the
company.
The remaining demographic variables in the model, age (b = -.967, p = n.s.), household
income (b = -.521, p = n.s.), and education (b = -.470, p = n.s.) were not found to be significant.

55
Chapter 7: Discussion
There were a number of findings in this study that contribute to the body of knowledge
surrounding the role of emotions in crisis communications.
While the stimulus materials were designed to test the effect of framing on stakeholder
emotions, they did not successfully induce the desired emotions at a significant level. However,
the results did trend in the expected direction and indicate that the use of stronger stimulus
materials could be successful in the future. The premise that a positive emotion (happiness),
created by stakeholder schadenfreude, has a mitigating effect on negative stakeholder feelings
was shown to have some merit while, at the same time, the complexity and difficulty of
operationalizing schadenfreude as a concept in crisis communications was also evident.
The presence of a third-person effect, a previously under-studied concept in crisis
communications, was found and social identity theory held true, predicting perceived reputation
based on identification with one or another party/group. Finally, in an effort to control for
demographic variables, gender had a significant effect on reputation.
Framing Effect on Emotions
Anger/sadness.
In this 2x2 design, the first objective was to differentiate the anger and sadness frames by
offering two crisis news articles – one framed in a manner to elicit anger and one framed in a
manner to elicit sadness. This was not completely successful. When the four conditions were
split into two groups (anger and sadness-producing articles) for analysis (see Table 14), the
anger-inducing articles did made subjects angrier (M = 17.51, p < .05), but the sadness-inducing
articles did not significantly make subjects sadder. There are at least three possible explanations
for this: 1) framing doesn’t have an effect on stakeholder emotion, 2) the articles were not

56
framed in a manner that adequately triggered feelings of anger or sadness, or 3) there were issues
in how the emotions were measured.
I believe the first explanation can be eliminated based on the results of prior studies. In
her seminal work on the topic, Nabi (2003) found that emotions (fear and anger) can be used as
frames that impact opinions on policy. Although even she noted that, rather than the emotions
induced by her stimulus, “(i)t is possible that … the emotional reactions reported may be based
on the accessibility of past emotional experiences.” In other words, her respondents may be
reporting emotions based on their prior perceptions and experiences with the issues addressed in
the study (drunk driving and gun control) instead of responding to her stimulus. This possibility
was addressed, however, by Kim and Cameron (2011), who controlled for previous emotional
ties (prior reputation) in their crisis communication study on emotional framing by specifically
selecting a fictitious company for their stimulus materials (cell phone battery manufacturer) with
no apparent emotional association in their subjects.
Kim and Cameron (2011), in the first study of emotional framing in crisis
communications, were also successful with their stimulus materials (the parameters of which
were adopted for the current study). As in the current study, their materials1 consisted of two
crisis communication articles – one designed to elicit anger, the other sadness. Similarly, the
currently study employed the technique used by Kim and Cameron (2011) to keep the basic facts
of the incident consistent in both articles and to “induce either anger or sadness about a corporate
crisis situation by emphasizing information related to each emotions’ core relations theme. That
is, anger-inducing news emphasized the transgression of a company (i.e. the company’s
intentional wrongdoing), whereas sadness-inducing news focused on suffering victims (i.e. crisis
1 An effort was made to obtain copies of Kim and Cameron’s (2011) stimulus materials with the intention of more
closely replicating their study design, but the materials were not available.

57
victims’ personal lives and suffering” (p. 13). They were successful so it would be unreasonable
to assume that framing doesn’t have an impact on stakeholder emotion.
The second, and probably most likely, option for why the current study’s stimulus
materials failed to induce the desired emotions (despite a pretest that indicated otherwise) is that
the articles were not strong enough and that, in an attempt to ensure that all the facts remained
the same in both the anger and sadness-inducing articles, the articles did not differ enough in
their content. This idea is supported by the fact that the anger-inducing article did significantly
produce anger, indicating that at least one emotion was triggered in the process.
The third option is that the emotions were measured in a manner that was detrimental to
the study. In this case, subjects were asked to “Please indicate to what degree each of the
following words describes your feelings/emotions after reading the article.” and were then
provided with the PANAS subscale for hostility (anger), sadness, and joviality (happiness) with
each individual subscale item listed individually in alphabetical order. One subject in the pretest
noted that they felt uncomfortable reporting feelings of both sadness and happiness in response
to the same scenario. Does this indicate that subjects should have been asked to choose among
the three emotions instead of ranking their feeling on scales for all of them? Kim and Cameron
used a similar measure (albeit not based on the PANAS scale) for their study and encounter the
same issues. However, for future projects, it may be worth examining the relationship between
anger and sadness, which have been shown to be highly correlated emotions (Sigfusdottir, Farkas
& Silver, 2004) and to consider happiness separately.
Happiness/schadenfreude.
The second objective in this 2x2 design was to differentiate the groups in the third and
fourth condition by giving providing subjects a scenario in which the company “suffered”

58
consequences for their intentional wrongdoing (multi-million dollar fine for the company and
prison time for the CEO). The intent of this was to trigger a schadenfreude experience – feelings
of happiness among subjects who were pleased that the company “got what they deserved.” The
addition of company consequences to the crisis situation did not significantly trigger happiness
(the presence of schadenfreude) in any of the conditions.
It is interesting to note, however, that the results did trend in the expected direction. Table
15 shows that in the case of anger and sadness, the introduction of consequences decreased the
mean, albeit not significantly. The anger index went from an average score of 17.10 with no
consequences to 16.23 with consequences, while the sadness index went from an average score
of 11.36 to 10.99. Conversely, the happiness index score increased with the introduction of
consequences (from 10.15 to 10.79). As this is the first attempt to trigger schadenfreude through
framing, the trend suggests that further research and development of more successful stimulus
materials may result in more significant findings. In any case, the trend suggests, as do the
previous crisis communications studies involving schadenfreude (Coombs & Holladay, 2005;
Kim & Cameron, 2011), that schadenfreude could have a role in crisis communication and could
be triggered by the initial framing of the situation with stakeholders.
Emotion/Schadenfreude on Reputation
As previously noted, the potentially important role of emotions in crisis communication
has been the focus of recent research (e.g. Choi and Lin, 2009; Coombs & Holladay, 2005; Jin,
2010; Jin, Liu & Austin, 2011; Jin, Pang & Cameron, 2007; Kim & Kiousis, 2012; Liu, Austin
& Jin, 2011; Moon & Rhee, 2012). Similarly, this study showed that stakeholders’ emotions
could have an impact on their perceptions of corporate reputation in a crisis situation.

59
As noted in situational crisis communications theory (Coombs, 2007), crisis history (was
there a history of issues at the company before the current incident) and prior reputation of the
company are significant contributing factors to stakeholders’ perceived reputation of a company
in crisis. The design of this study controlled for those two variables by providing subjects with a
fictitious company in a neutral industry (no prior reputation or crisis history). In other words, all
subjects, no matter their assigned condition, were provided with the same facts about the
company and the crisis situation (albeit the situations were framed differently as discussed
above). Therefore, the subjects’ emotions just prior to reporting their perceived reputation of the
company were one of the few variables that differentiated the subjects and can be attributed for
their resulting different perceptions of reputation.
Anger vs. sadness.
The findings regarding the effect of anger and sadness are consistent with Kim and
Cameron (2011) who discovered that those exposed to anger-inducing news had more negative
attitudes toward the company than those exposed to sadness-inducing news. In this study, while
there was a negative correlation between both anger and sadness with perceived reputation, the
results indicate that those who are sadder do rate the company’s reputation higher than those who
are angrier. This may be a reinforcement of the idea that practitioners should work to avoid or
diffuse anger in stakeholder groups as soon as possible as it does have a direct impact on the
resulting reputation.
Happiness/schadenfreude.
Schadenfreude (deriving pleasure from the pain or failure of others) has not been
considered to any large degree in crisis communication research. Coombs and Holladay (2005)
included schadenfreude in their exploration of whether different types of crises would elicit
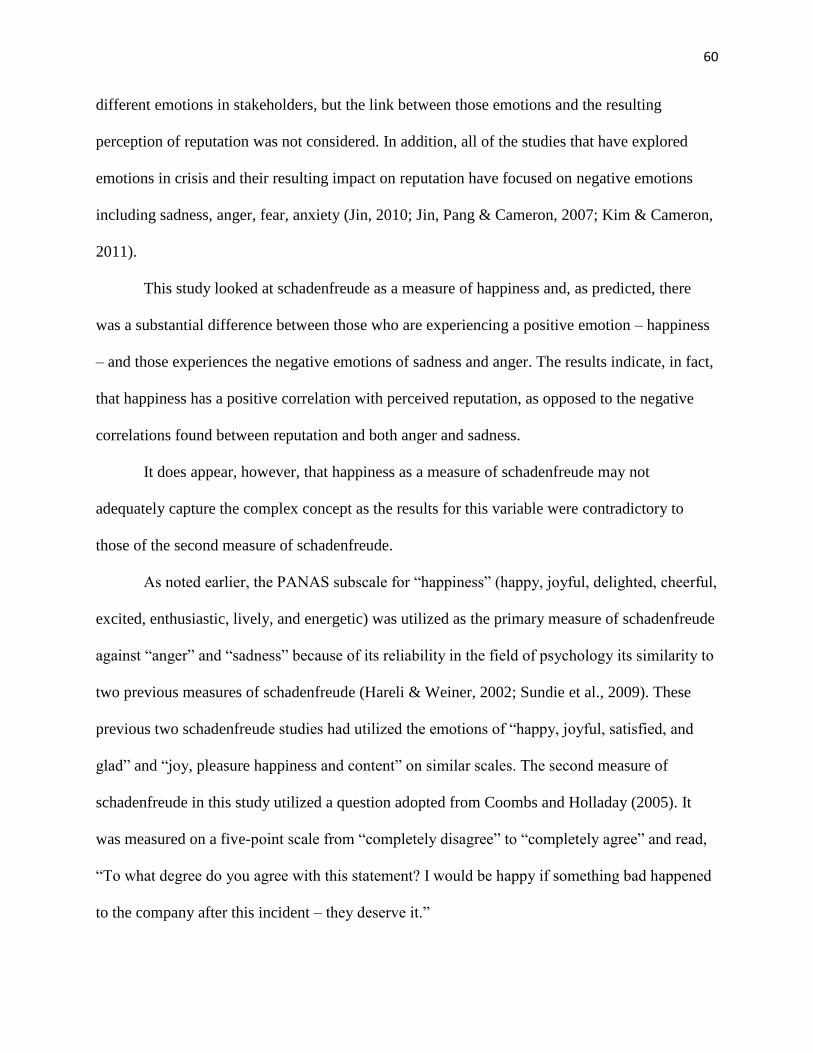
60
different emotions in stakeholders, but the link between those emotions and the resulting
perception of reputation was not considered. In addition, all of the studies that have explored
emotions in crisis and their resulting impact on reputation have focused on negative emotions
including sadness, anger, fear, anxiety (Jin, 2010; Jin, Pang & Cameron, 2007; Kim & Cameron,
2011).
This study looked at schadenfreude as a measure of happiness and, as predicted, there
was a substantial difference between those who are experiencing a positive emotion – happiness
– and those experiences the negative emotions of sadness and anger. The results indicate, in fact,
that happiness has a positive correlation with perceived reputation, as opposed to the negative
correlations found between reputation and both anger and sadness.
It does appear, however, that happiness as a measure of schadenfreude may not
adequately capture the complex concept as the results for this variable were contradictory to
those of the second measure of schadenfreude.
As noted earlier, the PANAS subscale for “happiness” (happy, joyful, delighted, cheerful,
excited, enthusiastic, lively, and energetic) was utilized as the primary measure of schadenfreude
against “anger” and “sadness” because of its reliability in the field of psychology its similarity to
two previous measures of schadenfreude (Hareli & Weiner, 2002; Sundie et al., 2009). These
previous two schadenfreude studies had utilized the emotions of “happy, joyful, satisfied, and
glad” and “joy, pleasure happiness and content” on similar scales. The second measure of
schadenfreude in this study utilized a question adopted from Coombs and Holladay (2005). It
was measured on a five-point scale from “completely disagree” to “completely agree” and read,
“To what degree do you agree with this statement? I would be happy if something bad happened
to the company after this incident – they deserve it.”
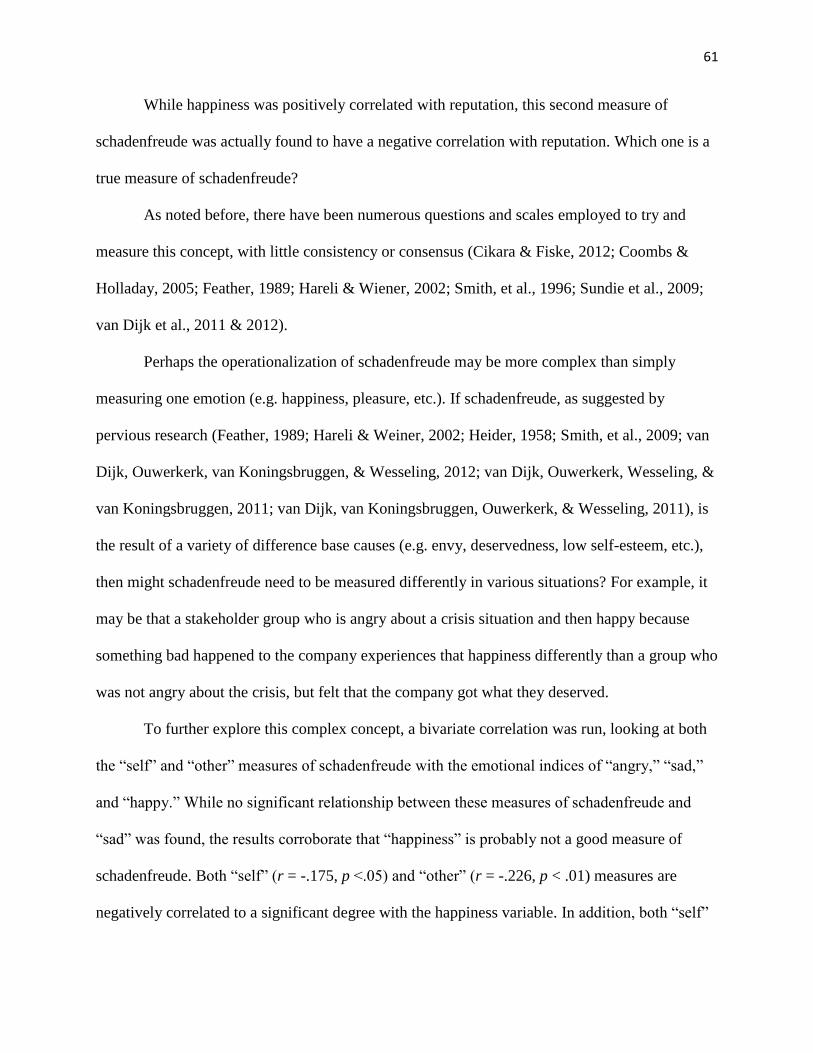
61
While happiness was positively correlated with reputation, this second measure of
schadenfreude was actually found to have a negative correlation with reputation. Which one is a
true measure of schadenfreude?
As noted before, there have been numerous questions and scales employed to try and
measure this concept, with little consistency or consensus (Cikara & Fiske, 2012; Coombs &
Holladay, 2005; Feather, 1989; Hareli & Wiener, 2002; Smith, et al., 1996; Sundie et al., 2009;
van Dijk et al., 2011 & 2012).
Perhaps the operationalization of schadenfreude may be more complex than simply
measuring one emotion (e.g. happiness, pleasure, etc.). If schadenfreude, as suggested by
pervious research (Feather, 1989; Hareli & Weiner, 2002; Heider, 1958; Smith, et al., 2009; van
Dijk, Ouwerkerk, van Koningsbruggen, & Wesseling, 2012; van Dijk, Ouwerkerk, Wesseling, &
van Koningsbruggen, 2011; van Dijk, van Koningsbruggen, Ouwerkerk, & Wesseling, 2011), is
the result of a variety of difference base causes (e.g. envy, deservedness, low self-esteem, etc.),
then might schadenfreude need to be measured differently in various situations? For example, it
may be that a stakeholder group who is angry about a crisis situation and then happy because
something bad happened to the company experiences that happiness differently than a group who
was not angry about the crisis, but felt that the company got what they deserved.
To further explore this complex concept, a bivariate correlation was run, looking at both
the “self” and “other” measures of schadenfreude with the emotional indices of “angry,” “sad,”
and “happy.” While no significant relationship between these measures of schadenfreude and
“sad” was found, the results corroborate that “happiness” is probably not a good measure of
schadenfreude. Both “self” (r = -.175, p <.05) and “other” (r = -.226, p < .01) measures are
negatively correlated to a significant degree with the happiness variable. In addition, both “self”
62
(r = .247, p < .01) and “other”(r = .152, p < .05) measures of schadenfreude are positively
correlated with anger. This suggests that perhaps anger should be a component of any true
operationalization of schadenfreude and is worthy of exploration in future studies.
In any case, it would appear that the role of emotions in crisis communication can have
an impact on stakeholder perception on reputation and, despite the challenges in the inherent
challenges with operationalizing these concepts, practitioners would do well to consider
stakeholder emotions as a potential factor moving forward.
Third-Person Effect on Crisis
Only recently has third-person effect, the belief that “others” are more influenced than
“self” by messages in communication, been introduced to the study of crisis communications
(Kim, Kim & Cameron, 2012). In that study, researchers found that people believe “others” are
more impacted by crises than themselves and that, in fact, this may be one way in which
corporate crises become “escalated” (p. 391).
In an effort to explore the impact of third-person effect in another area of crisis, this study
applies the concept to emotions, specifically schadenfreude, in a crisis situation. The results, as
shown in Figure 3, indicated that, indeed, while subjects said that they would be happy
(experience schadenfreude) if something bad happened to the company, they believed that
“others” would be even happier. This is yet another indication that schadenfreude may play a
vital role in crisis communications as stakeholders acknowledge, not only that it exists, but
assume that “others” experience it to a greater degree. Could it affect stakeholder behavior if
they believe others have a heightened feeling of schadenfreude and, if so, would it be prudent for
crisis communicators to share stakeholder feedback with others to, perhaps, mitigate this?
63
It is also interesting to note that schadenfreude may have some of its roots in third-
person effect, as well. In Portmann’s (2000) book, When Bad Things Happen to Other People, he
suggests that feelings of schadenfreude may occur because we view ourselves so differently than
others. He notes that, “We are more likely to view the misfortunes of others as deserved than we
are our own” (p. X1).
Social Identity Theory in Crisis
While third-person effect suggests that we see ourselves differently than we see “others,”
social-identify theory says that we are inherently driven to seek those similar to ourselves in an
effort to belong. Once we find those similar to ourselves, we feel part of the group – the “in
group” – and we are motivated to view our group more favorably that groups in which we don’t
identify – “out groups.” Historically, this theory is not cited in crisis communication literature,
but in a field that relies so heavily on the perceptions and opinions of stakeholder groups,
perhaps it has great value.
This study found that some subjects identified to some degree with the CEO and some
identified with the parents. It came as somewhat of a surprise that subjects would identify with
the CEO as he was portrayed as unethical. Yet, as noted by Ashforth and Mael (1989), these
types of social/group identifications can be seen in situations where there is “great loss or
suffering” (p. 21) and “acceptance of the category as a definition of self does not necessarily
mean acceptance of those values and attitudes” (p. 22). Perhaps many of these subjects were in
management positions that put them in situations for which they had to absorb responsibility for
their company’s actions.
Not as surprising, is the finding that this identification with either party in the crisis
situation impacts subjects’ perception of the company’s reputation. Results show that subjects
64
more likely to identify with the CEO had a better perceived reputation of the company, while
those more likely to identify with the parents did not. This lends support to the emotion in crisis
studies that show sadness or sympathy with the victims have a negative relationship with
corporate reputation (Coombs & Holladay, 2005; Kim & Cameron, 2011).
Communications practitioners are taught that “analyzing publics” is key to strategic
communications (Smith, 2009) and they do extensive research on their “publics” in order to
identify issues, set objectives, and develop strategies for success. Perhaps, through social-identity
theory, knowing with which groups these “publics” identify in a crisis situation should be a key
part of this analysis.
Gender Differences
In an effort to control for demographic variables, the results uncovered a few interesting
relationships. For example, the significant effect of gender on reputation suggests that women
judge a company more harshly that their male counterparts in a crisis situation (see Table 21).
While there has not been much focus on the impact of stakeholder gender in crisis
communications, this finding is consistent with Chi and Hung (2011). They found that females
had more empathy toward other stakeholders in the Dell pricing crisis of 2009 and that consumer
empathy, in turn, was positively related to the perception of damage to Dell’s corporate
reputation. The idea that females may be more sympathetic to victims or other stakeholders in a
crisis is interesting and has strong implications for practitioners and future study. Is it true and
should practitioners be focused on different communications strategies based on the gender
makeup of their primary audiences?

65
Study Limitations
There are limitations to this study that must be considered when analyzing the results and
before making any assumptions as to the application of this information beyond this study.
The first consideration is the sample of subjects who participated in the study. While the
sample included subjects from both genders, across age categories, income level, educational
attainment, and geographic location, it was not a truly random sample of the population in the
United States. Rather, it was a subset of people who have agreed to be part of SurveyMonkey’s
online survey audience program which recruits people to take surveys in exchange for having
SurveyMonkey making a small donation to charity on the participant’s behalf (SurveyMonkey,
2012). This leads to the assumption that the “volunteers” have, not only access to the internet on
a regular basis, but characteristics in their personalities that make them more willing to take
surveys and/or willing to do something that will benefit others, rather than themselves.
As described in the results and seen in Table 1 and Figure 2, the sample population
utilized for this study does have some similarities with characteristics of the general population,
yet they are also a little older, have a little higher annual household income, and have attained a
higher level of education than the general population.
It is interesting to note that the higher income and educational attainment level of the
sample is consistent with the differences generally found in internet vs. non-internet users
(Bethlehem, 2010). Unlike the general findings of internet vs. non-internet users, however, the
sample in this study is older than the general population. This may be due to the fact that people
over the age of 60 devote more hours (i.e. survey time) to volunteering than their younger
counterparts (Bureau of Labor Statistics, 2012), but additional research would be needed to

66
determine why the difference in age between the sample and the population is, in fact, the
reverse of what might be expected of internet users.
Another limitation of this study is the experimental design, as is the case with much of
the crisis communications research, because it cannot accurately reflect “real life” experiences.
Therefore, the results cannot be generalized to “real life” situations. This is a challenge in the
field, which relies heavily on experimental and case study methodology, because there are so
many situational variables that make it difficult to predict stakeholder responses to specific crises
and to develop prescriptive crisis response strategies that fit every situation.
Conclusions and Future Research
Clearly, a lot was learned from this study, but there is such a long way to go before
concrete answers can be found regarding the role of emotions in crisis communications and even
further before the information can be presented in a manner that would be beneficial to crisis
communications practitioners.
These results indicate that the framing of news stories can impact stakeholders emotions
and that those emotions, in turn can have an impact on stakeholder’s perception of a company’s
reputation during and after a crisis. However, while the criteria cited in previous research for
differentiating the news articles in a manner that elicited the desired emotions was followed and
was successful in inducing anger, the materials were not strong enough to elicit all of the desired
emotions. Experimentation with stimulus materials is needed to better refine them, building on
the existing criteria, and will be a focus of my research in the future.
The study also indicates that schadenfreude has the potential to impact stakeholder’s
perception of a company’s reputation in a crisis and is worth consideration in future crisis
communication studies, especially as they relate to the role of emotions in crisis. These results
67
imply that, as subjects reported being more “happy,” they had a better perception of the
company’s reputation. However, there were some questions raised when the second measure of
schadenfreude (as part of the measurement for third-person effect) had a negatively correlated
relationship with perceived reputation, indicating that the more schadenfreude one felt, the lower
their perceptions of the company’s reputation. Further research will attempt to clarify these
finding and to further explore the relationship between the subject’s “happiness” during or after a
company’s crisis and the concept of schadenfreude, as well as the role schadenfreude plays in
stakeholder perceptions of reputation in crisis situations.
Findings that showed a third-person effect in this study are interesting because, as was
also the case with the concept of schadenfreude, third-person effect hasn’t been extensively
explored in the area of crisis communications. Yet, in the one study other study cited related to
third-person effect and crisis communications, (Kim, Kim & Cameron, 2012) found that people
felt “others” were more impacted by the effects of a crisis than themselves. In this case, the
findings indicate that people believe others people are more likely to feel schadenfreude when
bad things happen to a company in crisis (assuming that the company is responsible for the
crisis). Moving forward, this concept could be further explored by looking at how the assumption
that other people are feeling schadenfreude toward a company in crisis may or may not have an
impact on the subject’s own perceptions or behaviors.
In addition, the differences in subjects’ responses related to their identification with either
the CEO or the parents in this crisis situation are interesting. As social identity theory indicates,
people are more likely to empathize and be supportive of people or groups for whom they can
identify. The results of this study illustrate that this holds true in crisis situations and could be
further explored as a potential predictor of stakeholder behavior in crisis situations.

68
This study is only one small step in understanding the role stakeholder emotions, as well
as other stakeholder differences and tendencies, have on a company’s reputation during and after
a crisis. While it offers some suggestions, if offers even more questions that provide fodder for
research for years to come. Stay tuned.

69
Tables

70
Table 1
Descriptive Statistics and Census Comparison
Variable Sample
Demographic
s
2010 Census
Demographics
%
Difference
Respondents (N) 173 308,745,539
Gender (%)
Male 48.6 49.2 -0.6
Female 51.4 50.8 0.6
Age (%)
18-29 14.9 21.9 -7
30-44 15.4 25.8 -10.4
45-60 37.1 29.1 8
>60 32.6 23.2 9.4
Annual Household Income (%)
$0-$24,999 23.9 25 -1.1
$25,000-$49,999 15.5 24.9 -9.4
$50,000-$99,999 33.5 29.1 4.4
$100,000-$149,999 15.5 11.9 3.6
>$150,000 11.6 9.1 2.5
Education (%)**
Less than High School 1.7 13 -11.3
High School Diploma 9.1 30 -20.9
Some College 25.1 19 6.1
Associate or Bachelor Degree 32.6 28 4.6
Graduate Degree 31.4 10 21.4
Location (%)
Northeast 21.1 17.9 3.2
New England (8.2)
Middle Atlantic (12.9)
Midwest 28 21.7 6.3
East North Central (21.6)
West North Central (6.4)
South 27.5 37.1 -9.6
South Atlantic (15.2)
East South Central (4.7)
West South Central (7.6)
West 23.4 23.3 .1
Mountain (10.5)
Pacific (12.9)
*Educational attainment numbers reported in census are for civilian/non-institutionalized citizens only.
N = 234,719,000

71
Table 2
Descriptive Statistics for PANAS Adapted Emotion Indices
Index # Items Mean SD Range Skewness Kurtosis Cronbach’s
Alpha
Anger 6 16.65 5.81 6-30 .121 -.557 .865
Sadness 5 11.17 4.08 5-21 .281 -.700 .750
Happy 8 10.48 5.99 8-38 2.85 7.62 .969

72
Table 3
Pearson Correlation Coefficients for Anger Index
Variablesa (N = 180) Angry Disgusted Hostile Irritable Loathing Scornful
Angry -- .747** .468** .445** .451** .447**
Disgusted -- .425** .442** .478** .389**
Hostile -- .652** .547** .580**
Irritable -- .510** .558**
Loathing -- .611**
Scornful -- aResponses were coded from 1 (Slightly/Not at All) to 5 (Extremely)
*p<.05; **p<.01

73
Table 4
Pearson Correlation Coefficients for Sadness Index
Variablesa (N = 180) Alone Blue Downhearted Lonely Sad
Alone -- .234** .248** .650** .195**
Blue -- .663** .209** .448**
Downhearted -- .266** .560**
Lonely -- .272**
Sad -- aResponses were coded from 1 (Slightly/Not at All) to 5 (Extremely)
*p<.05; **p<.01

74
Table 5
Pearson Correlation Coefficients for Happiness Index
Variablesa
(N = 180)
Cheerful Delighted Energetic Enthusiastic Excited Happy Joyful Lively
Cheerful -- .717** .724** .732** .741** .815** .850** .846**
Delighted -- .651** .720** .777** .843** .811** .801**
Energetic -- .795** .810** .731** .813** .787**
Enthusiastic -- .8040** .779** .820** .788**
Excited -- .838** .828** .810**
Happy -- .907** .891**
Joyful -- .922**
Lively -- aResponses were coded from 1 (Slightly/Not at All) to 5 (Extremely)
*p<.05; **p<.01

75
Table 6
Descriptive Statistics on Transformation of Happiness Subscale Variable
Variable Mean SD Range Skewness Kurtosis
Happy 10.48 5.98 8-38 2.85 7.62
Happy Revised 8.77 1.93 8-16 2.86 7.3
Happy Square Root 2.95 .29 2.83-4.0 2.72 6.53
Happy Logarithm .936 .076 .90-1.20 2.58 5.78

76
Table 7
Contribution to Cronbach’s Alpha: Item by Item Analysis of Emotion Indices
Variable (N = 180) Alpha if Item Deleted
Scale – Anger (α = .865)
Angry .844
Disgusted .847
Hostile .837
Irritable .841
Loathing .841
Scornful .842
Scale – Sadness (α = .750)
Alone .739
Blue .679
Downhearted .643
Lonely .729
Sad .703
Scale – Happiness (α = .969)
Cheerful .966
Delighted .968
Energetic .968
Enthusiastic .966
Excited .965
Happy .963
Joyful .961
Lively .962
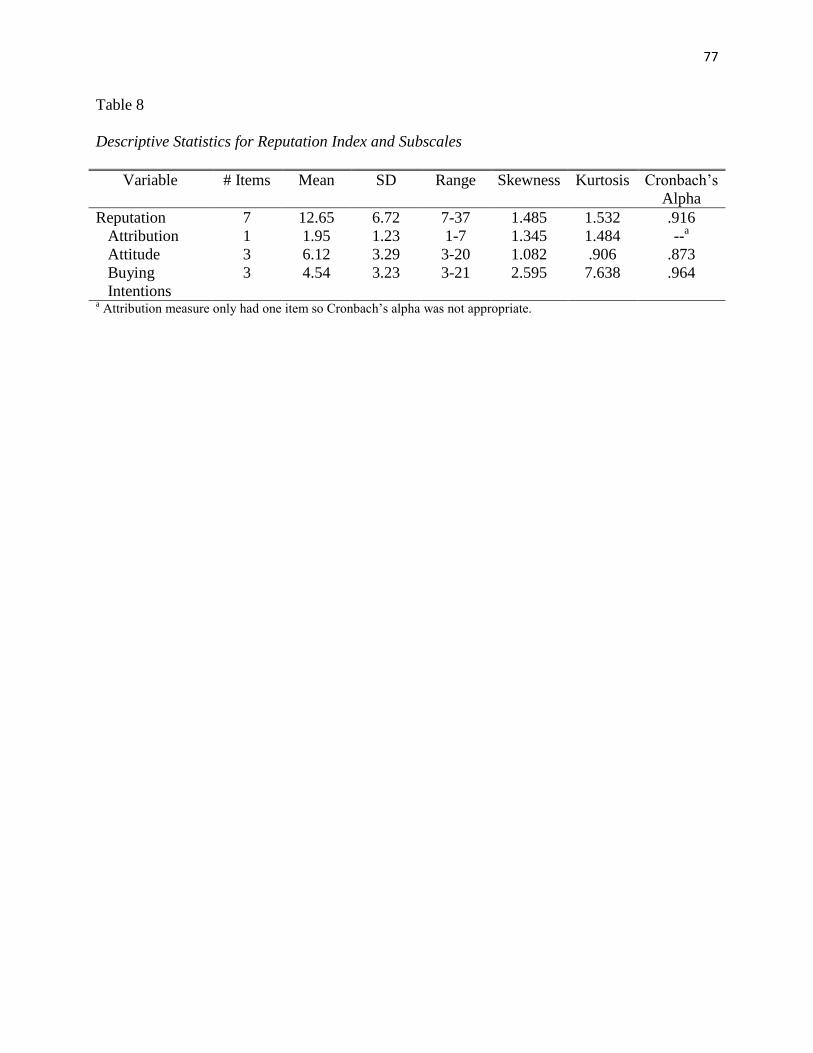
77
Table 8
Descriptive Statistics for Reputation Index and Subscales
Variable # Items Mean SD Range Skewness Kurtosis Cronbach’s
Alpha
Reputation 7 12.65 6.72 7-37 1.485 1.532 .916
Attribution 1 1.95 1.23 1-7 1.345 1.484 --a
Attitude 3 6.12 3.29 3-20 1.082 .906 .873
Buying
Intentions
3 4.54 3.23 3-21 2.595 7.638 .964
a Attribution measure only had one item so Cronbach’s alpha was not appropriate.
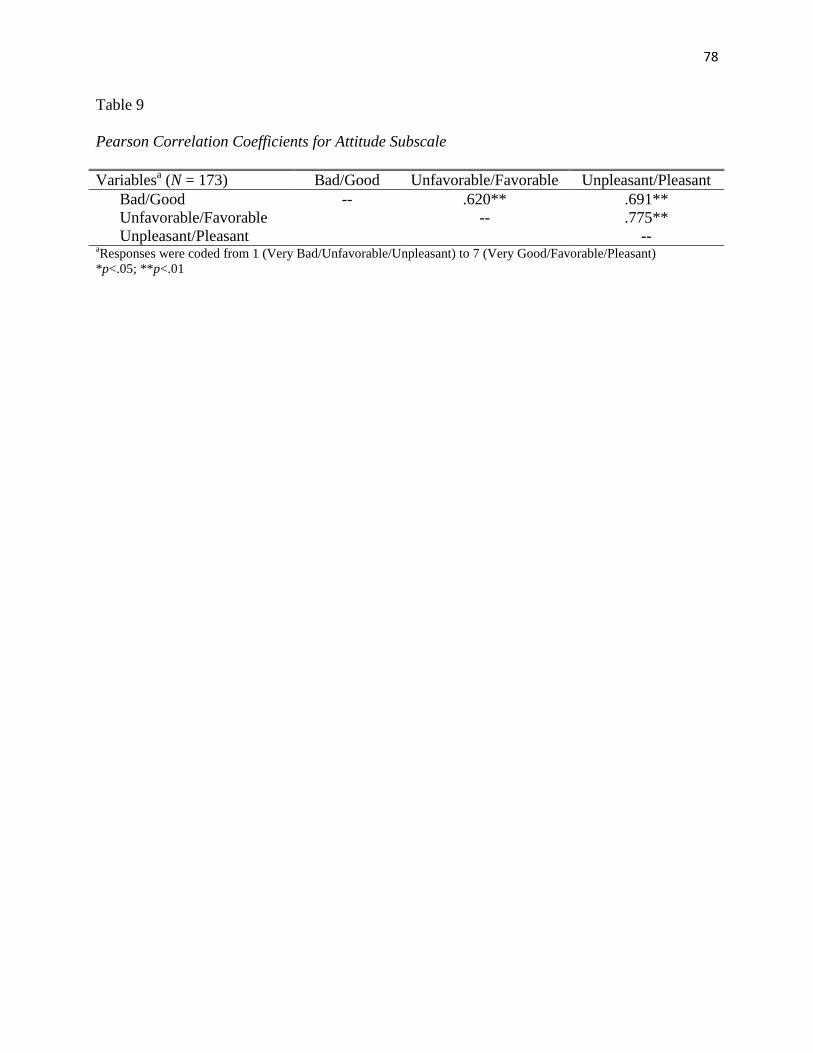
78
Table 9
Pearson Correlation Coefficients for Attitude Subscale
Variablesa (N = 173) Bad/Good Unfavorable/Favorable Unpleasant/Pleasant
Bad/Good -- .620** .691**
Unfavorable/Favorable -- .775**
Unpleasant/Pleasant -- aResponses were coded from 1 (Very Bad/Unfavorable/Unpleasant) to 7 (Very Good/Favorable/Pleasant)
*p<.05; **p<.01

79
Table 10
Pearson Correlation Coefficients for Buying Intentions Subscale
Variablesa (N = 173) Purchase Invest Recommend
Purchase -- .889** .900**
Invest -- .910**
Recommend -- aResponses were coded from 1 (Strongly Disagree) to 7 (Strongly Agree)
*p<.05; **p<.01

80
Table 11
Descriptive Statistics on Transformation of Buying Subscale Variable
Variable Mean SD Range Skewness Kurtosis
Buying Subscale 4.54 3.23 3-21 2.60 7.64
Buying Revised 3.43 1.10 3-8 2.78 7.30
Buying Square Root 1.83 .25 1.73-2.83 2.56 5.77
Buying Logarithm .52 .10 .48-.9 2.38 4.60
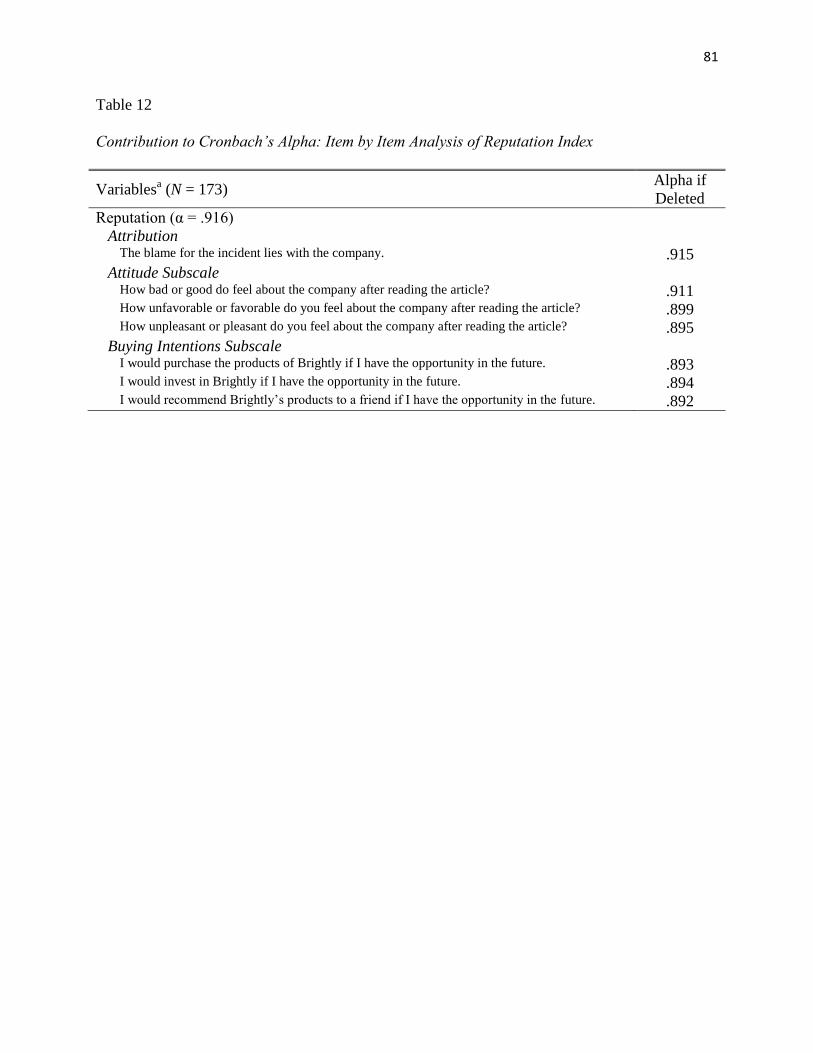
81
Table 12
Contribution to Cronbach’s Alpha: Item by Item Analysis of Reputation Index
Variablesa (N = 173)
Alpha if
Deleted
Reputation (α = .916)
Attribution The blame for the incident lies with the company. .915
Attitude Subscale How bad or good do feel about the company after reading the article? .911 How unfavorable or favorable do you feel about the company after reading the article? .899 How unpleasant or pleasant do you feel about the company after reading the article? .895
Buying Intentions Subscale I would purchase the products of Brightly if I have the opportunity in the future. .893 I would invest in Brightly if I have the opportunity in the future. .894 I would recommend Brightly’s products to a friend if I have the opportunity in the future. .892

82
Table 13
Analysis of Variance for Framed Articles on Emotional Indices
M SD F df p
Main Effect on Anger 1.702 3 ns
Anger-Inducing Frame 18.02 6.41
Sadness-Inducing Frame 15.95 5.81
Anger-Inducing Frame with Consequences 16.96 4.89
Sadness-Inducing Frame with Consequences 15.57 5.84
Main Effect on Sadness .220 3 ns
Anger-Inducing Frame 11.17 4.49
Sadness-Inducing Frame 11.61 1.14
Anger-Inducing Frame with Consequences 11.09 3.67
Sadness-Inducing Frame with Consequences 10.90 4.07
Main Effect on Happiness .313 3 ns
Anger-Inducing Frame 10.46 5.80
Sadness-Inducing Frame 9.76 4.97
Anger-Inducing Frame with Consequences 10.53 6.06
Sadness-Inducing Frame with Consequences 11.02 6.88

83
Table 14
Analysis of Variance for Anger-Inducing and Sadness-Inducing Articles on Emotional Indices
M SD F df p
Main Effect on Anger 4.252 1 <.05
Anger-Inducing Articles 17.51 5.71
Sadness-Inducing Articles 15.94 5.80
Main Effect on Sadness .016 1 ns
Anger-Inducing Articles 11.13 4.09
Sadness-Inducing Articles 11.21 4.09
Main Effect on Happiness .001 1 ns
Anger-Inducing Articles 10.49 5.89
Sadness-Inducing Articles 10.47 6.12
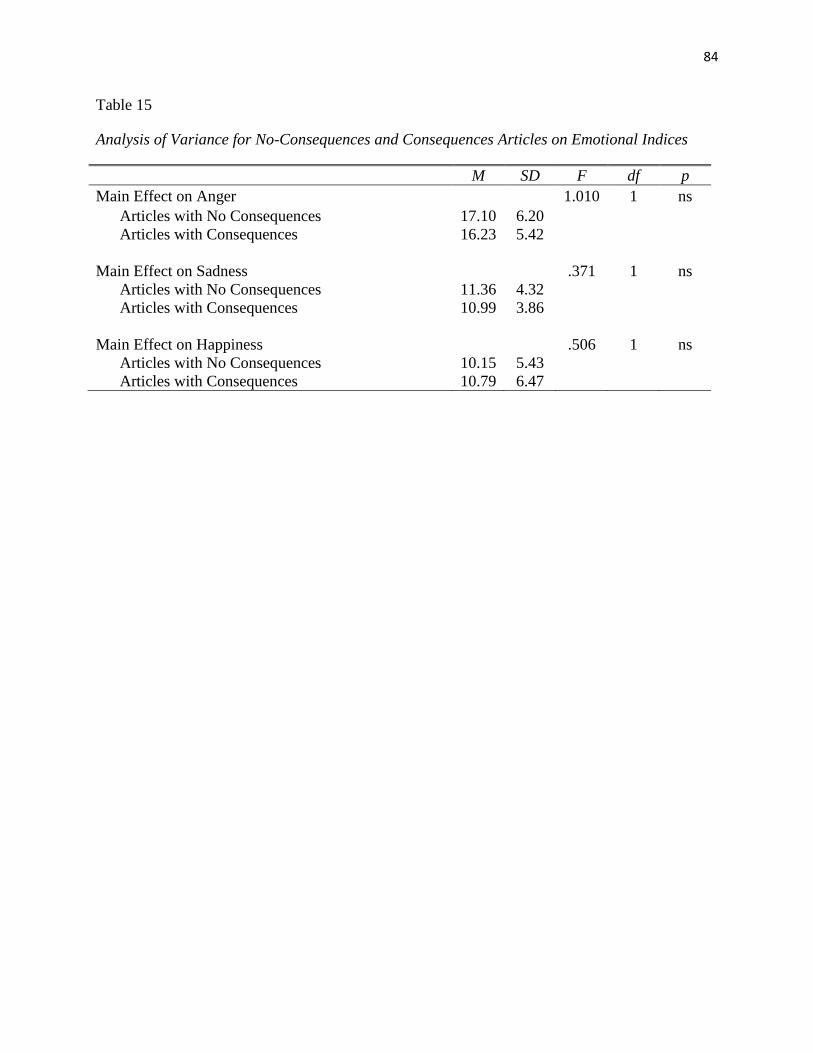
84
Table 15
Analysis of Variance for No-Consequences and Consequences Articles on Emotional Indices
M SD F df p
Main Effect on Anger 1.010 1 ns
Articles with No Consequences 17.10 6.20
Articles with Consequences 16.23 5.42
Main Effect on Sadness .371 1 ns
Articles with No Consequences 11.36 4.32
Articles with Consequences 10.99 3.86
Main Effect on Happiness .506 1 ns
Articles with No Consequences 10.15 5.43
Articles with Consequences 10.79 6.47

85
Table 16
Analysis of Variance for Anger-Inducing and Sadness-Inducing Articles on
Individual Emotional Variables
M SD F df p
Main Effect on Alone .242 1 ns
Anger-Inducing Articles 1.51 .96
Sadness-Inducing Articles 1.59 .95
Main Effect on Angry 6.111 1 <.05
Anger-Inducing Articles 3.78 1.23
Sadness-Inducing Articles 3.33 1.22
Main Effect on Blue .013 1 ns
Anger-Inducing Articles 2.30 1.32
Sadness-Inducing Articles 2.32 1.08
Main Effect on Cheerful .063 1 ns
Anger-Inducing Articles 1.27 .78
Sadness-Inducing Articles 1.30 .82
Main Effect on Delighted .032 1 ns
Anger-Inducing Articles 1.33 .93
Sadness-Inducing Articles 1.31 .80
Main Effect on Disgusted 4.560 1 <.05
Anger-Inducing Articles 3.88 1.21
Sadness-Inducing Articles 3.50 1.22
Main Effect on Downhearted .010 1 ns
Anger-Inducing Articles 2.76 1.28
Sadness-Inducing Articles 2.78 1.20
Main Effect on Energetic .001 1 ns
Anger-Inducing Articles 1.38 .83
Sadness-Inducing Articles 1.38 .82
Main Effect on Enthusiastic .206 1 ns
Anger-Inducing Articles 1.27 .74
Sadness-Inducing Articles 1.32 .83
Main Effect on Excited .628 1 ns
Anger-Inducing Articles 1.37 .93
Sadness-Inducing Articles 1.26 .77

86
Main Effect on Happy .026 1 ns
Anger-Inducing Articles 1.31 .86
Sadness-Inducing Articles 1.32 .88
Main Effect on Hostile .915 1 ns
Anger-Inducing Articles 2.37 1.20
Sadness-Inducing Articles 2.20 1.18
Main Effect on Irritable 1.600 1 ns
Anger-Inducing Articles 2.52 1.28
Sadness-Inducing Articles 2.28 1.26
Main Effect on Joyful .041 1 ns
Anger-Inducing Articles 1.31 .81
Sadness-Inducing Articles 1.29 .82
Main Effect on Lively .025 1 ns
Anger-Inducing Articles 1.27 .75
Sadness-Inducing Articles 1.29 .83
Main Effect on Loathing 1.784 1 ns
Anger-Inducing Articles 2.39 1.33
Sadness-Inducing Articles 2.14 1.17
Main Effect on Lonely .054 1 ns
Anger-Inducing Articles 1.44 .85
Sadness-Inducing Articles 1.47 .90
Main Effect on Sad .084 1 ns
Anger-Inducing Articles 3.11 1.45
Sadness-Inducing Articles 3.05 1.41
Main Effect on Scornful 1.902 1 ns
Anger-Inducing Articles 2.57 1.39
Sadness-Inducing Articles 2.30 1.23

87
Table 17
Analysis of Variance for No Consequences for Company and Consequences for
Company on Individual Emotional Variables
M SD F df p
Main Effect on Alone 3.402 1 ns
No Consequences 1.69 1.0
Consequences 1.43 .90
Main Effect on Angry .399 1 ns
No Consequences 3.63 1.30
Consequences 3.51 1.20
Main Effect on Blue .697 1 ns
No Consequences 2.23 1.20
Consequences 2.38 1.21
Main Effect on Cheerful .393 1 ns
No Consequences 1.24 .72
Consequences 1.32 .87
Main Effect on Delighted 2.285 1 ns
No Consequences 1.22 .73
Consequences 1.41 .97
Main Effect on Disgusted .076 1 ns
No Consequences 3.72 1.27
Consequences 3.68 1.19
Main Effect on Downhearted .005 1 ns
No Consequences 2.78 1.29
Consequences 2.77 1.20
Main Effect on Energetic .072 1 ns
No Consequences 1.36 .82
Consequences 1.39 .83
Main Effect on Enthusiastic .679 1 ns
No Consequences 1.24 .68
Consequences 1.34 .86
Main Effect on Excited .002 1 ns
No Consequences 1.31 .86
Consequences 1.32 .86
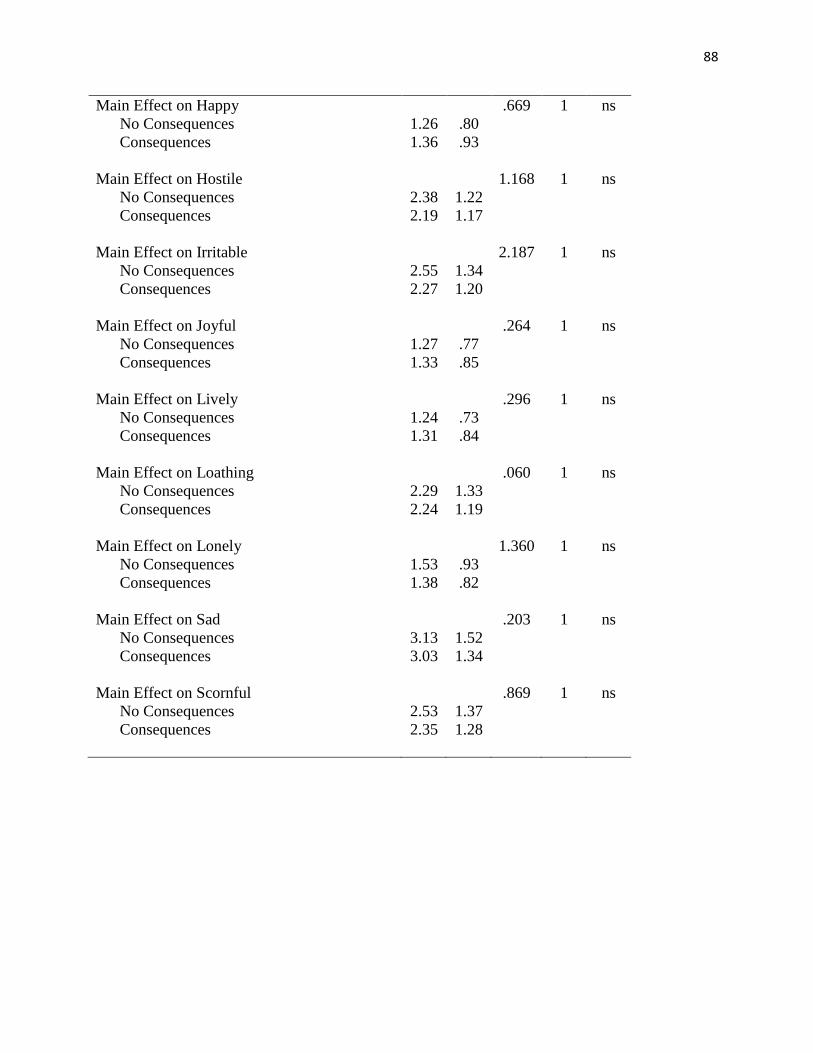
88
Main Effect on Happy .669 1 ns
No Consequences 1.26 .80
Consequences 1.36 .93
Main Effect on Hostile 1.168 1 ns
No Consequences 2.38 1.22
Consequences 2.19 1.17
Main Effect on Irritable 2.187 1 ns
No Consequences 2.55 1.34
Consequences 2.27 1.20
Main Effect on Joyful .264 1 ns
No Consequences 1.27 .77
Consequences 1.33 .85
Main Effect on Lively .296 1 ns
No Consequences 1.24 .73
Consequences 1.31 .84
Main Effect on Loathing .060 1 ns
No Consequences 2.29 1.33
Consequences 2.24 1.19
Main Effect on Lonely 1.360 1 ns
No Consequences 1.53 .93
Consequences 1.38 .82
Main Effect on Sad .203 1 ns
No Consequences 3.13 1.52
Consequences 3.03 1.34
Main Effect on Scornful .869 1 ns
No Consequences 2.53 1.37
Consequences 2.35 1.28

89
Table 18
Pearson Correlation Coefficients for Angry and Reputation
Variables Angry Reputation
Angry -- -.403**
Reputation -- *p<.05; **p<.01

90
Table 19
Pearson Correlation Coefficients for Sad and Reputation
Variables Sad Reputation
Sad -- -.174**
Reputation -- *p<.05; **p<.01

91
Table 20
Pearson Correlation Coefficients for Happy and Reputation
Variables Happy Reputation
Happy -- .448**
Reputation -- *p<.05; **p<.01

92
Table 21
Hierarchical Regression Results: Reputation (N = 152)
Model 1 Model 2 Model 3
Variables b ß b ß b ß
Demographics
Gendera
-4.235
(1.062)
*** -.310 -3.018
(.949)
** -.221 -2.500
(.872)
** -.183
Age
-.967
(.519)
-.146 -.286
(.467)
-.043 -.254
(.424)
-.038
Household Income -.521
(.418)
-.097 -.388
(.367)
-.072 -.388
(.341)
-.072
Education -.470
(.525)
-.070 -.753
(.463)
-1.628 -.866
(.430)
-.129
Social Identity
Identify with CEO
1.411
(.366)
*** .268 .901
(.345)
* .171
Identify with Parents
-1.707
(.286)
*** -.413 -1.039
(.286)
*** -.251
Emotion
Angry -.312
(.102)
** -.261
Sad -.068
(.145)
-.041
Happy .335
(.081)
*** .283
Intercept 26.138
(3.355)
*** 0 28.696
(3.283)
*** 0 28.017
(3.429)
*** 0
F 5.263 ** 12.298 *** 13.804 ***
R2 .125 .337 .467
R2Δ .125 .212 .129
Adjusted R2 .101 .310 .433
Note: Standard errors are shown in parentheses. a Reference group is male.
*p<.05; **p<.01; ***p<.001
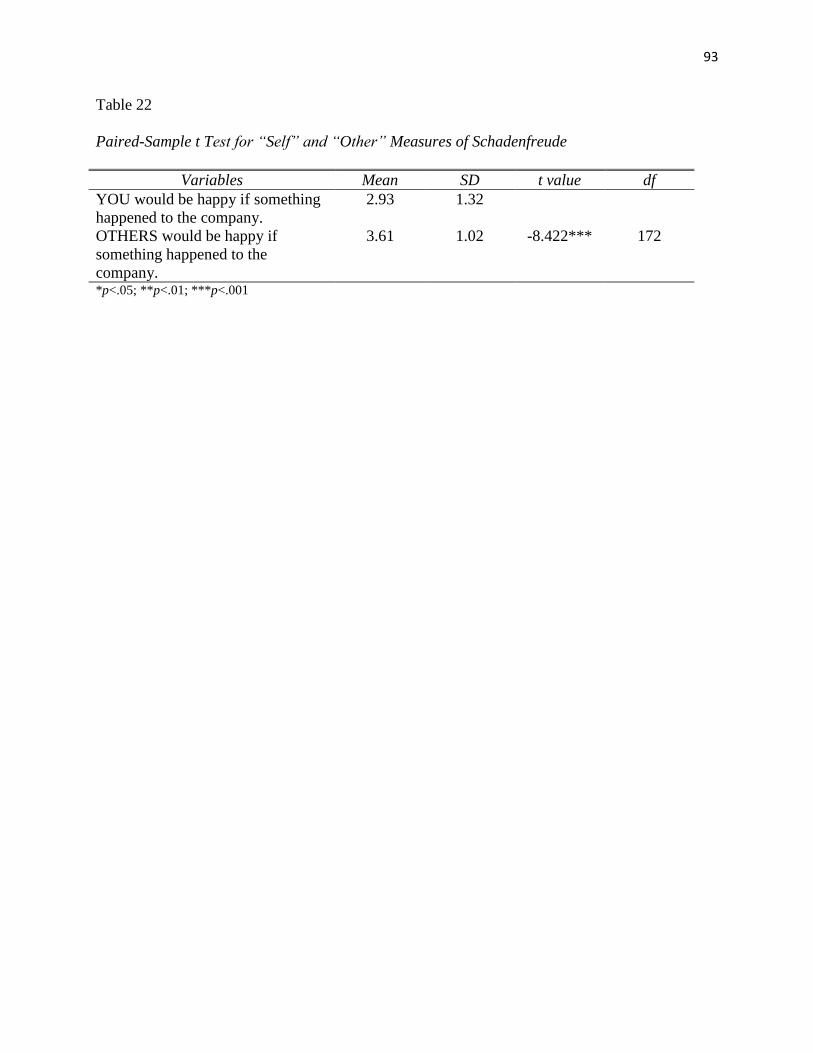
93
Table 22
Paired-Sample t Test for “Self” and “Other” Measures of Schadenfreude
Variables Mean SD t value df
YOU would be happy if something
happened to the company.
2.93 1.32
OTHERS would be happy if
something happened to the
company.
3.61 1.02 -8.422*** 172
*p<.05; **p<.01; ***p<.001

94
Table 23
Pearson Correlation Coefficients for Second Schadenfreude Measure and Reputation
Variables Schadenfreude Reputation
Schadenfreude -- -.316***
Reputation -- *p<.05; **p<.01; ***p<.001

95
Table 24
Pearson Correlation Coefficients for Identify with CEO and Reputation
Variables Identify with CEO Reputation
Identify with CEO -- .274**
Reputation -- *p<.05; **p<.01

96
Table 25
Pearson Correlation Coefficients for Identify with Parents and Reputation
Variables Identify with Parents Reputation
Identify with Parents -- -.442**
Reputation -- *p<.05; **p<.01

97
Figures

98
Figure 1
Jin, Pang and Cameron’s ICM Model

99
Figure 2
Demographic Comparisons between Sample and 2010 Census Data
0% 20% 40% 60% 80% 100%
Male
Female
Gender
Census
Sample
0% 20% 40% 60% 80% 100%
18-29
30-44
45-60
>60
Age
Census
Sample
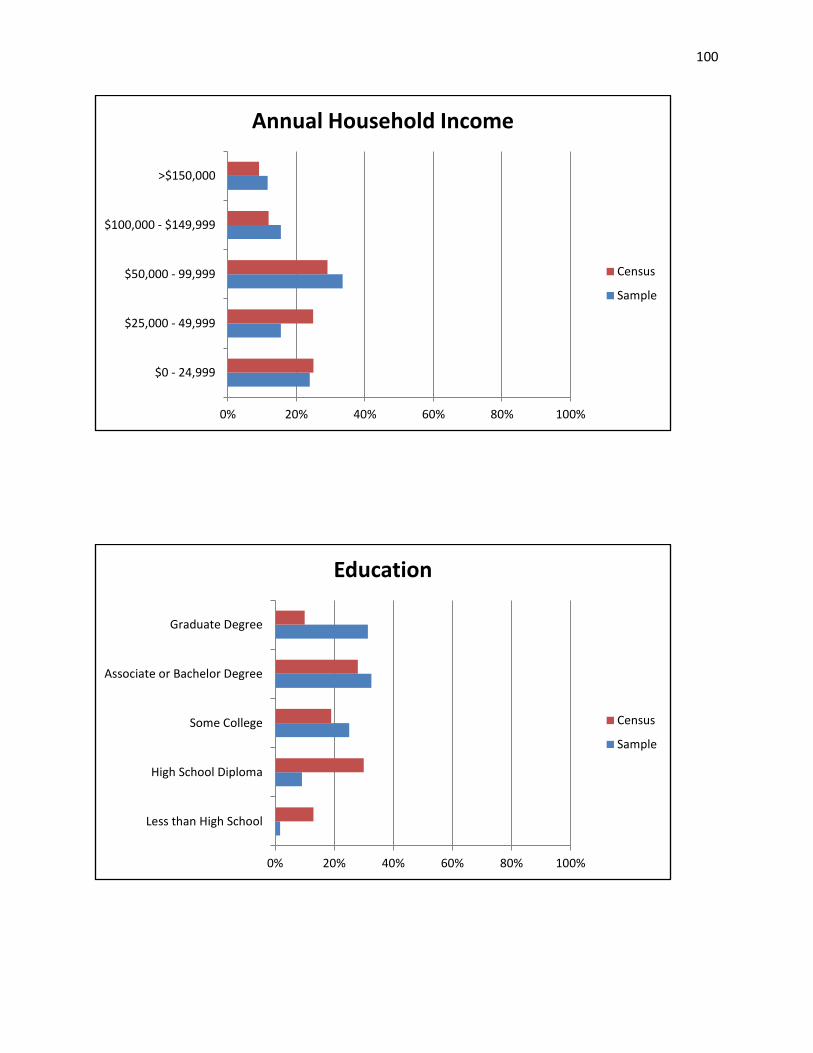
100
0% 20% 40% 60% 80% 100%
$0 - 24,999
$25,000 - 49,999
$50,000 - 99,999
$100,000 - $149,999
>$150,000
Annual Household Income
Census
Sample
0% 20% 40% 60% 80% 100%
Less than High School
High School Diploma
Some College
Associate or Bachelor Degree
Graduate Degree
Education
Census
Sample

101
0% 5% 10% 15% 20% 25% 30% 35% 40%
Northeast
Midwest
South
West
Location
Census
Sample

102
Figure 3
Third-Person Effect of Schadenfreude in Crisis (Uncollapsed and Collapsed Categories)
0%
5%
10%
15%
20%
25%
30%
35%
40%
45%
50%
CompletelyDisagree
SomewhatDisagree
Neutral SomewhatAgree
CompletelyAgree
Degree to which self/others would be happy if something bad happened to the company.
Self
Others
0%
10%
20%
30%
40%
50%
60%
70%
Disagree Neutral Agree
Degree to which self/others would be happy if something bad happened to the company.
Self
Others

103
Appendices
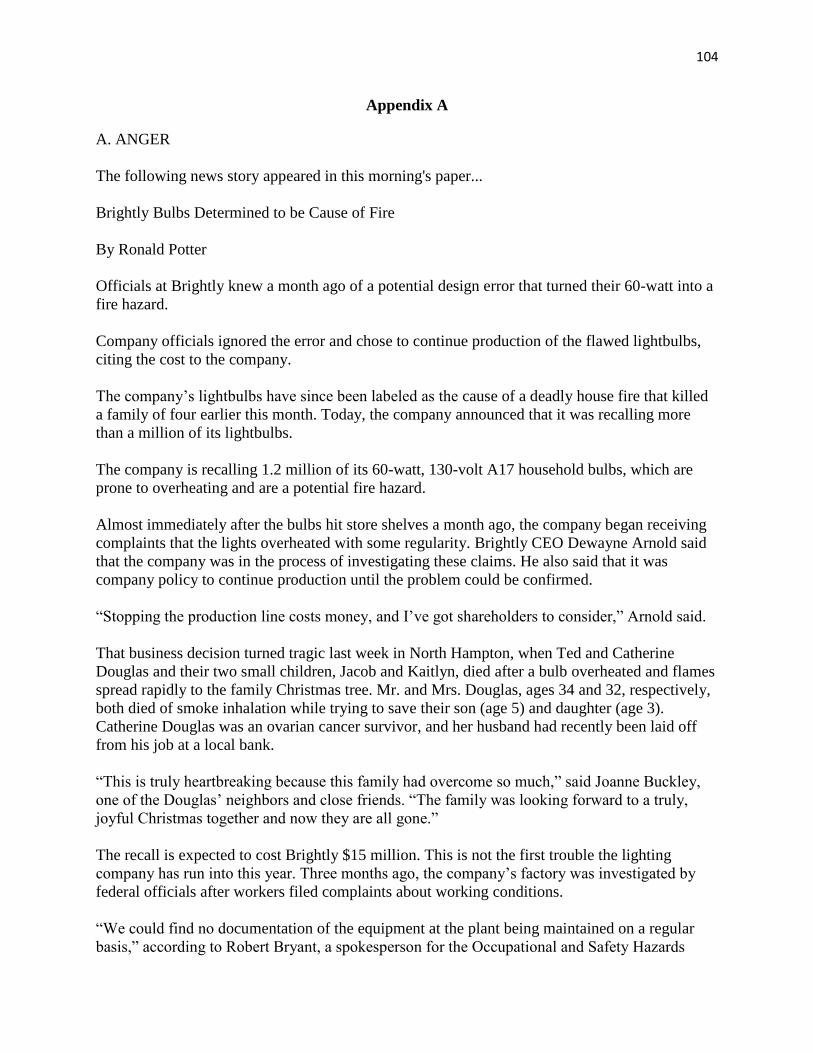
104
Appendix A
A. ANGER
The following news story appeared in this morning's paper...
Brightly Bulbs Determined to be Cause of Fire
By Ronald Potter
Officials at Brightly knew a month ago of a potential design error that turned their 60-watt into a
fire hazard.
Company officials ignored the error and chose to continue production of the flawed lightbulbs,
citing the cost to the company.
The company’s lightbulbs have since been labeled as the cause of a deadly house fire that killed
a family of four earlier this month. Today, the company announced that it was recalling more
than a million of its lightbulbs.
The company is recalling 1.2 million of its 60-watt, 130-volt A17 household bulbs, which are
prone to overheating and are a potential fire hazard.
Almost immediately after the bulbs hit store shelves a month ago, the company began receiving
complaints that the lights overheated with some regularity. Brightly CEO Dewayne Arnold said
that the company was in the process of investigating these claims. He also said that it was
company policy to continue production until the problem could be confirmed.
“Stopping the production line costs money, and I’ve got shareholders to consider,” Arnold said.
That business decision turned tragic last week in North Hampton, when Ted and Catherine
Douglas and their two small children, Jacob and Kaitlyn, died after a bulb overheated and flames
spread rapidly to the family Christmas tree. Mr. and Mrs. Douglas, ages 34 and 32, respectively,
both died of smoke inhalation while trying to save their son (age 5) and daughter (age 3).
Catherine Douglas was an ovarian cancer survivor, and her husband had recently been laid off
from his job at a local bank.
“This is truly heartbreaking because this family had overcome so much,” said Joanne Buckley,
one of the Douglas’ neighbors and close friends. “The family was looking forward to a truly,
joyful Christmas together and now they are all gone.”
The recall is expected to cost Brightly $15 million. This is not the first trouble the lighting
company has run into this year. Three months ago, the company’s factory was investigated by
federal officials after workers filed complaints about working conditions.
“We could find no documentation of the equipment at the plant being maintained on a regular
basis,” according to Robert Bryant, a spokesperson for the Occupational and Safety Hazards

105
Administration (OSHA), which cited the plant in September. “The response we got from the
management at Brightly noncommittal. It seems as though they were unwilling to make the
adjustments for the safety of their workers and, ultimately, their customers.”
B. SADNESS
The following news story appeared in this morning's paper...
Local Family Killed in Tragic House Fire
By Ronald Potter
It had been a rough year for the Douglas family.
Ted Douglas, 34, had been laid off from his job at Northern Bank after 15 years, a victim of the
continued recession. Catherine, 32, was diagnosed with ovarian cancer in January.
But as 2012 came to a close, things were starting to look up. Family friends said Catherine was
in remission, Ted had a job lead, and the couple was looking forward to spending Christmas with
their son Jacob, 5, and daughter, Kaitlyn, 3.
But last week, the entire Douglas family died in a house fire when a Brightly lightbulb
overheated, and flames spread rapidly to the family’s Christmas tree. Ted and Catherine Douglas
both died of smoke inhalation trying to save their children.
“This is truly heartbreaking because this family had overcome so much,” said Joanne Buckley,
one of the Douglas’ neighbors and close friends. “I had looked after Jacob and Kaitlyn quite a bit
over the past few months because Catherine had gone through a bout with ovarian cancer and
Ted was looking for a job after being laid-off last year. Finally, just last week, Catherine had
received a piece of good news from her doctor and Ted
thought he had a good lead on a position downtown. The family was looking forward to a truly,
joyful Christmas together and now they are all gone.”
On Tuesday, Brightly announced that it was recalling 1.2 million of its 60-watt, 130-volt A17
household bulbs because they are prone to overheat and can become a fire hazard to customers.
The faulty bulbs were the result of a technical error at their plant, which Brightly officials knew
about but did nothing to fix.
Brightly CEO Dewayne Arnold said that he was aware of the reported error and that the
company was in the process of investigating the claim, but that the policy was to continue
production until a problem could be confirmed. “Stopping the production line costs money and
I’ve got shareholders to consider,” he said.

106
Douglas’ father and father-in-law have declined interview requests but did confirm that they are
pondering legal action against Brightly, which was cited by the Occupational and Safety Hazards
Administration (OSHA) in September.
“We could find no documentation of the equipment at the plant being maintained on a regular
basis,” according to Robert Bryant, a spokesperson for OSHA, “The response we got from the
management at Brightly was noncommittal. It seems as though they were unwilling to make the
adjustments for the safety of their workers and, ultimately, their customers.”
C. and D. Consequence added: “***Story Update: In the weeks following this incident, OSHA referred
the Brightly case to the Department of Justice for criminal prosecution. The DOJ charged both the
company and Brightly CEO Dewayne Arnold with willfully violating OSHA safety standards. This
morning, the company was fined $147 million and Arnold was found guilty and sentenced to seven years
in federal prison.

107
Appendix B
This scale consists of a number of words and phrases that describe different feelings and
emotions. Read each item and indicate to what extent you feel this way after reading the article.
Use the following scale to record your answers:
1 2 3 4 5
very slightly
or not at all
a little moderately quite a bit extremely
____ alone
____ angry
____ blue
____ cheerful
____ delighted
____ disgusted
____ downhearted
____ energetic
____ enthusiastic
____ excited
____ happy
____ hostile
____ irritable
____ joyful
____ lively
____ loathing
____ lonely
____ sad
____ scornful

108
References
Allen, M. W., & Caillouet, R. H. (1994). Legitimation endeavors: Impression management
strategies used by an organization in crisis. Communication Monographs, 61(1), 44-62.
An, S. & Cheng, I. (2010). Crisis communications research in public relations journals: Tracking
research trends over thirty years. In W. T. Coombs & S.J. Holladay (Eds.), The handbook
of crisis communication (pp. 65-90). Malden, MA: Blackwell.
Ashforth, B. E. & Mael, F. (1989). Social identity theory and the organization. Academy of
Management Review, 14(1), 20-39.
Barnett, M. L., Jermier, J.M., & Lafferty, B.A. (2006). Corporate reputation: The definitional
landscape. Corporate Reputation Review. 9(1), 26-38.
Benoit, W. (1997). Image repair discourse and crisis communication. Public Relations Review,
23(2), 177-186.
Berry, W. D. (1993). Understanding regression assumptions. Series: Quantitative applications
in the social sciences. Newbury Park: Sage.
Bethlehem, J. (2010). Selection bias in web surveys. International Statistical Review 78(2), 161-
188.
Brown, B. & Perry, S. (1994). Removing the financial performance halo from fortune’s “most
admired” companies. The Academy of Management Journal, 37(5), 1347-1359.
Bureau of Labor Statistics. (2012). Volunteering in the United States – 2012. Retrieved from
http://www.bls.gov/news.release/volun.nr0.htm
Butler, D. A. (2003). The age of Cunard. Annapolis, MD: Lighthouse Press.

109
Cancel, A. E., Cameron, G. T., Sallot, L. M., & Mitrook, M. A. (1997). It depends: A
contingency theory of accommodation in public relations. Journal of Public Relations
Research, 9(1), 31-63.
Carmeli, A. (2005). Perceived external prestige, affective commitment, and citizenship
behaviors. Organization Studies, 26(3), 443-464.
Carter, S. M. (2006). The interaction of top management group, stakeholder, and situational
factors on certain corporate reputation management activities. Journal of Management
Studies, 43(5), 1145-1176.
Chi, D.-J. & Hung, H.-F. (2011). Crisis management of the pricing mistakes committed by Dell.
Management Decision, 49(6), 86-873.
Chia, S. C. & Wen, N. (2010). College men’s third-person perceptions about idealized body
image and consequent behavior. Sex Roles, 63, 542–555.
Chock, T. M. (2011). Is it seeing or believing? Exposure, perceived realism, and emerging
adults’ perceptions of their own and others’ attitudes about relationships. Media
Psychology, 14, 355-386.
Chock, T. M., Fox, J. R., Angelini, J. R., Lee, S. & Lang, A. (2007). Telling me quickly: How
arousing fast-paced PSAs decrease self-other differences. Communication Research,
34(6), 618-636.
Choi, Y., & Lin, Y. (2009). Consumer responses to Mattel product recalls posted on online
bulletin boards: Exploring two types of emotion. Journal of Public Relations Research,
21, 198-207.
Chun, R. (2005). Corporate reputation: meaning and measurement. International Journal of
Management Reviews, 7(2), 91-109.

110
Cikara, M. & Fiske, S. T. (2012). Stereotypes and schadenfreude: Affective and physiological
markers of pleasure at outgroup misfortunes. Social Psychological and Personality
Science, 3(1), 63-71.
Condon, S. (2010, June 15). Americans don't care if BP goes bankrupt paying for oil spill, poll
shows. CBS News. Retrieved from http://www.cbsnews.com/8301-503544_162-
20007755-503544.html
Coombs, W. T. (2007). Ongoing crisis communication: Planning, managing, and responding
(Second Ed.). Thousand Oaks, Calif.: Sage.
Coombs, W. T. (2007). Protecting organization reputations during a crisis: The development and
application of situational crisis communication theory. Corporate Reputation Review,
10(3), 163-177.
Coombs, W. T. (2010). Parameters for crisis communications. In W. T. Coombs & S. J. Holladay
(Eds.), The handbook of crisis communication (pp. 19-53). Malden, MA: Blackwell.
Coombs, W. T., Fediuk, T. A., & Holladay, S. J. (2007, March 8-11). Further explorations of
post-crisis communication and stakeholder anger: The negative communication dynamic
model. A paper presented at the 9th International Public Relations Research Conference,
Miami, FL.
Coombs, W. T. & Holladay, S. J. (2005). An exploratory study of stakeholder emotions: Affect
and crises, in Ashkanasy, N. M., Zerbe, W.J., & Hartel, Charmine, E.J. (eds.). The effect
of affect in organizational settings (Research on emotion in organizations, volume 1), pp.
263-280. Elsevier Ltd., Oxford.
Coombs, W. T., & Holladay, S. J. (2010). The handbook of crisis communications. Walden, MA:
Blackwell.
111
Cuhadar, E. & Dayton, B. (2011). The social psychology of identity and intergroup conflict:
From theory to practice. International Studies Perspective, (12)3, 273-293.
Davies, G., Chun, R., Da Silva, R. V. and Roper, S. (2003) Corporate Reputation and
Competitiveness, Routledge, London and New York .
Davison, W. P. (1983). The third-person effect in communication. Public Opinion Quarterly, 47,
1-15.
Dean, D. H. (2004). Consumer reaction to negative publicity: Effects of corporate reputation,
response, and responsibility for a crisis event Journal of Business Communication, 41(2),
192-211.
Dionisopoulos, G., & Vibbert, S. L. (1988). CBS vs. Mobil Oil: Charges of creative bookkeeping
in 1979. In H. R. Ryan (Ed.), Oratorical Encounters (pp. 241-251). New York:
Greenwood.
Dowling, G. R. (2004). Journalists’ evaluation of corporate reputations. Corporate Reputation
Review, 7 (2), 196-205.
Duck, J. M. & Mullin, B. A. (2006). The perceived impact of the mass media: Reconsidering the
3rd
-person effect. European Journal of Social Psychology, 25, 77-93.
Dutton, J. E, Dukerich, J. M, & Harquail, C. V. (1994). Organizational images and member
identification. Administrative Science Quarterly, 39, 239-263.
Ender, P. (2000). Linear statistical models: Regression – Data Transformation. Retrieved from
Lecture Notes Online Website:
http://www.philender.com/courses/linearmodels/notes1/trans1.html
Entman, R. M. (1993). Framing: Toward clarification of a fractured paradigm. Journal of
Communication, 43(4), 51-58.

112
Envy (2012). Merriam-Webster Online Dictionary. Retrieved from http://www.merriam-
webster.com/dictionary/envy
Fearn-Banks, K. (2006). Crisis communications: A casebook approach (Third ed.). Mahwah,
N.J.: Lawrence Earlbaum.
Feather, N. T. (1989). Values, achievement, and Justice: Studies in the psychology of
deservingness. New York: Kluwer Academic/Plenum Press.
Fombrun C. J. & Gardberg, N. (2000). Who’s tops in corporate reputation? Corporate Reputation
Review, 3(1): 13-17.
Fombrun, C. J., & Van Riel, C. (1997). The reputational landscape. Corporate Reputation
Review, 1(2), 5-13.
Fryxell, G. E. & Wang, J. (1994). The fortune corporate 'reputation' index: Reputation for what?
Journal of Management, 20(1), 1-14.
Fryxell, G. E. and Wang, J. (1994). The Fortune corporate 'reputation' index: Reputation for
what? Journal of Management, 20(1): 1-14.
Gotsi, M. & Wilson, A. M. (2001). Corporate reputation: Seeking a definition. Corporate
Communications, 6(1): 24–30.
Grunig, J. E. (1992). Excellence in public relations and communication management. Hillsdale,
N.J.: Erlbaum Associates.
Grunig, L. A. (1992). Activism: How it limits the effectiveness of organizations and how
excellent public relations departments respond. In J. E. Grunig (Ed.), Excellence in public
relations and communication management (pp. 503-530). Hillsdale, N.J.: Erlbaum and
Associates.

113
Hareli, S., & Weiner, B. (2002). Dislike and envy as antecedents of pleasure at another’s
misfortune. Motivation and Emotion, 26, 257–277.
Hartel, C., McColl-Kennedy, J. R., & McDonald, L. (1998). Incorporating attributional theory
and the theory of reasoned action within an affective events theory framework to produce
a contingency predictive model of consumer reactions to organizational mishaps.
Advances in Consumer Research, 25, 428-432.
Hearit, K. (1995). "Mistakes were made": Organizations, apologia, and crises of social
legitimacy. Communication Studies, 46(1-2), 1-17.
Heider, F. (1958). The psychology of interpersonal relations. New York: Wiley.
Hillenbrand, C. & Money, K. (2007). Corporate responsibility and corporate reputation: two
separate concepts or two sides of the same coin? Corporate Reputation Review, 10(4),
261-277.
Holmes, P. & Sudhaman, A. (2011). Top 10 Crises of 2010. The Holmes Report. Retrieved from
http://www.holmesreport.com
Horn, R. A. (2008). Data transformation. [PDF document]. Retrieved from Lecture Notes Online
Web site:
http://oak.ucc.nau.edu/rh232/courses/EPS625/Handouts/Data%20Transformation
%20Handout.pdf
Jin, Y. (2010). Making sense sensibly in crisis communication: How publics’ crisis appraisals
influence their negative emotions, coping strategy preferences and crisis response
acceptance. Communication Research, 37(4), 522-552.
Jin, Y., Liu, B.F, & Austin, L. (2011). Examining the role of social media in effective crisis
management: The effects of crisis origin, information form, and source on publics’ crisis

114
responses. Communication Research. Advance online publication.
doi:10.1177/0093650211423918
Jin, Y. & Pang, A. (2010). Future directions of crisis communication research: emotion in crisis
– the next frontier. In Coombs, W. T., & Holladay, S. J. The handbook of crisis
communication (pp. 677-682). Malden, MA: Blackwell.
Jin, Y., Pang, A. & Cameron, G. T. (2007). Integrated crisis mapping: Toward a publics-based,
emotion-driven conceptualization in crisis communication. Sphera Publica, 7, 81-95.
Kim, H. J. & Cameron, G. T. (2011). Emotions matter in crisis: The role of anger and sadness in
the public’s response to crisis news framing and corporate crisis response.
Communication Research 38(6), 826-855.
Kim, J., Kim, H., & Cameron, G. (2009). Making nice may not matter: The interplay of crisis
type, response type and crisis issue on perceived organizational responsibility. Public
Relations Review, 35(1), 86-88.
Kim, J., Kim, H. & Cameron, G. (2012). Finding primary publics: A test of the third-person
perception in corporate crisis situations. Journal of Public Relations Research, 24, 391-
408.
Kim, J., & Kiousis, S. (2012) The role of affect in agenda building for public relations:
Implications for public relations outcomes. Journalism & Mass Communication
Quarterly. 89(4), 656-676.
Kiousis, S., Popescu, C. & Mitrook, M. (2007). Understanding influence on corporate reputation:
an examination of public relations efforts, media coverage, public opinion, and financial
performance from an agenda-building and agenda-setting perspective. Journal of Public
Relations Research, 19(2), 147-165.

115
Leach, C. W. & Spears, R. (2008). “A vengefulness of the important”: The pain of in-group
inferiority and schadenfreude toward successful out-groups, Journal of Personality and
Social Psychology, 96(6), 1381-1396.
Leach, C. W. & Spears, R. (2009). Dejection at in-group defeat and schadenfreude toward
second- and third-party out-groups. American Psychological Association 9(5), 659-665.
Leach, C. W., Spears, R., Branscombe, N. R., & Doosje, B. (2003). Malicious pleasure:
Schadenfreude at the suffering of another group. Journal of Personality and Social
Psychology, 84(5), 932-943.
Liu, B. F., Austin, L. & Jin, Y. (2011). How publics respond to crisis communication strategies:
The interplay of information form and source. Public Relations Review, 37(4), 345-353.
Lo, V-H. & Wei, R. (2002). Third-person effect, gender, and pornography on the lnternet.
Journal of Broadcasting & Electronic Media, 46(1), 13-33.
Lyon, L., & Cameron, G. T. (2004). A relational approach examining the interplay of prior
reputation and immediate response to a crisis. Journal of Public Relations Research, 16,
213-241.
MacKenzie, S. B., & Lutz, R. J. (1989, April). An empirical examination of the structural
antecedents of attitude toward the ad in an advertising pretesting context. Journal of
Marketing, 53, 48-65.
MacMillan, K, Money, K, Downing, S, & Hillenbrand, C. (2004). Giving your organisation
spirit: An overview and call to action for directors on issues of corporate governance,
corporate reputation and corporate responsibility. Journal of General Management,
30(2), 15.
116
Mahon, J. F. (2002). Corporate reputation: A research agenda using strategy and stakeholder
literature. Business & Society, 41, 415-445.
Moon, B. B., & Rhee, Y. (2012). Message strategies and forgiveness during crises: Effects of
causal attributions and apology appeal types on forgiveness. Journalism & Mass
Communication Quarterly. 89(4), 677-694.
Malhotra, N., & Kuo, A. G. (2009). Emotions as moderators of information cue use: Citizen
attitudes towards Hurricane Katrina. American Politics Research, 37, 301-326.
Nabi, R. L. (2003). Accessibility, information seeking, and policy preference? Exploring the
framing effects of emotion: Do discrete emotions differentially influence information.
Communication Research, 30, 224-247.
Nietzsche, F. (1967). On the genealogy of morals. (W. Kaufmann, W. & Hollingsdale, R. J.,
Trans.). New York: Random House. (Original work published 1887). Retrieved from
https://www.princeton.edu/~ereading/Friedrich%20Nietzsche,%20Second%20EssayGuilt
%20Bad%20Conscience%20and%20the%20Like.pdf.
Perloff, R. M. (1993). Third-person effect research 1983-1992: A review and synthesis.
International Journal of Public Opinion Research, 5(2), 167-184.
Portmann, J. (2000). When bad thing happen to good people. New York: Routledge.
Raszkowski, R. R.(2008). Data cleaning: Tips for making your data suitable for analysis
[PowerPoint slides]. Retrieved from http://sunburst.usd.edu/~rrraszko/workshops0708/4-
Data%20Cleaning%20-%20handout.pdf
RepTrak™. (2010). On Reputation Institute Website. Retrieved December 1, 2010, from
http://www.reputationinstitute.com/advisory-services/reptrak

117
Reputation Institute. (2010). Global reputation pulse 2010; U.S. top-line summary. New York,
NY: Reputation Institute.
Reputation. (2010). In Merriam-Webster Online Dictionary. Retrieved December 3, 2010, from
http://www.merriam-webster.com/dictionary/reputation
Scherr, S. & Reinemann, C. (2011). Belief in a Werther effect: Third-person effects in the
perceptions of suicide risk for others and the moderating role of depression. Suicide and
Life-Threatening Behavior 41(6), 624-634.
Shin, D-H. & Kim, J. K. (2011). Alcohol product placements and the third-person effect.
Television & New Media, 12(5), 412–440.
Sigfusdottir, I-D., Farkas, G. & Silver, E. (2004). The role of depressed mood and anger in the
relationship between family conflict and delinquent behavior. Journal of Youth and
Adolescence, 33(6), 509-522.
Smith, R. D. (2009). Strategic planning for public relations, 3rd
edition. New York: Routledge.
Smith, R. H., Powell, C. A. J., Combs, D. J. Y., & Schurtz, D. R. (2009). Exploring the when
and why of schadenfreude. Social and Personality Psychology Compass, 3(4), 530-546.
Smith, R. H., Turner, T. J., Garonzik, R., Leach, C. W., Urch-Druskat, V., & Weston, C. M.
(1996). Envy and schadenfreude. Personality and Social Psychology 22, 158-168.
Stakeholder. (2010). In Merriam-Webster Online Dictionary. Retrieved December 3, 2010, from
http://www.merriam-webster.com/dictionary/stakeholder
Sundie, J. M., Ward, J. C., Beal, D. J., Chin, W. W., & Geiger-Oneto, S. (2009). Schadenfreude
as a consumption-related emotion: Feeling happiness about the downfall of another’s
product. Journal of Consumer Psychology, 19, 356-373.

118
SurveyMonkey. (2012). SurveyMonkey Help Center. Retrieved from
http://help2.surveymonkey.com/sm_home
Tajfel, H. (1974). Social identity and intergroup behavior. Social Science Information 13(2), 65-93.
Takahashi, H., Kato, M, Matsuura, M., Mobbs, D. Suhara, T. & Okubo, Y. (2009). When your
gain is my pain and your pain is my gain: Neural correlates of envy and schadenfreude.
Science 323(13), 937-939.
U.S. Census Bureau. (March, 2011). Population distribution and change: 2000-2010. Retrieved
from http://www.census.gov/prod/cen2010/briefs/c2010br-01.pdf
U.S. Census Bureau. (May, 2011). Age and sex composition: 2010. Retrieved from
http://www.census.gov/prod/cen2010/briefs/c2010br-03.pdf
U.S. Census Bureau. (2012). The 2012 statistical abstract. Retrieved from
http://www.census.gov/compendia/statab/cats/population.html
U.S. Census Bureau. (September, 2012). Annual social and economic (ASEC) supplement.
Retrieved from
http://www.census.gov/hhes/www/cpstables/032012/hhinc/hinc01_000.htm
U.S. Census Bureau. (January, 2013). Educational attainment in the United States: 2012 –
detailed tables. Retrieved from
http://www.census.gov/hhes/socdemo/education/data/cps/2010/tables.html
van Dijk, W. W., Ouwerkerk, J. W., van Koningsbruggen, G. M. & Wesseling, Y. M. (2012).
“So you wanna be a pop star?”: Schadenfreude following another's misfortune on TV.
Basic and Applied Social Psychology, 34(2), 168-174.
van Dijk, W. W., Ouwerkerk, J. W., Wesseling, Y. M. & van Koningsbruggen, G. M.(2011).
Towards understanding pleasure at the misfortunes of others: The impact of self-
evaluation threat on schadenfreude. Cognition & Emotion, 25(2), 360-368.

119
van Dijk, W. W., van Koningsbruggen, G. M., Ouwerkerk, J.W. & Wesseling, J. W. (2011).
Self-esteem, self-affirmation, and schadenfreude. Emotion, 11(6), 1145-1449.
Walker, K. (2010). A systematic review of the corporate reputation literature: Definition,
measurement, and theory. Corporate Reputation Review, 12(4), 357-387.
doi:10.1057/crr.2009.26
Walsh, G. & Beatty, S. E. 2007. Customer- based corporate reputation of a service firm: scale
development and validation. Journal of the Academy of Marketing Science, 35, 127-143.
Wartick, S. L. (1992). The relationship between intense media exposure and change in corporate
reputation. Business Society, (31), 33-48. doi:10.1177/000765039203100104.
Watson, D., & Clark, L. A. (1994). The Panas: X manual for the positive and negative
schedule—Expanded form. Unpublished manuscript. Iowa: University of Iowa.
Watson, D., Clark, L. A., Tellegen, A. (1988). Development and measurement of brief measures
of positive and negative affect: The PANAS scale. Journal of Personality and Social
Psychology, 54(6), 1063-1070.
Weiner, B. (1985). An attributional theory of achievement motivation and emotion.
Psychological Review, 92(4), 548-573.
WRCB Channel 3 Eyewitness News (Feb. 4, 2012). In Facebook [Fan Page]. Retrieved April 21,
2012 from https://www.facebook.com/WRCBtv/posts/205792152852378
Yang, S. & Grunig, J. (2005). Decomposing organisational reputation: The effects of
organisation-public relationship outcomes on cognitive representations of organisations
and evaluations of organisational performance. Journal of Communication Management,
9(4), 305-325.

120
Ziakas, T. (1999). Titanic and public relations: A case study. Journal of Public Relations
Research, 11(2), 105-123.

121
Kristi S. Gilmore, APR Curriculum Vitae
P.O. Box 37155 Syracuse, NY 13235
(205) 612-4750 [email protected]
SUMMARY
Public relations professional with 20 years of experience in corporate communications,
strategic public relations, nonprofit communications, and crisis communications.
Assistant professor with experience developing and teaching public relations courses at the
undergraduate and graduate levels.
Ph.D. candidate (ABD) with research focus on crisis communications and corporate
reputation.
EDUCATION
S.I. Newhouse School of Public Communications, Syracuse University, Syracuse, N.Y.
Ph.D., Mass Communications, May 2013
Dissertation: The Impact of Schadenfreude as an Emotional Frame in Crisis
Communications on Perception of Corporate Reputation
Advisor: Dennis F. Kinsey, Ph.D.
University of West Florida, Pensacola, Fla.
M.A., Communications, August 2009
Birmingham-Southern College, Birmingham, Ala.
B.A., Psychology, May 1987
TEACHING EXPERIENCE
Texas Tech University, College of Media and Communication Assistant Professor, Beginning July 2013
PR 3312 PR Writing, Summer 2013 (Scheduled)
PR 4301 Crisis Communications – Special Topics, Fall 2013 (Scheduled)
PR 3312 PR Writing, Fall 2013 (Scheduled)
Syracuse University, S.I. Newhouse School of Public Communications
Adjunct Professor, August 2010 – May 2013
Graduate Classes
PRL 530 Media Relations for Public Relations Professionals, Summer 2013 (Scheduled)
Co-developed and taught special topics course to provide public relations
graduate students with an advanced knowledge of how to build relationships and
work with the media through a variety traditional and digital platforms.
PRL 614 Advanced Public Relations Writing for Digital Platforms, Fall 2011

122
Co-developed syllabus and materials for new course designed to introduce
graduate students to the unique challenges in delivering salient messages through
digital platforms. Student Eval: 4.59/5.0 Newhouse Avg. 4.36/5.0
PRL 604 Public Relations Writing, Fall 2010
Introduced students to varied communication tools used in public relations and
provided opportunity for students to practice delivering messages to specific
audiences using these tools. Student Eval: 4.94/5.0 Newhouse Avg. 4.35/5.0
Undergraduate Classes
PRL 215 Advanced Public Relations Writing for a Digital World, Spring 2012
Re-designed syllabus and materials for new course designed to introduce
undergraduate students to the unique challenges in delivering salient messages
through digital platforms. Student Eval: 4.52/5.0 Newhouse Avg. 4.39/5.0
PRL 300 Public Relations Campaigns, Spring 2011
Taught students to prepare a strategic public relations plan and provided them
with an opportunity to work with local charitable organization to develop and
implement a campaign from beginning to end. Student Eval: 4.6/5.0 Newhouse
Avg. 4.38/5.0
University of Alabama at Birmingham
Co-Instructor, 2008
MC 300 Special Topics in Public Relations, Fall 2008
Worked with public relations seniors on how to best apply the skills they had
learned in the classroom to “real world” situations.
GUEST LECTURES
S.I. Newhouse School of Public Communications, Syracuse University
- Media Pitching, PRL 214: Writing for News and Public Relations, 2012
- The Art of the Press Release, PRL 600: Public Relations Writing for Public Diplomacy,
2011
- Transition to Public Relations Practitioners, PRL 497: Public Relations Management,
2010
- Public Relations Boot Camp, COM 107: Communications and Society, 2010
- PR Management: The Good, Bad and Ugly, COM 107: Communications and Society,
2010
- PR Management: The Good, Bad and Ugly, PRL497: Communications and Society, 2010
Samford University, Birmingham Alabama
- The FBI is Downstairs and We Don’t Have a Plan!, JMC492: PR for Nonprofits, 2009

123
PEER-REVIEWED PUBLICATIONS
Waters, R. & Gilmore, K. S. (Accepted for Publication). Stewardship and the political process:
Improving the political party-constituent relationship through public relations. In
Handbook of Public Diplomacy. G. Golan, S. Yang, and D. Kinsey (Eds.). Wiley-
Blackwell.
PEER-REVIEWED CONFERENCE PRESENTATIONS
Gilmore, K. S. & Kinsey, D. F. (March 2013). “New media: Reshaping future communicators’
self-perceived role in crisis.” Paper presented at the 16th
Annual International Public
Relations Research Conference, Miami, Fla.
Chen, G. M., Schweisberger, V. N., & Gilmore, K. S. (May 2012). “Conductor effect”: Violent
video game play extends anger, leading to triggered displaced aggression among women
players. Paper presented at the International Communication Association Annual
Conference, Games Studies Division, Phoenix, Ariz.
Gilmore, K. S. (March 2012). Corporate reputation: Is Fortune a factor? Paper presented at the
15th
Annual International Public Relations Research Conference, Miami, Fla.
*University of Miami School of Communication Top Student Paper Award
Gilmore, K. and Dolan, E. (March 2011). Social networking sites: Taking care of business.
Paper presented at the AEJMC Midwinter Conference, Communication Technology
Division, Norman, Okla.
RESEARCH APPOINTMENTS & EDITORIAL REVIEW
Research Assistant, Department of Public Relations, Syracuse University, 2012
Principal Investigator: Guy Golan, Ph.D.
Research related to public relations in public diplomacy.
Research Assistant, Department of Public Relations, Syracuse University, 2011
Principal Investigator: Sung-Un Yang, Ph.D., Associate Professor
Research related to social media effects on corporate reputation.
Research Assistant, Department of Public Relations, Syracuse University, 2011
Principal Investigator: Shannon A. Bowen, Ph.D., Associate Professor
Research related to Dr. Bowen’s book on Strategic Communication Management
Book Proposal and Chapter Reviewer, Bedford/St. Martin, 2011
Reviewed book proposal and chapters for proposed public relations writing textbook.
SERVICE TO THE SCHOOL
S.I. Newhouse School of Communications Tenure Committee: Member, 2011-2012
Public Relations MA Program Comprehensive Exam Ad-Hoc Committee: Member, 2012

124
Newhouse Doctoral Student Organization: President, 2011-2012, Member, 2010-Present
Newhouse Student Representatives Committee: Member, 2011-2012
AWARDS & DISTINCTIONS
S.I. Newhouse School of Communications Ph.D. Fellowship: 2012-2013
Certificate in University Teaching, Future Professoriate Program: Syracuse University,
2012
University of Miami School of Communication Top Student Paper Award: 15th
Annual
International Public Relations Research Conference, 2012
Reviewer, Practical Public Relations Writing, First Edition: Bedford/St. Martins, 2011
The Honor Society of Phi Kappa Phi: Member, 2011-Present
Grunig Prime Research Fellowship: Finalist, 2011
Earned Accreditation in Public Relations (APR): 2002
Named “Top 40 Under 40” by the Birmingham Business Journal, 1996
Graduate Student of the Year: Communications Dept., University of West Florida, 1991
MEMBER ORGANIZATIONS
International Communications Association: Member, 2012-Present
Association for Education in Journalism and Mass Communication: Member, 2011-Present
Public Relations Society of America: Member, 2001-Present
Alabama Chapter of Public Relations Society of America: President-Elect, 2008; Board
Member/Ethics Officer, 2006-2007; National Delegate, 2006; Member, 2001-Present
PROFESSIONAL EXPERIENCE
The Gilmore Group Strategic Communications Consultant, 2008-Present
Develop and implement strategic communication activities for clients with a focus on public
relations, communications planning, media relations, marketing, crisis communications, and
project management. Clients: the Southeastern (Athletic) Conference, the University of Alabama
at Birmingham, Samford University, HealthSouth Corporation, Surgical Care Affiliates,
Diagnostic Health Corporation, the Alabama Chapter of the Public Relations Society of America,
and GTS Strategies.
HealthSouth Corporation (NYSE:HLS) Vice President, Corporate Communications, 2000-2008
Director of Communications, 1996-2000
Public Relations Manager, HealthSouth Medical Center, 1994-1996
Top communications executive for a publicly-traded healthcare provider that owned and
operated nearly 2,000 healthcare facilities with 50,000 employees across the country and abroad.
125
Developed and implemented five-year strategic crisis communication plan to
successfully navigate the company through a $3.6 billion corporate fraud crisis and
subsequent turnaround. Issues addressed included potential bankruptcy, company layoffs,
multiple executives pleading guilty, congressional hearings, charges filed by SEC and DOJ,
company restructuring and rebuilding. Received “survivor bonus” from the board of
directors in recognition for work done during the crisis.
Developed and implemented ongoing corporate communications strategy for “New
HealthSouth” including a repositioning strategy for communications when board of
directors voted to reposition the company, selling three of four operating divisions to focus
on core business. Success of open communication plan is demonstrated by decrease in
employee turnover during this transition period.
Developed and effectively utilized multi-media platforms, including patient and
employee magazines, in-house television network, and relevant Internet applications.
Created, developed and implemented nation-wide marketing strategies which included
program rollouts and volume building. Strategies involved internal media, external media,
advertising, training, and public relations and were developed as “turn-key” opportunities
for implementation across the country.
Implemented corporate social responsibility efforts to give back to the community.
Developed employee payroll deduction plan and coordinated numerous charitable activities
resulting in hundreds of thousands of dollars raised for United Way, the Alabama Sports
Foundation, the national Arthritis Foundation, UCP, Grammys in the Schools, NBA, the
Red Cross, and others.
Birmingham Area Chamber of Commerce – 4,000-member business organization.
Sports and Media Director, 1991-1994, Birmingham, Ala.
U.S. Olympic Committee – National Governing Body for all U.S. Olympic activities.
Intern/Coordinator, Media and Public Information, 1991, Colorado Springs, Colo.
Triad Systems – Computer hardware and software provider for automotive aftermarket.
Sales Representative, 1987-1989, Tampa, Fla. and Columbia, S.C.
Juvenile Alternative Services Programs – Prevention program for first-time offenders.
Counselor, 1987, Pensacola, Fla.
PROFESSIONAL PRESENTATIONS
PRSSA Summit: PR Interviewing Skills, February 2009
Southeastern (Athletic) Conference: Public Relations Boot Camp, May 2009
APR Joint Accreditation Workshop: PR Law & Ethics, October 2008
PRSSA, UAB Chapter: Crisis Communications, 2008
Public Relations Council of Alabama State Conference: Surviving the HealthSouth Crisis, 2004
PRSA, Alabama Chapter: Multi-Media Marketing & PR Strategies, 2002

126
COMMUNITY SERVICE
Gateway Social Service Agency: Advisory Board Member, 2010-present; Board Member,
2007-2010; Development Chairman, 2009-2010; Secretary, 2008; Junior Board Member, 2000-
2010; Junior Board President, 2005
American Red Cross: Birmingham Chapter Disaster Volunteer, 2009
Medical Mission Trips to South Africa: Team Trainer, 2010; Volunteer, 2009
First Light Women’s Shelter: Volunteer, 2008-2010; Volunteer of the Month, January 2009
UCP of Greater Birmingham: Board of Directors, 2002-2006; Development Chairman, 2005-
2006
Bruno’s Memorial Classic (Senior PGA Event): Media Committee/Chairman, 1994-2002
SEC Baseball Tournament: VIP Committee Co-Chairman, 1996-1998
Multiple Sclerosis Society: Home Tour Media Chairman, 1998; MS Society Class of ’97
1996 Olympic Games Soccer Semi Finals: Assistant to the Birmingham Chairman, 1995-1996