The Impact of Product Quality on Consumer Satisfaction and ...
12
Scientific Research Journal of Economics and Business Management Abbreviated Key Title: Sci Res Jr Eco Bus Mgn.; ISSN 2788-9491 (Print) ISSN 2788-9505 (Online) Volume-1 | Issue-2 | Aug-Sep-2021 | Quick Response Code Journal homepage: https://isrpgroup.org/srjebm/ Copyright @ 2021 IARCON, All rights reserved. No part of this content may be reproduced or transmitted in any form or by any means as per the standard guidelines of fair use. Creative Commons License Open Access by IARCON is licensed under Creative Commons License a Creative Commons Attribution 4.0 International License. Article History Received: 10.08.2021 Accepted: 20.08.2021 Published: 31.08.2021 28 DOI: 10.47310/srjebm.2021.v01i02.004 Research Article The Impact of Product Quality on Consumer Satisfaction and Repurchase of Pizza in Sultanate of Oman Dr. Renjith Kumar. R 1 and Afrah Al Darrai Rashid Al Darrai 2 1 Lecturer in Marketing, Business Studies Department, University of Technology and Applied Sciences, Nizwa, Sultanate of Oman 2 B. Tech in Marketing, Business Studies Department, University of Technology and Applied Sciences, Nizwa, Sultanate of Oman *Corresponding author: Dr. Renjith Kumar. R Abstract: Omani population is influenced by the western dietary habits and there is increase in opting for pizza from international food chains. The study aims to identify the product quality attributes of pizza and its impact on customer satisfaction and repurchase. The objectives are to study the attributes of product quality that influence the purchase of Pizza and to identify the impact of product quality on consumer satisfaction and to examine the effect of customer satisfaction on repurchase. A sample size of 380 responses is collected from Nizwa. The most consistent variable that influence consumers related to the product quality of pizza is menu varieties and the consistency of pizza quality. Product quality of Pizza contributes 3% to satisfaction of pizza consumption. There is a moderate positive correlation between satisfaction and repurchase. Satisfaction of pizza consumption contributes 28% to repurchase of pizza. Keywords: Pizza, product quality, consumer satisfaction, Repurchase. INTRODUCTION According to a report in Oman Daily (October 22, 2020) Oman market has been experiencing rapid socio- cultural changes since the past few years, mainly due to the accelerating economy, which allowed people from the country to travel to western countries for tourism and education, thus, exposing them to western food and culture. The market study revealed a lot of opportunities for major tourism initiatives. Oman is moving toward becoming a world-class global tourism hub, backed by competitive advantages that attract international travelers looking for new experiences. This creates a huge opportunity for pizza restaurants in the country. As westernization is influencing consumers‟ dietary habits, Oman population is increasingly opting for pizza from international food chains, like Domino‟s and Pizza Hut. As a result, international food chains are continuously expanding their stores in the country to continue dominating the market share. The growth of the online food delivery market is significantly driving the pizza restaurants market growth. This is due to the rising young population, enhanced purchasing power, internet connectivity, and modern and changing lifestyles. Omani pizza restaurants market is competitive and fragmented and comprises regional and international competitors. The United States-based fast- food chains continue to dominate the pizza restaurant sector in this region (Oman Daily, October 22, 2020). Omani restaurants market is anticipated during the forecast period (2021-2026). The increasing demand for home delivery of pizza, aided by the increasing internet connectivity and consumer spending, is projected to extensively drive the market growth. Moreover, the strong influence of western culture, especially in the food sector, further assists the growth of pizza consumption in Oman. However, the rising burger chains and other fast- food chains with more economical and satiating food offerings entice the larger share of consumers. Within the GCC, Oman is likely to witness the highest growth at 4.6% in terms of food consumption which is anticipated to grow from 3.2 million MT in 2018 to 4.0 million MT in 2023. Population and real GDP growth of 3.2% and 2.5%, respectively during the period will be a major factor driving the food
Transcript of The Impact of Product Quality on Consumer Satisfaction and ...

Scientific Research Journal of Economics and Business Management Abbreviated Key Title: Sci Res Jr Eco Bus Mgn.; ISSN 2788-9491 (Print)
ISSN 2788-9505 (Online)
Volume-1 | Issue-2 | Aug-Sep-2021 |
Quick Response Code
Journal homepage:
https://isrpgroup.org/srjebm/ Copyright @ 2021 IARCON, All rights reserved.
No part of this content may be reproduced or
transmitted in any form or by any means as
per the standard guidelines of fair use.
Creative Commons License Open Access by
IARCON is licensed under Creative Commons
License a Creative Commons Attribution 4.0
International License.
Article History Received: 10.08.2021
Accepted: 20.08.2021
Published: 31.08.2021
28
DOI: 10.47310/srjebm.2021.v01i02.004
Research Article
The Impact of Product Quality on Consumer Satisfaction and
Repurchase of Pizza in Sultanate of Oman Dr. Renjith Kumar. R
1 and Afrah Al Darrai Rashid Al Darrai
2
1Lecturer in Marketing, Business Studies Department, University of Technology and Applied Sciences, Nizwa, Sultanate
of Oman 2B. Tech in Marketing, Business Studies Department, University of Technology and Applied Sciences, Nizwa, Sultanate
of Oman
*Corresponding author: Dr. Renjith Kumar. R
Abstract: Omani population is influenced by the western dietary habits and there is increase in opting for pizza from
international food chains. The study aims to identify the product quality attributes of pizza and its impact on customer
satisfaction and repurchase. The objectives are to study the attributes of product quality that influence the purchase of
Pizza and to identify the impact of product quality on consumer satisfaction and to examine the effect of customer
satisfaction on repurchase. A sample size of 380 responses is collected from Nizwa. The most consistent variable that
influence consumers related to the product quality of pizza is menu varieties and the consistency of pizza quality. Product
quality of Pizza contributes 3% to satisfaction of pizza consumption. There is a moderate positive correlation between
satisfaction and repurchase. Satisfaction of pizza consumption contributes 28% to repurchase of pizza.
Keywords: Pizza, product quality, consumer satisfaction, Repurchase.
INTRODUCTION According to a report in Oman Daily (October 22,
2020) Oman market has been experiencing rapid socio-
cultural changes since the past few years, mainly due to
the accelerating economy, which allowed people from
the country to travel to western countries for tourism
and education, thus, exposing them to western food and
culture. The market study revealed a lot of opportunities
for major tourism initiatives. Oman is moving toward
becoming a world-class global tourism hub, backed by
competitive advantages that attract international
travelers looking for new experiences. This creates a
huge opportunity for pizza restaurants in the country.
As westernization is influencing consumers‟ dietary
habits, Oman population is increasingly opting for pizza
from international food chains, like Domino‟s and Pizza
Hut. As a result, international food chains are
continuously expanding their stores in the country to
continue dominating the market share. The growth of
the online food delivery market is significantly driving
the pizza restaurants market growth. This is due to the
rising young population, enhanced purchasing power,
internet connectivity, and modern and changing
lifestyles. Omani pizza restaurants market is
competitive and fragmented and comprises regional and
international competitors. The United States-based fast-
food chains continue to dominate the pizza restaurant
sector in this region (Oman Daily, October 22, 2020).
Omani restaurants market is anticipated during the
forecast period (2021-2026).
The increasing demand for home delivery of pizza,
aided by the increasing internet connectivity and
consumer spending, is projected to extensively
drive the market growth. Moreover, the strong
influence of western culture, especially in the food
sector, further assists the growth of pizza
consumption in Oman.
However, the rising burger chains and other fast-
food chains with more economical and satiating
food offerings entice the larger share of consumers.
Within the GCC, Oman is likely to witness the
highest growth at 4.6% in terms of food consumption
which is anticipated to grow from 3.2 million MT in
2018 to 4.0 million MT in 2023. Population and real
GDP growth of 3.2% and 2.5%, respectively during the
period will be a major factor driving the food
Renjith Kumar. R & Afrah Al Darrai Rashid Al Darrai; Sci Res Jr Eco Bus Mgn.; Vol-1, Iss-2 (Aug-Sep, 2021): 28-38
29
consumption in the country. Tourism will also play a
key role in defining the upcoming food demand. (Alpen
Capital, GCC Food Industry, 2019). The Pizza
businesses are in severe competition in the present
market. Numerous brands are currently operating their
business in Oman such as Pizza Hut, Domino‟s Pizza,
Volare Pizzaria, La Fattoria Della Pizza, Italiano
Pizzeria and Pasta, Pizza Express, Fresco Oman, The
Pizza Company, Pizza Inn, Pizza and Pasta Broccoli,
Yellow Cab Pizza. Shakespeare and Co, Angelo‟s
Pizza. In Nizwa, the two leading Pizza brands that
operate in the market are Pizza Hut and Domino‟s
Pizza. Kandampully and Suhartanto, (2000) revealed
that customer satisfaction and customer loyalty have a
positive relationship. This research aims to examine the
factors such as quality of product, customer satisfaction
and impact on customer loyalty.
Product Quality Food quality is defined as one of the most critical
constituents of a dining performance and productivity,
(Namkung & Jang, 2008; Sulek & Hensley, 2004). Food
quality is main factor affecting on customer loyalty,
expressing customer's perspective; a primary determinant
for appealing customers and retaining them repeatedly, as
well as a core predictor of loyal level from customers,
(Jang & Ha, 2010). When it is compared with other
standards as service quality or environment, food quality
is the most crucial component of customer satisfaction,
(Sulek & Hensley 2004). There is a positive relationship
between food quality and customer satisfaction when
measuring the impact of this key term on satisfaction and
behavioural intention (Namkung & Jang, 2007). Product
quality is stated to comprise three main factors for
evaluation quality as "safety, appeal, and dietary
acceptability", (Sulek & Hensley, 2004) and it is always
the most important part impacting on customer
satisfaction which is equivalent with other factors in
restaurants as physical environment and service quality.
Singh and Sirdeshmukh (2000) found that food quality is
one the most important attributes that leads to customer
satisfaction. Other studies have also focused on food
quality, identifying three key components; taste,
appropriate temperature and presentation of the food
served (Goh et al., 2008; Kivela et al., 1999; Koo et al.,
1999; Namkung and Jang, 2007, 2008). These studies
found that food quality has a high impact on customer
satisfaction and brand loyalty. The relationship between
food quality and customer satisfaction in the fast food
industry is proven to be one key to success (Namin,
2017). Several components of food quality exist,
including, (1) the freshness of the ingredients, (2) taste,
(3) quality consistency, and (4) appearance (Namkumg
and Jang, 2007; Rozekhi et al., 2016).
Customer Satisfaction
Customer satisfaction is a psychological state that
results when the emotion surrounding disconfirmed
expectations is coupled with prior feelings about the
customer experience (Oliver 1999). Oliver (2014) stated
that satisfaction is the consumer's fulfillment response.
Kotler (2000) defines customer satisfaction as a
person‟s feelings of pleasure or disappointment
resulting from comparing a product‟s perceived
performance or outcome in relation to his/her
expectations. Customer satisfaction is a measure of how
an organisation‟s total product performs in relation to a
set of customers‟ requirements (Hill and Alexander,
2006., Shankar et al., 2003).
Customer Loyalty
Attitude and behaviour are two very crucial
dimensions in determining customer loyalty
(Kandampully & Suhartanto, 2000). The behaviour
dimension is the behaviour of customers towards re-
visiting a restaurant over a period of time (Bowen &
Shoemaker, 1998). The dimension of behaviour and
customer loyalty is usually shown through repeated
purchases (Wong & Sohal, 2003). Gremler and
Gwinner (2000) also found a positive relationship
between satisfaction and the intention to be a loyal
customer. According to Griffin (2005) definition of
customer loyalty as a manifestation of the behavior of
the units of decision making purchases continue - going
against the goods or services of a company that is
selected. Vanessa (2007) defines loyalty as a customer
commitment to defend in depth to repurchase of
products or services consistently in the future, although
the influence of the situation and marketing efforts have
potential to cause behavioral changes. The
characteristics of loyal customers by Grifin (2005) refer
to re-purchase on a regular basis, and show resistance to
the pull of competitors. According to Yuen and Chan
(2010) better product quality will maintain high level of
customer satisfaction, which encourages customers to
make future purchases.
Statement of the problem
Like in other Middle East countries, culture in
Oman is not just about shopping but also about going
out to eat (Aaron Allen Associates, 2013). While
majority of the GCC produce less food, Oman food
production has witnessed ample growth during the last
ten years. This rise is driven by high demand, better
efficiency and the need for better nutrition and work
very closely with local food producers to enhance
fortification programs across the food value chain
(Alpen Capital, GCC Food Industry, September 2019).
The food consumption is expected to grow at a rate of
4.6% annually. Oman is likely to witness the highest
growth at 4.6% in terms of food consumption which is
anticipated to grow from 3.2 million MT in 2018 to 4.0
million MT in 2023. Food quality is a major driving
force that motivates consumers towards pizza. Thus this
study attempts to identify the attributes of quality of
pizza and aims to analyse the customer satisfaction and
its effect on repurchase of pizza.
Renjith Kumar. R & Afrah Al Darrai Rashid Al Darrai; Sci Res Jr Eco Bus Mgn.; Vol-1, Iss-2 (Aug-Sep, 2021): 28-38
30
Significance of the study
Omani population is influenced by the western
dietary habits. Oman population is increasingly opting
for pizza from international food chains. The study aims
to identify the product quality attributes of pizza and its
impact on customer satisfaction and repurchase
(loyalty). This study will be very helpful for the Pizza
brand marketers to establish and survive in the existing
markets in Oman. Furthermore, they can expand their
markets and enter into new markets with more profits
from the existing markets. The results of this study
would be helpful for the marketers to satisfy their
customers and to make them loyal.
Objectives of the study
1. To study the attributes of Product Quality that
influence the purchase of Pizza.
2. To identify the impact of product quality on
consumer satisfaction.
3. To examine the effect of customer satisfaction on
repurchase.
LITERATURE REVIEW Shinde et al., (2018) studied the components of
customer satisfaction at Rolls Mania a fast food service
restaurant at Kolhapur City, India among 154
customers. Dining experience; accessibility,
convenience and affordability, and product test are the
important components of customer satisfaction. There is
a significant relationship between customer satisfaction
and customer loyalty. Abdullah, Ahasanul & Ferdous
(2018) conducted a study among 250 customers to
understand the relationships between customer loyalty
and factors of loyalty that contribute to loyalty towards
fast food restaurants in Malaysia such as KFC,
McDonalds and Dominos and Nando‟s chicken in
Kuala Lumpur, Malaysia. Customer loyalty is
associated with the quality of product, restaurants
environment, convenience and price and value towards
fast food businesses. Convenience and quality of food
has the most influence on customer loyalty. Restaurant
environment and price have no impact on customer
loyalty. Manikandan et al., (2015) focused on the
customers of Domino‟s pizza outlets in Chennai. They
studied the customer satisfaction in Domino‟s pizza
outlets, customer perception and customers‟ preference
about Dominos products. Customers' perceived value,
brand trust; customers' satisfaction, repeat purchase
behavior, and commitment are found to be the key
influencing factors of brand loyalty. Bhatnagar (2013)
examined the factors influencing the liking and
satisfaction of customers towards Dominos‟ Pizza in
Gwalior, India and found that all the factors showed
liking and satisfaction level in favour of Domino‟s
Pizza. Ossama and Sonia (2018) examined the
relationship between service design and product design
with customer satisfaction and customer‟s repurchasing
behaviour among 300 consumers in Pakistan. There is a
positive impact of product and process on consumer
repurchase behaviour. Buying behaviour is highly
influenced by product attributes and it positively
influence to shape repurchase behavior of consumers.
Phan and Nguyen, (2016) investigated the customers'
evaluation and perception about determinants
influencing on customer satisfaction at Vietnamese fast-
food restaurants. Respondents are likely satisfied and
interested in the decoration and design style in fast-food
restaurants in Vietnam because it almost generates the
comfortable and good feelings in order to enjoy and eat
their meals. Service quality and food quality, price and
environment elements have impact on customer
satisfaction as well as loyalty in the Vietnam fast-food
restaurant. Usman and Suresh (2016) explored the
factors influencing consumer‟s satisfaction towards
branded fast food outlets in Chennai city in India. The
factors include variety of product, quality of product,
accuracy of service, delivery time, store location, staff
courtesy, ambient conditions and overall satisfaction.
253 consumers were contacted from Chennai city who
are customers of KFC, Dominos, Subway, Pizza Hut
and Mc Donald‟s. Quality of product is more important
and there is an association between branded retail
outlets and overall satisfaction. Aymar and Joseph
(2019) determined the drivers of customer satisfaction
and brand loyalty at McDonald‟s restaurants in
Morocco from 150 participants. Price, food quality,
service quality, and physical environment affects
customer satisfaction and brand loyalty. Price fairness
at McDonald‟s increases both customer satisfaction and
brand loyalty. Food quality, such as taste, appropriate
temperature and food presentation, are significant
attributes leading to enhanced customer satisfaction, as
well as brand loyalty. Another research focused factors
for fast food industry in region of Peshawar, Pakistan
from 150 customers of Four fast food restaurants; KFC,
Chef, Arabian Chick, and Pizza Hut. Service quality
and brand are the key factors for satisfaction in fast
food industry in Peshawar, Pakistan. Brand, Service
quality, physical environment and promotion are the
key determinant of customer satisfaction in the
purchase of fast food industry. There is a significant
positive relationship between the promotion, service
quality, customer expectations, brand, physical
environment, price, and taste of the product to customer
satisfaction (Shahzad, Majid & Fahad, 2016). Nasiru
(2013) focused on identifying the relationship between
customer satisfaction and brand loyalty in the fast food
industry in United Kingdom from 100 customers of five
fast-food restaurants; Pizza Hut, KFC, Mc Donald‟s,
Burger King and Dominos in order to identify the
relationship between customer satisfaction and
customer loyalty. The findings showed that if the
customers are satisfied with the existing brands of fast
food companies then they are very less likely to get
attracted towards the other brands.
Research Gap
The researcher has identified that previous studies
focused only on fast foods exclusively. The satisfaction
Renjith Kumar. R & Afrah Al Darrai Rashid Al Darrai; Sci Res Jr Eco Bus Mgn.; Vol-1, Iss-2 (Aug-Sep, 2021): 28-38
31
of consumers in Pizza is not addressed in previous
studies. Product quality is the most important attribute
that influences consumers (Yuen and Chan 2010,
Namkung & Jang, 2008; and Sulek & Hensley, 2004).
This study focuses on the satisfaction of Omani
consumers and various attributes that influence Pizza
quality are addressed in this study. Moreover, such
studies on product quality, consumer satisfaction and
loyalty has not been conducted previously in Oman.
Thus, this study addresses these issues through this
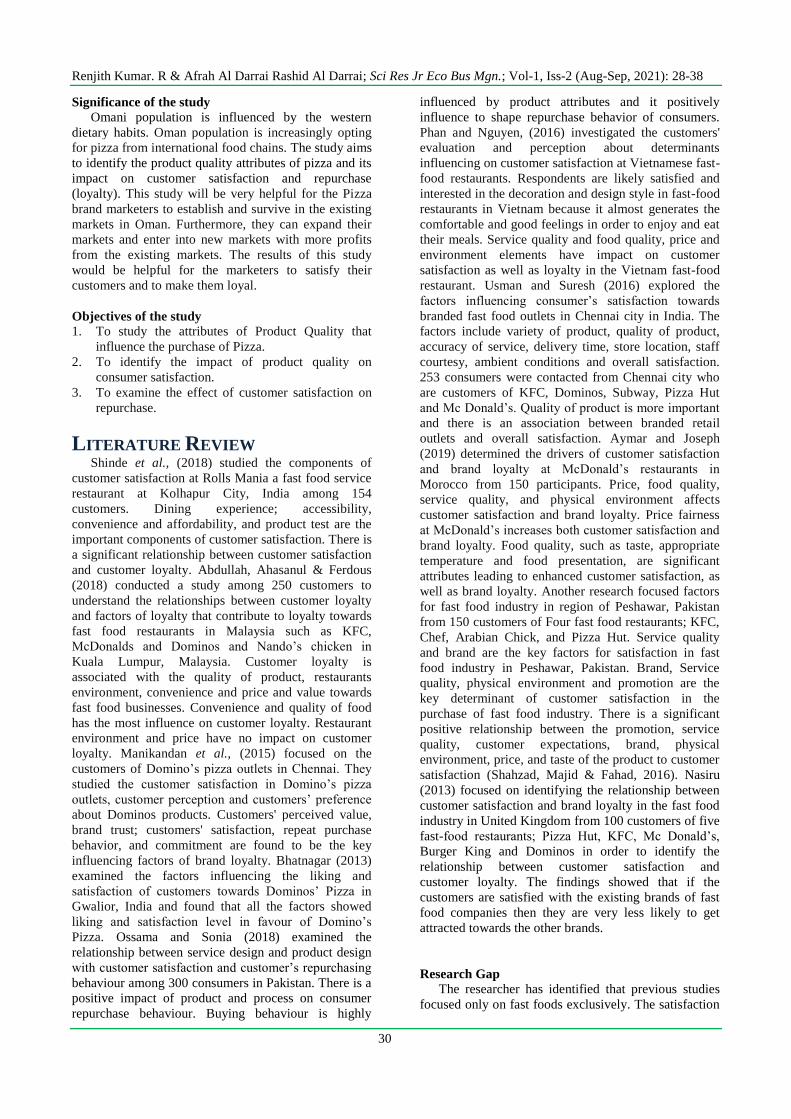
study. The conceptual frame work is:
RESEARCH METHODOLOGY It is a descriptive study as it covers the attributes of
product quality of pizza, customer satisfaction and
repurchase. The study area selected for this research is
Nizwa. The period of study is from October 2020 to
December 2020. According to the National Center for
Statistics and Information, Statistical Year Book (2019)
the population of Omanis in Nizwa in 2018 is 86,031.
This is taken as the sampling frame. The sample size is
determined as 384 (Krejcie and Morgan,1970)
respondents. The sampling method adopted is simple
random sampling method, where in the customers are
contacted on a random basis. Primary data is collected
with the help of a structured questionnaire. Pilot study
is to be conducted among 15 respondents to identify the
validity of the questions. The data is collected online
using Google form in both English and Arabic.
Coefficient of variation is used to find the most
consistent and reliability of variables. The impact is
measured with the help of regression method.
Hypothesis is tested using ANOVA and correlation
tests.
Analysis and Discussions
The analysis in this section is based on the data
collected from 380 sample responses.
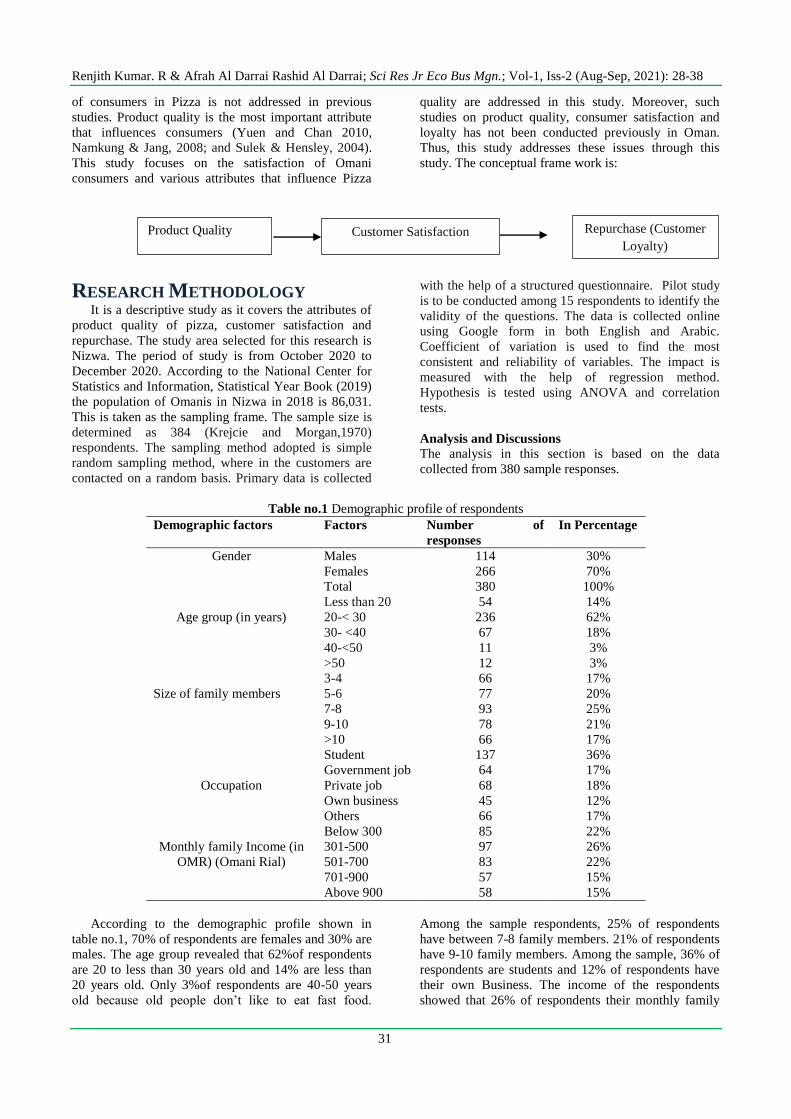
Table no.1 Demographic profile of respondents
Demographic factors Factors Number of
responses
In Percentage
Gender Males 114 30%
Females 266 70%
Total 380 100%
Age group (in years)
Less than 20 54 14%
20-< 30 236 62%
30- <40 67 18%
40-<50 11 3%
>50 12 3%
Size of family members
3-4 66 17%
5-6 77 20%
7-8 93 25%
9-10 78 21%
>10 66 17%
Occupation
Student 137 36%
Government job 64 17%
Private job 68 18%
Own business 45 12%
Others 66 17%
Monthly family Income (in
OMR) (Omani Rial)
Below 300 85 22%
301-500 97 26%
501-700 83 22%
701-900 57 15%
Above 900 58 15%
According to the demographic profile shown in
table no.1, 70% of respondents are females and 30% are
males. The age group revealed that 62%of respondents
are 20 to less than 30 years old and 14% are less than
20 years old. Only 3%of respondents are 40-50 years
old because old people don‟t like to eat fast food.
Among the sample respondents, 25% of respondents
have between 7-8 family members. 21% of respondents
have 9-10 family members. Among the sample, 36% of
respondents are students and 12% of respondents have
their own Business. The income of the respondents
showed that 26% of respondents their monthly family
Customer Satisfaction Repurchase (Customer
Loyalty)
Product Quality
Renjith Kumar. R & Afrah Al Darrai Rashid Al Darrai; Sci Res Jr Eco Bus Mgn.; Vol-1, Iss-2 (Aug-Sep, 2021): 28-38
32
income is from 301-500 OMR and 15% of respondent‟s family income is above 900 OMR.
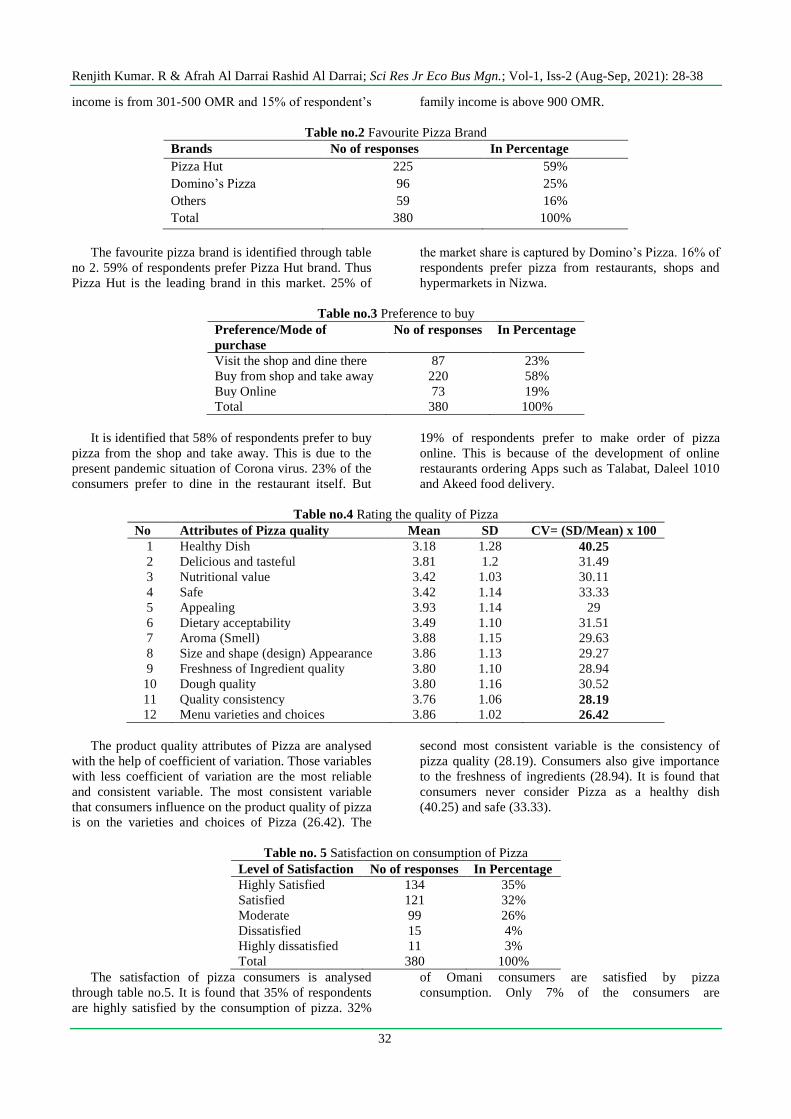
Table no.2 Favourite Pizza Brand
Brands No of responses In Percentage
Pizza Hut 225 59%
Domino‟s Pizza 96 25%
Others 59 16%
Total 380 100%
The favourite pizza brand is identified through table
no 2. 59% of respondents prefer Pizza Hut brand. Thus
Pizza Hut is the leading brand in this market. 25% of
the market share is captured by Domino‟s Pizza. 16% of
respondents prefer pizza from restaurants, shops and
hypermarkets in Nizwa.
Table no.3 Preference to buy
Preference/Mode of
purchase
No of responses In Percentage
Visit the shop and dine there 87 23%
Buy from shop and take away 220 58%
Buy Online 73 19%
Total 380 100%
It is identified that 58% of respondents prefer to buy
pizza from the shop and take away. This is due to the
present pandemic situation of Corona virus. 23% of the
consumers prefer to dine in the restaurant itself. But
19% of respondents prefer to make order of pizza
online. This is because of the development of online
restaurants ordering Apps such as Talabat, Daleel 1010
and Akeed food delivery.
Table no.4 Rating the quality of Pizza
No Attributes of Pizza quality Mean SD CV= (SD/Mean) x 100
1 Healthy Dish 3.18 1.28 40.25
2 Delicious and tasteful 3.81 1.2 31.49
3 Nutritional value 3.42 1.03 30.11
4 Safe 3.42 1.14 33.33
5 Appealing 3.93 1.14 29
6 Dietary acceptability 3.49 1.10 31.51
7 Aroma (Smell) 3.88 1.15 29.63
8 Size and shape (design) Appearance 3.86 1.13 29.27
9 Freshness of Ingredient quality 3.80 1.10 28.94
10 Dough quality 3.80 1.16 30.52
11 Quality consistency 3.76 1.06 28.19
12 Menu varieties and choices 3.86 1.02 26.42
The product quality attributes of Pizza are analysed
with the help of coefficient of variation. Those variables
with less coefficient of variation are the most reliable
and consistent variable. The most consistent variable
that consumers influence on the product quality of pizza
is on the varieties and choices of Pizza (26.42). The
second most consistent variable is the consistency of
pizza quality (28.19). Consumers also give importance
to the freshness of ingredients (28.94). It is found that
consumers never consider Pizza as a healthy dish
(40.25) and safe (33.33).
Table no. 5 Satisfaction on consumption of Pizza
Level of Satisfaction No of responses In Percentage
Highly Satisfied 134 35%
Satisfied 121 32%
Moderate 99 26%
Dissatisfied 15 4%
Highly dissatisfied 11 3%
Total 380 100%
The satisfaction of pizza consumers is analysed
through table no.5. It is found that 35% of respondents
are highly satisfied by the consumption of pizza. 32%
of Omani consumers are satisfied by pizza
consumption. Only 7% of the consumers are
Renjith Kumar. R & Afrah Al Darrai Rashid Al Darrai; Sci Res Jr Eco Bus Mgn.; Vol-1, Iss-2 (Aug-Sep, 2021): 28-38
33
dissatisfied. Thus 67% of Omani consumers are satisfied by the consumption of pizza.
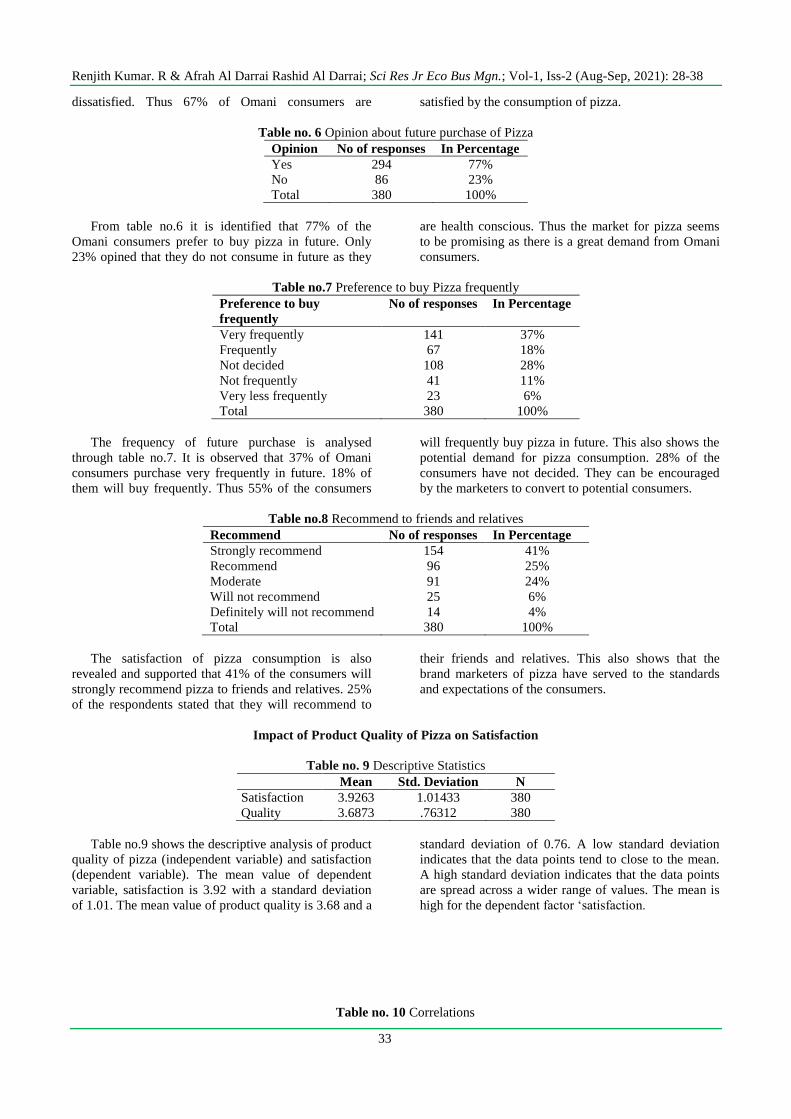
Table no. 6 Opinion about future purchase of Pizza
Opinion No of responses In Percentage
Yes 294 77%
No 86 23%
Total 380 100%
From table no.6 it is identified that 77% of the
Omani consumers prefer to buy pizza in future. Only
23% opined that they do not consume in future as they
are health conscious. Thus the market for pizza seems
to be promising as there is a great demand from Omani
consumers.
Table no.7 Preference to buy Pizza frequently
Preference to buy
frequently
No of responses In Percentage
Very frequently 141 37%
Frequently 67 18%
Not decided 108 28%
Not frequently 41 11%
Very less frequently 23 6%
Total 380 100%
The frequency of future purchase is analysed
through table no.7. It is observed that 37% of Omani
consumers purchase very frequently in future. 18% of
them will buy frequently. Thus 55% of the consumers
will frequently buy pizza in future. This also shows the
potential demand for pizza consumption. 28% of the
consumers have not decided. They can be encouraged
by the marketers to convert to potential consumers.
Table no.8 Recommend to friends and relatives
Recommend No of responses In Percentage
Strongly recommend 154 41%
Recommend 96 25%
Moderate 91 24%
Will not recommend 25 6%
Definitely will not recommend 14 4%
Total 380 100%
The satisfaction of pizza consumption is also
revealed and supported that 41% of the consumers will
strongly recommend pizza to friends and relatives. 25%
of the respondents stated that they will recommend to
their friends and relatives. This also shows that the
brand marketers of pizza have served to the standards
and expectations of the consumers.
Impact of Product Quality of Pizza on Satisfaction
Table no. 9 Descriptive Statistics
Mean Std. Deviation N
Satisfaction 3.9263 1.01433 380
Quality 3.6873 .76312 380
Table no.9 shows the descriptive analysis of product
quality of pizza (independent variable) and satisfaction
(dependent variable). The mean value of dependent
variable, satisfaction is 3.92 with a standard deviation
of 1.01. The mean value of product quality is 3.68 and a
standard deviation of 0.76. A low standard deviation
indicates that the data points tend to close to the mean.
A high standard deviation indicates that the data points
are spread across a wider range of values. The mean is
high for the dependent factor „satisfaction.
Table no. 10 Correlations
Renjith Kumar. R & Afrah Al Darrai Rashid Al Darrai; Sci Res Jr Eco Bus Mgn.; Vol-1, Iss-2 (Aug-Sep, 2021): 28-38
34
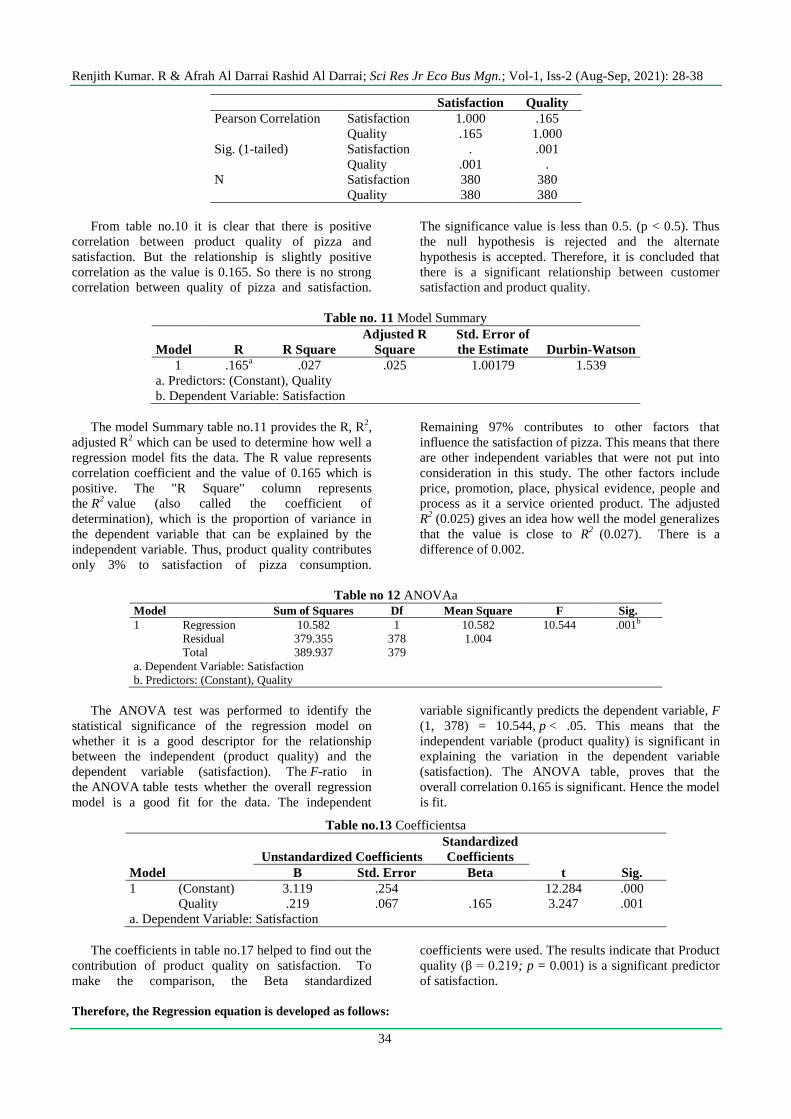
Satisfaction Quality
Pearson Correlation Satisfaction 1.000 .165
Quality .165 1.000
Sig. (1-tailed) Satisfaction . .001
Quality .001 .
N Satisfaction 380 380
Quality 380 380
From table no.10 it is clear that there is positive
correlation between product quality of pizza and
satisfaction. But the relationship is slightly positive
correlation as the value is 0.165. So there is no strong
correlation between quality of pizza and satisfaction.
The significance value is less than 0.5. (p < 0.5). Thus
the null hypothesis is rejected and the alternate
hypothesis is accepted. Therefore, it is concluded that
there is a significant relationship between customer
satisfaction and product quality.
Table no. 11 Model Summary
Model R R Square
Adjusted R
Square
Std. Error of
the Estimate Durbin-Watson
1 .165a .027 .025 1.00179 1.539
a. Predictors: (Constant), Quality
b. Dependent Variable: Satisfaction
The model Summary table no.11 provides the R, R2,
adjusted R2 which can be used to determine how well a
regression model fits the data. The R value represents
correlation coefficient and the value of 0.165 which is
positive. The "R Square" column represents
the R2 value (also called the coefficient of
determination), which is the proportion of variance in
the dependent variable that can be explained by the
independent variable. Thus, product quality contributes
only 3% to satisfaction of pizza consumption.
Remaining 97% contributes to other factors that
influence the satisfaction of pizza. This means that there
are other independent variables that were not put into
consideration in this study. The other factors include
price, promotion, place, physical evidence, people and
process as it a service oriented product. The adjusted
R2 (0.025) gives an idea how well the model generalizes
that the value is close to R2
(0.027). There is a
difference of 0.002.
Table no 12 ANOVAa
Model Sum of Squares Df Mean Square F Sig.
1 Regression 10.582 1 10.582 10.544 .001b
Residual 379.355 378 1.004
Total 389.937 379
a. Dependent Variable: Satisfaction
b. Predictors: (Constant), Quality
The ANOVA test was performed to identify the
statistical significance of the regression model on
whether it is a good descriptor for the relationship
between the independent (product quality) and the
dependent variable (satisfaction). The F-ratio in
the ANOVA table tests whether the overall regression
model is a good fit for the data. The independent
variable significantly predicts the dependent variable, F
(1, 378) = 10.544, p < .05. This means that the
independent variable (product quality) is significant in
explaining the variation in the dependent variable
(satisfaction). The ANOVA table, proves that the
overall correlation 0.165 is significant. Hence the model
is fit.
Table no.13 Coefficientsa
Model
Unstandardized Coefficients
Standardized
Coefficients
t Sig. B Std. Error Beta
1 (Constant) 3.119 .254 12.284 .000
Quality .219 .067 .165 3.247 .001
a. Dependent Variable: Satisfaction
The coefficients in table no.17 helped to find out the
contribution of product quality on satisfaction. To
make the comparison, the Beta standardized
coefficients were used. The results indicate that Product
quality (β = 0.219; p = 0.001) is a significant predictor
of satisfaction.
Therefore, the Regression equation is developed as follows:
Renjith Kumar. R & Afrah Al Darrai Rashid Al Darrai; Sci Res Jr Eco Bus Mgn.; Vol-1, Iss-2 (Aug-Sep, 2021): 28-38
35
Y= a + b X
Where „Y‟ is the dependent variable „Satisfaction‟, a and b are constants.
The model equation based on the analysis is given below:
Y (Satisfaction) = 3.119 + 0.219 product quality (X)
where X is product quality
Satisfaction = 3.119 + 0.219 (Product quality)
This means that for every one unit change in quality of pizza, there is a 0.219 change in the satisfaction.
Impact of Satisfaction of Pizza on Repurchase (Brand loyalty)
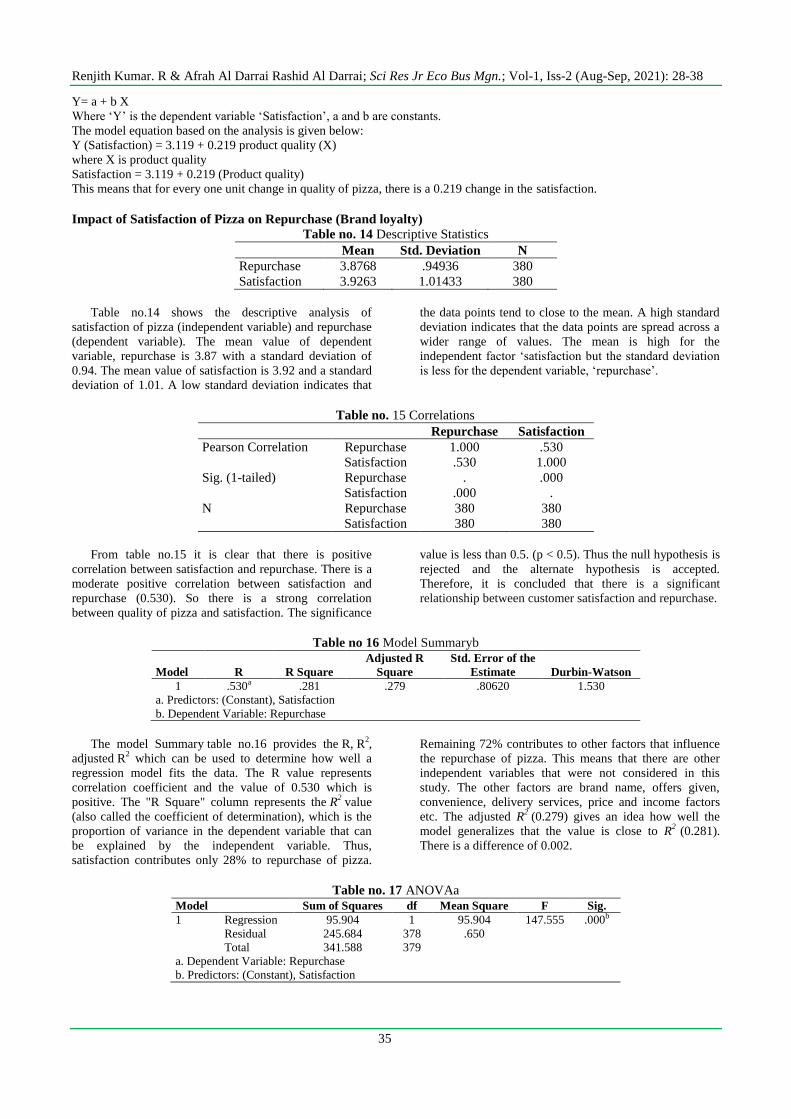
Table no. 14 Descriptive Statistics
Mean Std. Deviation N
Repurchase 3.8768 .94936 380
Satisfaction 3.9263 1.01433 380
Table no.14 shows the descriptive analysis of
satisfaction of pizza (independent variable) and repurchase
(dependent variable). The mean value of dependent
variable, repurchase is 3.87 with a standard deviation of
0.94. The mean value of satisfaction is 3.92 and a standard
deviation of 1.01. A low standard deviation indicates that
the data points tend to close to the mean. A high standard
deviation indicates that the data points are spread across a
wider range of values. The mean is high for the
independent factor „satisfaction but the standard deviation
is less for the dependent variable, „repurchase‟.
Table no. 15 Correlations
Repurchase Satisfaction
Pearson Correlation Repurchase 1.000 .530
Satisfaction .530 1.000
Sig. (1-tailed) Repurchase . .000
Satisfaction .000 .
N Repurchase 380 380
Satisfaction 380 380
From table no.15 it is clear that there is positive
correlation between satisfaction and repurchase. There is a
moderate positive correlation between satisfaction and
repurchase (0.530). So there is a strong correlation
between quality of pizza and satisfaction. The significance
value is less than 0.5. (p < 0.5). Thus the null hypothesis is
rejected and the alternate hypothesis is accepted.
Therefore, it is concluded that there is a significant
relationship between customer satisfaction and repurchase.
Table no 16 Model Summaryb
Model R R Square
Adjusted R
Square
Std. Error of the
Estimate Durbin-Watson
1 .530a .281 .279 .80620 1.530
a. Predictors: (Constant), Satisfaction
b. Dependent Variable: Repurchase
The model Summary table no.16 provides the R, R
2,
adjusted R2 which can be used to determine how well a
regression model fits the data. The R value represents
correlation coefficient and the value of 0.530 which is
positive. The "R Square" column represents the R2 value
(also called the coefficient of determination), which is the
proportion of variance in the dependent variable that can
be explained by the independent variable. Thus,
satisfaction contributes only 28% to repurchase of pizza.
Remaining 72% contributes to other factors that influence
the repurchase of pizza. This means that there are other
independent variables that were not considered in this
study. The other factors are brand name, offers given,
convenience, delivery services, price and income factors
etc. The adjusted R2 (0.279) gives an idea how well the
model generalizes that the value is close to R2
(0.281).
There is a difference of 0.002.
Table no. 17 ANOVAa
Model Sum of Squares df Mean Square F Sig.
1 Regression 95.904 1 95.904 147.555 .000b
Residual 245.684 378 .650
Total 341.588 379
a. Dependent Variable: Repurchase
b. Predictors: (Constant), Satisfaction
Scientific Research Journal of Economics and Business Management Abbreviated Key Title: Sci Res Jr Eco Bus Mgn.; ISSN 2788-9491 (Print)
ISSN 2788-9505 (Online)
Volume-1 | Issue-2 | Aug-Sep-2021 |
Quick Response Code
Journal homepage:
https://isrpgroup.org/srjebm/ Copyright @ 2021 IARCON, All rights reserved.
No part of this content may be reproduced or
transmitted in any form or by any means as
per the standard guidelines of fair use.
Creative Commons License Open Access by
IARCON is licensed under Creative Commons
License a Creative Commons Attribution 4.0
International License.
Article History Received: 10.08.2021
Accepted: 20.08.2021
Published: 31.08.2021
36
DOI: 10.47310/srjebm.2021.v01i02.004
The ANOVA test was performed to identify the
statistical significance of the regression model on
whether it is a good descriptor for the relationship
between the independent (satisfaction) and the
dependent variable (repurchase). The independent
variable significantly predicts the dependent variable, F
(1, 378) = 147.555, p < .05. This means that the
independent variable (satisfaction) is significant in
explaining the variation in the dependent variable
(repurchase). The ANOVA table, proves that the overall
correlation 0.530 is significant. Hence the model is fit.
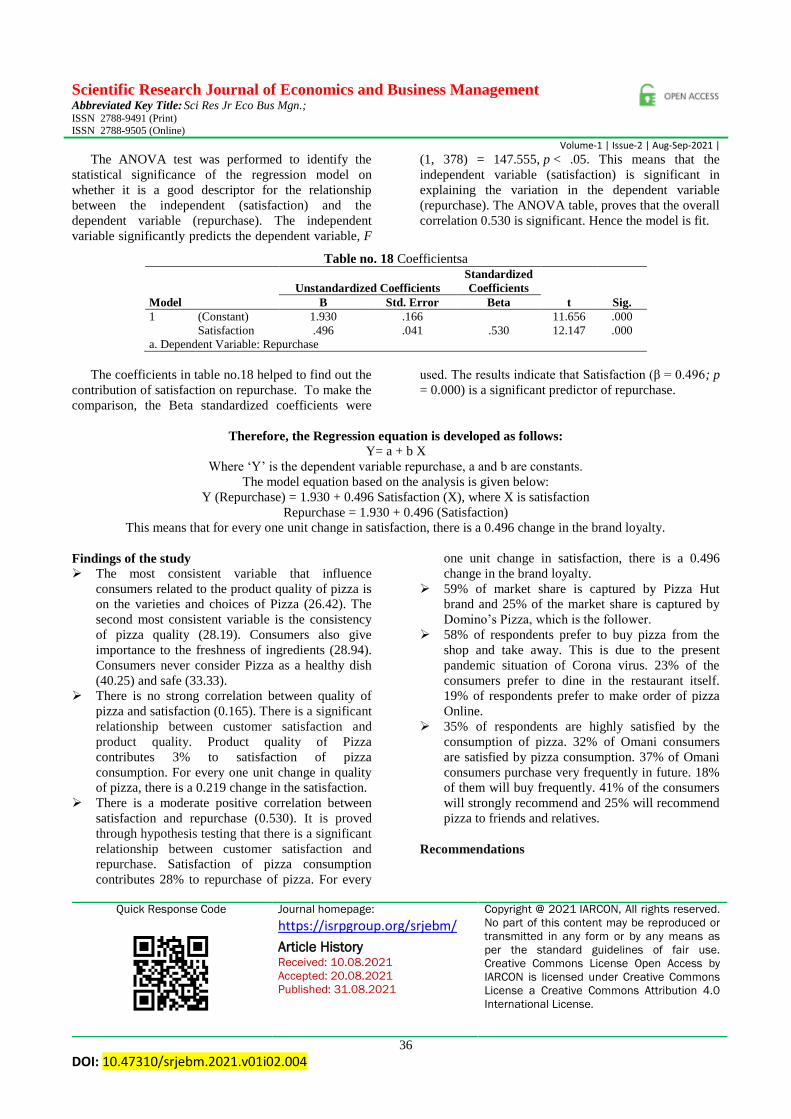
Table no. 18 Coefficientsa
Model
Unstandardized Coefficients
Standardized
Coefficients
t Sig. B Std. Error Beta
1 (Constant) 1.930 .166 11.656 .000
Satisfaction .496 .041 .530 12.147 .000
a. Dependent Variable: Repurchase
The coefficients in table no.18 helped to find out the
contribution of satisfaction on repurchase. To make the
comparison, the Beta standardized coefficients were
used. The results indicate that Satisfaction (β = 0.496; p
= 0.000) is a significant predictor of repurchase.
Therefore, the Regression equation is developed as follows:
Y= a + b X
Where „Y‟ is the dependent variable repurchase, a and b are constants.
The model equation based on the analysis is given below:
Y (Repurchase) = 1.930 + 0.496 Satisfaction (X), where X is satisfaction
Repurchase = 1.930 + 0.496 (Satisfaction)
This means that for every one unit change in satisfaction, there is a 0.496 change in the brand loyalty.
Findings of the study
The most consistent variable that influence
consumers related to the product quality of pizza is
on the varieties and choices of Pizza (26.42). The
second most consistent variable is the consistency
of pizza quality (28.19). Consumers also give
importance to the freshness of ingredients (28.94).
Consumers never consider Pizza as a healthy dish
(40.25) and safe (33.33).
There is no strong correlation between quality of
pizza and satisfaction (0.165). There is a significant
relationship between customer satisfaction and
product quality. Product quality of Pizza
contributes 3% to satisfaction of pizza
consumption. For every one unit change in quality
of pizza, there is a 0.219 change in the satisfaction.
There is a moderate positive correlation between
satisfaction and repurchase (0.530). It is proved
through hypothesis testing that there is a significant
relationship between customer satisfaction and
repurchase. Satisfaction of pizza consumption
contributes 28% to repurchase of pizza. For every
one unit change in satisfaction, there is a 0.496
change in the brand loyalty.
59% of market share is captured by Pizza Hut
brand and 25% of the market share is captured by
Domino‟s Pizza, which is the follower.
58% of respondents prefer to buy pizza from the
shop and take away. This is due to the present
pandemic situation of Corona virus. 23% of the
consumers prefer to dine in the restaurant itself.
19% of respondents prefer to make order of pizza
Online.
35% of respondents are highly satisfied by the
consumption of pizza. 32% of Omani consumers
are satisfied by pizza consumption. 37% of Omani
consumers purchase very frequently in future. 18%
of them will buy frequently. 41% of the consumers
will strongly recommend and 25% will recommend
pizza to friends and relatives.
Recommendations
Renjith Kumar. R & Afrah Al Darrai Rashid Al Darrai; Sci Res Jr Eco Bus Mgn.; Vol-1, Iss-2 (Aug-Sep, 2021): 28-38
37
1. Since the pizza varieties affects greatly on
consumer satisfaction, it is necessary to introduce
more menu and add new varieties.
2. Pizza brand companies in the Sultanate of Oman,
especially in Nizwa, must change consumers‟
perception that pizza is unhealthy. Awareness and
promotion must be given that it is prepared from
healthy ingredients, fresh vegetables and also using
low-fat cheeses. In the dough it is better to choose
flour that contains bran Healthy wheat, and put the
choice of healthy pizza on the menu so that dieters
can eat it also without gaining weight, and it can be
written how many calories each meal contains.
3. Providing family offers to increase the level of
recommendations of friends and relatives, through
attractive packaging that is easy to carry, and
putting up contests on social media such as
Instagram, Snapchat, Twitter and others, by sharing
a picture of pizza on the buyer's personal account,
put tags of the pizza shop from which he bought it
and the image obtained. For the most real likes and
the largest number of friends, the winner gets a
family offer or with a number of friends.
4. Holding celebrations and competitions in cooking
skills, baking pizza and preparing to attract more
customers and cooking hobby to develop services
and taste for pizza.
5. As consumers prefer chicken pizza, it is necessary
to invent new and delicious types of chicken pizza,
which attracts more buyers. The ingredients should
be added according to the choice of the buyer. Also
customers' suggestions about the new items, notes
and the rate of evaluation can be taken.
6. Make barcode which can sell to customers,
customers can give their friends or family as a gift
which can stick on the cover of gifts box or which
can be scanned by pizza shop website or mobile
Applications to make this process easy. Pizza shop
can cooperate with one of the gift coordinating
shops, the buyer can coordinate with the gift shop
and request the pizza meal barcode with the
appropriate budget, after that the pizza shop can
provide and coordinate it. This increases the
participation of individuals, relatives and friends
and thus increase sales.
CONCLUSION
Through the research in the studied area, most of the
buyers are youth and students, and they are the most
productive community groups. Therefore, pizza must be
presented with healthy and delicious standards and
measures that suit their requirements and gain their
satisfaction to ensure community productivity
effectively, the percentage of buyers choosing other
brands not present in the region The percentage of
online orders and the percentage of satisfaction with the
consumption of pizza tells us that other brands and
pizza manufacturers can invade the market with
reasonable success, as consumers have not shown great
loyalty to the companies that currently exist. By nature,
consumers like constant change, especially in
restaurants and meals, as they are always looking for
the best.
REFERENCES 1. Al Masud, M. A., Haque, A., & Ferdous Azam S.
M. (2018) Factors Influencing Customer Loyalty
towards Fast Food Restaurants: An Empirical
Study in Malaysia, International Tourism and
Hospitality Journal 1(3): pp 1-17.
2. Al-Tit, A. A. (2015). The Effect of Service and
Food Quality On Customer Satisfaction and Hence
Customer Retention. Asian Social Science, 11(23),
129-139.
3. Raduzzi, A., & Massey, J. E. (2019). Customers
satisfaction and brand loyalty at McDonalds
Maroc. African Journal of Marketing
Management, 11(3), 21-34.
4. Bhatnagar, V. K., & Kushwah, D.
(2013). Customer Satisfaction at Domino‟s: An
Empirical Study in Gwalior Region, Transforming
Business Organizations for Longevity: Challenges
and Opportunities, Prestige Institute of
Management, Gwalior, Narosa Publishing House,
New Delhi. 2013, pp.316-322
5. Bowen, J.T. and Shoemaker, S. (1998). “Loyalty: a
strategic commitment”, Cornell and Hotel
Restaurant Administration Quarterly, 39(1), 12-25.
6. Donkoh, S. A., Quainoo, A. K., Cudjoe, E., &
Kaba, N. C. (2012). Customer satisfaction and
perceptions about food services on the University
for Development Studies Campus, Ghana. African
Journal of Food Science, 6(8), 216-223. Oklahoma
State University.
7. Goh, C., Law, R., & Mok, H.M. (2008). Analyzing
and forecasting tourism demand: A rough sets
approach. Journal of Travel Research 46(3), 327-
338.
8. Gremler, D., & Gwiner, K. (2000). Customer-
employee rapport in service relationships. Journal
of Service Research, 3(1), 82-104.
9. Jill, G. (2005). Customer Loyalty: Growing and
Sustaining Customer Loyalty. Jakarta: Erland
10. Haider, M. U., Jan, D. F., Jan, M. F., & Faheem,
M. (2015). Factors Effecting Brand Preferences: A
Comparative Study of McDonald‟s and KFC.
Abasyn Journal of Social Sciences.
11. Hill, N., & Alexander, J. (2006). The Handbook of
Customer Satisfaction and Loyalty Measurement
(3rd ed.). London: Routledge
12. Jang, S., & Ha, J. (2010). Effects of service quality
and food quality: The moderating role of
atmospherics in an ethnic restaurant segment.
[online]. International Journal of Hospitality
Management, 29 (3), 520-529.
13. Kandampuly, J., & Suhartanto, D. (2000).
Customer Loyalty in The Hotel Industry. The Role
of Customer Satisfaction and Image. International
Renjith Kumar. R & Afrah Al Darrai Rashid Al Darrai; Sci Res Jr Eco Bus Mgn.; Vol-1, Iss-2 (Aug-Sep, 2021): 28-38
38
Journal of Contemporary Hospitality Management,
12(6), 346-51.
14. Kivela, J., Reece, J., & Inbakaran, R. (1999).
Consumer research in the restaurant environment.
Part 2: Research design and analytical methods.
International Journal of Contemporary Hospitality
Management 11(6), 269-286.
15. Koo, L.C., Tao, F.K., & Yeung, J.H. (1999).
Preferential segmentation of restaurant attributes
through conjoint analysis. International Journal of
Contemporary Hospitality Management 11(5),242-
253.
16. Kotler, P. (2000). Marketing management: The
millennium edition. Marketing Management
23(6),188-193.
17. Manikandan, A., & Kumaresan, S., & Subramani,
A. K. (2015). Customer Satisfaction Towards
Domino's Pizza In Chennai-An Empirical Study.
18. Marić, A., & Arsovski, S. (2010). The level of
customer satisfaction as one of the goals of the
quality of the organization in the bakery industry.
International Journal for Quality Research, 4(4),
275-281.
19. Marić, A., Arsovski, S., & Mastilović, J. (2009).
Contribution to the improvement of products
quality in baking industry. International Journal
for Quality Research, 3(3), 1-8.
20. Nair, S. (2013). Assessing customer satisfaction
and brand awareness of branded bread. IOSR
Journal of Business and Management, 12(2), 13-
18.
21. Namin, A. (2017). Revisiting customers' perception
of service quality in fast food restaurants. Journal
of Retailing and Consumer Services 34,70-81.
22. Namkung, Y., & Jang, S. (2007). Does Food
Quality Really Matter in Restaurants? Its Impact
On Customer Satisfaction and Behavioral
Intentions. Journal of Hospitality and Tourism
Research 31(3), 387-409.
23. Namkung, Y., Jang, S. (2008). Are highly satisfied
restaurant customers really different? A quality
perception perspective. International Journal of
Contemporary Hospitality Management 20(2),142-
55.
24. Ibrahim, A.N. (2013), The relationship between
customer satisfaction and brand loyalty in the fast
food industry of United Kingdom’’ dissertation
submitted to Royal Docks Business School,
University of East London
25. Ng, Y.N. (2005). A study of customer satisfaction,
return intention, and word-of-mouth
26. Oliver, R.L. (1999). Whence consumer loyalty?
Journal of Marketing 63(4 supp l1):33-44.
27. Oliver, R.L. (2014). Satisfaction: a behavioral
perspective on the consumer. New York:
Routledge.
28. Fazal, O., & Kanwal, S. (2018). An Empirical
Study of Effect of Services and Product Design on
Repurchase Behaviour of Consumers of Fast Food
Restaurants of Pakistan, International Journal of
Scientific and Research Publications, 8 (1),
January 2018, pp 36-49.
29. Rozekhi, N.A., Hussin, S., Siddiqe, A.S., Rashid,
P.D., & Salmi, N.S. (2016). The influence of food
quality on customer satisfaction in fine dining
restaurant: Case in Penang. International Academic
Research Journal of Business and Technology 2(2),
45-50.
30. Shahzad, K., Majid, H. S., & Fahad, Y. (2013).
Determinants of Customer Satisfaction in Fast
Food Industry A Study of Fast Food Restaurants
Peshawar Pakistan. Studia Commercialia
Bratislavensia, 6(21), 56-65.
31. Shankar, V., Smith, A. K., & Rangaswamy, A.
(2003). Customer satisfaction and loyalty in online
and offline environments. International journal of
research in marketing, 20(2), 153-175.
32. Shinde, R., Chavan, P., & Ali, M. M. (2018).
Assessing The Role Of Customer Satisfaction In
Attaining Customer Loyalty: A Study Of Fast Food
Restaurant In Kolhapur City. International Journal
of Multidisciplinary Research. 8. 30-40.
33. Praxedes, S. G. S. F. (2016). Domino‟s Pizza
Portugal- A Case Study on the Price Disclosure
strategy of a Late Entrant, Dissertation submitted to
Catolica- Lisbon School of Business & Economics,
Universidade Catolica Portuguesa.
34. Singh, J., & Sirdeshmukh, D.J. (2000). Agency and
trust mechanisms in consumer satisfaction and
loyalty judgments. Journal of the Academy of
Marketing Science 28(1),150-167.
35. Sulek, J. M., & Hensley, R. L. (2004). The relative
importance of food, atmosphere, and fairness of
wait. Cornell Hotel and Restaurant Administration
Quarterly, 45 (3), 253-247.
36. Phan, T. A., & Nguyen, T. H. T. (2016). An
analysis of factors impact on customer satisfaction
in Vietnam Restaurants: Case of fast food
restaurants. International Journal of Business and
Management Review, 4(6), 1-17.
37. Tzeng, G. H., & Chang, H. F. (2011). Applying
Importance- Performance Analysis as a service
quality measure in food service industry. Journal of
Technology Management & Innovation, 6(3), 106-
115.
38. Mohideen, K. U., & Suresh, R. Comparative Study
on Consumer Satisfaction towards Select Branded
Quick Service Retail Outlets with Special
Reference to Chennai City. International Journal
of Engineering and Management Research, 6(6)
November-December 2016, pp 81-86.
39. Gaffar, V. (2007). Customer Relationship
Management and Marketing and Public Relations.
Bandung: Alfabeta.
40. Vimala. P. (2020). A Comparative Study between
Domino‟s and Pizza Hut, International Journal of
Business Management & Research (IJBMR)
(Vol.10, No. 1), pp 1-8.
41. Winder, R. E., & Judd, D. K. (1996).
Organizational orienteering: Linking Deming,
Renjith Kumar. R & Afrah Al Darrai Rashid Al Darrai; Sci Res Jr Eco Bus Mgn.; Vol-1, Iss-2 (Aug-Sep, 2021): 28-38
39
Covey, and Senge in an Integrated Five Dimension
Quality Model. In: Proc. ASQC Seventh National
Quality Management Conference Transactions.
American Society for Quality, America.
42. Wong, A., & Sohal, A. (2003). Service quality and
customer loyal perspectives on two levels of retail
relationships. Journal of Services Marketing, 17(5),
495-513.
43. Yuen, E. F., & Chan, S. S. (2010). The effect of
retail service quality and product quality on
customer loyalty. Journal of Database Marketing
& Customer Strategy Management, 17(3), 222-240.
44. Oman Daily, October 22,2020
45. Alpen Capital, GCC Food Industry Report, 2019.
46. Aaron Allen Associates, 2013
47. Oman Daily, September 15th
, 2017, Eating out
makes you fat.