CRA Customer Satisfaction Study- 2014 Consumer Satisfaction Survey... · 2 CRA Consumer...
114
CRA Customer Satisfaction Survey – 2014 Report Findings
Transcript of CRA Customer Satisfaction Study- 2014 Consumer Satisfaction Survey... · 2 CRA Consumer...
CRA Customer
Satisfaction Survey – 2014 Report Findings
2 CRA Consumer Satisfaction Survey 2014
Table of Contents Table of Figures ............................................................................................................................................. 4
Table of Tables .............................................................................................................................................. 6
List of Abbreviations ..................................................................................................................................... 9
List of Key Terms & Definitions ................................................................................................................... 10
Executive Summary ..................................................................................................................................... 12
Background ................................................................................................................................................. 19
Research Objectives ................................................................................................................................ 19
Research Methodology ........................................................................................................................... 20
Exploratory Phase ................................................................................................................................... 20
Qualitative Survey ................................................................................................................................... 20
Quantitative Survey ................................................................................................................................ 20
Target Group ....................................................................................................................................... 20
Data Collection Instrument/ Questionnaire ....................................................................................... 21
Data Collection Mode ......................................................................................................................... 21
Sample Distribution ............................................................................................................................ 21
Data Weighting Approach ................................................................................................................... 22
Research Framework .......................................................................................................................... 22
Benchmarking with Walker & Other International Telecom Regulatory Bodies ................................ 22
About Qatar and its Telecom Market ......................................................................................................... 23
Diversity in Demographics ...................................................................................................................... 23
Telecom Market in the State of Qatar .................................................................................................... 23
What drives consumers’ ‘Need for Communication’ in Qatar ................................................................ 24
Three Key Stakeholders in Qatar’s Telecom Market .............................................................................. 25
Communications Regulatory Authority (CRA)..................................................................................... 25
Service Providers in Qatar’s Telecom Market ..................................................................................... 27
Consumer Opinion and Satisfaction with Touch-Points: CRA’s Perspective .............................................. 28
Quality of Services (QoS) and Compliance .............................................................................................. 28
Consumers Perception about Overall Quality of Services (QoS) ........................................................ 28
Customer Experience with Network Related Services ........................................................................ 32
Provisioning: Purchase and Activation Process .................................................................................. 37
Switch from Copper to Fibre ................................................................................................................... 39

3 CRA Consumer Satisfaction Survey 2014
Pricing and Tariffs/ Rate Plans ................................................................................................................ 40
Price Perception .................................................................................................................................. 40
Customer Experience with Rate Plans/ Tariffs and Promotions ......................................................... 44
Publishing of Tariff .............................................................................................................................. 46
Mobile Number Portability (MNP) Experience ................................................................................... 47
Market Competitiveness: Services and Prices ........................................................................................ 49
Complaint Resolution Mechanism .......................................................................................................... 51
Incidence, Reasons & Modes Used for Raising Complaints ................................................................ 51
Complaint Resolution: Time Taken & Experience ............................................................................... 55
Complaint Resolution Escalation Process ........................................................................................... 57
Consumer Rights Protection ................................................................................................................... 57
Service Providers: Customer Loyalty, Brand Image Perceptions and Experience with Key Touch-points . 60
Customer Loyalty .................................................................................................................................... 60
Behavioral Loyalty ............................................................................................................................... 62
Brand Image Perceptions ........................................................................................................................ 63
Customers’ Experience with Key Touch-Points ...................................................................................... 64
Company Outlet .................................................................................................................................. 64
Customer Care/ Call Center ................................................................................................................ 66
Online Modes: Social Media and Mobile Applications ....................................................................... 70
Experience by Type of Connection ......................................................................................................... 77
Prepaid Consumers: Recharge/ Top- up Process ................................................................................ 77
Postpaid Consumers: Billing and Payment Experiences ..................................................................... 79
Service Providers: Snapshot of Performance and Key Areas to Monitor ................................................... 82
Overall Leveragable Strengths & Key Focus Areas ..................................................................................... 84
Key Take-outs for CRA ................................................................................................................................. 87
Appendix I: Research Details ...................................................................................................................... 89
Research Methodology ........................................................................................................................... 89
Exploratory Phase Discussion Details ..................................................................................................... 91
Qualitative Research Details ................................................................................................................... 92
Appendix II: Detailed Sample Distribution .................................................................................................. 93
Appendix III: Weighting Factors .................................................................................................................. 95

4 CRA Consumer Satisfaction Survey 2014
Appendix IV: Network Experience by Various Segments ............................................................................ 96
Network: Availability and Spread- Perception on Various Parameters .................................................. 96
Network: Voice and SMS- Perception on Various Parameters ............................................................... 96
Network: Data Services- Perception on Various Parameters ................................................................. 97
Appendix V: Provisioning Experience by Various Segments ....................................................................... 98
Appendix VI: Experience with Rate Plan/ Tariffs and Promotions by Various Segments ........................... 99
Appendix VII: Loyalty Segmentation by Various Segments ...................................................................... 101
Appendix VIII: Intention to Recommend by Various Segments ................................................................ 103
Appendix IX: Experience with Company Outlet by Various Segments ..................................................... 104
Appendix X: Experience with Customer Care/ Call Center by Various Segments..................................... 105
Appendix XI: Experience with Billing by Various Segments ...................................................................... 106
Appendix XII: Experience with Payment by Various Segments ................................................................ 107
Appendix XIII: Advertising and Communication Experience..................................................................... 108
Appendix XIV: Complaint Resolution Process- Analysis of Complaints through Arsel and Hukoomi ....... 109
Appendix XV: References .......................................................................................................................... 110
Appendix XVI: How to Read the Report ................................................................................................... 111
Performance Scores .............................................................................................................................. 111
Statistics Used ....................................................................................................................................... 112
Walker’s Stakeholder Relationship Database (SRD) ............................................................................. 114
Table of Figures Figure 1: Qatar’s Demographic Diversity .................................................................................................... 23
Figure 2: Qatar Mobile Market ................................................................................................................... 24
Figure 3: Qatar Fixed Line Market .............................................................................................................. 24
Figure 4: Awareness of CRA ........................................................................................................................ 26
Figure 5: Scope of CRA ................................................................................................................................ 26
Figure 6: Quality of Services Perception: Overall & Walker Benchmarks ................................................... 29
Figure 7: Quality of Services Perception: Type of Service........................................................................... 29
Figure 8: Quality of Services Perception: By Municipalities ....................................................................... 30
Figure 9: Quality of Service Perception: By Segments ................................................................................ 31
Figure 10: Experience with Network Coverage........................................................................................... 32
Figure 11: Experience with Network Availability ........................................................................................ 33

5 CRA Consumer Satisfaction Survey 2014
Figure 12: Experience with Voice and SMS Services ................................................................................... 34
Figure 13: Experience with Data Services Aspects ...................................................................................... 36
Figure 14: Provisioning Experience: Overall ............................................................................................... 38
Figure 15: Experience with Switch from Copper to Fibre ........................................................................... 39
Figure 16: Quality of Broadband after Switch ............................................................................................ 40
Figure 17: Price Perception: Overall, By Population Type and Walker Benchmarks .................................. 40
Figure 18: Price Perception by Service ........................................................................................................ 41
Figure 19: Price Perception by Service Provider ......................................................................................... 42
Figure 20: Perceptions on Pricing Attributes .............................................................................................. 43
Figure 21: Experience with Rate Plan/ Tariff and Promotions Sub-Attributes ........................................... 45
Figure 22: Awareness of Publishing Tariff ................................................................................................... 47
Figure 23: Options for Accessing Published Tariff ...................................................................................... 47
Figure 24: Experience with MNP ................................................................................................................. 48
Figure 25: Time for Porting ......................................................................................................................... 48
Figure 26: Reasons for Usage of MNP......................................................................................................... 49
Figure 27: Reasons for Not Using MNP ....................................................................................................... 49
Figure 28: Competitive Nature of Telecom Market in Qatar ...................................................................... 50
Figure 29: Network Readiness Index, 2015 ................................................................................................ 50
Figure 30: Raised a Complaint in Past 6 Months ........................................................................................ 51
Figure 31: Reasons for Raising Complaint................................................................................................... 52
Figure 32: Usual Mode of Raising a Complaint ........................................................................................... 52
Figure 33: Complaints Received on Social Media ....................................................................................... 55
Figure 34: Average Time for Resolving Complaints .................................................................................... 55
Figure 35: Customer Experience with Complaint Resolution Process ........................................................ 56
Figure 36: Awareness of Complaint Resolution Escalation Process ........................................................... 57
Figure 37: Promotional Messages and Clarity of Advertising/ Communication ......................................... 58
Figure 38: Misleading SMS Promotion ........................................................................................................ 58
Figure 39: Heard of EMF Concerns ............................................................................................................. 59
Figure 40: Loyalty Segmentation: Overall and Walker Benchmarks ........................................................... 61
Figure 41: Loyalty Segmentation: By Type of Service ................................................................................. 61
Figure 42: Intention to Recommend ........................................................................................................... 62
Figure 43: Intention to Recommend: Type Of Service ................................................................................ 62
Figure 44: Reasons for Visiting the Outlet .................................................................................................. 65
Figure 45: Company Outlet- Sub Attribute Experience .............................................................................. 66
Figure 46: Called the Customer Care .......................................................................................................... 67
Figure 47: Reasons for Calling Customer Care Call Center ......................................................................... 67
Figure 48: Frequency of Contacting Customer Care Call Center ................................................................ 68
Figure 49: Customer Care- Sub Attribute Experience ................................................................................. 69
Figure 50: Social Media Usage in Qatar ...................................................................................................... 71
Figure 51: Social Media Usage- By Type of Platform .................................................................................. 71
Figure 52: Service Providers Presence in Social Media ............................................................................... 72
6 CRA Consumer Satisfaction Survey 2014
Figure 53: Reasons For Usage of Social Media: Ooredoo ........................................................................... 73
Figure 54: Reasons For Usage of Social Media: Vodafone Qatar ............................................................... 73
Figure 55: Service Providers’ Engagement with Social Media .................................................................... 74
Figure 56: Awareness of Mobile Application .............................................................................................. 75
Figure 57: Usage of Mobile Application ...................................................................................................... 76
Figure 58: Purpose for Usage of Mobile Application .................................................................................. 76
Figure 59: Experience with Mobile Application .......................................................................................... 77
Figure 60: Recharge/ Top- Up Process- Sub Attribute Performance .......................................................... 78
Figure 61: Billing Experience- Sub Attributes Performance ........................................................................ 79
Figure 62: Preferred Mode of Receiving Bill ............................................................................................... 80
Figure 63: Payment Experience- Sub Attributes Performance ................................................................... 80
Figure 64: Frequently Used Mode of Bill Payment ..................................................................................... 81
Figure 65: Walker Framework- As Customized For Telecom Services in Qatar .......................................... 90
Figure 66: Exploratory Phase- Internal Stakeholders Discussion Details .................................................... 91
Figure 67: Exploratory Phase- External Stakeholder’s Discussion Details .................................................. 92
Figure 68: Loyalty Segment by Mainstream and Transient ...................................................................... 101
Figure 69: Loyalty Segmentation: By Type of Service ............................................................................... 101
Figure 70: Loyalty Segmentation: By Type of Connection ........................................................................ 101
Figure 71: Loyalty Segmentation: By Service Provider ............................................................................. 102
Figure 72: Loyalty Segmentation: By Age ................................................................................................. 102
Figure 73: Loyalty Segmentation: By Gender and Nationality .................................................................. 102
Figure 74: Intention to Recommend: Type of Service .............................................................................. 103
Figure 75: Intention to Recommend: Type of Connection and Service Provider ..................................... 103
Figure 76: Intention to Recommend: By Gender and Nationality ............................................................ 103
Figure 77: Advertising and Communication Experience: Overall ............................................................. 108
Table of Tables Table 1: Quality of Service: Country-wise Benchmarks .............................................................................. 29
Table 2: Satisfaction with QoS: By Service and Municipality ...................................................................... 31
Table 3: Network Coverage: Country-wise Benchmarks ............................................................................ 32
Table 4: Network Coverage: Type of Service .............................................................................................. 32
Table 5: Network Coverage: By Municipality .............................................................................................. 32
Table 6: Network Coverage: By Service Provider ........................................................................................ 32
Table 7: Network Availability: Country-wise Benchmarks .......................................................................... 33
Table 8: Network Availability: Type of Service............................................................................................ 33
Table 9: Network Availability: By Municipality ........................................................................................... 33
Table 10: Network Availability: By Service Provider ................................................................................... 34
Table 11: Experience with Voice and SMS Services: Type of Service & Service Provider ........................... 34
Table 12: Experience with Voice and SMS Services: By Municipality ......................................................... 34

7 CRA Consumer Satisfaction Survey 2014
Table 13: Experience with Data Services Aspects: Type of Service ............................................................ 36
Table 14: Speed of Data Services: Country-wise Benchmarks .................................................................... 37
Table 15: Experience with Data Services Aspects: By Service Provider ...................................................... 37
Table 16: CRA KPIs for Service Providers: QoS Standard & Target for Initial Supply Time ......................... 38
Table 17: Experience with Provisioning: Type of Service............................................................................ 39
Table 18: Experience with Provisioning: By Service Provider ..................................................................... 39
Table 19: Price Perception: Country-wise Benchmarks .............................................................................. 42
Table 20: Perception on Pricing Attributes: Type of Service ...................................................................... 44
Table 21: Perception on Pricing Attributes: Type of Service ...................................................................... 44
Table 22: Experience with Rate Plan/ Tariff and Promotions: Type of Service .......................................... 46
Table 23: Experience with Rate Plan/ Tariff and Promotions: Service Provider ......................................... 46
Table 24: Mobile Number Portability: Awareness and Subscription .......................................................... 48
Table 25: Feedback through Arsel: Type of Complaints- By Service Provider ............................................ 53
Table 26: Complaints through Hukoomi on Network: Type of Complaints- By Service Provider ............... 54
Table 27: CRA KPIs for Service Providers: QoS standard and Target for Customer Complaint Resolution 56
Table 28: Experience with Complaint Resolution Process: Service Provider .............................................. 56
Table 29: Imagery Perception by Service Provider ..................................................................................... 64
Table 30: Reasons for Visiting the Outlet: By Service Provider .................................................................. 65
Table 31: Experience with Company Outlet: By Service Provider .............................................................. 66
Table 32: Experience with Customer Care Call Center: By Service Provider .............................................. 69
Table 33: CRA KPI for Service Providers: Standard and Target for Response time by Customer Support
Center.......................................................................................................................................................... 69
Table 34: Internet Penetration ................................................................................................................... 70
Table 35: Social Media Usage Trend ........................................................................................................... 74
Table 36: Reasons for Non Usage of Social Media to Communicate with Service Provider ...................... 75
Table 37: Experience with Recharge/ Top-Up Process: By Service Provider .............................................. 78
Table 38: Experience Recharge/ Top-Up Process: By Age, Gender and Nationality................................... 78
Table 39: Experience With Billing: By Service Provider .............................................................................. 79
Table 40: Experience with Payment: By Service Provider .......................................................................... 80
Table 41: Ooredoo and Vodafone Performance Snapshot (1) ................................................................... 82
Table 42: Ooredoo and Vodafone Performance Snapshot (2) ................................................................... 83
Table 43: Key Concerns Areas to be monitored for Ooredoo and Vodafone Qatar ................................... 83
Table 44: Key Leveragable Strengths .......................................................................................................... 84
Table 45: Key Improvement Areas .............................................................................................................. 85
Table 46: Key Focus Areas: By Other Metrics ............................................................................................. 86
Table 47: Take-outs for CRA: CRA Awareness and Mandate ...................................................................... 87
Table 48: Take-outs for CRA: Quality of Services ........................................................................................ 87
Table 49: Take-outs for CRA: Market Competitiveness .............................................................................. 87
Table 50: Take-outs for CRA: Complaint Resolution ................................................................................... 88
Table 51: Take-outs for CRA: Consumer Rights Protection ........................................................................ 88
Table 52: Qualitative Study Details (1)........................................................................................................ 92

8 CRA Consumer Satisfaction Survey 2014
Table 53: Qualitative Study Details (2)........................................................................................................ 93
Table 54: Sample Distribution by Municipality ........................................................................................... 93
Table 55: Sample Distribution by Age ......................................................................................................... 93
Table 56: Sample Distribution by Gender ................................................................................................... 93
Table 57: Sample Distribution by Nationality ............................................................................................. 93
Table 58: Sample Distribution by Income ................................................................................................... 94
Table 59: Sample Distribution by Profession .............................................................................................. 94
Table60: Sample Distribution by Service and Operator …………………………………………………………………………92
Table 61: Weighting Factors ....................................................................................................................... 95
Table 65: Experience With Network Availability And Spread: By Service Provider .................................... 96
Table 63: Experience With Voice and SMS Services: Type of Service ......................................................... 96
Table 64: Experience with Voice and SMS Services: By Type of Connection .............................................. 96
Table 65: Experience with Voice and SMS Services: By Service Provider ................................................... 96
Table 66: Experience with Data Services Aspects: By Type of Connection ................................................ 97
Table 67: Experience With Data Services Aspects: By Service Provider ..................................................... 97
Table 68: Experience with Data Services Aspects: By Municipality ............................................................ 97
Table 69: Experience with Provisioning: By Type of Connection ................................................................ 98
Table 70: Experience with Provisioning Experience: By Service Provider .................................................. 98
Table 71: Experience with Rate Plan/ Tariff and Promotions: Overall, Mainstream and Transient ........... 99
Table 72: Experience with Rate Plan/ Tariff and Promotions: By Type of Connection............................... 99
Table 73: Experience with Rate Plan/ Tariff and Promotions: By Service Provider .................................... 99
Table 74: Experience with Rate Plan/ Tariff and Promotions: Type of Service ........................................ 100
Table 75: Experience with Rate Plan/ Tariff and Promotions: By Age, Gender and Nationality .............. 100
Table 76: Experience with Company Outlet: By Type of Connection ....................................................... 104
Table 77: Experience With Company Outlet: By Service .......................................................................... 104
Table 78: Experience with Company Outlet: By Age, Gender and Nationality ......................................... 104
Table 79: Experience with Customer Care: By Age, Gender and Nationality ........................................... 105
Table 80: Experience with Billing: Type of Service .................................................................................... 106
Table 81: Experience with Billing: By Age, Gender and Nationality ......................................................... 106
Table 82: Experience with Payment: By Age, Gender and Nationality ..................................................... 107
Table 83: Experience with Advertising & Communication: By Operator .................................................. 108
Table 84: Feedback through Arsel on Network Issues: By Service Provider ............................................. 109
Table 85: Complaints through Hukoomi on ADSL for Ooredoo ................................................................ 109
Table 86: Complaints through Hukoomi on Mobile for Ooredoo ............................................................. 109
Table 87: Complaints through Hukoomi on Mobile for Vodafone ........................................................... 109
Table 88: Rating Scales Used for the Study............................................................................................... 111
9 CRA Consumer Satisfaction Survey 2014
List of Abbreviations ARPU: Average Revenue Per User
CAPI: Computer Assisted Personal Interviewing
CRA: Communications Regulatory Authority
EMF: Electro Magnetic Fields
ICT: Information and Communication Technology
ictQATAR: Ministry of Information and Communications
ITU: International Telecom Union
IVR: Interactive Voice Response
MENA: Middle East & North Africa
MNP: Mobile Number Portability
QoS: Quality of Services
QSA: Qatar Statistics Authority
RF: Radio Frequency
RIM: Random Iterative Method
SIM: Subscriber Identity Module
SLA: Service Level Adherence
SMS: Short Message Service
SRD: Stakeholder Relationship Database
VAS: Value Added Services

10 CRA Consumer Satisfaction Survey 2014
List of Key Terms & Definitions Attitudinal Loyalty: It is one of the key components of Walker Customer Loyalty framework. This
indicates consumers’ emotional attachment/ loyalty towards any brand/ company and its products and
services offered.
Behavioral Loyalty: It is one of the key components of Walker Customer Loyalty framework. This
indicates future intended consumers’ behavior basis their experiences with and perceptions about any
brand/ company and its products and services offered.
Confidence Level: A confidence level refers to the percentage of all possible samples that can be
expected to include the true population parameter. For example, suppose all possible samples were
selected from the same population, and a confidence interval were computed for each sample. A 95%
confidence level implies that 95% of the confidence intervals would include the true population
parameter.
Factor Analysis: Factor analysis is a statistical method used to describe variability among observed,
correlated variables in terms of a potentially lower number of unobserved variables called factors. For
example, it is possible that variations in four observed variables mainly reflect the variations in two
unobserved variables. Factor analysis searches for such joint variations in response to unobserved latent
variables.
Fibre Broadband: The latest advancement in broadband technology, fibre optic broadband enables
super-fast speeds for all of daily Internet needs. Its name comes from the use of plastic or glass cables,
which allow for faster data transfer compared to the standard copper wires which are used in regular
broadband connections.
Likert Scale: A Likert scale is a psychometric scale commonly involved in research that employs
questionnaires. It is the most widely used approach to scaling responses in survey research, such that
the term is often used interchangeably with rating scale, or more accurately the Likert-type scale.
Loyalty Segmentation: Loyalty captures a customer’s perceptions and attitudes about telecom services,
including whether or not they intend to stay as a customer in foreseeable future. Loyalty Segmentation
this is one of the key outputs from Walker Customer Loyalty framework. In this, the consumers are
classified into 4 distinct groups of loyalty based on their commitment and behavior towards the service
providers of telecom services.
Mobile Broadband: A mobile broadband modem, also known as a connect card or data card, is a type of
modem that allows a laptop, a personal computer or a router to receive Internet access via a mobile
broadband connection instead of using telephone or cable television lines.
RIM Weighting: Rim-weighting uses a mathematical algorithm to help provide an even distribution of
results across the entire dataset while balancing certain categories such as age or gender to pre-
determined totals. It weights the specified characteristics simultaneously and disturbs each variable as
little as possible. For example, if you wished to weight your samples so that they were 50% male and

11 CRA Consumer Satisfaction Survey 2014
50% female, and also 20% in each of five age brackets, the algorithm would calculate the correct
weighting that needed to be applied to each table entry (combining age and gender).
Walker: Walker Info (http://www.walkerinfo.com/) is the pioneer in Stakeholder Loyalty research (based
in USA) for last 75 years. AMRB is the exclusive license for Walker in MENA (Middle East & North Africa)
region.

12 CRA Consumer Satisfaction Survey 2014
Executive Summary INTRODUCTION
The State of Qatar’s unique and diverse population of around 2 million impacts consumers’ opinions
about telecom products and services consumed. For example, 65 percent of Qatar’s population are
between 25-45 years of age, 20 nationalities are represented in the population, and expats comprise
87percent of the population. Qatar has 100 percent mobile penetration and an Internet penetration of
96 percent at a household level. In addition, at 54 percent, 3G penetration in Qatar is much higher
compared to the regional (MENA) average of 34 percent.
The Communications Regulatory Authority, whose mandate is to encourage and support an open and
competitive communications sector that brings a broad range of advanced, innovative, and reliable
service to the people of Qatar at reasonable prices, conducted a comprehensive Customer Satisfaction
Survey to better help it fulfill its mission. The study, conducted in the fourth quarter of 2014, is meant to
statistically measure Quality of Service (QoS) and customer satisfaction with respect to delivery of
telecommunications services from their respective service providers, prices charged, and consumer
rights protection.
RESEARCH BACKGROUND
CRA commissioned AMRB, LLC to conduct both qualitative and quantitative research to evaluate the
performance of telecom services and make recommendations to help CRA fulfill its mission. In all, 9
focus groups with telecom consumers and 2,526 face-to-face interviews were conducted across all
demographic and geographic segments. In addition, AMRB held detailed in-person discussions with key
leadership within CRA and the two service providers. Some of the key objectives of this research activity
were to assess consumers’ awareness of CRA, their satisfaction with quality of services, market
competitiveness, and consumer rights protection, among others.
Feedback from the consumers was collected through CAPI (Computer Assisted Personal Interviewing)
technique and the data collected was analyzed using various statistical techniques such as regression,
and factor analysis, among others. To ensure a good comparison, the data collected was benchmarked
with results of consumer satisfaction across four key countries -- Singapore, UK, Australia and UAE.
Furthermore, feedback from Qatar’s telecom users was compared with the globally renowned Walker
Stakeholder Relationship Database (SRD) - at a global and North America level.

13 CRA Consumer Satisfaction Survey 2014
CONSUMER FEEDBACK
The Overall Picture
With consistent increase in subscriptions, adoption of new technologies, and penchant for innovation by
the service providers, the telecom sector in Qatar is one of the most progressive in the region. The three
main reasons consumers in Qatar give for using communication services are the need to be connected,
to procure information, and as a source of entertainment. Consumers place a much higher importance
on mobile connectivity than fixed line services, perhaps a result of an increase in adoption of smart
devices in the market.
Currently, around 88 percent of telecom users in the country are satisfied with the quality of services
provided by their respective service providers; 12 percent are dissatisfied with the services received.
Considering the various global norms, this indicates room to improve the overall services provided to
consumers.
Research suggests that while customers are highly satisfied with network coverage and availability,
pricing, rate plans and complaint resolution are the key areas for improvement. Among the two
operators, while no significant differences are observed, Ooredoo consumers are relatively more
satisfied with overall quality of services compared with Vodafone consumers. This finding is probably
the result of Ooredoo being the incumbent operator and Vodafone being the new entrant.
Telecom consumers in Al Daayen municipality are less satisfied with their services compared with those
in other municipalities. Among various product lines, dissatisfaction is the highest for Internet (Copper)
service, which should be remedied with quick and smooth transition to fiber broadband. It is also worth
noting that prepaid users are relatively less satisfied than postpaid users. Overall, females and 15-24
year olds are more dissatisfied with quality of service than the overall population. In addition, the
survey points to the need to enhance the overall experience of females and Qataris with the customer
care center interactions.
Quality of Services (QoS)
Eighty-eight percent of the telecom consumers in Qatar are satisfied with their telecom services.
Satisfaction levels in Qatar are relatively better than the Walker global benchmark (84 percent) and on
par with countries such as UK, Australia and Singapore. More than 90 percent of the consumers

14 CRA Consumer Satisfaction Survey 2014
surveyed are satisfied with network related aspects, such as ‘network availability and spread’, ‘voice and
SMS’ and also ‘data services’. Satisfaction levels on network related aspects in Qatar are better than
those in other countries.
Overall, provision of services is a very strong area for the telecom sector in Qatar with more than 95
percent of consumers satisfied on various aspects including ease of purchasing the connection, sales
agent interaction, initial supply time, and minimum service period for the product. There is however, a
need to make the activation process easier with 12 percent dissatisfied with the process. This probably
can be done by reducing customer involvement during the process.
Only about one-third of survey respondents feel that the telecom services provided in Qatar are
extremely/ very competitive. Thus there is room in the Qatar’s telecom market to offer still better
services and be seen as more competitive.
Migration from Copper to Fibre
Given the telecom sector’s priority to migrate Internet copper consumers to fiber broadband, it is
important to provide customers with a satisfactory experience. An overwhelming majority (94 percent)
of customers who have experienced the switching process are satisfied with it. Further, among those
who have migrated from copper to fibre, 90 percent of them are satisfied with the quality of broadband
after the switch and only a miniscule 1 percent of the switchers feel that the quality has declined. A high
level of satisfaction with broadband is very encouraging for the growth of Qatar’s telecom market.
Pricing and Tariffs
Only around 30 percent of the consumers surveyed feel that the prices in Qatar’s telecom market are
very competitive and only 22 percent of consumers perceive the prices for various services to be low.
The transient population, in particular, perceives the services to be highly priced. In addition, discontent
in pricing is highest among copper Internet users-- 41 percent perceive the service as highly priced -- and
fixed line users, with 24 percent believing the service as highly priced. On a positive note, perceptions of
price among telecom consumers in Qatar are more positive than Walker’s benchmarks.
About 20 percent of the consumers believe the charges for various services to be highly priced.
International calling and roaming charges, in particular, are perceived to be expensive. Consumers’
opinion about pricing is quite similar across various product lines.

15 CRA Consumer Satisfaction Survey 2014
More than 90 percent of consumers are satisfied with ‘clarity of rate plans’ and ‘clear terms and
conditions’. However, 19 percent of customers are dissatisfied with ‘variety of rate plans’, an area of
concern among both Ooredoo and Vodafone customers.
While 90 percent of the consumers are satisfied with current tariff publications, only 5 percent of the
consumers are aware of the fact that CRA is mandated to have tariffs published by the service providers.
About 40 percent of consumers would prefer tariffs to be published on the CRA website.
Given a similar pricing/offer structure of the two operators for mobile voice and data services,
consumers may not benefit greatly from options such as Mobile Number Portability (MNP). Only about
one-third of consumers are aware of MNP and just a small fraction (less than 3 percent) claims to have
used it in the past. Also, with 28 percent dissatisfaction with the MNP process, there is a need to make
the process more customer friendly.
Protection of Consumer Rights
One of CRA’s major mandates is to protect telecom consumers from misleading and unfair practices of
the service providers. Thus the survey measured how consumers feel about the operators’ promotional
messages and clarity of advertising. More than 90 percent of the consumers surveyed are satisfied with
reduced spamming and clarity of advertising/ communication by the service providers. Further, there is
hardly anyone who feels that communications from service providers are misleading. However, 11
percent of consumers are dissatisfied with options provided by service providers to opt out of
promotional messages, indicating a need for service providers to strictly adhere to guidelines issued by
CRA with respect to advertising/ promotions.
Additionally, CRA has issued guidelines to protect the public from exposure to Electromagnetic Fields
(EMF) radiations within the frequency range of cellular mobile services. Only about one-fourth of the
consumers surveyed are aware of adverse health effects of EMF radiations, and as such, consumers
haven’t raised any issue with their service provider or with CRA thus far.
Complaint Resolution
One of the key mandates for CRA is to ensure a dispute resolution system that is transparent, fair,
speedy, and effective. Only 7 percent of customers claimed to have raised a complaint with their service
providers in the past six months. Those complaints relate mainly to network coverage and connectivity
related issues. Based on the Service Regulatory Framework 2014 published by CRA, 95 percent of the
complaints should be resolved within five working days. However, only 37 percent of the customers who
filed a complaint claimed that their issue was resolved within a five-day timeframe. This is an area of

16 CRA Consumer Satisfaction Survey 2014
concern for both mobile and fixed services. Further there is significant dissatisfaction on speed of
resolution of a complaint as well as with complaints being resolved within a committed time period.
It is also worth noting that about one-third of the consumers surveyed are aware of the process for
getting their complaints resolved in case these complaints are not resolved by their service providers.
Currently, there is a very small proportion of customers who use non-traditional modes --such as social
media, Qatar government Call Center (Hukoomi), mobile applications from CRA or service providers -- to
raise their complaints. Thus there is significant scope to enhance usage of online modes of
communication by consumers, backed-up by adequate and swift action, eliminating the potential gap
between expectations and reality.
Customer Loyalty and Image Perceptions about Service Providers
While Ooredoo customers are more loyal toward their service provider than Vodafone customers –27
percent are ‘Truly Loyal’ to Ooredoo compared with 16 percent for Vodafone), the customer loyalty in
the telecom sector in Qatar is weaker than global benchmarks.
Customers using fiber broadband, fixed voice, and data SIM services are relatively more loyal compared
to those using other services. Also, as expected, the postpaid consumers are more loyal as compared to
prepaid consumers, according to this survey.
The perception of service providers was also explored. Only moderate endorsements are observed for
both Ooredoo and Vodafone. With just around 50 percent positive endorsements for each of them,
there is room to enhance the perception of service providers across most of the image parameters, such
as leader in the mobile industry, brand preferred over others, reputation, responsive, trustworthy, and
transparent in dealings.
Customer Experience with Service Providers across Key Touch-Points
Customers interact with their service provider in three key ways -- in-person visits to company outlets,
phoning a customer care center, or online interaction through social media or mobile apps). Both
operators are equally active across all the three touch-points.
Company Outlet: Almost one-third of the customers who visited a service providers’ outlet in the last six
months from the time the survey took place did so for payment or billing related activities followed by

17 CRA Consumer Satisfaction Survey 2014
20 percent of customers who visited the outlet to obtain information on various plans. A majority of
customers (for both Ooredoo and Vodafone) are satisfied with their visits to a company outlet.
Customer Care Call Center: About one-fourth (26 percent) of telecom consumers in Qatar claimed to
have contacted the call center in the last six months, while one-third have never phoned the call center.
The most important reason for contacting the Vodafone call center is for network/ coverage issues (36
percent) while for Ooredoo it is about obtaining information on rate plans (27 percent). Customers’
experience with customer care is quite unsatisfactory with high dissatisfaction on “wait time” being the
key area of concern for both Ooredoo and Vodafone. There is a clear need to focus on improving wait
time and turnaround time (for resolving query/ problem/complaint) at the call centers.
Online Platforms: With 88 percent penetration, telecom users in Qatar are heavy users of Internet-
related services. In terms of social media usage, Facebook followed by Twitter are the two key platforms
used by both the service providers as well as by the consumers for interaction related to telecom
services. Given high Internet penetration, there is significant room to increase consumer interaction
with service providers over various social media platforms. Concentrated efforts are required to address
consumer queries, requests, and issues over social media with utmost efficiency.
With only about 6 percent of consumers using mobile apps provided by service providers, there is a
need to enhance awareness of mobile apps and encourage more consumers to use them. Most of the
mobile app users are quite satisfied, which is a good indicator and motivator for its future growth.
CONCLUSION
While the survey reveals that around 88 percent of telecom users in the country are satisfied with the
quality of services provided by their respective service providers, there is room to improve the overall
services provided to consumers, considering the various global norms.
The major areas for improvement include pricing, rate plans, and complaint resolution. In addition,
promotion of MNP services, building awareness about the benefits of green billing, and conducting a
comparative study of pricing across other countries are also recommended. Consumer feedback also
reveals four key considerations for CRA:
CRA’s Awareness and Mandate
Concentrated campaigns focused on CRA’s mandate, promotion of of new technological adoptions
and initiatives such as green bills should be undertaken.
Tariffs should be duly published on a suitable platform and consumers should be communicated
with in order to manage their expectations.
Quality of Services
18 CRA Consumer Satisfaction Survey 2014
CRA needs to ensure that service providers actively promote MNP service and have clear norms in
place to ensure timely porting and strong customer experience
Communicate the benefits of green billing and target universal green billing within a specified time
period.
Market Competitiveness
Conduct a comparative study of pricing across other countries to understand the pricing policy in
Qatar vis-à-vis other countries.
Look at the feasibility of introducing another operator (either a full-service provider or MVNO)
into the market
Complaint Resolution
Complaints not resolved within 30 days should be automatically escalated to CRA and service
providers should file a monthly summary report with CRA of complaints registered and resolved to
CRA
Establish clear Service Legal Agreements and ensure that service providers deal with complaints
generated via social media. There is also a need for CRA to monitor Qatar’s telecom social media
space on a continuous basis.
Consumer Rights Protection
CRA needs to strictly ensure that service providers adhere to the guidelines related to opting out
of promotional messages.
Establish clear timelines for fiber broadband rollout plan that existing or new service providers
need to comply with.
19 CRA Consumer Satisfaction Survey 2014
Background In 2014, the Communications Regulatory Authority (CRA) was established by an Emiri Decree (42) in
2014 with the aim of providing advanced and reliable telecommunications services across the state of
Qatar. CRA regulates the Telecommunications and Information Technology sector, postal services as
well as access to digital media and spectrum.
Aligned to the Qatar National Vision 2030 goals, provision of high quality services that respond to the
needs and the desires of consumers is an important part of CRA strategic goals for the year 2015. The
two key objectives of CRA are:
To ensure that all consumers (individuals, businesses & government) have access to a broad
range of communications services (at reasonable prices)
To ensure that the sector is competitive and there is adequate protection of consumer rights
Given CRA mandate and objectives, a research study was commissioned with AMRB LLC to evaluate the
consumers’ levels of satisfaction with regards to delivery of telecommunication services, prices charged
and the competitiveness of the market.
The survey was conducted in the months of November and December 2014, wherein more than 2500
consumers across the State of Qatar were interviewed in person. The survey was conducted across
different municipalities, demographics (such as age, gender, occupation, nationality, income etc.) and
users of different products/ services and brands. Further, the population sample chosen for the study is
representative of the Qatar population across key metrics (such as gender, ethnicities, age and
geographic locations). The survey results are projected on overall population statistics based on
operators/ services, key demographics and locations. Further, from survey point of view, the population
of Qatar has been divided into mainstream and transient population.
The resulting report thus provides a roadmap wherein CRA can attain its goals of ensuring optimum
‘Quality of Services’ and ‘market competitiveness’ in telecom sector in the State of Qatar. Further, the
report also serves as a robust baseline study, which would help CRA measure progress on a regular basis
and ensure there are no let-ups in services to consumers.
Research Objectives The key objectives of this research rally around CRA’s mandate of ensuring optimum quality of services
and market competitiveness (both in terms of services as well as prices). The key objectives were thus
outlined as mentioned below:
Awareness of CRA and its mandate
Level of satisfaction with QoS (Related to network, prices, tariffs, provisioning etc.) and other
parameters of importance
Competitiveness of market in terms of services provided and prices charged
Satisfaction with complaint resolution mechanism
Consumer views on protection of rights from unfair practices by Service Providers
Equal access of technology and services to all

20 CRA Consumer Satisfaction Survey 2014
Key areas to be monitored over time for service providers
Research Methodology The research methodology for the study consisted of 5 different modules:
Exploratory Phase
Secondary Research
Qualitative Phase
Quantitative Phase
Social Media
The details of the 5 different modules are given in Appendix I
Exploratory Phase In this phase, face-to-face in-depth interviews were conducted with various stakeholders, both internal
and external, to understand customer touch-points in detail. A total of 10 such discussions were
conducted and the same are illustrated in Appendix I.
Qualitative Survey This phase of research involved conducting a qualitative evaluation to understand the importance of
various communication services, the consumers’ levels of satisfaction in the receipt and delivery of
telecommunication services quality, price satisfaction and assess the competitiveness of the market. To
address these objectives, 9 mini focus groups were conducted among different as depicted in the table
(Refer table 1and table 2) in Appendix I:
The key findings from qualitative phase have been embedded within the overall research findings within
this report.
Quantitative Survey Basis the inputs from exploratory and qualitative phases, a large scale quantitative survey was then
conducted among the end-users of telecommunication service in Qatar to understand and quantify their
experiences with various products and services offered.
Target Group As mentioned earlier, the target respondents were spread across locations, belonging to various
demographics and using ICT services as offered by the two service providers. Further, some of the key
criteria for identifying eligible respondents were:
USAGE: Should be an active user of ICT products (defined as using the product for at-least past 3
months)
TYPE OF USER: Primary user of the said product/ service (defined as the one who is responsible
for making key decisions with respect to the product)

21 CRA Consumer Satisfaction Survey 2014
DUAL/ MULTIPLE PRODUCT USAGE: It is assumed that many consumers would be using multiple
products under consideration. For such users, feedback has been obtained for maximum of 2
services used.
Data Collection Instrument/ Questionnaire Post the exploratory and qualitative phase, detailed discussions were held between CRA and AMRB,
based on which the questionnaire was devised. The salient features of questionnaire were:
A structured questionnaire (i.e. scaled questions) with some scope for respondent comments
Scientifically valid 5 point Likert (labeled) scales, for effectively measuring customer experience.
The scales were further calibrated (to Binary scales) to reflect their satisfaction with Quality of
Services and other touch-points with service providers. This also helped in close comparison
with international benchmarks.
The questionnaire was prepared in both English & Arabic languages so as to allow the
respondent liberty of answering in his/ her preferred language
Data Collection Mode Face-to-face interviews were conducted with eligible respondents using CAPI (Computer Assisted
Personal Interviewing) methodology. The interview duration was 30- 35 minutes on average. Fieldwork
was conducted from November 15th 2014 to January 10th 2015.
The respondents were intercepted at a general location (such as malls, coffee shops, public places etc.)
and interviewed based on their convenience. The survey was administered for one or two services
depending on their eligibility.
Sample Distribution A total of 2526 respondents were interviewed with 2206 interviews in the Mainstream segment and 320
among the Transient population. This sample represents findings at an overall confidence level of 95%
and a +/- 3% error margin over the entire population.
Quota based sampling was adopted to ensure that the sample was adequately distributed among
different categories (The sample distribution as per each of the category is presented in Appendix IV):
Services
Service Providers
Geographical Location
Nationality
Gender
Age
Profession
22 CRA Consumer Satisfaction Survey 2014
Data Weighting Approach In order for the sample to represent the universe, the data was weighed using RIM (Random Iterative
Method) methodology and following parameters were used for the same:
Mainstream and Transient Population
Geographical Location
Service and Service Provider
Nationality (Qatari and Non Qatari)
Age
The weighting factors were obtained from published findings of Qatar Statistics Authority1 and
subscription numbers for different services shared by CRA. Details of weighting factors are mentioned in
Appendix III
Research Framework The quantitative phase of the research has been conducted on the basis of the Walker Framework.
Walker Framework has been utilized specifically to arrive at and appropriating action areas for CRA and
service providers. While the above framework remains consistent across various industry sectors, same
has been suitably modified to telecom sector (and specific to telecom products & services provided in
the State of Qatar). The framework has been used to develop the questionnaire as used in this survey.
The detailed framework as used is illustrated in Appendix I.
Benchmarking with Walker & Other International Telecom Regulatory Bodies This study is aimed at capturing telecom consumers’ opinions about the services currently offered to
them by telecom service operators. From a regulator’s perspective, the customers need to be satisfied
with the services provided by operators in the market. Considering various global norms and discussions
with telecom experts, the report uses the following Quality of Service (QoS) norms:
Services with 95% or more consumers satisfied : Excellent
Services with 91 - 94% consumers satisfied : Acceptable (Maintain status quo)
Services with 85 – 90% consumers satisfied : Need minor intervention by the Regulator
Services with <85% consumers satisfied : Need significant intervention by the Regulator
Following norms have been considered for this research:
1. Walker Stakeholder Relationship Database (SRD): Global and North America
2. Telecom regulatory bodies in 4 countries, viz.
a. Singapore: Consumer Awareness and Satisfaction Survey 2014 – iDA Singapore
b. UK: Ofcom – The Communication Market Report, 7th August 2014
c. Australia: ACMA – Communication Report 2014
1 Qatar Statistics Authority Annual Statistical Abstract 2013 and
Labor_Force_Quarterly_July_Sep_Statistics_MDPS_AE_Q2_201

23 CRA Consumer Satisfaction Survey 2014
d. UAE: ICT in the UAE Household Survey, 2014
About Qatar and its Telecom Market
Diversity in Demographics The population of Qatar as per 2013 survey2 is 2 million, and is unique with more than 80% male and
close to 87% expat population (primarily males). Further, the population of Qatar is considerably
younger with 40% of the population in 25-34 age groups. Also, Qatar has a considerable transient
population who reside in labor accommodation (primarily males in 25-30 age brackets). These unique
demographics suggest that communication services need to cater differently to different groups and
hence the customer satisfaction and expectations are expected to vary widely as well.
Figure 1: Qatar’s Demographic Diversity
Source: Ministry of Development, Planning & Statistics 2014
Telecom Market in the State of Qatar Qatar’s telecom market is supported by high incomes of resident population, and as a result is one of
the most developed in the region. It has above 100% mobile penetration and an Internet penetration of
96% at a household level. Also, at 54%, 3G penetration in Qatar is much higher as compared to regional
(MENA) average of 34%.
As per the latest International Telecom Union (ITU) statistics, the mobile subscriber base has been
increasing consistently and is likely to stabilize in the coming years (Figure 2). The fixed line subscriptions
are also increasing consistently but the penetration rate might decrease due to increase in households
(Figure 3).
2 Qatar Statistics Authority Annual Statistical Abstract 2013

24 CRA Consumer Satisfaction Survey 2014
Figure 2: Qatar Mobile Market
Source: ITU data as published on ITU Website
Figure 3: Qatar Fixed Line Market
Source: ITU data as published on ITU Website
What drives consumers’ ‘Need for Communication’ in Qatar The qualitative research indicated that the three key reasons specified by consumers for using
communication services are:
1. Need for consumers to be in touch with their family, friends and professional acquaintances
2. Need for entertainment: Telecommunication products are not just seen as sources of
information but also as a source of entertainment
3. Need for information : Availability of new technological products and services have allowed the
consumers to use them as sources of information
100
110
120
130
140
150
160
0
500
1000
1500
2000
2500
3000
3500
2009 2010 2011 2012 2013
Subscription ('000) Subscription per 100 respondents
0
10
20
30
40
0
50
100
150
200
250
300
350
400
450
2009 2010 2011 2012 2013
Subscription ('000) Subscription per 100 respondents

25 CRA Consumer Satisfaction Survey 2014
Communication and mobile are very essential for consumers. Consumers see this as their lifeline and
they cannot imagine life without it.
“…no way I can live one day without a mobile, I would be totally lost, you would feel like you
don’t exist because people are not able to contact you” (18-25 years old Qatari Male)
“Mobile gives me a security feeling and accessibility to me” (25-35 year old Western Male)
Three Key Stakeholders in Qatar’s Telecom Market With two service providers currently operating, the telecom market in Qatar is characterized by its
duopoly, with CRA (Communications Regulatory Authority) as the market regulator. The three key
stakeholders include
1. Communication Regulatory Authority (CRA)
2. Ooredoo, incumbent telecom service provider
3. Vodafone, new telecom service provider
Communications Regulatory Authority (CRA) With the core purpose of regulating Qatar’s telecom sector, Communications Regulatory Authority (CRA)
was established in 2014. The CRA encourages and supports an open and competitive Information &
Communications Technology (ICT) sector that provides advanced, innovative, and reliable
communications services. Balancing the rights of consumers with the needs of service providers is one
of the core objectives of the CRA.
Around 1/5th (19%) of the telecom consumers are aware of CRA (Figure 4). CRA, which was earlier
known as ictQATAR, had an awareness of 22% (as per 2012 Customer Satisfaction Survey). In this
context, 19% recognition for CRA is encouraging. However, a significant proportion of consumers are not
aware of CRA, and this needs to be addressed by increasing the visibility and accessibility of CRA. It is
desirable for CRA to have universal awareness of its existence and working. In particular, there is a need
to enhance awareness amongst males, Non-Qataris and younger population.
CRA needs to engage more with consumers and enhance its awareness. This can be done through
concentrated campaigns focused on aspects related to CRA’s mandate, which would resonate well with
the consumers. The campaigns can be related to protecting consumer rights, innovations in the market,
market competitiveness and fairness of services provided etc. The campaigns can also revolve around
adoption of new technologies and facilities (such as Mobile Apps, promotion of online billing and
payment etc.) for the consumers. Further, apart from engagement through traditional media like
television and print, it should also include social media and arranging workshops.

26 CRA Consumer Satisfaction Survey 2014
Figure 4: Awareness of CRA
Source: Customer Satisfaction Survey; Overall population n=2526
Though a significant proportion of those aware of CRA are also aware of CRA’s role and functions, it is
imperative to build CRA awareness among larger population of Qatar. (Refer figure 5: 43% of those
aware of CRA are not aware of its scope).
Figure 5: Scope of CRA
Source: Customer Satisfaction Survey; Overall sample n=2526
Question specifically asked to those who are aware of CRA (n=495)
Consumers do have some suggestions for CRA to improve the telecom services in Qatar. These
suggestions are mainly related to pricing, network improvements and increasing competition in the
market. Some of the customer comments with regards to suggestions for CRA are:
“The regulator should organize the tele- communication market and also the companies that are
operating in the space” (Arab male, 35-45 years)
“I think they should be encouraging competition by making conditions to encourage more service
providers in market” (Western male, 25-35 years)
Aware 19%
Not Aware 81%
43%
32%
18%
43%
2%
Protect consumers interests and rights
Regulating Telecom Market
Transition to more competitive &technologically advanced market
Heard of it, but not aware of the scope
Don’t Know/ Can’t Say/ Refused

27 CRA Consumer Satisfaction Survey 2014
Service Providers in Qatar’s Telecom Market As mentioned earlier, with two service providers currently operating, Qatar’s telecom space is
characterized by duopoly. Ooredoo and Vodafone Qatar are the two operators authorized to provide
telecom services in the State of Qatar.
Ooredoo, formerly Qatar Telecom (Qtel), is the incumbent telecoms operator in Qatar. Ooredoo was
established in 1987 as the Qatar Public Telecommunications Corporation (QPTC), when the government
of Qatar corporatized the telecommunications department of the Ministry of Communications and
Transport. QPTC changed its name to Qtel QSC in 1998; and in 2013, the group launched the new
Ooredoo brand identity. Ooredoo is an integrated telecom player offering mobile (voice and broadband)
and fixed (landline and internet) services.
Having launched its mobile operations in Qatar in 2009, Vodafone Qatar became the country’s second
telecom service provider. Vodafone is licensed to offer mobile and wireline telecoms services, which
should allow Vodafone to offer converged services (fixed, mobile and internet). As of now, Vodafone
Qatar is primarily a mobile operator and has recently started offering fixed services in a few areas of
Qatar (Mainly Barwa city and Pearl).

28 CRA Consumer Satisfaction Survey 2014
Consumer Opinion and Satisfaction with Touch-Points: CRA’s
Perspective As the telecom regulator in the State of Qatar, CRA’s mandate is to:
Regulate the communications sector
Set quality of service standards and monitor compliance
Ensure the efficient management and allocation of scarce resources such as radio spectrum,
numbering, and domain names
Protect consumers from misleading and unfair practices
Manage a dispute resolution system that is transparent, fair, speedy, and effective
Given this mandate, it is important to understand consumers’ opinion and satisfaction with various
touch-points they have with their service providers and with CRA.
Quality of Services (QoS) and Compliance One of the key mandates of CRA is to set service standards (Across various consumer touch-points) and
monitor operators’ compliance with the same. The key areas covered as a part of QoS are:
Experience with network related services
o Network Coverage
o Availability of Network
o Voice & SMS related
o Data services related
Provisioning: Purchase & Activation
Market competitiveness wrt quality of services
Before looking into these services, it is important to understand how customers perceive about the
quality of services at a broader level.
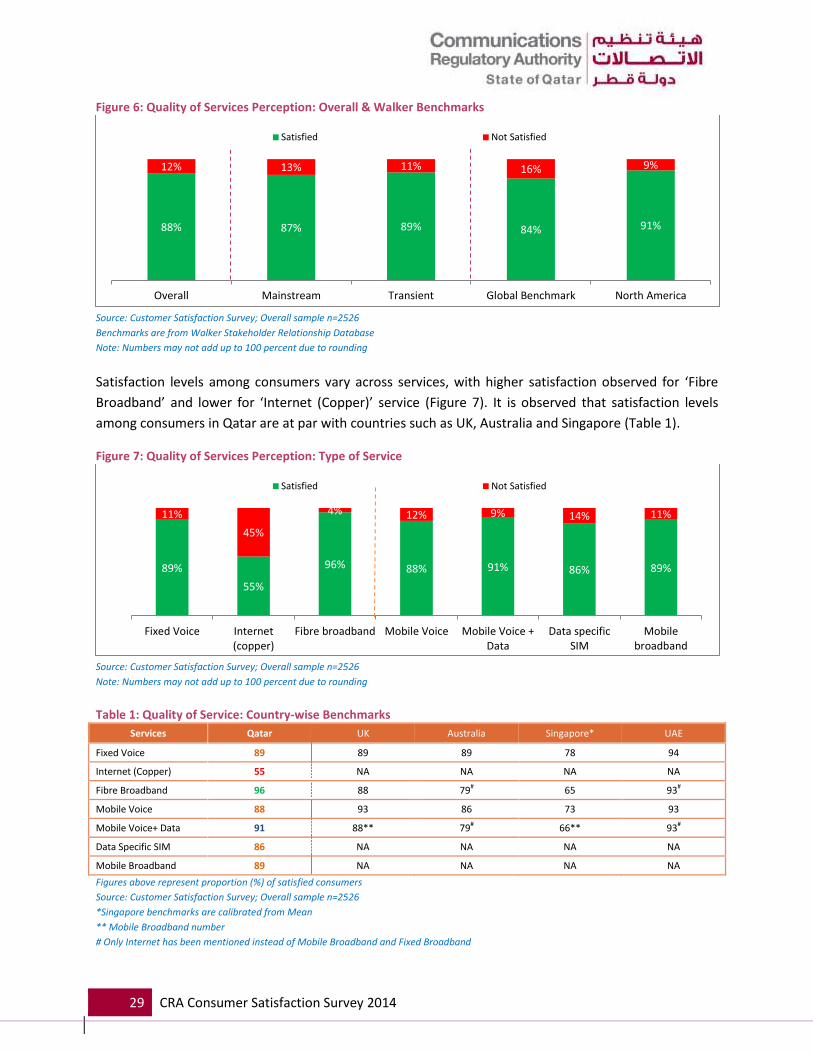
Consumers Perception about Overall Quality of Services (QoS) At an overall level, 88% of the telecom consumers in Qatar are satisfied with the telecom services, which
indicate a scope to improve the same (Figure 6). The satisfaction levels are observed to be quite similar
among mainstream and transient population. It is noted that the satisfaction levels in the State of Qatar
are relatively weaker than Walker North America benchmarks.
29 CRA Consumer Satisfaction Survey 2014
Figure 6: Quality of Services Perception: Overall & Walker Benchmarks
Source: Customer Satisfaction Survey; Overall sample n=2526
Benchmarks are from Walker Stakeholder Relationship Database
Note: Numbers may not add up to 100 percent due to rounding
Satisfaction levels among consumers vary across services, with higher satisfaction observed for ‘Fibre
Broadband’ and lower for ‘Internet (Copper)’ service (Figure 7). It is observed that satisfaction levels
among consumers in Qatar are at par with countries such as UK, Australia and Singapore (Table 1).
Figure 7: Quality of Services Perception: Type of Service
Source: Customer Satisfaction Survey; Overall sample n=2526
Note: Numbers may not add up to 100 percent due to rounding
Table 1: Quality of Service: Country-wise Benchmarks
Services Qatar UK Australia Singapore* UAE
Fixed Voice 89 89 89 78 94
Internet (Copper) 55 NA NA NA NA
Fibre Broadband 96 88 79# 65 93#
Mobile Voice 88 93 86 73 93
Mobile Voice+ Data 91 88** 79# 66** 93#
Data Specific SIM 86 NA NA NA NA
Mobile Broadband 89 NA NA NA NA Figures above represent proportion (%) of satisfied consumers
Source: Customer Satisfaction Survey; Overall sample n=2526
*Singapore benchmarks are calibrated from Mean
** Mobile Broadband number
# Only Internet has been mentioned instead of Mobile Broadband and Fixed Broadband
88% 87% 89% 84% 91%
12% 13% 11% 16% 9%
Overall Mainstream Transient Global Benchmark North America
Satisfied Not Satisfied
89%
55%
96% 88% 91% 86% 89%
11%
45%
4% 12% 9% 14% 11%
Fixed Voice Internet(copper)
Fibre broadband Mobile Voice Mobile Voice +Data
Data specificSIM
Mobilebroadband
Satisfied Not Satisfied

30 CRA Consumer Satisfaction Survey 2014
Satisfaction levels are observed to be higher among consumers residing in Al Shamal and Al Khor/ Al
Thakhira (Figure 8). At 64% satisfaction, Al Daayen residents are the least satisfied with overall quality of
telecom services.
Figure 8: Quality of Services Perception: By Municipalities
Figures above represent proportion (%) of satisfied consumers
Source: Customer Satisfaction Survey; Overall sample n=2526
The research shows that Ooredoo consumers are much more satisfied as compared to their Vodafone
counterparts (90% for Ooredoo as against 85% for Vodafone). Satisfaction among the younger
consumers is 82%, which is much lower than that among other consumers. No significant difference is
observed by type of connection, nationality or gender (Figure 9).
64%
94%
89%
95%
85%
87%
91%
Al Daayen
Al Khor & AlThakhira
Al Rayyan
Al Shamal
Al Wakra
Doha
Umm Salal

31 CRA Consumer Satisfaction Survey 2014
Figure 9: Quality of Service Perception: By Segments
Figures above represent proportion (%) of satisfied consumers
Source: Customer Satisfaction Survey; Overall sample n=2526
Table 2: Satisfaction with QoS: By Service and Municipality Fixed Mobile
Fixed Voice
Internet (Copper)
Fibre Broadband
Mobile Voice Mobile Voice
+ Data Data Specific
SIM Mobile
Broadband
Overall 89 55 96 88 91 86 89
Al Daayen 76 3 84 84 97 72 84
Al Khor & Al Thakhira 90 92 97 93 96 86 95
Al Rayyan 87 81 93 87 92 78 92
Al Shamal 88 95 99 73 92 72 100
Al Wakra 98 98 99 94 84 97 98
Doha 86 81 96 86 90 88 83
Umm Salal 95 100 94 81 88 85 89
Figures above represent proportion (%) of satisfied consumers
Source: Customer Satisfaction Survey; Overall sample n=2526
92%
88%
82%
85%
89%
88%
86%
89%
87%
85%
90%
45 and above
25- 44 years
15-24 years
Females
Males
Non-Qataris
Qataris
Postpaid
Prepaid
Vodafone
Ooredoo
SERVICE PROVIDER
TYPE OF CONNECTION
NATIONALITY
GENDER
AGE

32 CRA Consumer Satisfaction Survey 2014
Sample for service by each municipality is low. Hence, numbers are largely indicative
Customer Experience with Network Related Services
This section talks about various aspects related to network experience, viz. network availability,
coverage, voice & SMS related services and data related services.
Network Coverage More than 95% of the consumers are satisfied with network coverage in Qatar (Figure 10). The
satisfaction levels in Qatar are observed to be better as compared to available international benchmarks
for mobile voice services (Table 3).
Coverage of network is observed to be quite similar and strong for various mobile related services and
also across various municipalities (Table 4 and 5). Further no considerable difference is observed among
the two service providers (Table 6).
Figure 10: Experience with Network Coverage
Source: Customer Satisfaction Survey; Overall sample n=2526
Note: Numbers may not add up to 100 percent due to rounding
Table 3: Network Coverage: Country-wise Benchmarks Network Availability &
Spread Mobile Voice
Qatar Mobile – UK Mobile- UAE
Network coverage 97 NA 90
Figures above represent proportion (%) of satisfied consumers
Source: Customer Satisfaction Survey; Overall sample n=2526
Table 4: Network Coverage: Type of Service Network Availability &
Spread Overall Fixed Mobile
Fixed Line
Internet (copper)
Fibre Broadband
Mobile Voice
Mobile Voice+ Mobile Data
Data Specific SIM
Mobile Broadband
Network coverage 97 NA NA NA 97 96 95 99
Figures above represent proportion (%) of satisfied consumers
Source: Customer Satisfaction Survey; Overall sample n=2526
Table 5: Network Coverage: By Municipality Network Availability &
Spread Overall Al Daayen
Al Khor & Al Thakhira
Al Rayyan Al Shamal Al Wakra Doha Umm Salal
Network coverage 97 100 99 99 99 92 96 98
Figures above represent proportion (%) of satisfied consumers
Source: Customer Satisfaction Survey; Overall sample n=2526
Table 6: Network Coverage: By Service Provider Network Availability &
Spread Overall Ooredoo Vodafone
97% 3% Network coverage
Satisfied Not Satisfied

33 CRA Consumer Satisfaction Survey 2014
Network coverage 97 98 96
Figures above represent proportion (%) of satisfied consumers
Source: Customer Satisfaction Survey; Overall sample n=2526
Availability of Network More than 90% of the consumers are satisfied with network availability in Qatar (Figure 11). The
satisfaction level for network availability for mobile voice service in Qatar is observed to be better as
compared to available international benchmarks for mobile voice services (Table 7).
At a service level, relatively lower satisfaction is observed for ‘network availability at all times’ for mobile
broadband service (Table 8). As observed earlier as well, satisfaction is very low among Internet
(Copper) users, and a smooth migration to a highly satisfactory fibre broadband service is required.
Consumers in the newer municipality of Al Daayen are much less satisfied with network availability as
compared to those in other municipalities (Table 9). Network availability for Ooredoo is observed to be
better than that for Vodafone (Table 10).
Figure 11: Experience with Network Availability
Source: Customer Satisfaction Survey; Overall sample n=2526
Note: Numbers may not add up to 100 percent due to rounding
Table 7: Network Availability: Country-wise Benchmarks Network Availability &
Spread Mobile Voice
Qatar Mobile – UK Mobile- UAE
Availability of network all times
94 87 NA
Figures above represent proportion (%) of satisfied consumers
Source: Customer Satisfaction Survey; Overall sample n=2526
Table 8: Network Availability: Type of Service Network Availability &
Spread Overall Fixed Mobile
Fixed Line
Internet (copper)
Fibre Broadband
Mobile Voice
Mobile Voice+ Mobile Data
Data Specific SIM
Mobile Broadband
Availability of network all times
93 92 60 97 94 94 91 87
Figures above represent proportion (%) of satisfied consumers
Source: Customer Satisfaction Survey; Overall sample n=2526
Table 9: Network Availability: By Municipality Network Availability &
Spread Overall Al Daayen
Al Khor & Al Thakhira
Al Rayyan Al Shamal Al Wakra Doha Umm Salal
Availability of network all times
93 67 97 95 88 97 91 97
Figures above represent proportion (%) of satisfied consumers
Source: Customer Satisfaction Survey; Overall sample n=2526
93% 7% Availability of network at all times
Satisfied Not Satisfied

34 CRA Consumer Satisfaction Survey 2014
Table 10: Network Availability: By Service Provider Network Availability &
Spread Overall Ooredoo Vodafone
Availability of network all times
93 94 90
Figures above represent proportion (%) of satisfied consumers
Source: Customer Satisfaction Survey; Overall sample n=2526
Voice & SMS Related Services A majority (>95%) of customers are satisfied with voice and SMS related services provided by telecom
service providers in Qatar (Figure 12). It is also observed that the voice and SMS related services garner
high satisfaction among both mobile and fixed line users (Table 11). However, both Ooredoo and
Vodafone users are observed to be equally satisfied (Table 11).
Figure 12: Experience with Voice and SMS Services
Source: Customer Satisfaction Survey; Overall sample n=2526
Note: Numbers may not add up to 100 percent due to rounding
Parameters are arranged in order of importance to consumers
Table 11: Experience with Voice and SMS Services: Type of Service & Service Provider
Voice and SMS Services Overall Fixed Line Mobile Voice Ooredoo Vodafone
Voice quality & clarity 96 95 97 95 96
Lack of call drops 94 94 95 94 91
SMS delivery 97 NA 94 97 95
Figures above represent proportion (%) of satisfied consumers
Source: Customer Satisfaction Survey; Overall sample n=2526
Parameters are arranged in order of importance to consumers
Voice and SMS services are observed to be strong across most of the municipalities (Table 12). SMS
delivery in particular, is very strong across the municipalities. However, some dissatisfaction is observed
on voice quality/ clarity in Al Shamal (16% dissatisfaction), which could possibly be due to the fact that it
is one of the newer municipalities. Drive test can further reveal the exact areas where the issue is
particularly severe in the municipality. Also, 13% dissatisfaction is observed on ‘lack of call drops’ in Al
Wakra municipality.
Table 12: Experience with Voice and SMS Services: By Municipality
Voice and SMS Services Overall Al Daayen Al Khor &
Al Thakhira Al Rayyan Al Shamal Al Wakra Doha Umm Salal
Voice quality & clarity 96 100 97 100 84 88 95 99
96%
94%
97%
4%
7%
4%
Voice quality & clarity
Lack of call drops
SMS delivery
Satisfied Not Satisfied

35 CRA Consumer Satisfaction Survey 2014
Lack of call drops 94 92 96 92 98 87 96 97
SMS delivery 97 98 96 96 100 91 100 100
Figures above represent proportion (%) of satisfied consumers
Source: Customer Satisfaction Survey; Overall sample n=2526
Parameters are arranged in order of importance to consumers

36 CRA Consumer Satisfaction Survey 2014
Network Quality: Data Services Related With more than 90% satisfaction, data services are observed to be strong in Qatar (Figure 13).
An anecdotal experience by a satisfied customer (as reproduced below) is a good indicator and
motivator to move to higher speed networks:
“…my positive experience is during the launch of the 4G service and in particular with the Mi-fi
4G service. I was impressed by the speed of the Internet and that is when I realized Qatar is
changing for good” (18-25 years old Qatari Male)
Figure 13: Experience with Data Services Aspects
Source: Customer Satisfaction Survey; Overall sample n=2526
Note: Numbers may not add up to 100 percent due to rounding
Parameters are arranged in order of importance to consumers
Research shows that except for copper Internet (with around 70% dissatisfaction levels), data
consumers across most of the other services are satisfied with the quality of data network coverage,
speed and streaming quality (Table 13). However, more than 10% dissatisfaction is observed on data
speed and streaming quality among data SIM users. Further on a positive note, the experience with data
services in Qatar is observed to be more satisfactory as compared to that in countries benchmarked
with (Table 14). Vodafone users are relatively more satisfied with data services as compared to Ooredoo
users (Table 15).
Table 13: Experience with Data Services Aspects: Type of Service
Data Services Overall Fixed
Mobile
Fixed Line
Internet (copper)
Fibre Broadband
Mobile Voice
Mobile Voice+ Mobile Data
Data Specific SIM
Mobile Broadband
Quality of data services 93 NA 33 98 NA 94 91 97
Data network coverage 94 NA 32 98 NA 97 92 99
Speed of data services 93 NA 31 96 NA 96 88 95
Video access/streaming quality
92 NA 30 96 NA 95 89 97
Figures above represent proportion (%) of satisfied consumers
Source: Customer Satisfaction Survey; Overall sample n=2526
Parameters are arranged in order of importance to consumers
93%
94%
93%
92%
8%
6%
7%
8%
Quality of data services
Data network coverage
Speed of data services
Video access/ streaming quality
Satisfied Not Satisfied
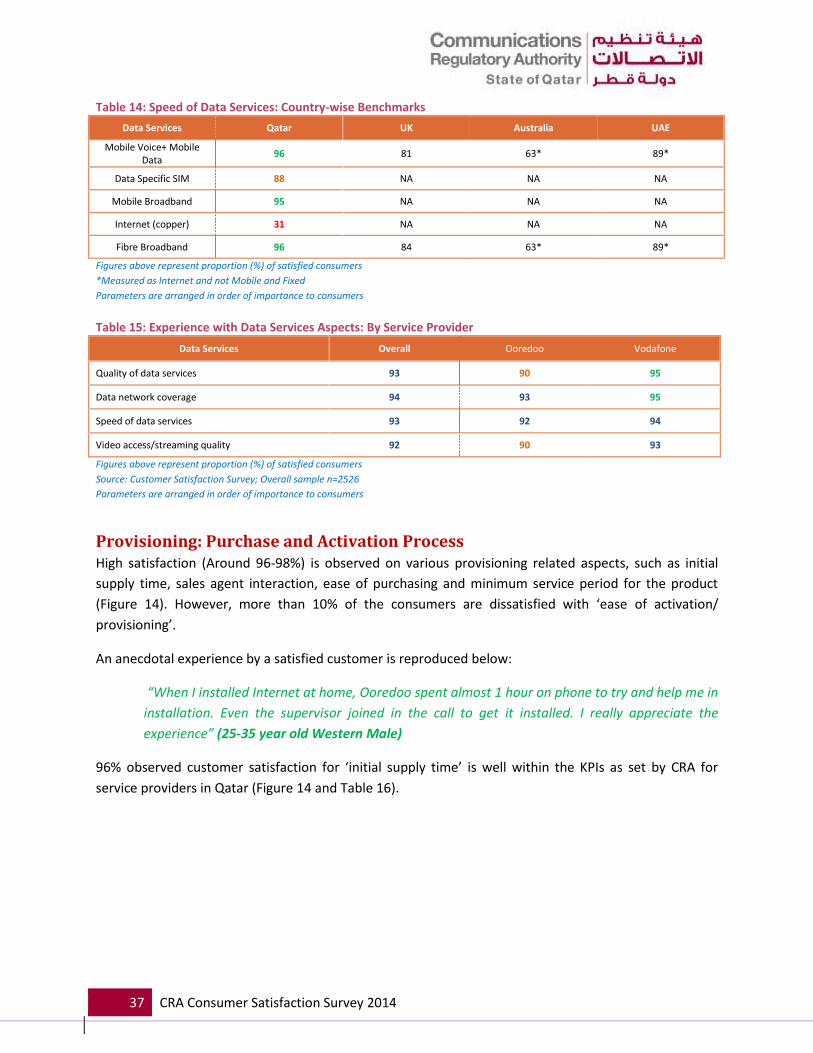
37 CRA Consumer Satisfaction Survey 2014
Table 14: Speed of Data Services: Country-wise Benchmarks
Data Services Qatar UK Australia UAE
Mobile Voice+ Mobile Data
96 81 63* 89*
Data Specific SIM 88 NA NA NA
Mobile Broadband 95 NA NA NA
Internet (copper) 31 NA NA NA
Fibre Broadband 96 84 63* 89*
Figures above represent proportion (%) of satisfied consumers
*Measured as Internet and not Mobile and Fixed
Parameters are arranged in order of importance to consumers
Table 15: Experience with Data Services Aspects: By Service Provider
Data Services Overall Ooredoo Vodafone
Quality of data services 93 90 95
Data network coverage 94 93 95
Speed of data services 93 92 94
Video access/streaming quality 92 90 93
Figures above represent proportion (%) of satisfied consumers
Source: Customer Satisfaction Survey; Overall sample n=2526
Parameters are arranged in order of importance to consumers
Provisioning: Purchase and Activation Process High satisfaction (Around 96-98%) is observed on various provisioning related aspects, such as initial
supply time, sales agent interaction, ease of purchasing and minimum service period for the product
(Figure 14). However, more than 10% of the consumers are dissatisfied with ‘ease of activation/
provisioning’.
An anecdotal experience by a satisfied customer is reproduced below:
“When I installed Internet at home, Ooredoo spent almost 1 hour on phone to try and help me in
installation. Even the supervisor joined in the call to get it installed. I really appreciate the
experience” (25-35 year old Western Male)
96% observed customer satisfaction for ‘initial supply time’ is well within the KPIs as set by CRA for
service providers in Qatar (Figure 14 and Table 16).

38 CRA Consumer Satisfaction Survey 2014
Figure 14: Provisioning Experience: Overall
Source: Customer Satisfaction Survey; Overall sample n=2526
Note: Numbers may not add up to 100 percent due to rounding
Parameters are arranged in order of importance to consumers
Table 16: CRA KPIs for Service Providers: QoS Standard & Target for Initial Supply Time # Name Fixed/ mobile Description/ Definition Standard Target
R11 Initial Supply
Time Fixed
The initial supply time is the period of time between the instant when the supply event is ordered (i.e. the order has been accepted as valid and complete by the network provider)
and the instant when the supply is completed.
NA
99% in < 5 calendar days except for FTTH For FTTH 99% in < 15
calendar days
R15 Service Delivery
Time Mobile
The service delivery time for customers is the period between the instant when the
registration with identification document and signature of the contract (if applicable) was
completed successfully and the instant when the service is available
NA 95 % in <2h
Source: Annex 2 of Service Regulatory Framework by CRA Qatar (2014)
KPIs as set by CRA may not be exactly comparable with customer satisfaction levels, which are based more on over all perceptions
Dissatisfaction on ease of activation/ provisioning is observed to be more prominent among mobile
broadband users (23% dissatisfaction), mobile voice (15% dissatisfaction) and fibre broadband (11%
dissatisfaction). High dissatisfaction among mobile broadband users could be a perception issue,
possibly on account of issues faced in using the dongle/ mi-fi device. Dissatisfaction on other
provisioning related parameters among various services users is observed to be minimal i.e. less than
10% (Table 17). Also, dissatisfaction on ease of activation/ provisioning is higher for Vodafone (15% as
compared to 10% for Ooredoo).
88%
97%
98%
96%
97%
12%
3%
2%
3%
3%
Ease of activation/ provisioning
Sales agent interacted with
Ease of purchasing the connection
Initial supply time
Minimum Service period for product
Satisfied Not Satisfied
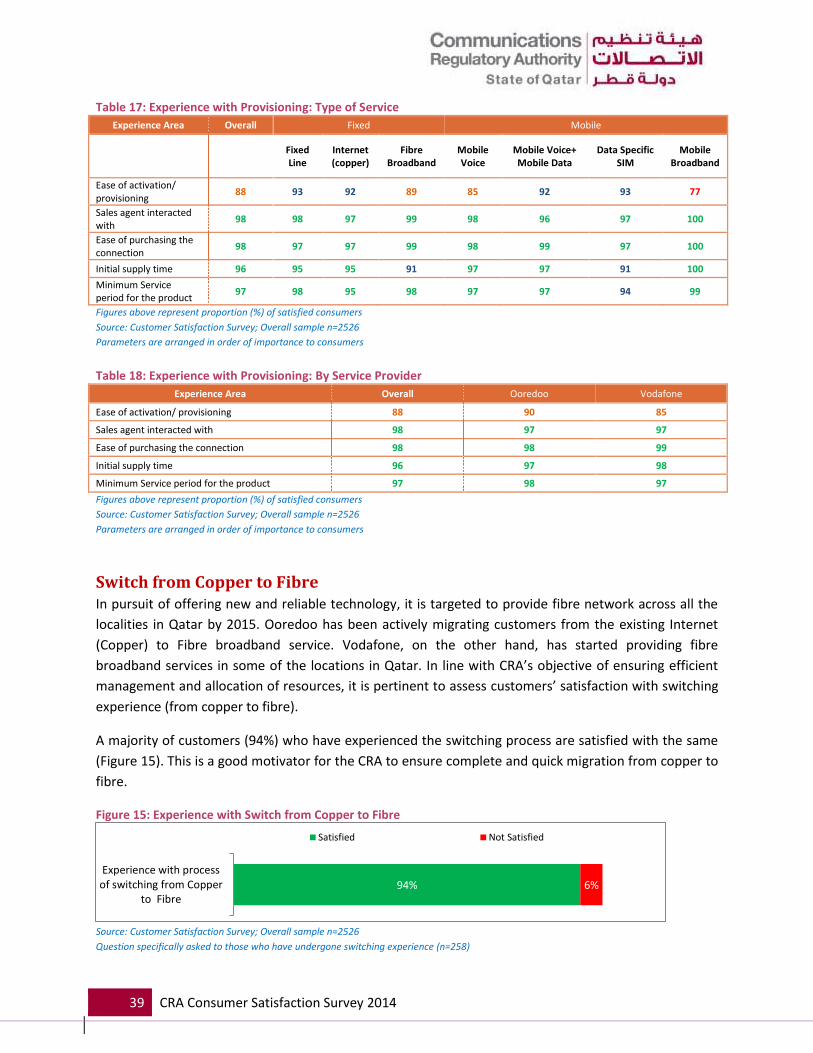
39 CRA Consumer Satisfaction Survey 2014
Table 17: Experience with Provisioning: Type of Service
Experience Area Overall Fixed Mobile
Fixed Line
Internet (copper)
Fibre Broadband
Mobile Voice
Mobile Voice+ Mobile Data
Data Specific SIM
Mobile Broadband
Ease of activation/ provisioning
88 93 92 89 85 92 93 77
Sales agent interacted with
98 98 97 99 98 96 97 100
Ease of purchasing the connection
98 97 97 99 98 99 97 100
Initial supply time 96 95 95 91 97 97 91 100
Minimum Service period for the product
97 98 95 98 97 97 94 99
Figures above represent proportion (%) of satisfied consumers
Source: Customer Satisfaction Survey; Overall sample n=2526
Parameters are arranged in order of importance to consumers
Table 18: Experience with Provisioning: By Service Provider
Experience Area Overall Ooredoo Vodafone
Ease of activation/ provisioning 88 90 85
Sales agent interacted with 98 97 97
Ease of purchasing the connection 98 98 99
Initial supply time 96 97 98
Minimum Service period for the product 97 98 97
Figures above represent proportion (%) of satisfied consumers
Source: Customer Satisfaction Survey; Overall sample n=2526
Parameters are arranged in order of importance to consumers
Switch from Copper to Fibre In pursuit of offering new and reliable technology, it is targeted to provide fibre network across all the
localities in Qatar by 2015. Ooredoo has been actively migrating customers from the existing Internet
(Copper) to Fibre broadband service. Vodafone, on the other hand, has started providing fibre
broadband services in some of the locations in Qatar. In line with CRA’s objective of ensuring efficient
management and allocation of resources, it is pertinent to assess customers’ satisfaction with switching
experience (from copper to fibre).
A majority of customers (94%) who have experienced the switching process are satisfied with the same
(Figure 15). This is a good motivator for the CRA to ensure complete and quick migration from copper to
fibre.
Figure 15: Experience with Switch from Copper to Fibre
Source: Customer Satisfaction Survey; Overall sample n=2526
Question specifically asked to those who have undergone switching experience (n=258)
94% 6%
Experience with processof switching from Copper
to Fibre
Satisfied Not Satisfied

40 CRA Consumer Satisfaction Survey 2014
Note: Numbers may not add up to 100 percent due to rounding
Among those who have migrated from copper to fibre, 90% of them are satisfied with the quality of
broadband post the switch (Figure 16). Only a miniscule 1% of the switchers feel that the quality has
declined. A high level of satisfaction with broadband is very encouraging for the growth of Qatar’s
telecom market.
Figure 16: Quality of Broadband after Switch
Source: Customer Satisfaction Survey; Overall sample n=2526
Question specifically asked to those who have undergone switching experience (n=258)
Note: Numbers may not add up to 100 percent due to rounding
Pricing and Tariffs/ Rate Plans
One of the key mandates for CRA is to ensure that individual consumers have an access to
communications services at affordable prices. It is thus pertinent to understand consumers’ perception
about pricing of telecom services, their experience with tariffs offered and MNP (Mobile Number
Portability) plan in particular.
Price Perception At an overall level, only about 1/5th (22%) of consumers believe the telecom services in the State of
Qatar to be low or very low priced. 12% of the consumers (in particular 25-44 year olds, Males and non-
Qataris) believe they are paying high/ very high prices for services rendered by the operators. Transient
population perceives the services to be more highly priced as compared to that perceived by
mainstream population (Figure 17).
Figure 17: Price Perception: Overall, By Population Type and Walker Benchmarks
Source: Customer Satisfaction Survey; Overall sample n=2526
Benchmark is from Walker Stakeholder Relationship Database
Note: Numbers may not add up to 100 percent due to rounding
90% 9% 1%
Broadband experienceafter switching from
copper
Very Much/ Much Better Same as earlier Less/ Much less than earlier
22% 25% 20% 14% 17%
65% 66% 65%
54% 59%
12% 9% 15% 32% 24%
Overall Mainstream Transient Global Benchmark North Amercia
Very Low/ Low Priced Moderately Priced High/ Very High Priced

41 CRA Consumer Satisfaction Survey 2014
Dissatisfaction on pricing is particularly higher among fixed service consumers, such as Internet (Copper)
and fixed voice users. Higher price perception for fixed voice is influenced by the International call
charges, Value added services and local charges. A similar pricing package for ‘Copper’ and ‘Fibre’ is
probably leading to discontent among ‘copper’ customers. Among mobile services, high dissatisfaction
on pricing is observed among mobile voice and data SIM users (Figure 18).
Pricing of mobile, fixed voice and fibre broadband services in Qatar are observed to be relatively better
vis-à-vis that in Australia and Singapore (Table 19).
Figure 18: Price Perception by Service
Source: Customer Satisfaction Survey; Overall sample n=2526
Note: Numbers may not add up to 100 percent due to rounding
21% 21% 38%
23% 23% 29% 43%
67% 70% 50% 69%
53% 30%
53%
12% 9% 12% 8% 24%
41%
4%
Mobile Voice Mobile Voice +Data
Data specificSIM
Mobilebroadband
Fixed Voice Internet(copper)
Fibre broadband
Very Low/ Low Priced Moderately Priced High/ Very High Priced
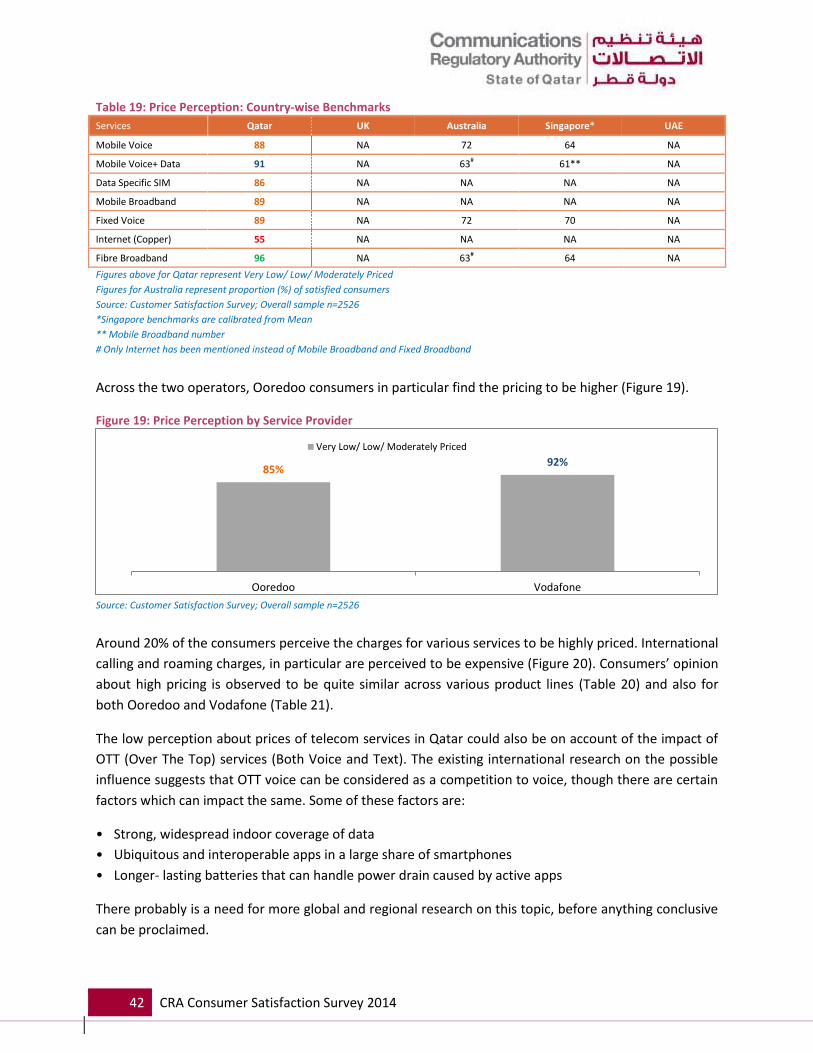
42 CRA Consumer Satisfaction Survey 2014
Table 19: Price Perception: Country-wise Benchmarks
Services Qatar UK Australia Singapore* UAE
Mobile Voice 88 NA 72 64 NA
Mobile Voice+ Data 91 NA 63# 61** NA
Data Specific SIM 86 NA NA NA NA
Mobile Broadband 89 NA NA NA NA
Fixed Voice 89 NA 72 70 NA
Internet (Copper) 55 NA NA NA NA
Fibre Broadband 96 NA 63# 64 NA Figures above for Qatar represent Very Low/ Low/ Moderately Priced
Figures for Australia represent proportion (%) of satisfied consumers
Source: Customer Satisfaction Survey; Overall sample n=2526
*Singapore benchmarks are calibrated from Mean
** Mobile Broadband number
# Only Internet has been mentioned instead of Mobile Broadband and Fixed Broadband
Across the two operators, Ooredoo consumers in particular find the pricing to be higher (Figure 19).
Figure 19: Price Perception by Service Provider
Source: Customer Satisfaction Survey; Overall sample n=2526
Around 20% of the consumers perceive the charges for various services to be highly priced. International
calling and roaming charges, in particular are perceived to be expensive (Figure 20). Consumers’ opinion
about high pricing is observed to be quite similar across various product lines (Table 20) and also for
both Ooredoo and Vodafone (Table 21).
The low perception about prices of telecom services in Qatar could also be on account of the impact of
OTT (Over The Top) services (Both Voice and Text). The existing international research on the possible
influence suggests that OTT voice can be considered as a competition to voice, though there are certain
factors which can impact the same. Some of these factors are:
• Strong, widespread indoor coverage of data
• Ubiquitous and interoperable apps in a large share of smartphones
• Longer- lasting batteries that can handle power drain caused by active apps
There probably is a need for more global and regional research on this topic, before anything conclusive
can be proclaimed.
85% 92%
Ooredoo Vodafone
Very Low/ Low/ Moderately Priced

43 CRA Consumer Satisfaction Survey 2014
Figure 20: Perceptions on Pricing Attributes
Source: Customer Satisfaction Survey; Overall sample n=2526
Parameters are arranged in order of importance to consumers
Note: Numbers may not add up to 100 percent due to rounding
42%
39%
37%
32%
36%
57%
55%
50%
42%
41%
45%
39%
41%
32%
38%
41%
31%
38%
34%
49%
40%
43%
19%
20%
30%
30%
23%
12%
7%
16%
9%
20%
13%
Local Call Charges
Value Add Services
International Call Charges
Cost of Data Charges (Roaming)
Cost of Call Charges (Roaming)
Initial Cost of Purchase of SIM
Installation Cost
Monthly Rental Charges
Initial Cost of Purchase of Data SIM
Cost of Data Charges
Cost of Data Device
Very Low/ Low Priced Moderately Priced High/ Very High Priced
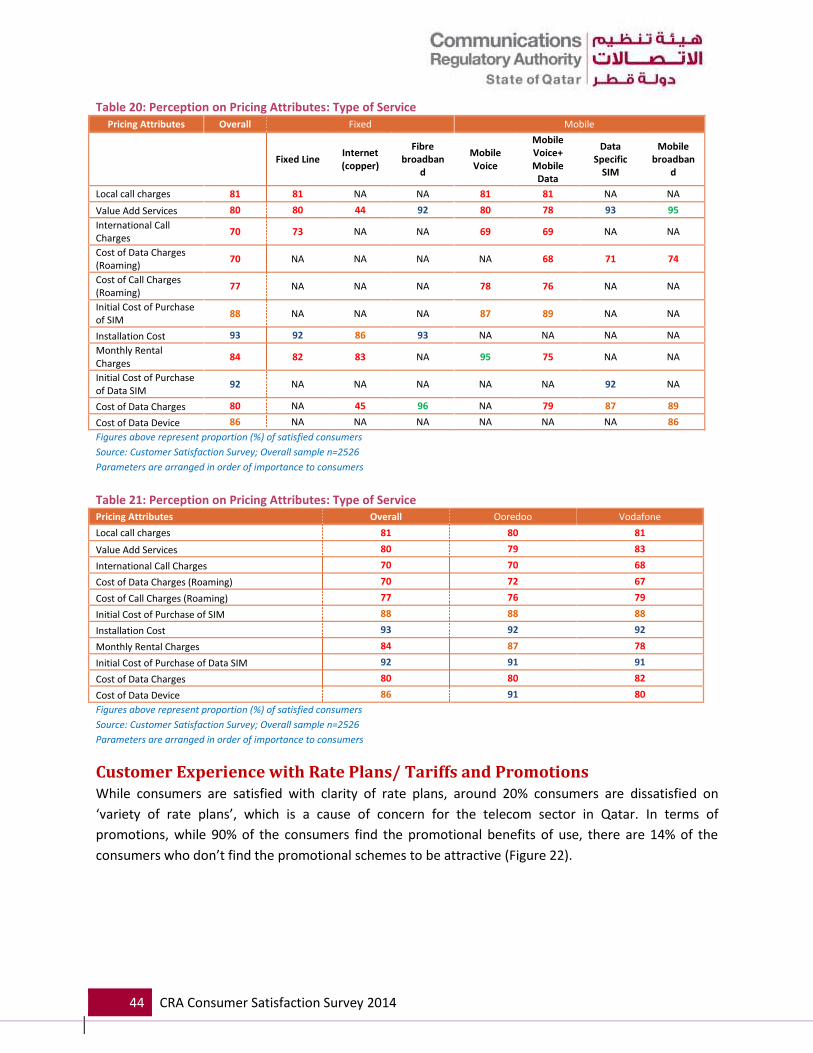
44 CRA Consumer Satisfaction Survey 2014
Table 20: Perception on Pricing Attributes: Type of Service Pricing Attributes Overall Fixed Mobile
Fixed Line Internet (copper)
Fibre broadban
d
Mobile Voice
Mobile Voice+ Mobile
Data
Data Specific
SIM
Mobile broadban
d
Local call charges 81 81 NA NA 81 81 NA NA
Value Add Services 80 80 44 92 80 78 93 95
International Call Charges
70 73 NA NA 69 69 NA NA
Cost of Data Charges (Roaming)
70 NA NA NA NA 68 71 74
Cost of Call Charges (Roaming)
77 NA NA NA 78 76 NA NA
Initial Cost of Purchase of SIM
88 NA NA NA 87 89 NA NA
Installation Cost 93 92 86 93 NA NA NA NA Monthly Rental Charges
84 82 83 NA 95 75 NA NA
Initial Cost of Purchase of Data SIM
92 NA NA NA NA NA 92 NA
Cost of Data Charges 80 NA 45 96 NA 79 87 89
Cost of Data Device 86 NA NA NA NA NA NA 86
Figures above represent proportion (%) of satisfied consumers
Source: Customer Satisfaction Survey; Overall sample n=2526
Parameters are arranged in order of importance to consumers
Table 21: Perception on Pricing Attributes: Type of Service Pricing Attributes Overall Ooredoo Vodafone
Local call charges 81 80 81
Value Add Services 80 79 83
International Call Charges 70 70 68
Cost of Data Charges (Roaming) 70 72 67
Cost of Call Charges (Roaming) 77 76 79
Initial Cost of Purchase of SIM 88 88 88
Installation Cost 93 92 92
Monthly Rental Charges 84 87 78
Initial Cost of Purchase of Data SIM 92 91 91
Cost of Data Charges 80 80 82
Cost of Data Device 86 91 80
Figures above represent proportion (%) of satisfied consumers
Source: Customer Satisfaction Survey; Overall sample n=2526
Parameters are arranged in order of importance to consumers
Customer Experience with Rate Plans/ Tariffs and Promotions While consumers are satisfied with clarity of rate plans, around 20% consumers are dissatisfied on
‘variety of rate plans’, which is a cause of concern for the telecom sector in Qatar. In terms of
promotions, while 90% of the consumers find the promotional benefits of use, there are 14% of the
consumers who don’t find the promotional schemes to be attractive (Figure 22).

45 CRA Consumer Satisfaction Survey 2014
Figure 21: Experience with Rate Plan/ Tariff and Promotions Sub-Attributes
Source: Customer Satisfaction Survey; Overall sample n=2526
Parameters are arranged in order of importance to consumers
Note: Numbers may not add up to 100 percent due to rounding
In contrast to high satisfaction among fibre broadband users, Internet (Copper) users are quite
dissatisfied (around 45% average dissatisfaction across parameters) with rate plans/ tariffs offered
(Table 22). This is probably on account of similar tariff structure for both copper and fibre services.
Dissatisfaction on ‘variety of rate plans’ is particularly higher among mobile broadband and mobile
voice/ data users. Mobile broadband users also do not find the promotion schemes to be attractive.
Dissatisfaction on ‘variety of rate plans’ is observed to be high (Around 20% dissatisfaction) among both
Ooredoo and Vodafone customers (Table 23).
91%
93%
82%
89%
96%
90%
86%
10%
8%
19%
10%
4%
10%
14%
Clear Terms and Conditions
Clarity of rate plans
Variety of rate plans to meet yourneeds
Competitiveness of Tariffs
Tariffs of the different services andoffers proposed
Usefulness of benefits of promotions
Attractiveness of Promotion schemes
Satisfied Not Satisfied

46 CRA Consumer Satisfaction Survey 2014
Table 22: Experience with Rate Plan/ Tariff and Promotions: Type of Service Rate Plan/ Tariff and
Promotions Overall Fixed Mobile
Fixed Line
Internet (copper)
Fibre broadband
Mobile Voice
Mobile Voice+ Mobile Data
Data Specific SIM
Mobile broadband
Clear Terms and Conditions 91 91 56 95 91 92 91 91
Clarity of rate plans 93 91 57 98 93 93 93 97
Variety of rate plans to meet your needs
82 87 55 94 81 83 90 71
Competitiveness of Tariffs 89 89 59 96 91 89 89 95
Tariffs of the different services and offers proposed
96 92 59 97 96 97 94 99
Usefulness of benefits of promotions
90 90 58 96 90 91 91 89
Attractiveness of Promotion schemes
86 86 56 96 87 87 88 76
Figures above represent proportion (%) of satisfied consumers
Source: Customer Satisfaction Survey; Overall sample n=2526
Parameters are arranged in order of importance to consumers
Table 23: Experience with Rate Plan/ Tariff and Promotions: Service Provider
Rate Plan/ Tariff and Promotions Overall Ooredoo Vodafone
Clear Terms and Conditions 91 91 90
Clarity of rate plans 93 91 93
Variety of rate plans to meet your needs 82 83 80
Competitiveness of Tariffs 89 89 91
Tariffs of the different services and offers proposed 96 95 97
Usefulness of benefits of promotions 90 90 90
Attractiveness of Promotion schemes 86 87 85
Figures above represent proportion (%) of satisfied consumers
Source: Customer Satisfaction Survey; Overall sample n=2526
Parameters are arranged in order of importance to consumers
Publishing of Tariff Tariff publishing by the service providers is an important regulatory requirement from CRA. This is done
so as to ensure fair tariffs by service providers and also to discourage hidden costs.
Presently, only 5% of the consumers are aware of the fact that CRA is mandated to get tariffs published
by the service providers (Figure 22). There is a critical need to enhance this awareness among
consumers.
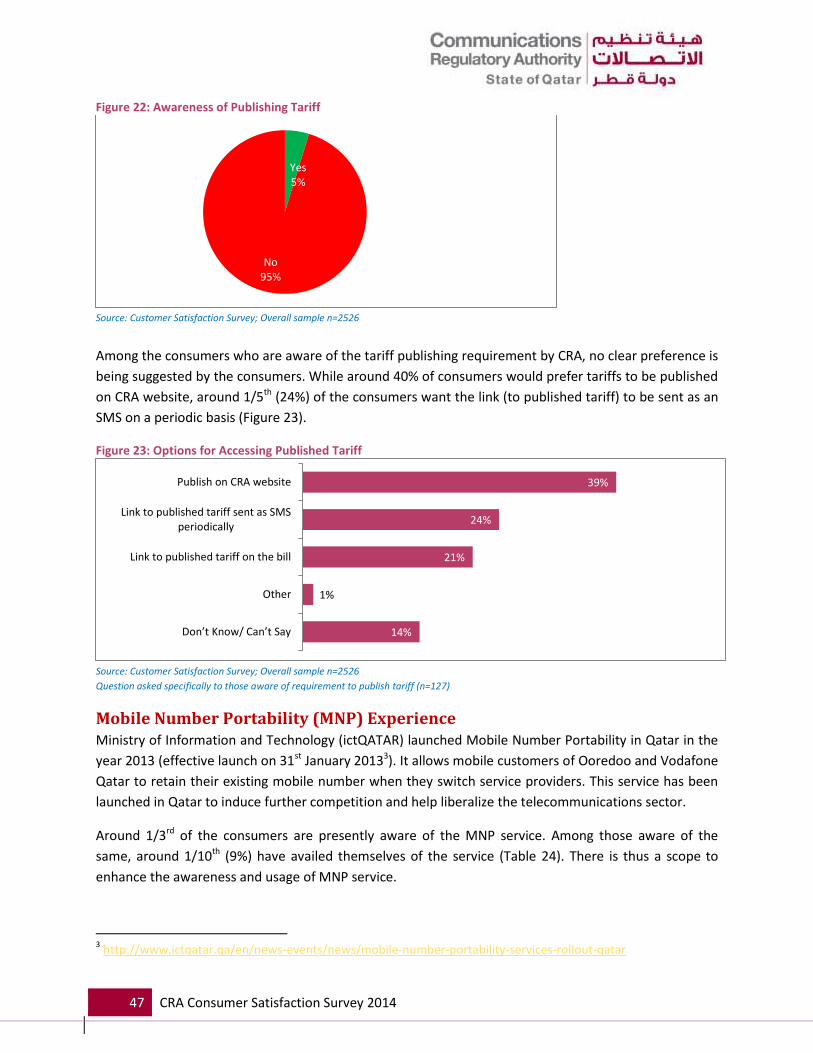
47 CRA Consumer Satisfaction Survey 2014
Figure 22: Awareness of Publishing Tariff
Source: Customer Satisfaction Survey; Overall sample n=2526
Among the consumers who are aware of the tariff publishing requirement by CRA, no clear preference is
being suggested by the consumers. While around 40% of consumers would prefer tariffs to be published
on CRA website, around 1/5th (24%) of the consumers want the link (to published tariff) to be sent as an
SMS on a periodic basis (Figure 23).
Figure 23: Options for Accessing Published Tariff
Source: Customer Satisfaction Survey; Overall sample n=2526
Question asked specifically to those aware of requirement to publish tariff (n=127)
Mobile Number Portability (MNP) Experience Ministry of Information and Technology (ictQATAR) launched Mobile Number Portability in Qatar in the
year 2013 (effective launch on 31st January 20133). It allows mobile customers of Ooredoo and Vodafone
Qatar to retain their existing mobile number when they switch service providers. This service has been
launched in Qatar to induce further competition and help liberalize the telecommunications sector.
Around 1/3rd of the consumers are presently aware of the MNP service. Among those aware of the
same, around 1/10th (9%) have availed themselves of the service (Table 24). There is thus a scope to
enhance the awareness and usage of MNP service.
3 http://www.ictqatar.qa/en/news-events/news/mobile-number-portability-services-rollout-qatar
Yes 5%
No 95%
39%
24%
21%
1%
14%
Publish on CRA website
Link to published tariff sent as SMSperiodically
Link to published tariff on the bill
Other
Don’t Know/ Can’t Say

48 CRA Consumer Satisfaction Survey 2014
It is further observed that 28% of consumers who have availed of MNP are dissatisfaction with the
process. There is thus a need to make the process customer friendly (Figure 24).
Some of the verbatim comments from customers regarding their number portability experience are
given below:
“I did change my fancy Vodafone number to Ooredoo but the process took too long. I wanted to
go back to Ooredoo for better network, but I think this long process is not good” (Qatari Male
18-25 years)
“My mother changed number to Vodafone and it was long process…I don’t think she liked that it
took so long” (Arab female, 25-35 years)
Table 24: Mobile Number Portability: Awareness and Subscription
Mobile Number Portability Proportion of Consumers
Awareness 32%
Availed of the Service (Among those aware) 9%
Figures above represent proportion (%) of consumers aware/ availed of the service
Source: Customer Satisfaction Survey; Overall sample n=2526
Figure 24: Experience with MNP
Source: Customer Satisfaction Survey; Overall sample n=2526
Question specifically asked to those who have availed the service (n=79)
Note: Numbers may not add up to 100 percent due to rounding
One of the reasons for dissatisfaction could be the time taken for porting, with more than half the
customers who availed of the service claiming it to have taken more than 5 days (Figure 25). There is a
need to have stringent SLAs in place and regular audits to ensure compliance with the same.
Figure 25: Time for Porting
Source: Customer Satisfaction Survey; Overall sample n=2526
Question specifically asked to those who have availed the service (n=79)
72% 28% Overall Experience with
MNP Process
Satisfied Not Satisfied
48%
15%
17%
12%
7%
1-5 days
6-10 days
11-15 days
More than 15 days
Don’t Know/ Can’t Say/ Refused

49 CRA Consumer Satisfaction Survey 2014
The key reasons for usage of MNP service are on account of better services (46% incidence) followed by
network (37%) and pricing (Figure 26).
On the other hand, the two key reasons cited by non-users of MNP are related to satisfaction with
existing operator (62%) followed by a lack of attractive competitive offer (38%). Interestingly, non-users
of the service don’t perceive the process to be complicated, which is not the case with actual users of
the scheme (Figure 27).
Figure 26: Reasons for Usage of MNP
Source: Customer Satisfaction Survey; Overall sample n=2526
Question specifically asked to those who have availed the service (n=79)
Figure 27: Reasons for Not Using MNP
Source: Customer Satisfaction Survey; Overall sample n=2526
Question specifically asked to those who have not availed of the service (n=946)
Market Competitiveness: Services and Prices The telecom market in Qatar has been continuously evolving with introduction of new technologies so
as to provide high quality services at competitive prices to end-users in the State of Qatar. Further, CRA
strives to ensure that the interests of consumers are protected by promoting a healthy competition in
the market.
46%
37%
22%
19%
13%
9%
7%
8%
For better service
For better network
Better prices or packages for calls
Better prices or packages for data
Better download speed
Just for the sake of experimenting
Better combined Voice & Data packages
Don’t Know/ Can’t Say
62%
38%
7%
1%
5%
Satisfied with my existing provider
Competitive offer is same/ not asattractive as present offer
It is a complicated/ hassle riddenprocess
Others
Don’t Know/ Can’t Say/ Refused
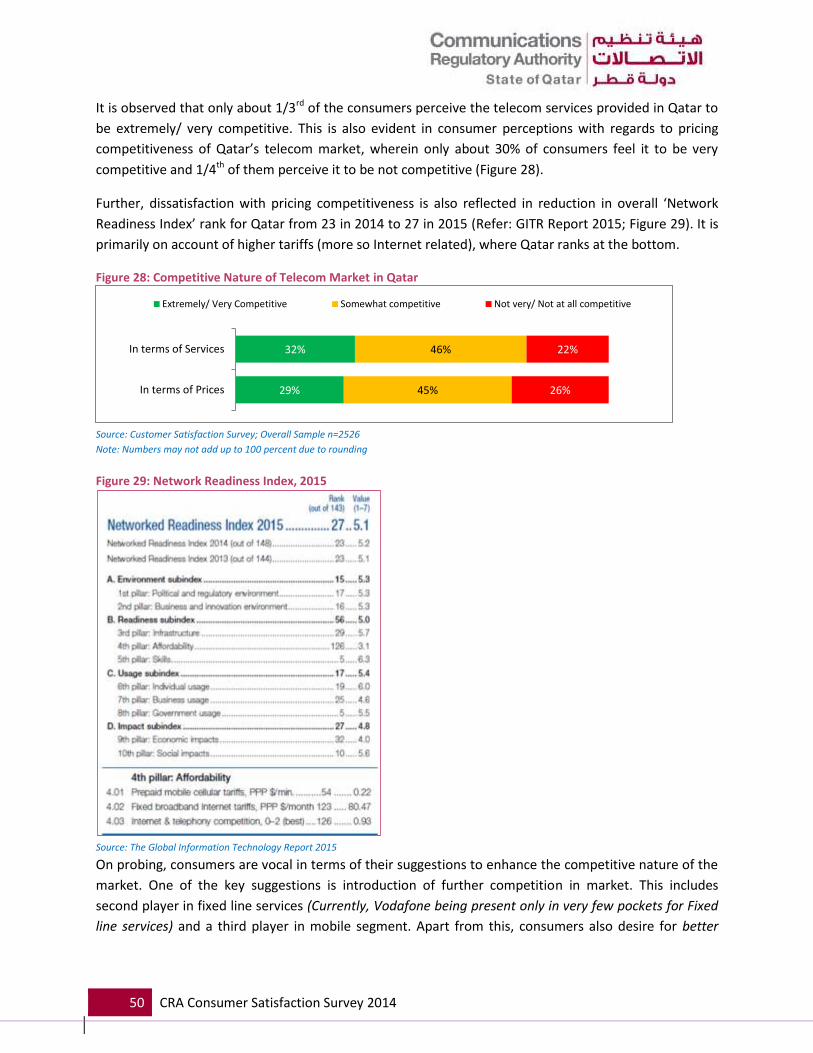
50 CRA Consumer Satisfaction Survey 2014
It is observed that only about 1/3rd of the consumers perceive the telecom services provided in Qatar to
be extremely/ very competitive. This is also evident in consumer perceptions with regards to pricing
competitiveness of Qatar’s telecom market, wherein only about 30% of consumers feel it to be very
competitive and 1/4th of them perceive it to be not competitive (Figure 28).
Further, dissatisfaction with pricing competitiveness is also reflected in reduction in overall ‘Network
Readiness Index’ rank for Qatar from 23 in 2014 to 27 in 2015 (Refer: GITR Report 2015; Figure 29). It is
primarily on account of higher tariffs (more so Internet related), where Qatar ranks at the bottom.
Figure 28: Competitive Nature of Telecom Market in Qatar
Source: Customer Satisfaction Survey; Overall Sample n=2526
Note: Numbers may not add up to 100 percent due to rounding
Figure 29: Network Readiness Index, 2015
Source: The Global Information Technology Report 2015
On probing, consumers are vocal in terms of their suggestions to enhance the competitive nature of the
market. One of the key suggestions is introduction of further competition in market. This includes
second player in fixed line services (Currently, Vodafone being present only in very few pockets for Fixed
line services) and a third player in mobile segment. Apart from this, consumers also desire for better
32%
29%
46%
45%
22%
26%
In terms of Services
In terms of Prices
Extremely/ Very Competitive Somewhat competitive Not very/ Not at all competitive

51 CRA Consumer Satisfaction Survey 2014
services at affordable rates, better Internet facilities (in terms of reduced prices and higher speeds) and
protection of consumers rights & interests (related to call charges, incorrect deductions etc.).
“When Vodafone was introduced there was huge competitive spirit, now I think there is lethargy
in the system” (Qatari Male 18-25 years)
“I think it is essential to have 3 players in the market. It would add a new vigor to the market.
But I don’t know if 3 players can sustain. It should not kill competition” (Western male, 25-35
years)
“…competition in fixed service- you are joking. There is only 1 service and it would be one service
only for long time. I don’t think Vodafone wants to enter fixed services” (Arab male, 35-45 years)
Complaint Resolution Mechanism Last, but not the least, CRA’s mandate is to manage a dispute resolution system that is transparent, fair,
speedy, and effective. It is thus essential to understand various modes used by consumers to lodge
complaints, their experience with the resolution system and awareness & usage of escalation
mechanism.
Incidence, Reasons & Modes Used for Raising Complaints It is observed that only about 7% customers have raised a complaint with their service provider in past 6
months (Figure 30). The percentage of customers raising complaints in the last 6 months for Vodafone is
slightly higher (8%) compared to Ooredoo (6%). Among those who have raised a complaint, More than
2/3rd (68%) of complaints raised are related to ‘network coverage/ connectivity related issues’. Apart
from this, some complaints are also related to payment and disconnection related issues (Figure 31).
This is slightly higher for Vodafone (78%) as compared to Ooredoo (62%) indicating slightly higher issues
of network related among Vodafone customers.
Figure 30: Raised a Complaint in Past 6 Months
Source: Customer Satisfaction Survey; Overall sample n=2526
Note: Numbers may not add up to 100 percent due to rounding
Yes 7%
No 93%

52 CRA Consumer Satisfaction Survey 2014
Figure 31: Reasons for Raising Complaint
Source: Customer Satisfaction Survey; Overall sample n=2526
Question specifically asked to those who have raised a complaint in past 6 months (n=235)
More than half (56%) of those who raised a complaint called up customer care center for the same
(Figure 32). Visit to company outlet is also used as a mode by 30% of the customers who raised a
complaint. While some consumers do raise complaint via e-mail, there is very minimal proportion of
customers who use other means of raising complaints {such as social media, Qatar government call
center (Hukoomi), Mobile apps by service providers, Mobile app by CRA (Arsel) etc.}.
There is thus a significant scope to encourage use of online modes (e-mail, mobile application and social
media) to lodge complaints. However, this needs to be backed-up by adequate and swift action so that
there is no gap between expectations and reality.
Figure 32: Usual Mode of Raising a Complaint
Source: Customer Satisfaction Survey; Overall sample n=2526
Question specifically asked to those who have raised a complaint in past 6 months (n=235)
68%
20%
15%
4%
3%
2%
0%
1%
Network coverage/ connectivity related
Payment related
Disconnection
For Value Added Services activated or deactivatedwithout your permission
Billing related
Cannot deactivate service
For Premium Messaging issues
Others
56%
30%
8%
4%
1%
1%
Calling up Customer Care Centre
Visit to Showroom
Social Media sites/ platforms
Mobile Application
Others
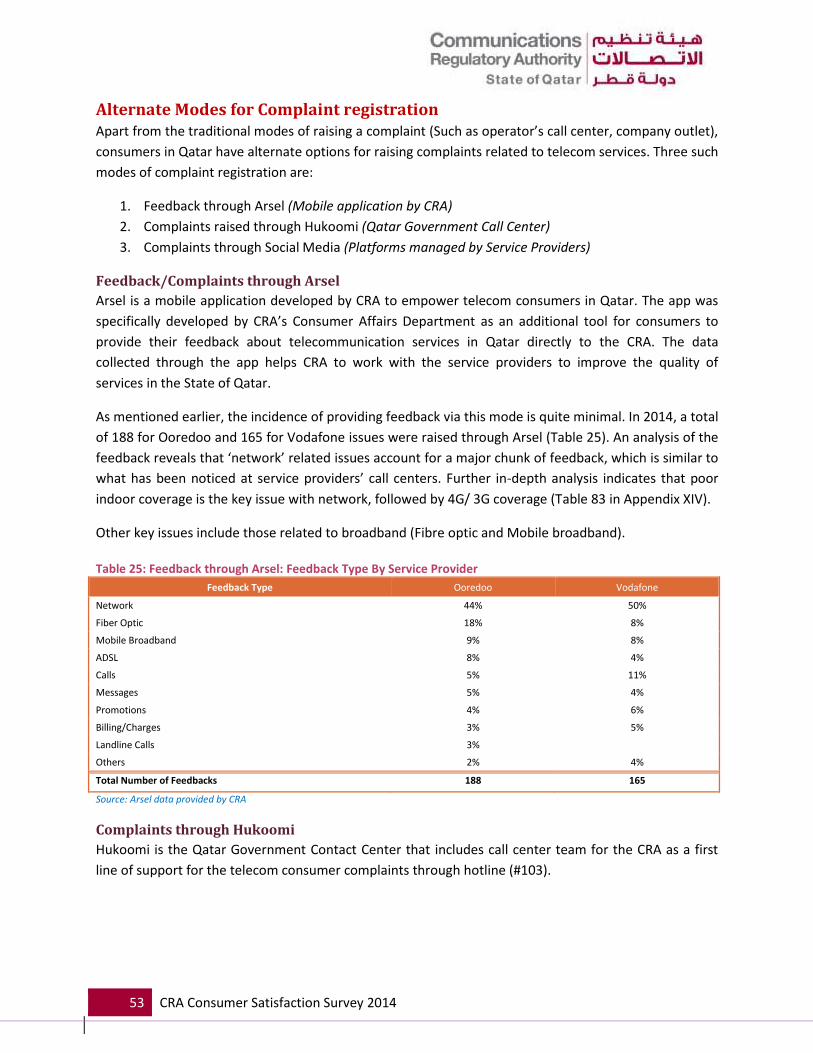
53 CRA Consumer Satisfaction Survey 2014
Alternate Modes for Complaint registration Apart from the traditional modes of raising a complaint (Such as operator’s call center, company outlet),
consumers in Qatar have alternate options for raising complaints related to telecom services. Three such
modes of complaint registration are:
1. Feedback through Arsel (Mobile application by CRA)
2. Complaints raised through Hukoomi (Qatar Government Call Center)
3. Complaints through Social Media (Platforms managed by Service Providers)
Feedback/Complaints through Arsel
Arsel is a mobile application developed by CRA to empower telecom consumers in Qatar. The app was
specifically developed by CRA’s Consumer Affairs Department as an additional tool for consumers to
provide their feedback about telecommunication services in Qatar directly to the CRA. The data
collected through the app helps CRA to work with the service providers to improve the quality of
services in the State of Qatar.
As mentioned earlier, the incidence of providing feedback via this mode is quite minimal. In 2014, a total
of 188 for Ooredoo and 165 for Vodafone issues were raised through Arsel (Table 25). An analysis of the
feedback reveals that ‘network’ related issues account for a major chunk of feedback, which is similar to
what has been noticed at service providers’ call centers. Further in-depth analysis indicates that poor
indoor coverage is the key issue with network, followed by 4G/ 3G coverage (Table 83 in Appendix XIV).
Other key issues include those related to broadband (Fibre optic and Mobile broadband).
Table 25: Feedback through Arsel: Feedback Type By Service Provider
Feedback Type Ooredoo Vodafone
Network 44% 50%
Fiber Optic 18% 8%
Mobile Broadband 9% 8%
ADSL 8% 4%
Calls 5% 11%
Messages 5% 4%
Promotions 4% 6%
Billing/Charges 3% 5%
Landline Calls 3%
Others 2% 4%
Total Number of Feedbacks 188 165
Source: Arsel data provided by CRA
Complaints through Hukoomi
Hukoomi is the Qatar Government Contact Center that includes call center team for the CRA as a first
line of support for the telecom consumer complaints through hotline (#103).
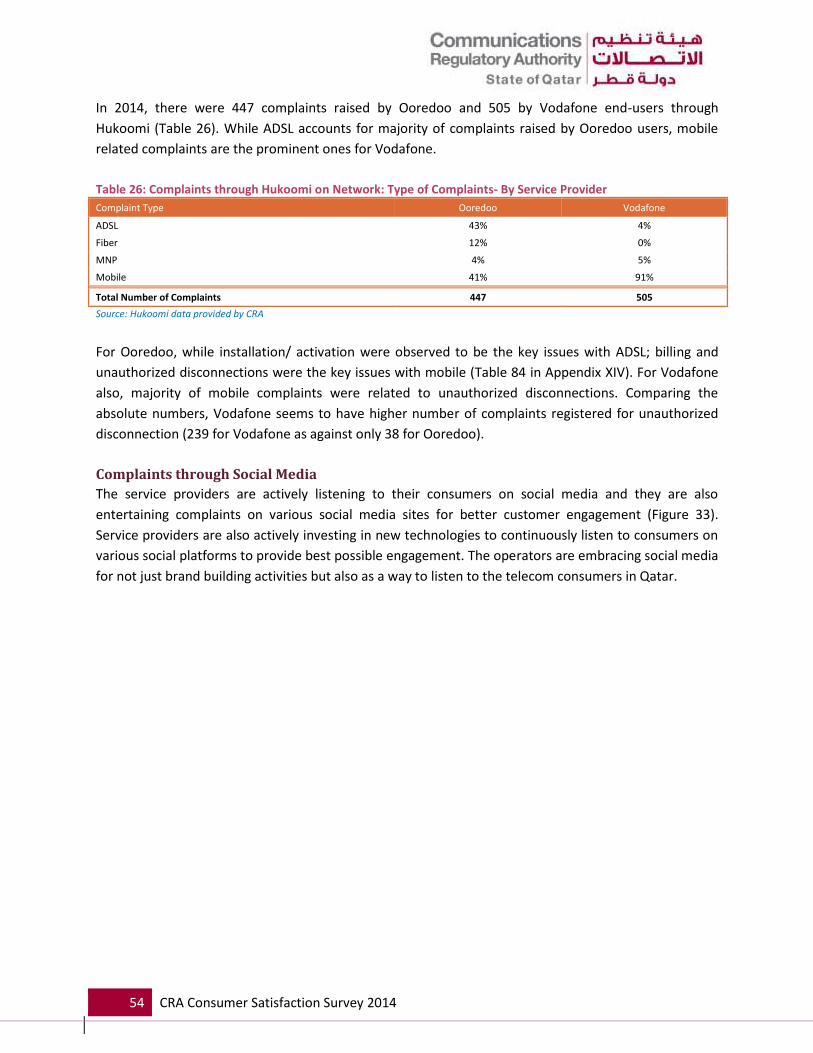
54 CRA Consumer Satisfaction Survey 2014
In 2014, there were 447 complaints raised by Ooredoo and 505 by Vodafone end-users through
Hukoomi (Table 26). While ADSL accounts for majority of complaints raised by Ooredoo users, mobile
related complaints are the prominent ones for Vodafone.
Table 26: Complaints through Hukoomi on Network: Type of Complaints- By Service Provider
Complaint Type Ooredoo Vodafone
ADSL 43% 4%
Fiber 12% 0%
MNP 4% 5%
Mobile 41% 91%
Total Number of Complaints 447 505
Source: Hukoomi data provided by CRA
For Ooredoo, while installation/ activation were observed to be the key issues with ADSL; billing and
unauthorized disconnections were the key issues with mobile (Table 84 in Appendix XIV). For Vodafone
also, majority of mobile complaints were related to unauthorized disconnections. Comparing the
absolute numbers, Vodafone seems to have higher number of complaints registered for unauthorized
disconnection (239 for Vodafone as against only 38 for Ooredoo).
Complaints through Social Media
The service providers are actively listening to their consumers on social media and they are also
entertaining complaints on various social media sites for better customer engagement (Figure 33).
Service providers are also actively investing in new technologies to continuously listen to consumers on
various social platforms to provide best possible engagement. The operators are embracing social media
for not just brand building activities but also as a way to listen to the telecom consumers in Qatar.

55 CRA Consumer Satisfaction Survey 2014
Figure 33: Complaints Received on Social Media
Source: Data from Service Providers
Complaint Resolution: Time Taken & Experience At an overall level, only 37% of customers claim that their complaints were resolved within 5 days of
registering the same (Figure 34). This is especially low for Vodafone (only 19% resolved within 5 days).
Given that the target as per CRA’s Service Regulatory Framework 2014 is to resolve 95% of complaints
within 5 working days (Table 27) for both mobile and fixed services, the existing customer experience
with complaint is observed to be quite weak.
Figure 34: Average Time for Resolving Complaints
Source: Customer Satisfaction Survey; Overall sample n=2526
Question specifically asked to those who have raised a complaint in past 6 months (n=235)
37%
38%
5%
3%
3%
14%
1-5 days
6-10 days
11-20 days
21-30 days
More than 30 days
Don’t Know/ Can’t Say

56 CRA Consumer Satisfaction Survey 2014
Table 27: CRA KPIs for Service Providers: QoS standard and Target for Customer Complaint Resolution # Name Fixed/ mobile Description/ Definition Standard Target
R1 Time to Resolve
customer complaints
Both mobile and fixed
This parameter assesses the period between the instant when a customer
complaint is notified to the Service Provider and the instant the cause for
the complaint has been resolved.
E1 5.10 95% in < 5 working
days
Source: Annex 2 of Service Regulatory Framework by CRA Qatar (2014)
As mentioned earlier, time taken to resolve the complaints is quite high in majority of the cases. As a
consequence of the same, there is a huge dissatisfaction (25%) on the speed of complaint resolution.
High dissatisfaction (14%) is also observed on the resolution within committed time period. This
indicates that while the customer care executives are committing time period as required, same is not
adhered to (Figure 35).
It is further observed that while speed is a bigger cause of dissatisfaction among Ooredoo consumers
(29% dissatisfaction), resolution within committed time period is a cause of concern (19%
dissatisfaction) among Vodafone users (Table 28).
Figure 35: Customer Experience with Complaint Resolution Process
Source: Customer Satisfaction Survey; Overall sample n=2526
Question specifically asked to those who have raised a complaint in past 6 months (n=235)
Parameters are arranged in order of importance to consumers
Note: Numbers may not add up to 100 percent due to rounding
Table 28: Experience with Complaint Resolution Process: Service Provider
Complaint Resolution Process Overall Ooredoo Vodafone
Ease of raising Complaint 96 92 100
Speed of Resolution of complaint 75 71 80
Resolved in the committed time period 86 92 81
Figures above represent proportion (%) of satisfied consumers
Source: Customer Satisfaction Survey; Overall sample n=2526
Parameters are arranged in order of importance to consumers
However, there are some positive comments also by customers with regards to their experience with
complaint resolution process.
96%
75%
86%
4%
25%
14%
Ease of raising complaint
Speed of resolution of complaint
Resolved in the committed timeperiod
Satisfied Not Satisfied

57 CRA Consumer Satisfaction Survey 2014
“I usually call the call center for all my complaints. It is very easy to do from mobile or landline
and you know it will be attended to.” (Arab Male, 35- 45 years)
“Communication wise, employees listen to you. Resolving issue might be longer, but staff is very
polite.” (Westerner Male, 25- 35 years)
Complaint Resolution Escalation Process CRA has established a complaint resolution escalation process wherein customers can escalate their
complaints to CRA if the issue is not resolved by their service provider.
Presently, only about 1/3rd (32%) of the consumers are aware of the escalation process for getting their
complaints resolved (Figure 36). There is thus a clear need for CRA to improve the awareness of
escalation process among consumers and thus effectively address consumer issues.
Figure 36: Awareness of Complaint Resolution Escalation Process
Source: Customer Satisfaction Survey; Overall sample n=2526
Question specifically asked to those who have raised a complaint in past 6 months (n=235)
Note: Numbers may not add up to 100 percent due to rounding
Consumer Rights Protection CRA is mandated to protect telecom consumers from misleading and unfair practices adopted by service
providers. This includes aspects such as unwanted promotions/ spamming, options to opt out of such
messages, misleading messages and also protection of consumer health from exposure to EMF
(Electromagnetic Fields) radiations.
More than 90% of the consumers are satisfied with reduced spamming and clarity of advertising/
communication by the service providers (Figure 37). Further, there is hardly anyone who has felt the
communication from service providers to be misleading (Figure 38). The very few who found the
promotions to be misleading talk about the inconsistency in rate plans (Between as informed by service
provider initially v/s as mentioned in the promotional message).
Aware 32%
Not Aware 68%

58 CRA Consumer Satisfaction Survey 2014
On the other hand, 11% of the consumers are dissatisfied with options provided by service providers to
opt out of promotional messages (Figure 37). This indicates that there is a need for service providers to
strictly adhere to guidelines issued by CRA with regards to advertising/ promotions. One of the
customers has stated thus:
“There are some issues in telecom in Qatar, particularly about mobile. You receive these
continuous promotion messages. I do not know how to unsubscribe and also they are in Arabic
which I do not understand” (25-35 year old Western Male)
Figure 37: Promotional Messages and Clarity of Advertising/ Communication
Source: Customer Satisfaction Survey; Overall sample n=2526
Note: Numbers may not add up to 100 percent due to rounding
Figure 38: Misleading SMS Promotion
Source: Customer Satisfaction Survey; Overall sample n=2526
As mentioned earlier, CRA has issued guidelines which include protection of public from exposure to
Electromagnetic Fields (EMF) radiations within the frequency range of cellular mobile services.
90%
89%
96%
10%
11%
4%
Reduced spamming and unwantedpromotions
Options to opt out of promotionalmessages
Clarity of advertising/ communication
Satisfied Not Satisfied
Misleading SMS promotions
No misleading SMS promotions
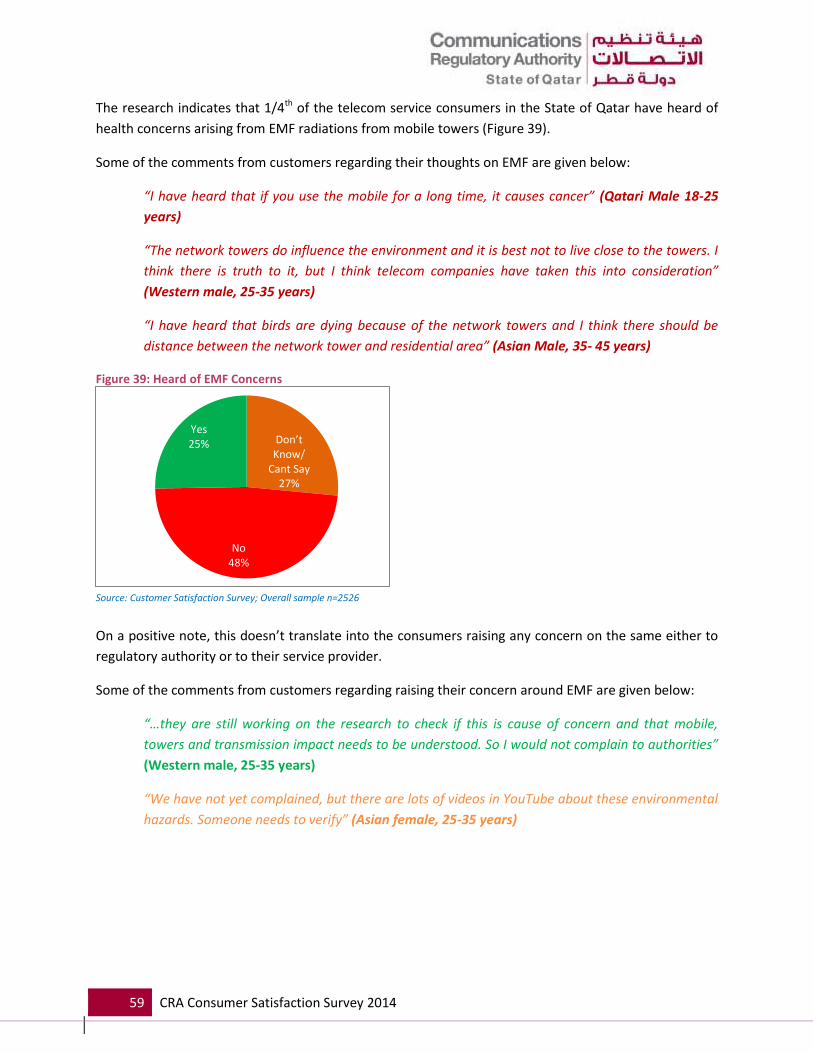
59 CRA Consumer Satisfaction Survey 2014
The research indicates that 1/4th of the telecom service consumers in the State of Qatar have heard of
health concerns arising from EMF radiations from mobile towers (Figure 39).
Some of the comments from customers regarding their thoughts on EMF are given below:
“I have heard that if you use the mobile for a long time, it causes cancer” (Qatari Male 18-25
years)
“The network towers do influence the environment and it is best not to live close to the towers. I
think there is truth to it, but I think telecom companies have taken this into consideration”
(Western male, 25-35 years)
“I have heard that birds are dying because of the network towers and I think there should be
distance between the network tower and residential area” (Asian Male, 35- 45 years)
Figure 39: Heard of EMF Concerns
Source: Customer Satisfaction Survey; Overall sample n=2526
On a positive note, this doesn’t translate into the consumers raising any concern on the same either to
regulatory authority or to their service provider.
Some of the comments from customers regarding raising their concern around EMF are given below:
“…they are still working on the research to check if this is cause of concern and that mobile,
towers and transmission impact needs to be understood. So I would not complain to authorities”
(Western male, 25-35 years)
“We have not yet complained, but there are lots of videos in YouTube about these environmental
hazards. Someone needs to verify” (Asian female, 25-35 years)
Don’t Know/
Cant Say 27%
No 48%
Yes 25%

60 CRA Consumer Satisfaction Survey 2014
Service Providers: Customer Loyalty, Brand Image Perceptions
and Experience with Key Touch-points Apart from the impact that consumers’ opinions and experience have on CRA’s mandate for the telecom
sector in the State of Qatar, it is also important to understand how the service providers are faring on
aspects, which are of specific relevance to them. Some of these aspects are related to customer loyalty
(a long term indicator of business success), brand image perceptions (as strong image perceptions tend
to lead to stronger customer loyalty) and customers’ experience with some of the key touch-points
(such as company outlet, customer care center, social media and connection specific experiences such
as recharge/ top-up for prepaid users and billing/ payment for postpaid users).
An understanding of these aspects would help lay out clear action roadmap for the two service
providers.
Customer Loyalty Loyalty captures customers’ perceptions and attitudes about a particular brand or service, including
whether or not they intend to stay as a customer in foreseeable future. A customer can be satisfied
with a company without being loyal. Only working to build a strong relationship with the customer will
help to improve loyalty. Over the years, the Walker Loyalty Reports have consistently revealed one
major interesting fact- ‘satisfaction does not lead to loyalty or business success (i.e. profitability) and,
therefore, is not a good measure of how customers will act in the future’. Satisfaction only captures a
company’s ability to meet their customers’ minimum requirements and simply measures past
experiences.
Strong customer loyalty can help telecom companies to realize significant financial benefits, including
reduced sales costs due to better client retention, increased profitability through expanded
relationships, and new revenue from customer referrals. Companies with more loyal customer bases
consistently tend to report better results in terms of profitability.
Walker classifies customer loyalty into four key segments, viz.
1. Truly Loyal: Those who feel positive towards the brand/ service and intend to recommend/ use
2. Trapped: Those who feel neutral or negative and yet intend to recommend/ continue.
Understanding this group can help pinpoint on how to improve their attitude
3. Accessible: Those who feel positive and yet not likely to recommend/ continue
4. High Risk: Those who don’t feel positive and are not planning to continue the relationship
Ooredoo customers are observed to be more loyal (27% classified as Truly Loyal) towards their operator,
vis-à-vis that observed for Vodafone customers (16% classified as Truly Loyal). Consequently, it is also
observed that there are more ‘High Risk’ customers for Vodafone than that for Ooredoo. Loyalty among
both Ooredoo and Vodafone customers in Qatar is observed to be lower than global (57% Truly Loyal) as
well as American and European loyalty norms for telecom sector (Figure 40).

61 CRA Consumer Satisfaction Survey 2014
High level of ‘High Risk’ and ‘Trapped’ customers imply that there is a significant proportion of users
who are expecting much better level of services than what they are experiencing currently.
Figure 40: Loyalty Segmentation: Overall and Walker Benchmarks
Source: Customer Satisfaction Survey; Overall sample=2526
Benchmarks are from Walker Stakeholder Satisfaction Database for average of all telecom providers
Note: Numbers may not add up to 100 percent due to rounding
In terms of the products, customers using fibre broadband, fixed voice and data SIM services are
relatively more loyal as compared to those using other services. Further, High percentage of ‘High Risk’
customers is observed in Internet (copper) and this can be an indication of their anticipation to quickly
migrate to Fibre broadband (Figure 41).
Figure 41: Loyalty Segmentation: By Type of Service
Source: Customer Satisfaction Survey; Overall sample=2526
Note: Numbers may not add up to 100 percent due to rounding
Customers from the mainstream population are observed to be more loyal as compared to those from
transient population. However, there are a significant proportion of trapped customers for both the
population segments.
As expected, the postpaid consumers are observed to be more loyal as compared to prepaid consumers.
This is probably on account of contracts for postpaid customers (which lead to higher costs of switching
for consumers) and lacking of the same in the prepaid services.
27% 16%
57% 60% 62% 5% 8%
9% 7% 5%
38% 32%
18% 17% 24% 30%
43%
16% 16% 9%
Ooredoo Vodafone Global Benchmark North America Benchmark Europe Benchmark
Truly Loyal Accesible Trapped High Risk
32% 16%
33% 25% 21% 32% 15%
7%
3%
3% 7% 8%
2%
1%
40%
26%
43% 29% 38%
40%
46%
21%
56%
21% 39% 32% 26%
37%
Fixed Voice Internet(copper)
Fibre broadband Mobile Voice Mobile Voice +Data
Data specificSIM
Mobilebroadband
Truly Loyal Accesible Trapped High Risk

62 CRA Consumer Satisfaction Survey 2014
Behavioral Loyalty Behavioral loyalty is one of the core components of customer loyalty. From an individual consumer
perspective, behavioral loyalty has three key metrics, viz. intention to continue, intention to purchase
again and intention to recommend. However, the most important is intention to recommend and is
explored here.
Intention to Recommend In line with customer loyalty, a high proportion (64%) of Ooredoo customers are likely to recommend
their service provider as compared to 48% for Vodafone customers. The overall brand advocacy
(intention to recommend) in telecom sector in Qatar is observed to be at par with global benchmarks
(Figure 42).
Figure 42: Intention to Recommend
Source: Customer Satisfaction Survey; Overall sample n=2526
Global Benchmark is from Walker Stakeholder Relationship Database
Note: Numbers may not add up to 100 percent due to rounding
Relatively lower recommendation levels for mobile voice/ data and mobile broadband (Around 60%
likelihood) services indicate a need to understand consumer expectations and address the same (Figure
43). Users of fibre broadband, fixed voice and data SIM (>70% likelihood for these services) are more
likely to recommend the brand they are using for these services. The higher recommendation for fibre
broadband (76%) and fixed voice (72%) could be due to lack of competition and consumers being forced
to recommend.
Figure 43: Intention to Recommend: Type Of Service
64% 48%
60% 72%
54%
35% 51% 27%
21%
31%
1% 1% 13% 7% 16%
Ooredoo Vodafone Global Benchmark North AmericaBenchmark
Europe Benchmark
Extremely/ Very Likely Somewhat Likely Not very/ Not at all Likely
72%
42%
76% 55% 60%
72% 62%
24%
56%
23% 43% 39% 26% 38%
4% 2% 1% 2% 1% 2%
Fixed Voice Internet(copper)
Fibre broadband Mobile Voice Mobile Voice +Data
Data specificSIM
Mobilebroadband
Extremely/ Very Likely Somewhat Likely Not very/ Not at all Likely
63 CRA Consumer Satisfaction Survey 2014
Source: Customer Satisfaction Survey; Overall sample n=2526
Note: Numbers may not add up to 100 percent due to rounding
Postpaid customers (63%) have a slightly higher tendency to recommend the telecommunication
services as against the prepaid (57%) customers.
The intention to recommend the service provider is significantly higher among females as compared to
males. Also, Qataris are more positively disposed to recommend their service provider as compared to
that for non-Qataris.
Brand Image Perceptions Basis their own experience and what they see and hear around them, consumers do create certain
image perceptions of the brands. These image perceptions are formed over a period of time and
consequently, take time to change as well. 10 key image statements were identified to assess brand
perceptions in consumers’ minds.
In this survey, customers were asked for their endorsements on various image statements across
services/ service providers. Endorsements are defined as the proportion of customers who either agree
or strongly agree that the brand they are using is associated with a particular brand image parameter.
At an overall level, moderate endorsements are observed across the image parameters. With just
around 50% positive endorsements, there is a scope to enhance the perception of service providers
across most of the image parameters (Table 29). In line with higher customer loyalty, endorsements
among Ooredoo customers are better than that among Vodafone customers.
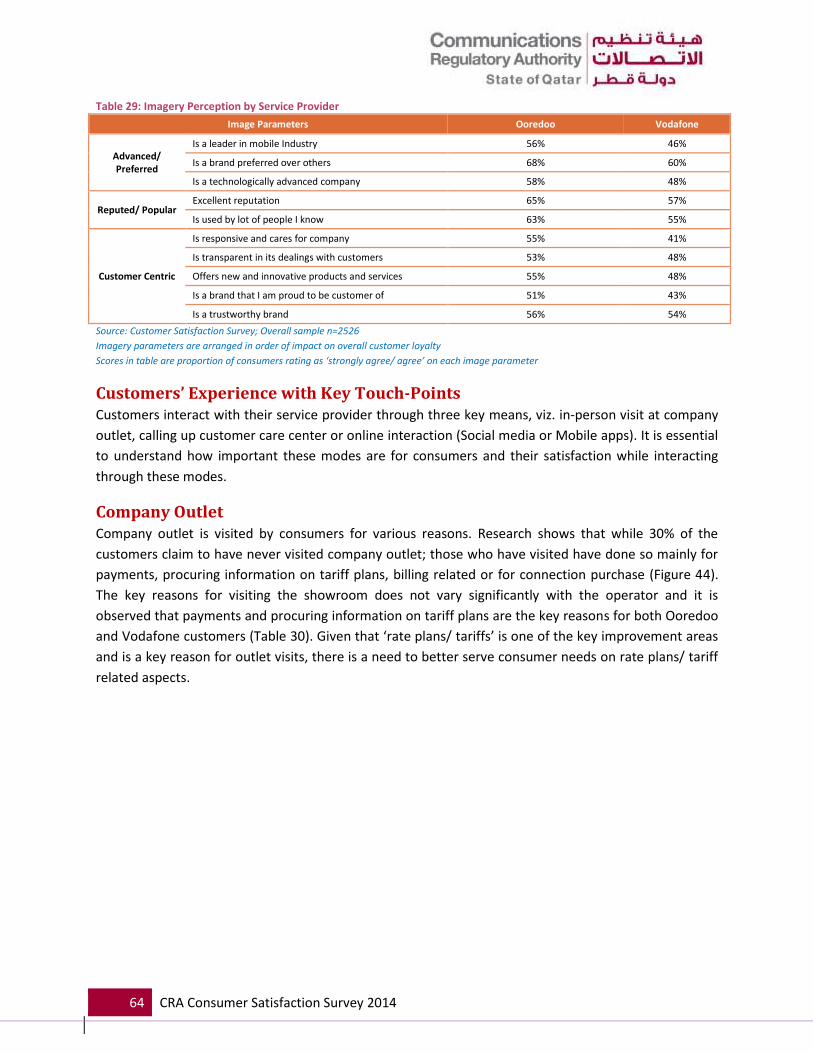
64 CRA Consumer Satisfaction Survey 2014
Table 29: Imagery Perception by Service Provider
Image Parameters Ooredoo Vodafone
Advanced/ Preferred
Is a leader in mobile Industry 56% 46%
Is a brand preferred over others 68% 60%
Is a technologically advanced company 58% 48%
Reputed/ Popular Excellent reputation 65% 57%
Is used by lot of people I know 63% 55%
Customer Centric
Is responsive and cares for company 55% 41%
Is transparent in its dealings with customers 53% 48%
Offers new and innovative products and services 55% 48%
Is a brand that I am proud to be customer of 51% 43%
Is a trustworthy brand 56% 54%
Source: Customer Satisfaction Survey; Overall sample n=2526
Imagery parameters are arranged in order of impact on overall customer loyalty
Scores in table are proportion of consumers rating as ‘strongly agree/ agree’ on each image parameter
Customers’ Experience with Key Touch-Points Customers interact with their service provider through three key means, viz. in-person visit at company
outlet, calling up customer care center or online interaction (Social media or Mobile apps). It is essential
to understand how important these modes are for consumers and their satisfaction while interacting
through these modes.
Company Outlet Company outlet is visited by consumers for various reasons. Research shows that while 30% of the
customers claim to have never visited company outlet; those who have visited have done so mainly for
payments, procuring information on tariff plans, billing related or for connection purchase (Figure 44).
The key reasons for visiting the showroom does not vary significantly with the operator and it is
observed that payments and procuring information on tariff plans are the key reasons for both Ooredoo
and Vodafone customers (Table 30). Given that ‘rate plans/ tariffs’ is one of the key improvement areas
and is a key reason for outlet visits, there is a need to better serve consumer needs on rate plans/ tariff
related aspects.
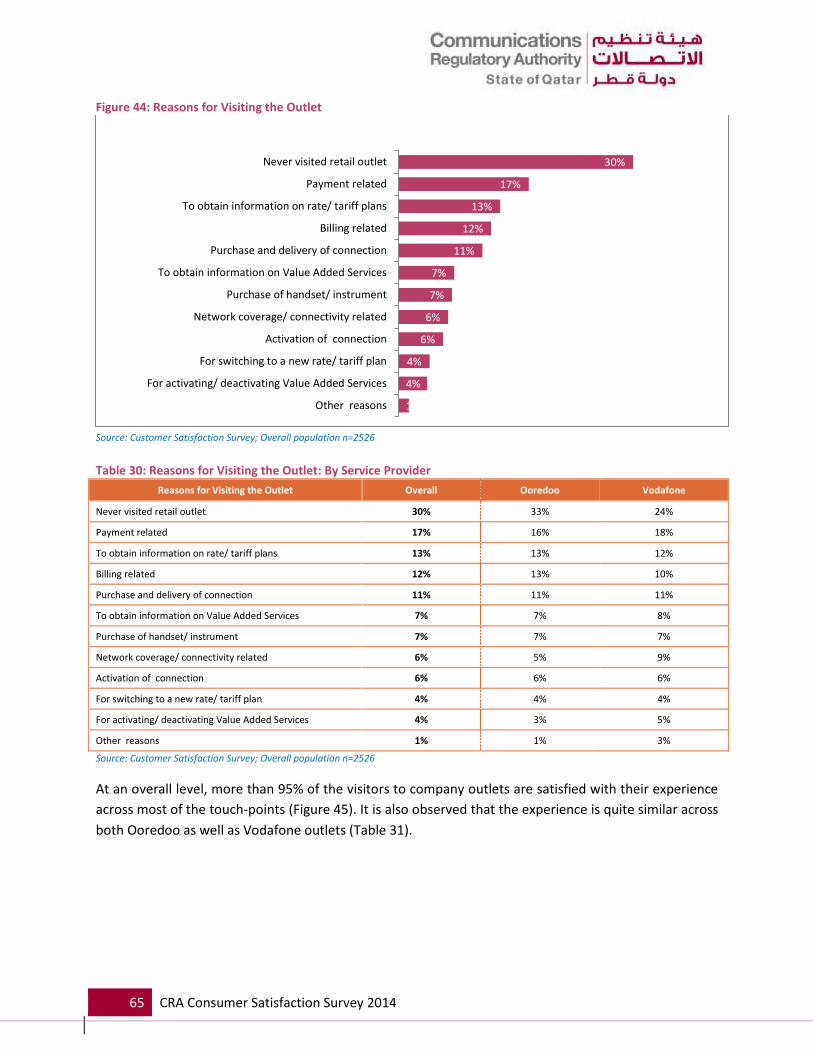
65 CRA Consumer Satisfaction Survey 2014
Figure 44: Reasons for Visiting the Outlet
Source: Customer Satisfaction Survey; Overall population n=2526
Table 30: Reasons for Visiting the Outlet: By Service Provider
Reasons for Visiting the Outlet Overall Ooredoo Vodafone
Never visited retail outlet 30% 33% 24%
Payment related 17% 16% 18%
To obtain information on rate/ tariff plans 13% 13% 12%
Billing related 12% 13% 10%
Purchase and delivery of connection 11% 11% 11%
To obtain information on Value Added Services 7% 7% 8%
Purchase of handset/ instrument 7% 7% 7%
Network coverage/ connectivity related 6% 5% 9%
Activation of connection 6% 6% 6%
For switching to a new rate/ tariff plan 4% 4% 4%
For activating/ deactivating Value Added Services 4% 3% 5%
Other reasons 1% 1% 3%
Source: Customer Satisfaction Survey; Overall population n=2526
At an overall level, more than 95% of the visitors to company outlets are satisfied with their experience
across most of the touch-points (Figure 45). It is also observed that the experience is quite similar across
both Ooredoo as well as Vodafone outlets (Table 31).
30%
17%
13%
12%
11%
7%
7%
6%
6%
4%
4%
1%
Never visited retail outlet
Payment related
To obtain information on rate/ tariff plans
Billing related
Purchase and delivery of connection
To obtain information on Value Added Services
Purchase of handset/ instrument
Network coverage/ connectivity related
Activation of connection
For switching to a new rate/ tariff plan
For activating/ deactivating Value Added Services
Other reasons
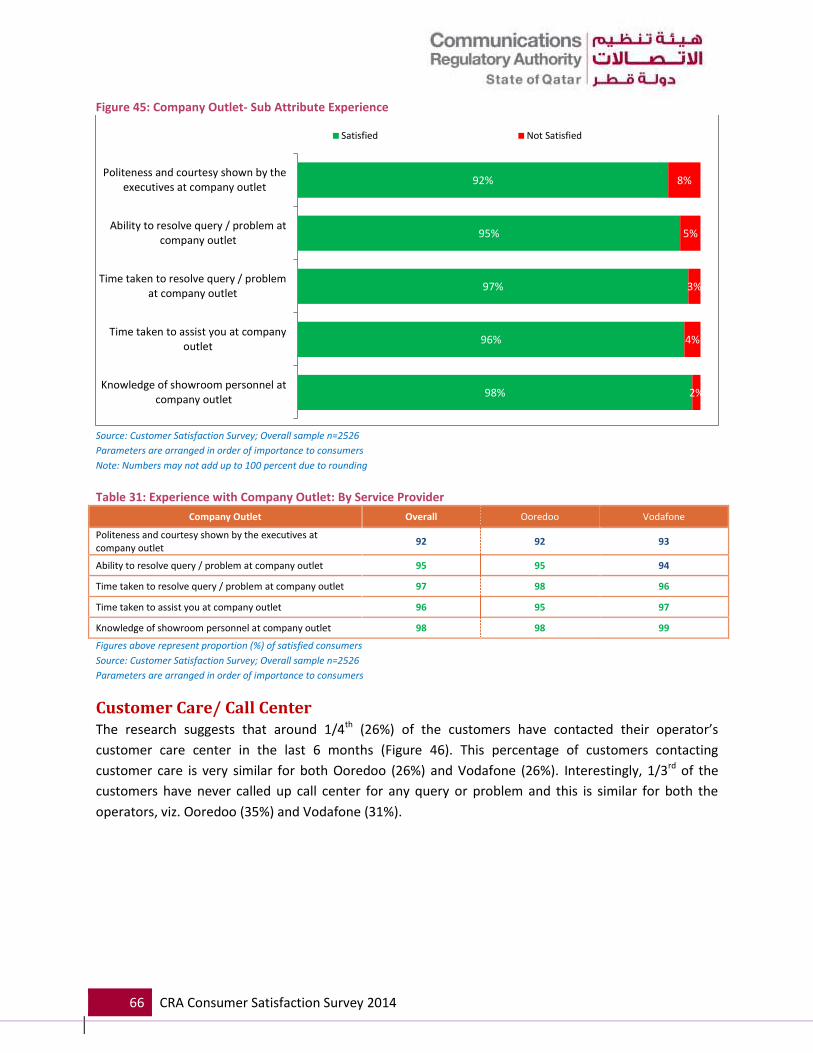
66 CRA Consumer Satisfaction Survey 2014
Figure 45: Company Outlet- Sub Attribute Experience
Source: Customer Satisfaction Survey; Overall sample n=2526
Parameters are arranged in order of importance to consumers
Note: Numbers may not add up to 100 percent due to rounding
Table 31: Experience with Company Outlet: By Service Provider
Company Outlet Overall Ooredoo Vodafone
Politeness and courtesy shown by the executives at company outlet
92 92 93
Ability to resolve query / problem at company outlet 95 95 94
Time taken to resolve query / problem at company outlet 97 98 96
Time taken to assist you at company outlet 96 95 97
Knowledge of showroom personnel at company outlet 98 98 99
Figures above represent proportion (%) of satisfied consumers
Source: Customer Satisfaction Survey; Overall sample n=2526
Parameters are arranged in order of importance to consumers
Customer Care/ Call Center The research suggests that around 1/4th (26%) of the customers have contacted their operator’s
customer care center in the last 6 months (Figure 46). This percentage of customers contacting
customer care is very similar for both Ooredoo (26%) and Vodafone (26%). Interestingly, 1/3rd of the
customers have never called up call center for any query or problem and this is similar for both the
operators, viz. Ooredoo (35%) and Vodafone (31%).
92%
95%
97%
96%
98%
8%
5%
3%
4%
2%
Politeness and courtesy shown by theexecutives at company outlet
Ability to resolve query / problem atcompany outlet
Time taken to resolve query / problemat company outlet
Time taken to assist you at companyoutlet
Knowledge of showroom personnel atcompany outlet
Satisfied Not Satisfied

67 CRA Consumer Satisfaction Survey 2014
Figure 46: Called the Customer Care
Source: Customer Satisfaction Survey; Overall sample n=2526
Note: Numbers may not add up to 100 percent due to rounding
Similar to that observed for company outlet, ‘obtaining information on rate/ tariff plans’ remains the key
reason for calling customer care center as well (Figure 47). This is particularly higher among Vodafone
consumers (33%) as compared to Ooredoo (27%).
Also, apart from regular issues related to billing & payment, customers also call customer care for
network related queries/ issues. Interestingly, the most important reason for contacting Vodafone call
center is for Network/ coverage issues (36%) while for Ooredoo it is about obtaining information on rate
plans (27%).
Figure 47: Reasons for Calling Customer Care Call Center
Source: Customer Satisfaction Survey; Overall sample n=2526
Question asked specifically to those calling in last 6 months (n=1089)
Never Called Customer
Care 33%
More than 6 months back
41%
Within last 6 months
26%
29%
28%
17%
16%
11%
9%
1%
2%
Information on rate/ tariff plans
Network coverage/ connectivity related
Payment related
For activating/ deactivating any Value Added Services
For switching to a new rate/ tariff plan
Billing related
For Premium Messaging issues
Others

68 CRA Consumer Satisfaction Survey 2014
Among those who called in last 6 months, more than 1/4th (27%) claim to be calling the customer care
center more than twice a month (Figure 48). This frequency is observed to be higher for Vodafone (36%)
as against 23% for Ooredoo. Further, it is also seen that the frequency of calling is relatively lower
among Ooredoo consumers with 61% calling less frequently than once a month as compared 40% of
Vodafone customers who call less often than once a month. This might indicate that Vodafone
consumers have relatively higher complaints as compared to Ooredoo.
Figure 48: Frequency of Contacting Customer Care Call Center
Source: Customer Satisfaction Survey; Overall sample n=2526
Question asked specifically to those calling in last 6 months (n=1089)
‘Wait time at customer care center’ is one of the most important parameters for the customers and a
very high dissatisfaction (28%) is observed on the same (Figure 49). The dissatisfaction is high among
both Ooredoo and Vodafone customers (Table 23). There are stringent KPIs in place for customer care,
as mentioned in CRA’s Service Regulatory Framework 2014 (Table 33). Given high dissatisfaction among
both Ooredoo and Vodafone customers (Table 32), there is probably a need to relook into the processes
being followed currently by the service providers in Qatar.
High dissatisfaction (>10%) is observed on other agent related parameters also, such as ‘time taken to
resolve query/ problem’ and ‘knowledge of customer care personnel’. This issue is observed to be more
prominent for Ooredoo customer care center.
53%
18%
27%
2%
1%
Less frequently than once a month
Once a month
Twice a month
3- 5 times a month
More than 5 times a month

69 CRA Consumer Satisfaction Survey 2014
Figure 49: Customer Care- Sub Attribute Experience
Source: Customer Satisfaction Survey; Overall sample n=2526
Question asked specifically to those calling in last 6 months (n=1089)
Parameters are arranged in order of importance to consumers
Note: Numbers may not add up to 100 percent due to rounding
Table 32: Experience with Customer Care Call Center: By Service Provider
Customer Care/ Call Center Overall Ooredoo Vodafone
Waiting time to connect to agent 72 71 76
Politeness & courtesy shown 90 91 88
Time taken to solve query/problem 88 85 93
Knowledge of customer care personnel 89 86 93
Ease of getting connected to the customer care number 91 90 93
Ease of navigating through IVR 91 90 94
Figures above represent proportion (%) of satisfied consumers
Source: Customer Satisfaction Survey; Overall sample n=2526
Question asked specifically to those calling in last 6 months (n=1089)
Parameters are arranged in order of importance to consumers
Table 33: CRA KPI for Service Providers: Standard and Target for Response time by Customer Support Center # Name Fixed/ mobile Description/ Definition Standard Target
R3
Response time by
customer support
center- phone call
Both mobile and fixed
The response time by customer support center is the period of time between the end of dialing and the
instant when the call actually reaches a human that is capable of
discussing the customer’s issue
E1 5.6 75% in <15 s 95% in <30 s
Source: Annex 2 of Service Regulatory Framework by CRA Qatar (2014)
73%
90%
87%
89%
91%
91%
28%
10%
12%
11%
9%
9%
Waiting time to connect to agent
Politeness and courtesy shown by theCustomer Care
Time taken to solve query/problem
Knowledge of customer carepersonnel
Ease of getting connected
Ease of navigating through the IVR
Satisfied Not Satisfied

70 CRA Consumer Satisfaction Survey 2014
Online Modes: Social Media and Mobile Applications
Social Media Social media has become a ubiquitous medium for consumers to interact, engage and connect with
friends and family. Further, social media is constantly being used by businesses to engage with
consumers and also to get consumer feedback. This phenomenon is not a one-way street and
consumers also are continuously engaging and using this as medium to interact with services providers/
brands. Both the telecom service providers are quite active across various Social media platforms and
hence a need was felt to understand the level of telecom consumers’ engagement with Social media.
In this section, Social media and its importance in telecom sector in Qatar will be analyzed from three
key lenses, viz.
Social media usage in Qatar (Source: Secondary Research)
Service providers’ engagement with consumers on Social media (Source: Exploratory Research-
discussions with Service Providers)
Consumer interaction with Social media (Source: Quantitative Research)
Social media usage in Qatar Consumers in Qatar are observed to be heavy users of Internet services. The penetration of 88% is one
of the highest in the world as well as in the Middle East region (Table 34).
Table 34: Internet Penetration
Rank Economy 2012
1 Korea (Rep.) 97.4
2 Qatar 88.1
3 Singapore 87.7
4 Macao, China 81.0
5 Bahrain 79.0
6 Hong Kong, China 78.6
8 Brunei 72.4
9 UAE 72.0
10 Saudi Arabia 66.6
Data Source: The state of Broadband 2013: Broadband Commission, September 2013, ITU
In Qatar, 76% of the Internet users access social media sites regularly and the users spend about 3.2
hours on an average (per day) on social media (Figure 50). This is at par with other countries in the
region.

71 CRA Consumer Satisfaction Survey 2014
Figure 50: Social Media Usage in Qatar
Source: Media Use in Middle East: A report by Northwestern University in Qatar (In association with Harris Interactive)
Survey conducted among 10,000 respondents in 8 countries
Facebook and Twitter are the two most frequently used social media platforms by telecom users in the
State of Qatar (Figure 51). Social media usage in Qatar is observed to be at par with other countries in
the region.
Figure 51: Social Media Usage- By Type of Platform
Source: Media Use in Middle East: A report by Northwestern University in Qatar (In association with Harris Interactive)
Survey conducted among 10,000 respondents in 8 countries

72 CRA Consumer Satisfaction Survey 2014
Service Providers’ Engagement with Consumers on Social Media Telecom service providers in Qatar are actively present across various social media platforms to engage
with their customers (Figure 52).
Figure 52: Service Providers Presence in Social Media
The service providers use various social media platforms for brand building, customer engagement,
customer queries and sharing company news etc. Expectedly, Facebook and Twitter are used more
frequently than other platforms (Figures 53 and 54).

73 CRA Consumer Satisfaction Survey 2014
Figure 53: Reasons For Usage of Social Media: Ooredoo
Figure 54: Reasons For Usage of Social Media: Vodafone Qatar
Further, a significant increase in followers/ subscribers for both Ooredoo and Vodafone is observed over
the last 18 months (Figure 55), which is a good indicator of enhanced engagement among consumers
and service providers.

74 CRA Consumer Satisfaction Survey 2014
Figure 55: Service Providers’ Engagement with Social Media
Numbers in table on left are as on Dec 10, 2014. Source: Individual Social Media sites of Service Providers (Local country pages)
Numbers in table on right are as on April 10, 2013. Source: https://nateeja.wordpress.com/digital-marketing-planning/
Consumer Interaction with Social Media
Telecom users in Qatar are heavy users of social media platforms particularly Facebook, YouTube,
QatarLiving with Facebook being used more often at 76% (Table 35).
However, as of now, consumers don’t communicate actively with their service providers via social media
and this shows the potential to enhance active engagement between consumers and service providers.
Given usage statistics, Facebook, Twitter & YouTube present the best opportunities for service providers
to enhance their social media interaction with the users.
Table 35: Social Media Usage Trend
Social Media Platforms Using Social Media Follow/ Read Service Provider Communicated with Service
Provider
Facebook 76% 24% 12%
Twitter 24% 10% 6%
YouTube 62% 17% 10%
Instagram 17% 5% 3%
ILoveQatar 3% 1% 1%
Qatar Digital 2% 1% 1%
Qatar Living 18% 5% 3%
Ooredoo community 3% 1% 1%
Designyourqatar 2% 1% 1%
Source: Customer Satisfaction Survey; Overall sample n=2526
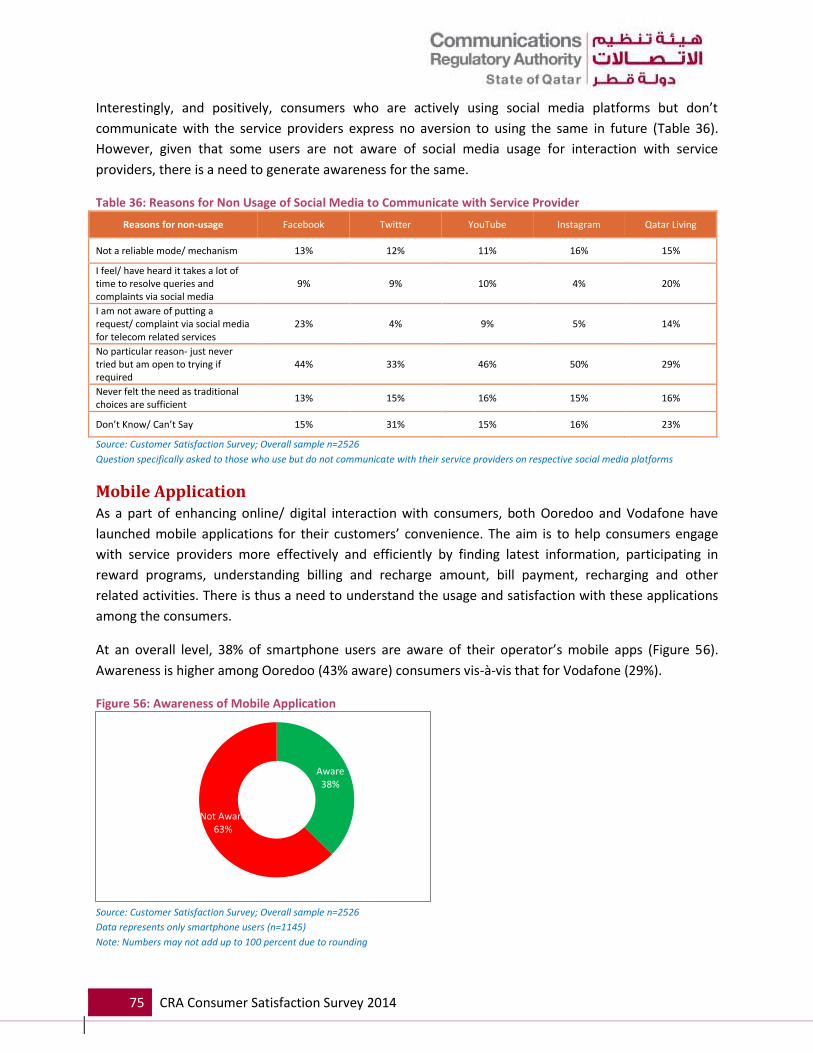
75 CRA Consumer Satisfaction Survey 2014
Interestingly, and positively, consumers who are actively using social media platforms but don’t
communicate with the service providers express no aversion to using the same in future (Table 36).
However, given that some users are not aware of social media usage for interaction with service
providers, there is a need to generate awareness for the same.
Table 36: Reasons for Non Usage of Social Media to Communicate with Service Provider
Reasons for non-usage Facebook Twitter YouTube Instagram Qatar Living
Not a reliable mode/ mechanism 13% 12% 11% 16% 15%
I feel/ have heard it takes a lot of time to resolve queries and complaints via social media
9% 9% 10% 4% 20%
I am not aware of putting a request/ complaint via social media for telecom related services
23% 4% 9% 5% 14%
No particular reason- just never tried but am open to trying if required
44% 33% 46% 50% 29%
Never felt the need as traditional choices are sufficient
13% 15% 16% 15% 16%
Don’t Know/ Can’t Say 15% 31% 15% 16% 23%
Source: Customer Satisfaction Survey; Overall sample n=2526
Question specifically asked to those who use but do not communicate with their service providers on respective social media platforms
Mobile Application As a part of enhancing online/ digital interaction with consumers, both Ooredoo and Vodafone have
launched mobile applications for their customers’ convenience. The aim is to help consumers engage
with service providers more effectively and efficiently by finding latest information, participating in
reward programs, understanding billing and recharge amount, bill payment, recharging and other
related activities. There is thus a need to understand the usage and satisfaction with these applications
among the consumers.
At an overall level, 38% of smartphone users are aware of their operator’s mobile apps (Figure 56).
Awareness is higher among Ooredoo (43% aware) consumers vis-à-vis that for Vodafone (29%).
Figure 56: Awareness of Mobile Application
Source: Customer Satisfaction Survey; Overall sample n=2526
Data represents only smartphone users (n=1145)
Note: Numbers may not add up to 100 percent due to rounding
Aware 38%
Not Aware 63%

76 CRA Consumer Satisfaction Survey 2014
Among those who are aware of the application, only 16% (i.e. 6% of total customers surveyed) of the
consumers have installed the mobile application on their smartphones/ tablets (Figure 57). Clearly,
there is significant headroom to build trial and regular usage of application among smartphone users.
The usage of mobile application for both Ooredoo (15%) and Vodafone (18%) is very similar and
indicates the need to induce usage among both operators.
Figure 57: Usage of Mobile Application
Source: Customer Satisfaction Survey; only those aware of mobile application of Overall sample n=2526
Question specifically asked to those who are aware of mobile application of their respective service providers (n=1145)
Note: Numbers may not add up to 100 percent due to rounding
The primary purpose for usage of mobile application is bill payment (42%) followed by procuring
information (38%) and recharge (25%). Some consumers also use it for service activation/ deactivation
and using it as a directory (Figure 58).
Thus, there is a clear need to enhance awareness of the mode and encourage more consumers to use it
for bill payment, complaint lodging, etc. It will help in reducing workload at customer care center and at
company outlets.
Figure 58: Purpose for Usage of Mobile Application
Yes 16%
No 84%
42%
38%
25%
16%
9%
5%
5%
1%
Bill Payment
Information seeking
Recharge
Activation/ Deactivation of Service
Directory Services/ Looking up important numbers
Loyalty program
Raising a complaint
Others

77 CRA Consumer Satisfaction Survey 2014
Source: Customer Satisfaction Survey; Overall sample n=2526
Question specifically asked to those who use mobile application of their respective service providers (n=194)
Majority of mobile application users are satisfied with the service; which augurs well for the service
providers (Figure 59). The experience is strong and quite similar among both Ooredoo and Vodafone
users. Highly satisfactory consumer experience indicates that there is a huge potential for ‘Mobile
Application’ as a viable alternative mode for engaging effectively and efficiently with consumers.
However, low awareness and low usage of the same is limiting its potential. The need thus is to induce
trials and get consumers stick to this mode.
Figure 59: Experience with Mobile Application
Source: Customer Satisfaction Survey; Overall sample n=2526
Question specifically asked to those who have used mobile application of their respective service providers (n=194)
Note: Numbers may not add up to 100 percent due to rounding
Experience by Type of Connection There are some consumer experiences which are specific to the type of connection owned by them.
While recharge/ top-up process is relevant to the prepaid consumers; billing and payment experiences
are important for postpaid consumers.
Prepaid Consumers: Recharge/ Top- up Process More than 90% satisfaction is observed on various key parameters related to recharge/ top-up process,
such as availability, accuracy, adequacy of options and ease of recharge (Figure 60). However, high
dissatisfaction (13%) is observed on ‘range of denominations available’. This issue is observed for both
Ooredoo and Vodafone (Table 37). Further, there is a need to look at range for males and non-Qataris
(Table 38).
97%
99%
93%
3%
1%
7%
Experience with MobileApplication
Experience with MobileApplication- Ooredoo
Experience with MobileApplication- Vodafone
Satisfied Not Satisfied

78 CRA Consumer Satisfaction Survey 2014
Figure 60: Recharge/ Top- Up Process- Sub Attribute Performance
Source: Customer Satisfaction Survey; Overall sample n=2526
Parameters are arranged in order of importance to consumers
Note: Numbers may not add up to 100 percent due to rounding
Table 37: Experience with Recharge/ Top-Up Process: By Service Provider
Recharge/ Top-Up Process Overall Ooredoo Vodafone
Availability of recharge/top- up services 95 95 95
Accuracy of recharging/ top-up 97 96 99
Range of denominations/ values available 88 87 87
Adequacy of options available 99 98 99
Ease of the recharge/Top-up process 95 96 95
Figures above represent proportion (%) of satisfied consumers
Source: Customer Satisfaction Survey; Overall sample n=2526
Parameters are arranged in order of importance to consumers
Table 38: Experience Recharge/ Top-Up Process: By Age, Gender and Nationality
Recharge/ Top-Up Process Overall
Age Gender Nationality
15-24 years
25-44 years
45 and beyond
Male Female Qatari Non
Qatari
Availability of recharge/top- up services
95 94 94 98 95 97 97 95
Accuracy of recharging/ top-up 97 97 96 98 97 99 97 96
Range of denominations/ values available
88 95 86 91 86 97 96 87
Adequacy of options available 99 96 99 98 98 98 97 99
Ease of the recharge/Top-up process
95 92 95 97 95 98 96 94
Figures above represent proportion (%) of satisfied consumers
Source: Customer Satisfaction Survey; Overall sample n=2526
Parameters are arranged in order of importance to consumers
95%
97%
88%
99%
95%
5%
3%
13%
1%
5%
Availability of recharge/top- upservices at all places
Accuracy of recharging/ top-up
Range of denominations/ valuesavailable
Adequacy of options available forrecharging
Ease of recharge
Satisfied Not Satisfied

79 CRA Consumer Satisfaction Survey 2014
Consumers are also vocal about issues related to recharge.
“I once had issue about blackberry that the complete recharge was consumed immediately. Till
this day, I did not get the credit back” (25-35 year old Arab Female)
Postpaid Consumers: Billing and Payment Experiences
Billing Experience Universal satisfaction (Around 100%) is observed on billing related aspects (Figure 61). Further, the
experience is satisfactory among both Ooredoo and Vodafone customers (Table 39).
Figure 61: Billing Experience- Sub Attributes Performance
Source: Customer Satisfaction Survey; Overall sample n=2526
Parameters are arranged in order of importance to consumers
Note: Numbers may not add up to 100 percent due to rounding
Table 39: Experience With Billing: By Service Provider
Billing Experience Overall Ooredoo Vodafone
Regularity of receiving bills i.e. every month 99 99 99
Ease of understanding the bill statement 99 100 100
Accuracy of the bill amount 97 96 99
Figures above represent proportion (%) of satisfied consumers
Source: Customer Satisfaction Survey; Postpaid Bill of sample n=2526
Parameters are arranged in order of importance to consumers
While majority of customers prefer green billing (68% prefer over e-mail or website), there is still
headroom to achieve 100% green billing (Figure 62). Service providers need to look at incentivizing the
customers to use e-mail/ website based bill. The consumers who prefer bill by post belong mainly to
transient population (primarily 25-44 years old). The preference for email bill is higher among Ooredoo
consumers (60%) as compared to Vodafone users (51%). This could be result of the efforts taken by
Ooredoo to convert to 100% e- bill.
99%
99%
97%
1%
1%
3%
Regularity of receiving bills i.e. everymonth
Ease of understanding the billstatement
Accuracy of the bill amount
Satisfied Not Satisfied
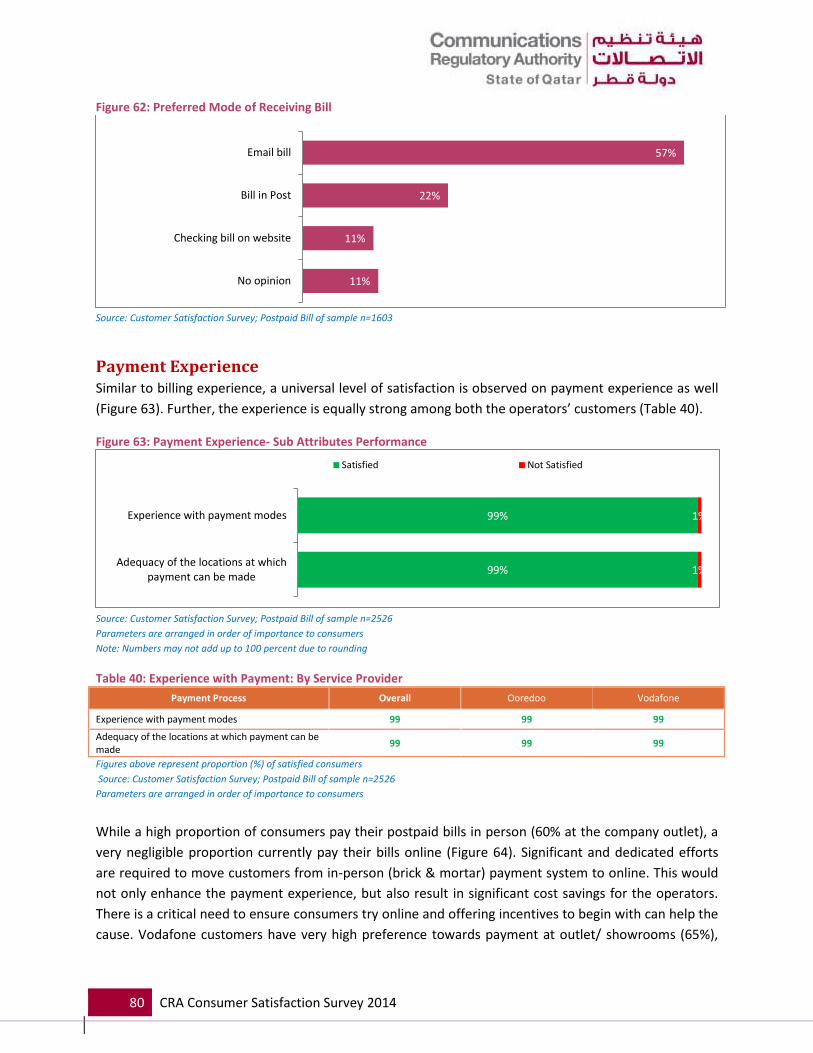
80 CRA Consumer Satisfaction Survey 2014
Figure 62: Preferred Mode of Receiving Bill
Source: Customer Satisfaction Survey; Postpaid Bill of sample n=1603
Payment Experience Similar to billing experience, a universal level of satisfaction is observed on payment experience as well
(Figure 63). Further, the experience is equally strong among both the operators’ customers (Table 40).
Figure 63: Payment Experience- Sub Attributes Performance
Source: Customer Satisfaction Survey; Postpaid Bill of sample n=2526
Parameters are arranged in order of importance to consumers
Note: Numbers may not add up to 100 percent due to rounding
Table 40: Experience with Payment: By Service Provider
Payment Process Overall Ooredoo Vodafone
Experience with payment modes 99 99 99
Adequacy of the locations at which payment can be made
99 99 99
Figures above represent proportion (%) of satisfied consumers
Source: Customer Satisfaction Survey; Postpaid Bill of sample n=2526
Parameters are arranged in order of importance to consumers
While a high proportion of consumers pay their postpaid bills in person (60% at the company outlet), a
very negligible proportion currently pay their bills online (Figure 64). Significant and dedicated efforts
are required to move customers from in-person (brick & mortar) payment system to online. This would
not only enhance the payment experience, but also result in significant cost savings for the operators.
There is a critical need to ensure consumers try online and offering incentives to begin with can help the
cause. Vodafone customers have very high preference towards payment at outlet/ showrooms (65%),
57%
22%
11%
11%
Email bill
Bill in Post
Checking bill on website
No opinion
99%
99%
1%
1%
Experience with payment modes
Adequacy of the locations at whichpayment can be made
Satisfied Not Satisfied

81 CRA Consumer Satisfaction Survey 2014
while Self Service Machine (39%) is the most highly preferred mode of payment for Ooredoo. The
widespread availability of Self Service machines of Ooredoo could be the reason for this higher
preference for Self Service Machines.
Figure 64: Frequently Used Mode of Bill Payment
Source: Customer Satisfaction Survey; Postpaid Bill of sample n=1603
45%
30%
10%
4%
3%
8%
Payment at showroom/outlet using cash
Self Service Machine
Payment at showroom/outlet using credit card
Payment at showroom/outlet using cheque
Online Payment (website or bank transfer)
No opinion

82 CRA Consumer Satisfaction Survey 2014
Service Providers: Snapshot of Performance and Key Areas to
Monitor A snapshot of performance of Ooredoo and Vodafone across different experiences is provided in table
41 and 42 below. Basis the norms devised earlier, the following color coding has been used for
comparative performance of the two service providers:
Services with 95% or more consumers satisfied : Excellent
Services with 91 - 95% consumers satisfied : Acceptable (Maintain status quo) Services with 85 – 90% consumers satisfied : Need minor intervention by the Regulator Services with <85% consumers satisfied : Need significant intervention by Regulator
Table 41: Ooredoo and Vodafone Performance Snapshot (1)
Parameter Ooredoo Vodafone Parameter Ooredoo Vodafone
Quality of Service 90 85 Pricing 86 92
Local call charges 80 81
Network Value Add Services 79 83
Availability of network all times 94 90 International Call Charges 70 68
Spread/ coverage 98 96 Cost of Data Charges (Roaming) 72 67
Quality of network coverage 95 98 Cost of Call Charges (Roaming) 76 79
Voice quality & clarity 95 96 Initial Cost of Purchase of SIM 88 88
Lack of call drops 94 91 Installation Cost 92 92
SMS delivery 97 95 Monthly Rental Charges 87 78
Quality of data services 90 95 Initial Cost of Purchase of Data SIM 91 91
Data network coverage 93 95 Cost of Data Charges 80 82
Speed of data services 92 94 Cost of Data Device 91 80
Video access/streaming quality 90 93
Rate Plan/ Tariff and Promotions
Provisioning Clear Terms and Conditions 91 90
Ease of activation 90 85 Clarity of rate plans 91 93
Sales agent interacted with 97 97 Variety of rate plans 83 80
Ease of purchasing the connection 98 99 Competitiveness of Tariffs 89 91
Initial supply time 97 98 Tariffs of the different services and offers proposed
95 97
Minimum Service period for the product
98 97 Publishing of tariff 90 92
Usefulness of benefits of promotions 90 90
Attractiveness of Promotion schemes 87 85
Reduced spamming and unwanted promotions
89 92
Options to opt out of promotional messages
89 90
Figures above represent proportion (%) of satisfied consumers
Source: Customer Satisfaction Survey; Overall sample n=2526

83 CRA Consumer Satisfaction Survey 2014
Table 42: Ooredoo and Vodafone Performance Snapshot (2)
Parameter Ooredoo Vodafone Parameter Ooredoo Vodafone
Company Showroom/ Outlet Recharge/ Top-up Process
Politeness and courtesy shown by the executives at company outlet
92 93 Availability of recharge/top- up services 95 95
Ability to resolve query / problem 95 94 Accuracy of recharging/ top-up 96 99
Time taken to resolve query / problem at company outlet
98 96 Range of denominations/ values available
87 87
Time taken to assist you 95 97 Adequacy of options available 98 99
Knowledge of showroom personnel at company outlet
98 99 Ease of the recharge/Top-up process 96 95
Customer Care Call Center Billing Process
Waiting time to connect to agent 71 76 Regularity of receiving bills 99 99
Politeness & courtesy shown 91 88 Ease of understanding the bill 100 100
Time taken to solve query/problem 85 93 Accuracy of the bill amount 99 99
Knowledge of cc personnel 86 93 Advertising & Communication
Ease of getting connected 90 93 Clarity 96 95
Ease of navigating through IVR 90 94 Effectiveness 91 89
Payment Process Relevance 97 98
Experience with payment modes 99 99 Frequency 97 97
Adequacy of the locations at which payment can be made
99 98
Figures above represent proportion (%) of satisfied consumers
Source: Customer Satisfaction Survey; Overall sample n=2526
Basis the performance of the two service providers, the key concerns to be monitored over time for
Ooredoo and Vodafone Qatar are as follows (Table 43):
Table 43: Key Concerns Areas to be monitored for Ooredoo and Vodafone Qatar
Primary Focus Areas Ooredoo Primary Focus Areas Vodafone
International Call Charges 70 Cost of Data Charges (Roaming) 67
Waiting time to connect to call center agent 71 International Call Charges 68
Cost of Data Charges (Roaming) 72 Waiting time to connect to call center agent 76
Cost of Call Charges (Roaming) 76 Monthly Rental Charges 78
Cost of Value Add Services 79 Cost of Call Charges (Roaming) 79
Local call charges 80 Cost of Data Device 80
Cost of Data Charges 80 Variety of rate plans 80
Variety of rate plans 83 Local call charges 81
Cost of Data Charges 82
Cost of Value Add Services 83
Secondary Focus Areas Ooredoo Secondary Focus Areas Vodafone
Time taken to solve query/problem at call center 85 Attractiveness of Promotion schemes 85
Knowledge of customer care agent 86 Ease of activation 85
Monthly Rental Charges 87 Range of recharge denominations/ values 87
Attractiveness of Promotion schemes 87 Politeness & courtesy shown by call center agent 88
Range of recharge denominations/ values 87 Initial Cost of Purchase of SIM 88
Figures above represent proportion (%) of satisfied consumers
Source: Customer Satisfaction Survey; Overall sample n=2526

84 CRA Consumer Satisfaction Survey 2014
Overall Leveragable Strengths & Key Focus Areas It is also important to understand the key strengths and improvements areas for Qatar’s telecom market
at an overall level. The tables below illustrate the overall strengths (Table 44) and key focus areas for
improvement (Table 45). Key focus areas by other metrics such as service type, connection type,
municipalities and consumer demographics are provided in table 46.
Table 44: Key Leveragable Strengths
OVERALL EXPERIENCE AREA CUSTOMER TOUCH-POINT
NETWORK
Spread/ coverage of network Quality of network coverage Voice Quality & Clarity SMS Delivery
PROVISIONING
Sales agent interaction
Ease of purchasing
Initial Supply time
Minimum Service Period
RATE PLAN/ TARIFF & PROMOTIONS Tariffs of different serviced and offers proposed
MOBILE APPLICATION Strong experience among App users
COMPANY OUTLET
Politeness and Courtesy Ability to resolve query Knowledge of outlet personnel Time taken to assist
RECHARGE Availability of recharge options Accuracy of Recharge Adequacy of options available for recharge
BILLING Regularity of receiving bills Accuracy of bill Ease of understanding bill
PAYMENT Experience with payment modes Adequacy of payment locations

85 CRA Consumer Satisfaction Survey 2014
Table 45: Key Improvement Areas
OVERALL EXPERIENCE AREA CUSTOMER TOUCH-POINT
PRICING
International Call charges Data charges on roaming Call charges on roaming Value added services Cost of data charges Local call charges
RATE PLAN/TARIFF & PROMOTIONS
Clarity of Rate plans Attractiveness of promotions Competitiveness of Tariff Reduced spamming Options to opt out of promotions
COMPLAINT RESOLUTION Speed of Resolution Turnaround time (time for resolving)
CUSTOMER CARE Waiting Time to be connected Knowledge of customer care personnel Time taken to solve query/ problem
RECHARGE/ TOP-UP PROCESS Range of denominations

86 CRA Consumer Satisfaction Survey 2014
Table 46: Key Focus Areas: By Other Metrics
KEY METRICS FOCUS AREAS
MUNICIPALITY
Overall QoS perception weaker for Al Daayen; relatively lower in Al Wakra and Doha Quality of data services in Al Daayen and Al Shamal Network availability in Al Daayen Quality of Network coverage in Al Daayen
TYPE OF SERVICE
INTERNET (COPPER) Improvements desired across most of customer touch-points (a quick & smooth
transition to fibre broadband can help the cause) MOBILE VOICE Pricing: Local call charges, International call charges and Call charges on Roaming Rate plans: Variety of rate plans and better promotions Customer Care: Waiting time to connect to agents MOBILE VOICE AND DATA Pricing: Local call charges, International call charges, Data charges, Monthly rental,
Cost of data charges on Roaming and Call charges on Roaming Rate plans: Variety of rate plans Customer Care: Waiting time to connect to agents Data SIM Pricing: Cost of data charges on Roaming Data services: Speed of data and Video access/ streaming Mobile broadband Pricing: Cost of data charges on Roaming Provisioning: Ease of activation/ provisioning Rate plans: Variety of rate plans and Promotions FIBRE (BROADBAND) Complaint Resolution: Overall complaint process time taken to resolve Provisioning: Ease of Activation/ provisioning Overall experience at Customer Care Call Center
TYPE OF CONNECTION
PREPAID Pricing: All aspects of pricing Rate plans: Variety of rate plans Provisioning: Ease of activation/ provisioning Complaint Resolution: Time taken to resolve Customer Care: Waiting time for connecting POSTPAID Pricing: All aspects of pricing Data services: Quality of data service, coverage & speed All aspects of Customer Care call center
DEMOGRAPHICS
FEMALES Enhance their experience with Complaint resolution and Customer care call center QATARIS Better address their complaint resolution and customer care call center process.
Also, better understanding of their pricing requirements NON-QATARIS Pricing related issues and Variety of Rate plan requirements 25-44 YEAR OLDS

87 CRA Consumer Satisfaction Survey 2014
Understand their pricing and rate plan requirements
Key Considerations for CRA Keeping in mind the key mandates of CRA and consumer feedback, the key take-outs for CRA are
outlined below (Tables 47-51):
Table 47: Take-outs for CRA: CRA Awareness and Mandate
Observations What CRA can do/ facilitate
CRA AWARENESS Presently, only around 1/5
th (19%) of the telecom
consumers are aware of CRA.
Concentrated campaigns focused on CRA’s mandate
Promotion of of new technological adoptions and initiatives such as Green Bills
CRA’s contacts on all bills as regulator where unresolved issues can be escalated to
TARIFFS PUBLISHING Consumers are currently not aware about tariff publishing; but when prodded, need it on CRA website or via SMS/ monthly bill.
Tariffs should be duly published on a suitable platform
Consumers should be communicated about the same, thus managing their expectations
Table 48: Take-outs for CRA: Quality of Services
Observations What CRA can do/ facilitate MOBILE NUMBER PORTABILITY Less awareness (32%) and usage of MNP (Mobile number Portability) service (9% of those aware) is coupled with weak experience (only around 42% are satisfied).
Need to ensure that service providers actively promote this service
Service providers need to have clear norms in place to ensure timely porting and strong customer experience
BILLING AND PAYMENT MODES
More than 20% of consumers interviewed still prefer receiving bills by post
Majority of customers (around 50%) prefer to pay the bill in person
Communicate the benefits of online payment and allay any related security fears
Communicate the benefits of green billing and target at universal green billing within a specified time period
Table 49: Take-outs for CRA: Market Competitiveness
Observations What CRA can do/ facilitate PRICING Pricing is an important issue among consumers and a considerable proportion of consumers believe that pricing related aspects including international and local call charges as well as roaming charges are high.
Conduct a comparative study of pricing across other countries to understand the pricing policy in Qatar vis-à-vis other countries
Take necessary steps to ensure positive customer opinions
MARKET COMPETITIVENESS Only about 1/3rd of consumers feel that the Qatar telecom sector is competitive (either in terms of services provided or prices charged). The key suggestion from customers is to introduce a new player in the market.
Look at the feasibility of introducing another operator (either a full service provider or MVNO) in the market

88 CRA Consumer Satisfaction Survey 2014
Table 50: Take-outs for CRA: Complaint Resolution
Observations What CRA can do/ facilitate COMPLAINT RESOLUTION Only 37% of customers claim that their complaints were resolved within 5 days of registering the same. As a result, there is a huge dissatisfaction (25%) on the speed of complaint resolution.
Complaints not resolved within 30 days to be automatically escalated to CRA
Service providers to file a summary report of complaints registered and resolved to CRA on a monthly basis
SOCIAL MEDIA Service providers are using Social Media to connect with their consumers. Further, the operators are very positive about its future usage and are willing to invest in the same.
Establish clear SLAs and ensure that service providers duly comply with the same for dealing with complaints generated via Social Media
Continuous monitoring of Social Media
Table 51: Take-outs for CRA: Consumer Rights Protection
Observations What CRA can do/ facilitate OPT OUT OF PROMOTIONAL MESSAGES 11% of the consumers are dissatisfied with options provided by service providers to opt out of promotional messages
CRA needs to strictly ensure that Service Providers adhere to the guidelines
Devise a robust complaint mechanism towards addressing this
MIGRATION FROM COPPER TO FIBRE Ratings by internet (copper) service users are weaker vis-à-vis other service users. Majority of those who have switched from copper to fibre are quite satisfied with switching experience as well as quality of broadband.
Establish clear timelines for fibre broadband rollout plan that existing or new Service Providers need to comply with
Proactive communication (about roll-out timeline) to allay any adverse consumer reactions

89 CRA Consumer Satisfaction Survey 2014
Appendix I: Research Details
Research Methodology
Exploratory Phase: This phase was aimed at understanding the different products and services provided
by service providers in the State of Qatar. It was executed using face-to-face in-depth (semi structured)
interviewing methodology with various stakeholders (Across various departments in CRA as well as both
Service Providers). Exploratory phase helped to generate content (focus areas), which was then
appropriately used to develop questionnaire for quantitative phase.
Secondary Research: This phase aims at gathering information from various sources in public domain,
such as
QoS parameters
Identification of the key touch points of interaction
Demographic information
Services subscriber information
CRA legal and policy frameworks
Data pertaining to other countries for QoS for benchmarking purposes
The key sources used in Secondary Research are provided in Appendix ABC
Qualitative Phase: This phase aims at understanding qualitatively the objectives of the study including
Important communication services used
Consumer perception of QoS across various touch-points
Levels of satisfaction with overall service, prices, competitive nature of market etc.
Role and involvement of the CRA in matters related to telecom
Quantitative Phase: This phase aims at quantifying consumer views and opinions with regards to various
products and services offered in the State of Qatar. The key objectives of this phase included:
Assessing the extent of importance of some products/ services offered to consumers
Consumers’ level of awareness of CRA and suggestions for CRA
Ascertain the degree and extent of loyalty of customers towards service providers
Quantifying the performance of service providers across various products and services provided
(such as provisioning, network, tariffs, customer care, recharging, billing & payment, among
others)
Understanding the key strength areas and focus areas (areas of improvement) for telecom sector
(Specific to service providers, and by demographics, geographies etc.)
Customers’ usage of Social Media to engage with telecom service providers
Customers’ opinions about level of market competitiveness (in terms of services & prices)

90 CRA Consumer Satisfaction Survey 2014
Social Media Research: Apart from understanding consumer usage of Social Media (specifically Telecom
services), a separate Social Media research module was undertaken to holistically understand the usage
of Social Media in Qatar by Service Providers to engage with telecom users. While on one hand,
secondary sources were utilized to understand the prevalence of Social Media in Qatar, face-to-face
meetings were also held between AMRB and the two Service Providers (Ooredoo and Vodafone) to
understand their efforts in engaging with consumers through various Social Media platforms.
Some of the key objectives of this module are:
Understand the penetration of Social Media in Qatar
Incidence and extent of usage of Social Media platforms by Service Providers
Addressing customer queries/ complaints generated via Social Media (volumes & KPIs)
Understanding future plans of Service Providers wrt consumer engagement via Social Media
Figure 65: Walker Framework- As Customized For Telecom Services in Qatar

91 CRA Consumer Satisfaction Survey 2014
Exploratory Phase Discussion Details Figure 66: Exploratory Phase- Internal Stakeholders Discussion Details
Apart from the internal stakeholders, discussions also happened with the two service providers as well
as QNBN, as illustrated in the figure below:
•Purpose: Understanding the National Broadband Plan and the KPI’s that can be included in the Customer Satisfaction Survey
Team: National Broadband Plan
•Purpose: Understand the policy implication on the survey and the inputs from the Retail Tariff team that need to be measured in Customer Satisfaction Survey
Team: CRA Policy team and Retail Tariff
•Purpose: Understanding the complaint addressing mechanism process at CRA ; understanding the complaint tracking of Vodafone Qatar and Ooredoo; highlighting the main complaints received
Team: Customer Complaints CRA
•Purpose: Understanding the QoS Network measurement being conducted by CRA and the potential inclusion points in Customer Satisfaction survey
Team: QoS Monitoring
•Purpose: Understanding the Mobile Number Portability prevalence in Qatar and the issues that were encountered in the launch; identifying the points to be measured in Customer Satisfaction Survey
Team: MNP Team
•Purpose: Clarification of the scope of the study and the potential Retail tariff parameters that can be included
Team: Retail Tariff Team
• Purpose: Understanding the scope of Social Media communication happening on behalf of CRA and also identifying the potential social media tracking objectives
Team: Communication Team of CRA

92 CRA Consumer Satisfaction Survey 2014
Figure 67: Exploratory Phase- External Stakeholder’s Discussion Details
Qualitative Research Details The following mini groups were conducted as part of the qualitative phase
Table 52: Qualitative Study Details (1)
Group 1 Group 2 Group 3 Group 4 Group 5
Location Doha Doha/ Industrial Area Doha Al Rayyan Al Rayyan
Gender Male Male Female Male Female
Nationality Local Qatari Expat Asians Expat Asians Expat Arabs Expat Arabs
Age 18 to 25 25+ to 35 25+ to 35 35+ to 45 25+ to 35
Product/ Service Usage
Mobile (Voice + Data +
Broadband)
Mobile (Voice + Broadband)
Fixed (Voice + Broadband)
Fixed (Voice + Broadband)
Mobile (Voice + Data)
Service Provider Ooredoo Ooredoo+ Vodafone Ooredoo+ Vodafone (at-least 1 Vodafone
user)
Ooredoo+ Vodafone (at-least 1 Vodafone
user)
Ooredoo + Vodafone
Type of Connection Prepaid+ Postpaid
Prepaid
Copper + Fibre (at least 1 user shifted
from Copper to Fiber)
Copper + Fibre (at least 1 user shifted
from Copper to Fiber)
Prepaid + Postpaid
•Purpose: Understanding the product & service offerings of Ooredoo as well as understanding the operations and customer Care facilities available
Team: Ooredoo Team
•Purpose: Understanding the product and service offerings of QNBN in the Qatar market. The scope of operation of QNBN was discussed and also the potential areas of interaction with customers Walker Information Repository
Team: QNBN (Qatar National Broadband Network)
•Purpose: Understanding the product and service offerings of Vodafone in the Qatar market. The scope of operation of Vodafone was discussed and also the potential areas of interaction with customers
Team: Vodafone Qatar

93 CRA Consumer Satisfaction Survey 2014
Table 53: Qualitative Study Details (2)
Group 6 Group 7 Group 8 Group 9
Location Al Wakra Al Wakra Al Khor and Al
Thakhira Al Khor and Al
Thakhira
Gender Male Male Female Male
Nationality Expat Westerners Local Qatari Local Qatari Expat Asians
Age 25+ to 35 35 + 35+ to 45 35+ to 45
Product/ Service Usage Mobile (Voice + Data) Fixed (Voice + Broadband) Mobile (Voice + Data) Mobile (Voice + Data
+ Broadband)
Service Provider Ooredoo + Vodafone Ooredoo+ Vodafone (at-least 1 Vodafone user)
Ooredoo + Vodafone Vodafone
Type of Connection Prepaid+ Postpaid Copper + Fibre (at least 1
user shifted from Copper to Fiber)
Prepaid + Postpaid Prepaid + Postpaid
Appendix II: Detailed Sample Distribution Table 54: Sample Distribution by Municipality Municipality Sample Size
Al Daayen 7%
Al Khor and Al Thakhira 11%
Al Rayyan 12%
Al Shamal 7%
Al Wakra 11%
Doha 41%
Umm Salal 10%
Base: 2526 respondents
Table 55: Sample Distribution by Age Age Group Sample Size
15-24 years 14%
25-34 years 38%
35-44 years 30%
45-54 years 15%
Above 55 years 4%
Base: 2526 respondents
Table 56: Sample Distribution by Gender Age Group Sample Size
Male 78%
Female 22%
Base: 2526 respondents
Table 57: Sample Distribution by Nationality Nationality Sample Size
Qatari 9%
Non Qatari 91%
Base: 2526 respondents

94 CRA Consumer Satisfaction Survey 2014
Table 58: Sample Distribution by Income Income Group Sample Size
Above 40,000 QAR 2%
QAR 25,001 – QAR 40,000 4%
QAR 18,001 – QAR 25,000 5%
12,001 – 18,000 QAR 7%
6,001 – 12,000 QAR 15%
4,001 – 6,000 QAR 18%
2,001 – 4,000 QAR 19%
Below 2,000 QAR 12%
Refused 17%
Base: 2526 respondents
Table 59: Sample Distribution by Profession Profession Sample Size
Legislators, Senior Officials and Managers 6%
Professionals 17%
Technicians And Associate Professionals 9%
Clerks- typists clerks, book-keepers, accountants etc. 19%
Service Workers And Shop and Market Sales Workers 10%
Skilled Agricultural and Fishery Workers 1%
Craft and Related Trades Workers 8%
Plant and Machine Operators and Assemblers 5%
Elementary Occupations- Watchmen, night guards etc. 15%
Student 5%
Housewife 6%
Base: 2526 respondents
Table60: Sample Distribution by Service and Operator Profession Qatar- Overall Ooredoo Vodafone
Fixed
Fixed Voice 6% 8% -
Internet (Copper) 5% 7% -
Fibre Broadband 16% 20% 6%
Mobile
Mobile Voice 23% 21% 26%
Mobile Voice+ Data 34% 30% 46%
Data Specific SIM 8% 6% 11%
Mobile Broadband 8% 7% 10%
Base 4171 3009 1162
* The percentages are calculated on response basis as some respondents answered for multiple services

95 CRA Consumer Satisfaction Survey 2014
Appendix III: Weighting Factors RIM weighting was conducted with following as universe proportions for weighting purposes.
Table 60: Weighting Factors
Universe Population type % in Population
Transient 54.03%
Mainstream 45.97%
Total 100.00%
Transient Population
Location Transient
% in Population
Al Daayen 2.92%
Al Khor and Al Thakhira 18.46%
Al Rayyan 17.91%
Al Shamal 0.38%
Al Wakra 9.76%
Doha 48.74%
Umm Salal 1.84%
Total 100.00%
Mainstream Population
Location Mainstream
% in Population
Al Daayen 2.54%
Al Khor and Al Thakhira 11.41%
Al Rayyan 26.81%
Al Shamal 0.47%
Al Wakra 8.31%
Doha 46.89%
Umm Salal 3.56%
Total 100.00%
Operator and Service
Ooredoo % in Population
Mobile Voice 30.16%
Mobile Voice + Mobile Data 19.37%
Data Specific SIM 2.02%
Mobile Broadband (Dongle) /Mi-Fi 2.02%
Fixed Landline 9.17%
Internet Broadband (copper ADSL) 2.08%
Fibre Broadband 3.39%
Vodafone
Mobile Voice 15.48%
Mobile Voice + Mobile Data 15.46%
Data Specific SIM 0.35%
Mobile Broadband (Dongle) /Mi-Fi 0.35%
Fixed Landline
Internet Broadband (copper ADSL)
Fibre Broadband 0.14%
Total 100.00%
Nationality (Y10: NATIONALITY)
% in Population
Qatari 10.04%
Non Qatari (Expat Arab, Expat Asian, Expat Westerner, Expat African) 89.96%
Total 100.00%

96 CRA Consumer Satisfaction Survey 2014
Appendix IV: Network Experience by Various Segments
Network: Availability and Spread- Perception on Various Parameters Table 61: Experience With Network Availability And Spread: By Service Provider
Network Availability And Spread Overall Ooredoo Vodafone
Availability of network all the time 93 94 90
Spread/ coverage 97 98 96
Quality of network coverage 96 95 98
Figures above represent proportion (%) of satisfied consumers
Source: Customer Satisfaction Survey; Overall sample n=2526
Parameters are arranged in order of importance to consumers
Network: Voice and SMS- Perception on Various Parameters Table 62: Experience With Voice and SMS Services: Type of Service
Network- Voice and SMS Overall Fixed Line Mobile
Voice Mobile Voice
Mobile Voice+ Mobile Data
Voice quality & clarity 96 95 97 96
Lack of call drops 94 94 95 89
SMS delivery 96 NA 94 100
Figures above represent proportion (%) of satisfied consumers
Source: Customer Satisfaction Survey; Overall sample n=2526
Parameters are arranged in order of importance to consumers Table 63: Experience with Voice and SMS Services: By Type of Connection
Network- Voice and SMS Overall Prepaid Postpaid
Voice quality & clarity 96 95 96
Lack of call drops 94 91 96
SMS delivery 96 95 99
Figures above represent proportion (%) of satisfied consumers
Source: Customer Satisfaction Survey; Overall sample n=2526
Parameters are arranged in order of importance to consumers Table 64: Experience with Voice and SMS Services: By Service Provider
Network- Voice and SMS Overall Ooredoo Vodafone
Voice quality & clarity 96 95 96
Lack of call drops 94 94 91
SMS delivery 96 97 95
Figures above represent proportion (%) of satisfied consumers
Source: Customer Satisfaction Survey; Overall sample n=2526
Parameters are arranged in order of importance to consumers

97 CRA Consumer Satisfaction Survey 2014
Network: Data Services- Perception on Various Parameters
Table 65: Experience with Data Services Aspects: By Type of Connection
Data Services Overall Prepaid Postpaid
Quality of data services 92 94 87
Data network coverage 94 96 87
Speed of data services 93 95 87
Video access/streaming quality 92 94 86
Figures above represent proportion (%) of satisfied consumers
Source: Customer Satisfaction Survey; Overall sample n=2526
Parameters are arranged in order of importance to consumers
Table 66: Experience With Data Services Aspects: By Service Provider
Data Services Overall Ooredoo Vodafone
Quality of data services 92 90 95
Data network coverage 94 93 95
Speed of data services 93 92 94
Video access/streaming quality 92 90 93
Figures above represent proportion (%) of satisfied consumers
Source: Customer Satisfaction Survey; Overall sample n=2526
Parameters are arranged in order of importance to consumers
Table 67: Experience with Data Services Aspects: By Municipality
Data Services Overall Al Daayen Al Khor & Al
Thakhira Al Rayyan Al Shamal Al Wakra Doha Umm Salal
Quality of data services 92 * 100 99 67 92 92 93
Data network coverage 94 * 99 98 83 99 94 98
Speed of data services 93 * 99 97 66 99 93 90
Video access/streaming quality
92 * 99 95 65 97 91 85
Figures above represent proportion (%) of satisfied consumers
Source: Customer Satisfaction Survey; Overall sample n=2526
Parameters are arranged in order of importance to consumers *Low Base

98 CRA Consumer Satisfaction Survey 2014
Appendix V: Provisioning Experience by Various Segments Table 68: Experience with Provisioning: By Type of Connection
Provisioning Overall Prepaid Postpaid
Ease of activation/ provisioning 88 86 92
Sales agent interacted with 98 97 96
Ease of purchasing the connection 98 98 99
Initial supply time 96 96 97
Minimum Service period for the product 97 97 97
Figures above represent proportion (%) of satisfied consumers
Source: Customer Satisfaction Survey; Overall sample n=2526
Parameters are arranged in order of importance to consumers Table 70: Experience with Provisioning Experience: By Service Provider
Provisioning Overall Ooredoo Vodafone
Ease of activation/ provisioning 88 90 85
Sales agent interacted with 98 97 97
Ease of purchasing the connection 98 98 99
Initial supply time 96 97 98
Minimum Service period for the product 97 98 97
Figures above represent proportion (%) of satisfied consumers
Source: Customer Satisfaction Survey; Overall sample n=2526
Parameters are arranged in order of importance to consumers

99 CRA Consumer Satisfaction Survey 2014
Appendix VI: Experience with Rate Plan/ Tariffs and
Promotions by Various Segments Table 69: Experience with Rate Plan/ Tariff and Promotions: Overall, Mainstream and Transient
Rate Plan/ Tariffs And Promotions Overall Mainstream Transient
Clear Terms and Conditions 90 90 91
Clarity of rate plans 93 94 91
Variety of rate plans to meet your needs 81 86 77
Competitiveness of Tariffs 89 91 89
Tariffs of the different services and offers proposed 96 94 97
Publishing of tariff 91 91 91
Usefulness of benefits of promotions 90 92 89
Attractiveness of Promotion schemes 87 88 83
Figures above represent proportion (%) of satisfied consumers
Source: Customer Satisfaction Survey; Overall sample n=2526
Parameters are arranged in order of importance to consumers Table 70: Experience with Rate Plan/ Tariff and Promotions: By Type of Connection
Rate Plan/ Tariffs And Promotions Overall Prepaid Postpaid
Clear Terms and Conditions 90 89 91
Clarity of rate plans 93 93 93
Variety of rate plans to meet your needs 81 77 89
Competitiveness of Tariffs 89 89 93
Tariffs of the different services and offers proposed 96 96 93
Publishing of tariff 91 91 91
Usefulness of benefits of promotions 90 89 91
Attractiveness of Promotion schemes 87 85 88
Figures above represent proportion (%) of satisfied consumers
Source: Customer Satisfaction Survey; Overall sample n=2526
Parameters are arranged in order of importance to consumers Table 71: Experience with Rate Plan/ Tariff and Promotions: By Service Provider
Rate Plan/ Tariffs And Promotions Overall Ooredoo Vodafone
Clear Terms and Conditions 90 91 90
Clarity of rate plans 93 91 93
Variety of rate plans to meet your needs 81 83 80
Competitiveness of Tariffs 89 89 91
Tariffs of the different services and offers proposed 96 95 97
Publishing of tariff 91 90 92
Usefulness of benefits of promotions 90 90 90
Attractiveness of Promotion schemes 87 87 85
Figures above represent proportion (%) of satisfied consumers
Source: Customer Satisfaction Survey; Overall sample n=2526
Parameters are arranged in order of importance to consumers
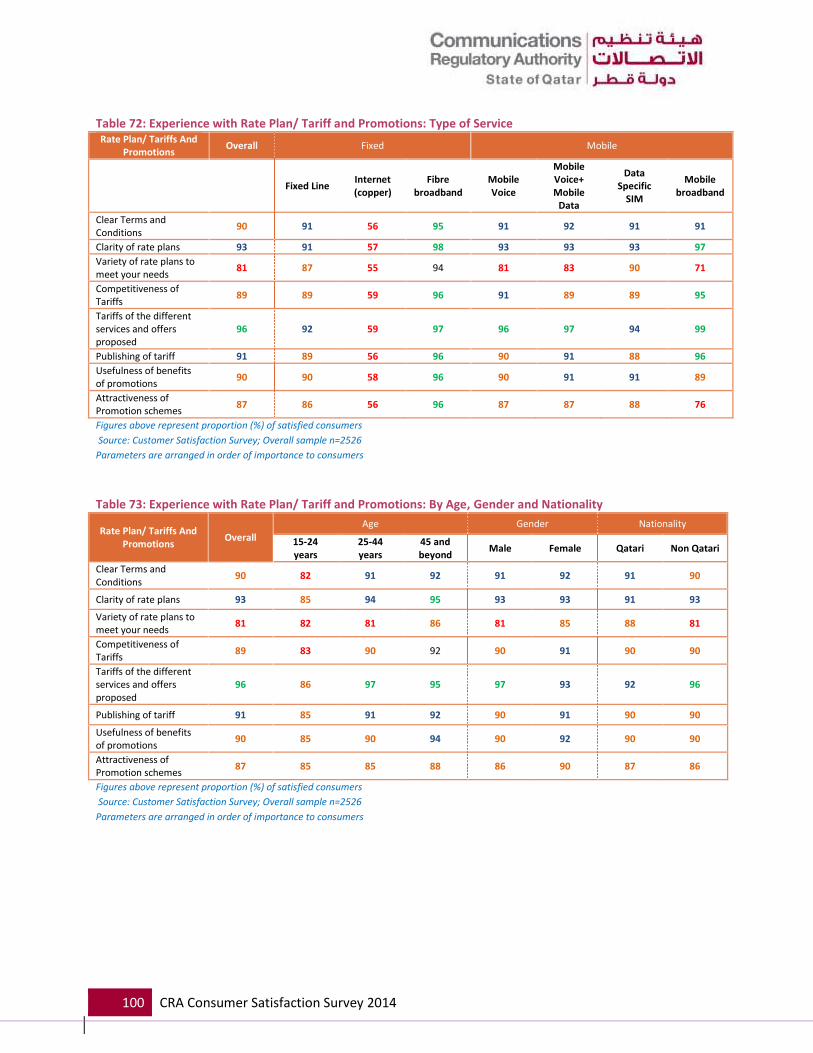
100 CRA Consumer Satisfaction Survey 2014
Table 72: Experience with Rate Plan/ Tariff and Promotions: Type of Service Rate Plan/ Tariffs And
Promotions Overall Fixed Mobile
Fixed Line Internet (copper)
Fibre broadband
Mobile Voice
Mobile Voice+ Mobile
Data
Data Specific
SIM
Mobile broadband
Clear Terms and Conditions
90 91 56 95 91 92 91 91
Clarity of rate plans 93 91 57 98 93 93 93 97
Variety of rate plans to meet your needs
81 87 55 94 81 83 90 71
Competitiveness of Tariffs
89 89 59 96 91 89 89 95
Tariffs of the different services and offers proposed
96 92 59 97 96 97 94 99
Publishing of tariff 91 89 56 96 90 91 88 96
Usefulness of benefits of promotions
90 90 58 96 90 91 91 89
Attractiveness of Promotion schemes
87 86 56 96 87 87 88 76
Figures above represent proportion (%) of satisfied consumers
Source: Customer Satisfaction Survey; Overall sample n=2526
Parameters are arranged in order of importance to consumers Table 73: Experience with Rate Plan/ Tariff and Promotions: By Age, Gender and Nationality
Rate Plan/ Tariffs And Promotions
Overall
Age Gender Nationality
15-24 years
25-44 years
45 and beyond
Male Female Qatari Non Qatari
Clear Terms and Conditions
90 82 91 92 91 92 91 90
Clarity of rate plans 93 85 94 95 93 93 91 93
Variety of rate plans to meet your needs
81 82 81 86 81 85 88 81
Competitiveness of Tariffs
89 83 90 92 90 91 90 90
Tariffs of the different services and offers proposed
96 86 97 95 97 93 92 96
Publishing of tariff 91 85 91 92 90 91 90 90
Usefulness of benefits of promotions
90 85 90 94 90 92 90 90
Attractiveness of Promotion schemes
87 85 85 88 86 90 87 86
Figures above represent proportion (%) of satisfied consumers
Source: Customer Satisfaction Survey; Overall sample n=2526
Parameters are arranged in order of importance to consumers

101 CRA Consumer Satisfaction Survey 2014
Appendix VII: Loyalty Segmentation by Various Segments Figure 68: Loyalty Segment by Mainstream and Transient
Source: Customer Satisfaction Survey; Overall sample=2526
Figure 69: Loyalty Segmentation: By Type of Service
Source: Customer Satisfaction Survey; Overall sample=2526
Figure 70: Loyalty Segmentation: By Type of Connection
Source: Customer Satisfaction Survey; Overall sample=2526
23% 30% 18%
7% 5%
7%
35% 40%
32%
35% 25% 43%
Overall Mainstream Transient
Truly Loyal Accesible Trapped High Risk
32% 16%
33% 25% 21% 32% 15%
7%
3%
3% 7% 8%
2%
1%
40%
26%
43% 29% 38%
40%
46%
21%
56%
21% 39% 32% 26%
37%
Fixed Voice Internet(copper)
Fibre broadband Mobile Voice Mobile Voice +Data
Data specificSIM
Mobilebroadband
Truly Loyal Accesible Trapped High Risk
23% 20% 31%
7% 7% 6%
35% 37% 32%
35% 36% 31%
Overall Prepaid Postpaid
Truly Loyal Accesible Trapped High Risk

102 CRA Consumer Satisfaction Survey 2014
Figure 71: Loyalty Segmentation: By Service Provider
Source: Customer Satisfaction Survey; Overall sample=2526
Figure 72: Loyalty Segmentation: By Age
Source: Customer Satisfaction Survey; Overall sample=2526
Figure 73: Loyalty Segmentation: By Gender and Nationality
Source: Customer Satisfaction Survey; Overall sample=2526
23% 27% 16%
7% 5% 8%
35% 38% 32%
35% 30% 43%
Overall Ooredoo Vodafone
Truly Loyal Accesible Trapped High Risk
25% 22% 30% 2% 8%
3%
41% 34% 42%
33% 36% 26%
15-24 25- 44 years 45 and beyond
Truly Loyal Accesible Trapped High Risk
22% 30% 38% 21%
6% 7%
5%
5%
34%
46% 33%
37%
37% 18% 25%
37%
Male Female Qatari Non- Qatari
Truly Loyal Accesible Trapped High Risk

103 CRA Consumer Satisfaction Survey 2014
Appendix VIII: Intention to Recommend by Various Segments
Figure 74: Intention to Recommend: Type of Service
Source: Customer Satisfaction Survey; Overall sample n=2526
Figure 75: Intention to Recommend: Type of Connection and Service Provider
Source: Customer Satisfaction Survey; Overall sample n=2526
Figure 76: Intention to Recommend: By Gender and Nationality
Source: Customer Satisfaction Survey; Overall sample n=2526
72%
42%
76% 55% 60%
72% 62%
24%
56%
23% 43% 39%
26% 38%
4% 2% 1% 2% 1% 2%
Fixed Voice Internet(copper)
Fibre broadband Mobile Voice Mobile Voice +Data
Data specificSIM
Mobilebroadband
Extremely/ Very Likely Somewhat Likely Not very/ Not at all Likely
57%
63% 65%
48%
Prepaid Postpaid Ooredoo Vodafone
Extremely/ Very Likely
56%
75% 83%
58%
Male Female Qataris Non-Qataris
Extremely/ Very Likely
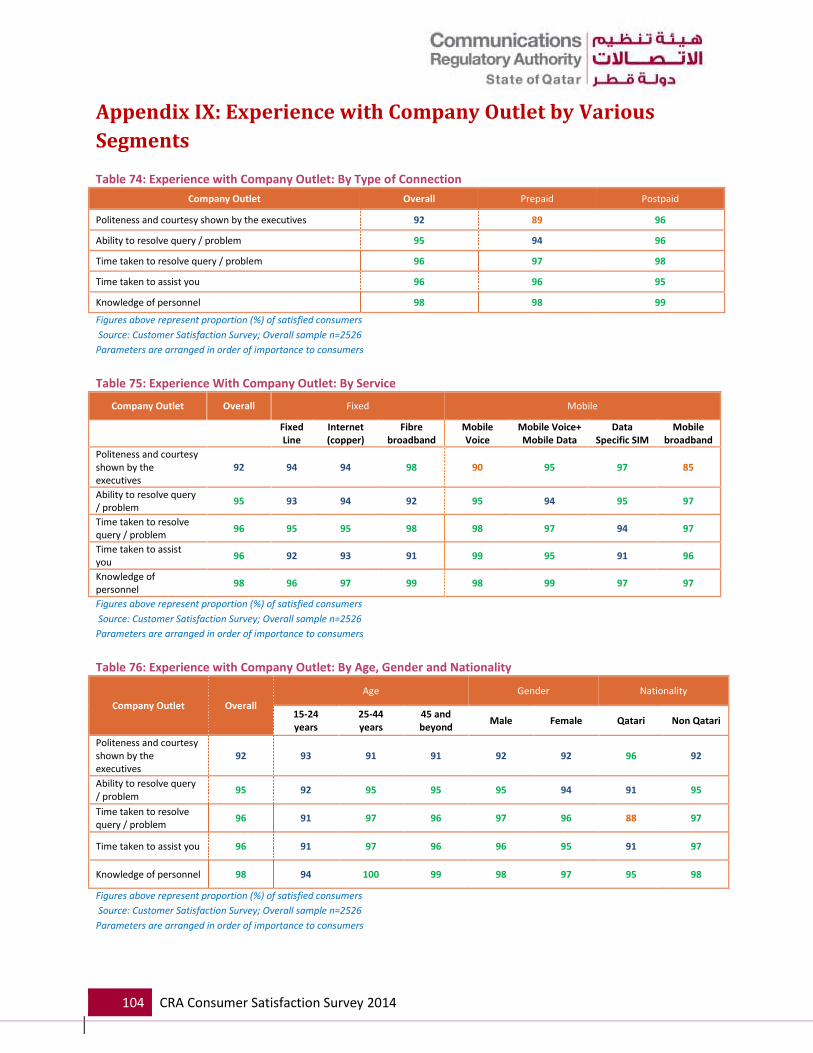
104 CRA Consumer Satisfaction Survey 2014
Appendix IX: Experience with Company Outlet by Various
Segments
Table 74: Experience with Company Outlet: By Type of Connection
Company Outlet Overall Prepaid Postpaid
Politeness and courtesy shown by the executives 92 89 96
Ability to resolve query / problem 95 94 96
Time taken to resolve query / problem 96 97 98
Time taken to assist you 96 96 95
Knowledge of personnel 98 98 99
Figures above represent proportion (%) of satisfied consumers
Source: Customer Satisfaction Survey; Overall sample n=2526
Parameters are arranged in order of importance to consumers
Table 75: Experience With Company Outlet: By Service
Company Outlet Overall Fixed Mobile
Fixed Line
Internet (copper)
Fibre broadband
Mobile Voice
Mobile Voice+ Mobile Data
Data Specific SIM
Mobile broadband
Politeness and courtesy shown by the executives
92 94 94 98 90 95 97 85
Ability to resolve query / problem
95 93 94 92 95 94 95 97
Time taken to resolve query / problem
96 95 95 98 98 97 94 97
Time taken to assist you
96 92 93 91 99 95 91 96
Knowledge of personnel
98 96 97 99 98 99 97 97
Figures above represent proportion (%) of satisfied consumers
Source: Customer Satisfaction Survey; Overall sample n=2526
Parameters are arranged in order of importance to consumers
Table 76: Experience with Company Outlet: By Age, Gender and Nationality
Company Outlet Overall
Age Gender Nationality
15-24 years
25-44 years
45 and beyond
Male Female Qatari Non Qatari
Politeness and courtesy shown by the executives
92 93 91 91 92 92 96 92
Ability to resolve query / problem
95 92 95 95 95 94 91 95
Time taken to resolve query / problem
96 91 97 96 97 96 88 97
Time taken to assist you 96 91 97 96 96 95 91 97
Knowledge of personnel 98 94 100 99 98 97 95 98
Figures above represent proportion (%) of satisfied consumers
Source: Customer Satisfaction Survey; Overall sample n=2526
Parameters are arranged in order of importance to consumers
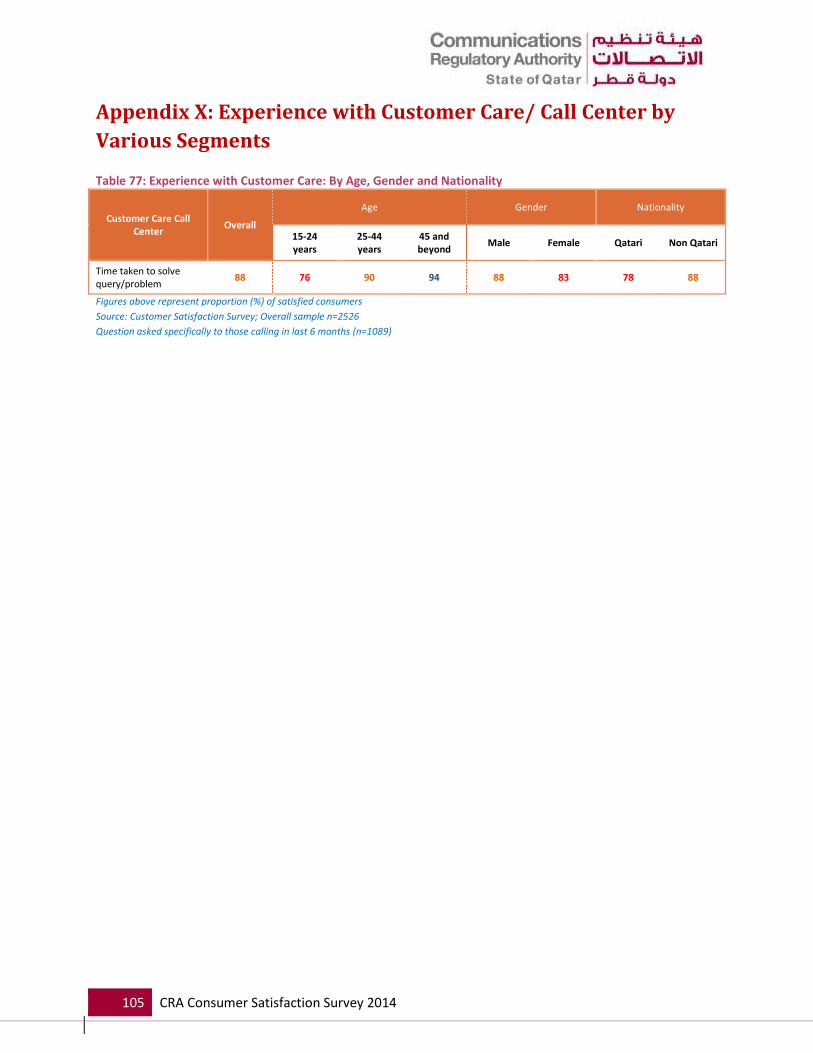
105 CRA Consumer Satisfaction Survey 2014
Appendix X: Experience with Customer Care/ Call Center by
Various Segments Table 77: Experience with Customer Care: By Age, Gender and Nationality
Customer Care Call Center
Overall
Age Gender Nationality
15-24 years
25-44 years
45 and beyond
Male Female Qatari Non Qatari
Time taken to solve query/problem
88 76 90 94 88 83 78 88
Figures above represent proportion (%) of satisfied consumers
Source: Customer Satisfaction Survey; Overall sample n=2526
Question asked specifically to those calling in last 6 months (n=1089)

106 CRA Consumer Satisfaction Survey 2014
Appendix XI: Experience with Billing by Various Segments Table 80: Experience with Billing: Type of Service
Billing Process Overall Fixed Line
Internet (copper)
Fibre broadband
Mobile Voice
Mobile Voice+ Mobile
Data
Data Specific
SIM
Mobile broadband
Regularity of receiving bills i.e. every month
99 98 99 99 99 100 97 100
Ease of understanding the bill statement
99 99 99 99 99 100 98 100
Accuracy of the bill amount
97 96 96 99 94 99 98 99
Figures above represent proportion (%) of satisfied consumers
Source: Customer Satisfaction Survey; Overall sample n=2526
Parameters are arranged in order of importance to consumers Table 78: Experience with Billing: By Age, Gender and Nationality
Billing Process Overall
Age Gender Nationality
15-24 years
25-44 years
45 and beyond
Male Female Qatari Non Qatari
Regularity of receiving bills i.e. every month
99 97 99 99 98 99 96 100
Ease of understanding the bill statement
99 97 99 98 99 98 97 99
Accuracy of the bill amount
97 96 97 95 98 95 95 97
Figures above represent proportion (%) of satisfied consumers
Source: Customer Satisfaction Survey; Overall sample n=2526
Parameters are arranged in order of importance to consumers

107 CRA Consumer Satisfaction Survey 2014
Appendix XII: Experience with Payment by Various Segments Table 79: Experience with Payment: By Age, Gender and Nationality
Payment Process Overall
Age Gender Nationality
15-24 years
25-44 years
45 and beyond
Male Female Qatari Non Qatari
Experience with payment modes
99 98 100 100 100 98 98 100
Adequacy of the locations at which payment can be made
98 97 98 99 99 98 94 100
Figures above represent proportion (%) of satisfied consumers
Source: Customer Satisfaction Survey; Overall sample n=2526
Parameters are arranged in order of importance to consumers
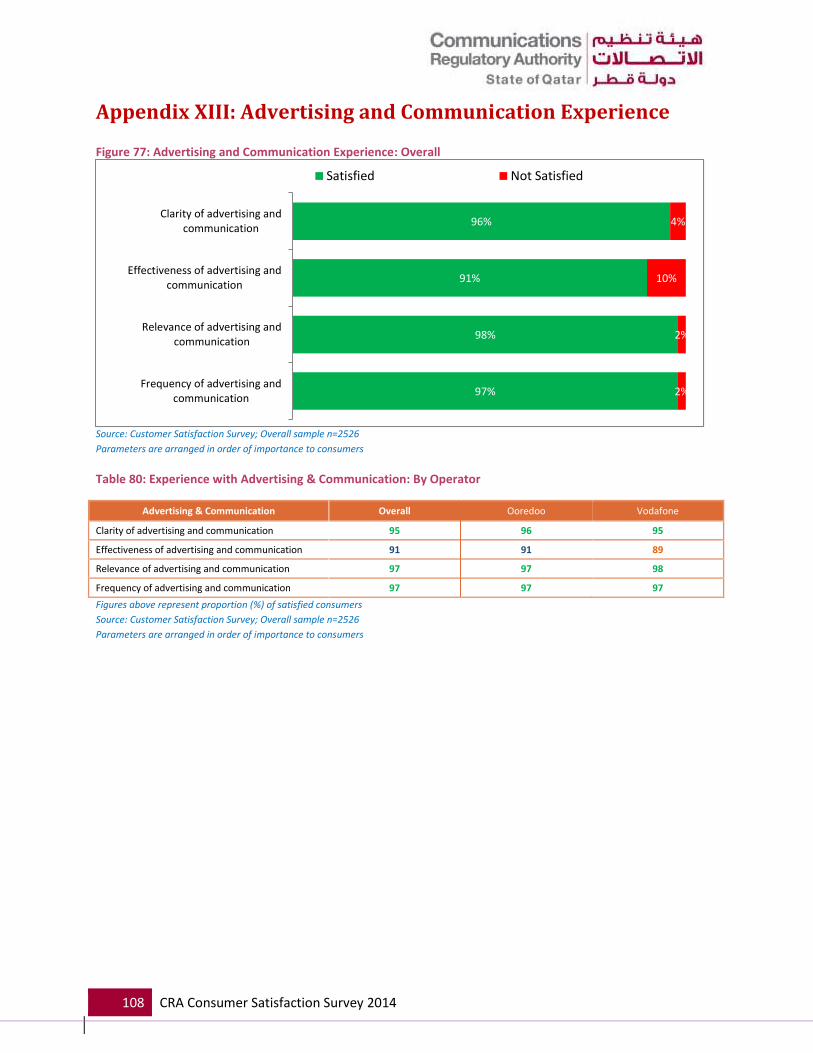
108 CRA Consumer Satisfaction Survey 2014
Appendix XIII: Advertising and Communication Experience Figure 77: Advertising and Communication Experience: Overall
Source: Customer Satisfaction Survey; Overall sample n=2526
Parameters are arranged in order of importance to consumers
Table 80: Experience with Advertising & Communication: By Operator
Advertising & Communication Overall Ooredoo Vodafone
Clarity of advertising and communication 95 96 95
Effectiveness of advertising and communication 91 91 89
Relevance of advertising and communication 97 97 98
Frequency of advertising and communication 97 97 97
Figures above represent proportion (%) of satisfied consumers
Source: Customer Satisfaction Survey; Overall sample n=2526
Parameters are arranged in order of importance to consumers
96%
91%
98%
97%
4%
10%
2%
2%
Clarity of advertising andcommunication
Effectiveness of advertising andcommunication
Relevance of advertising andcommunication
Frequency of advertising andcommunication
Satisfied Not Satisfied
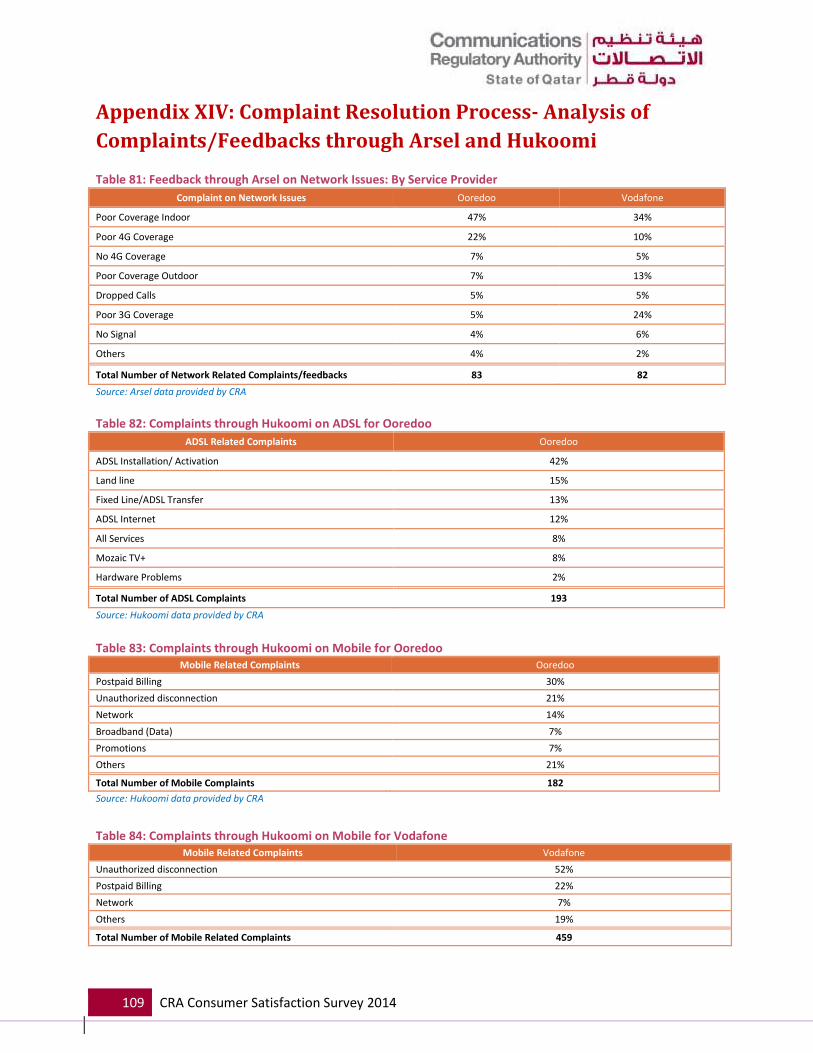
109 CRA Consumer Satisfaction Survey 2014
Appendix XIV: Complaint Resolution Process- Analysis of
Complaints/Feedbacks through Arsel and Hukoomi
Table 81: Feedback through Arsel on Network Issues: By Service Provider
Complaint on Network Issues Ooredoo Vodafone
Poor Coverage Indoor 47% 34%
Poor 4G Coverage 22% 10%
No 4G Coverage 7% 5%
Poor Coverage Outdoor 7% 13%
Dropped Calls 5% 5%
Poor 3G Coverage 5% 24%
No Signal 4% 6%
Others 4% 2%
Total Number of Network Related Complaints/feedbacks 83 82
Source: Arsel data provided by CRA
Table 82: Complaints through Hukoomi on ADSL for Ooredoo
ADSL Related Complaints Ooredoo
ADSL Installation/ Activation 42%
Land line 15%
Fixed Line/ADSL Transfer 13%
ADSL Internet 12%
All Services 8%
Mozaic TV+ 8%
Hardware Problems 2%
Total Number of ADSL Complaints 193
Source: Hukoomi data provided by CRA
Table 83: Complaints through Hukoomi on Mobile for Ooredoo
Mobile Related Complaints Ooredoo
Postpaid Billing 30%
Unauthorized disconnection 21%
Network 14%
Broadband (Data) 7%
Promotions 7%
Others 21%
Total Number of Mobile Complaints 182
Source: Hukoomi data provided by CRA
Table 84: Complaints through Hukoomi on Mobile for Vodafone Mobile Related Complaints Vodafone
Unauthorized disconnection 52%
Postpaid Billing 22%
Network 7%
Others 19%
Total Number of Mobile Related Complaints 459

110 CRA Consumer Satisfaction Survey 2014
Source: Hukoomi data provided by CRA
Appendix XV: References Qatar‘s ICT Landscape 2014 Report (Households and Individuals)
Qatar Telecommunications Report Q2 2014- BMI
Walker Stakeholder Research Database
Consumer Awareness and Satisfaction Survey 2014 – iDA Singapore
Ofcom – The Communication Market Report, 7th August 2014
ACMA – Communication Report 2014
ICT in the UAE Household Survey, 2014
Labor Force Survey: The Third quarter (July – September) 2014 – Ministry of Development
Planning and Statistics
Population, Housing & Establishments Census April 2010- – Ministry of Development Planning
and Statistics
Subscription numbers for Ooredoo and Vodafone from CRA
Media Use in the Middle East An Eight-Nation Survey conducted by Northwestern University in
Qatar in association with Harris Interactive
The state of Broadband 2013: Broadband Commission, September 2013, ITU
http://www.ictqatar.qa/sites/default/files/web_infographic.pdf
Socialbakers Country Statistics : September 2014
Website: Rollout of MNP http://www.ictqatar.qa/en/news-events/news/mobile-number-
portability-services-rollout-qatar
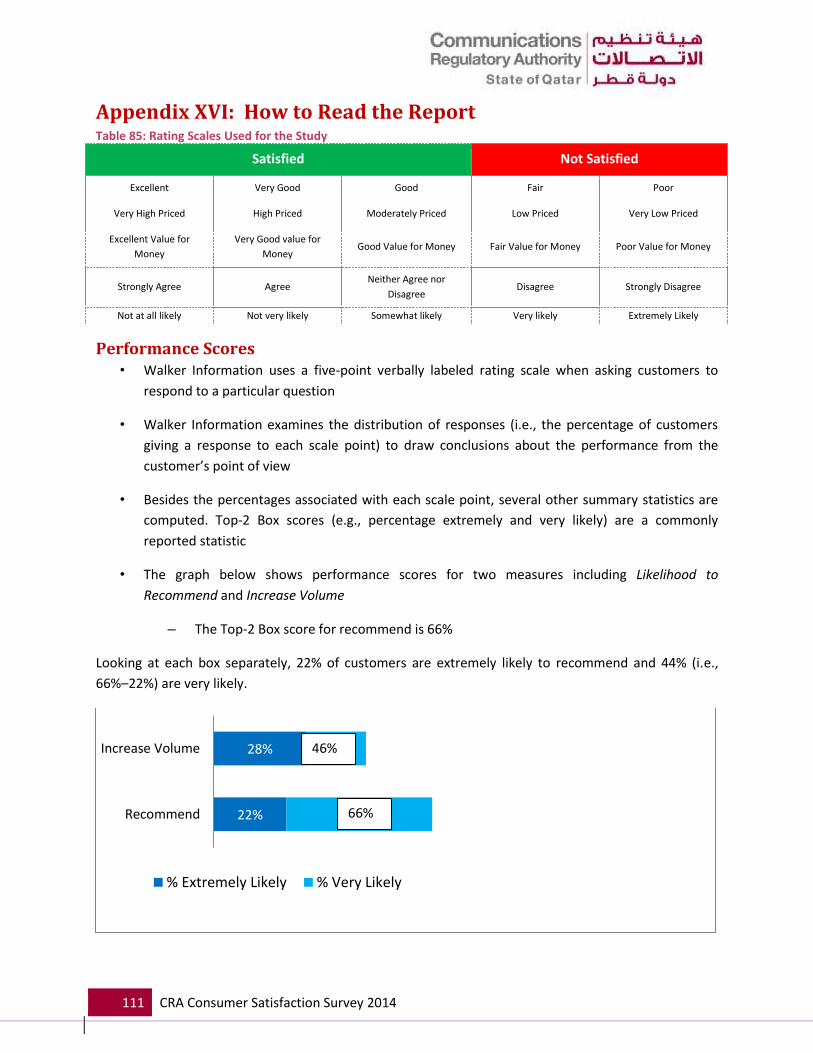
111 CRA Consumer Satisfaction Survey 2014
Appendix XVI: How to Read the Report Table 85: Rating Scales Used for the Study
Satisfied Not Satisfied
Excellent Very Good Good Fair Poor
Very High Priced High Priced Moderately Priced Low Priced Very Low Priced
Excellent Value for
Money
Very Good value for
Money Good Value for Money Fair Value for Money Poor Value for Money
Strongly Agree Agree Neither Agree nor
Disagree Disagree Strongly Disagree
Not at all likely Not very likely Somewhat likely Very likely Extremely Likely
Performance Scores • Walker Information uses a five-point verbally labeled rating scale when asking customers to
respond to a particular question
• Walker Information examines the distribution of responses (i.e., the percentage of customers
giving a response to each scale point) to draw conclusions about the performance from the
customer’s point of view
• Besides the percentages associated with each scale point, several other summary statistics are
computed. Top-2 Box scores (e.g., percentage extremely and very likely) are a commonly
reported statistic
• The graph below shows performance scores for two measures including Likelihood to
Recommend and Increase Volume
– The Top-2 Box score for recommend is 66%
Looking at each box separately, 22% of customers are extremely likely to recommend and 44% (i.e.,
66%–22%) are very likely.
22%
28%
Recommend
Increase Volume
% Extremely Likely % Very Likely
46%
66%

112 CRA Consumer Satisfaction Survey 2014
Statistics Used • Significance testing: A tool used to determine if significant differences exist between two sample
measures (e.g., top-two-box scores or means).
• Statistical testing is important because it shows whether differences observed in the measures
are truly different, or if they may be attributable to chance. Significance tests tell us whether it
can be assumed if differences really exist. It cannot be used to establish whether the difference
is meaningful.
• Confidence Level: An interval, in the form of a percent, which shows the probability of the
results not occurring randomly. A confidence level is determined prior to a statistical test being
performed, and is normally defined as 90 or 95%.
• The confidence level indicates how confident it is that a true difference exists between two
measures. The higher the confidence level is, the less chance there is of drawing an incorrect
conclusion. The error, or significance level, is 1-confidence level. So, if tests are run with a 95%
confidence level, there is a 5% chance that an incorrect conclusion will be drawn.
• If a test is performed at a 95% confidence level, it means that if 100 pairs of similar samples
were taken, 95 of them would have the same the result. Five of them (5%) would not, thus the
5% error.
• Precision: The discrepancy, attributable to random sampling error, between the sample
outcome and its expected value. The greater the discrepancy, the lower the precision.
• Correlation Analysis:
• Correlation analysis is conducted when the sample size is too small for regression (less
than 40 responses) or when there is only one independent variable.
• Measures the degree of association between two variables.
• Correlation coefficients can be interpreted similarly to regression coefficients.
Correlation coefficients tend to be larger in magnitude than regression coefficients.
• Unlike regression, there is no statistical control for the inter-relationships among the
independent variables.
• Coefficients range in value from negative one to positive one. A zero indicates no
relationship and a one indicates a perfect positive relationship between the two
variables, meaning as the independent variable increases or decreases, the dependent
variable will move the same direction.
• Factor Analysis:

113 CRA Consumer Satisfaction Survey 2014
• Used for data reduction and summarization. Looks at the inter-relationships among
several variables and identifies a smaller number of common underlying dimensions or
factors
• In the example below, six image questions can be represented with three factors or
dimensions. The first three questions represent a customer-oriented factor, the next
two questions represent a leadership factor, and the last question represents an
environmentally responsible factor. These three factors can be used to accurately
represent the six questions
• Key Driver Analysis:
• Multiple regression analysis is used to quantify the relationship between a single
dependent measure and one or more independent measures
• A weight is calculated for each independent variable to indicate the “unique” impact a
particular variable has in predicting the dependent measure
• The weight (i.e., regression coefficient) represents the expected change in the
dependent variable for a one unit change in a given predictor, all else constant
• Multiple regression analysis statistically controls for the inter-relationships among the
explanatory variables
• All variables are standardized to control for scale and dispersion differences. The end
result is a set of impact coefficients which can be ranked and compared to one another
• Total Effects
• Total effects analysis simplifies interpretation of the model by summarizing the effects
of the overall measures, processes, and attributes on customer loyalty.
• An arrow between any two boxes in the model indicates a direct relationship or path
between a predictor and a dependent measure.
• Variables can also have indirect relationships with other variables in a causal model. For
instance, Quality can also impact customer loyalty indirectly through Value.
• The sum of the direct relationship and all indirect relationships is referred to as the total
effect of one variable on another
114 CRA Consumer Satisfaction Survey 2014
Walker’s Stakeholder Relationship Database (SRD) • Walker Information has over 60 years of market research experience of which about 30
years is in conducting customer satisfaction related research for many clients around
the world. This wealth of experience has been recorded in the Stakeholder Relationship
Database (SRD). The SRD contains “normative” data of customer behaviors, attitudes
and experiences with company products and services.
• The SRD allows one to understand the high and low norms in their industry or simply,
the “world class” customer satisfaction and loyalty numbers achieved by some of the
best companies around the world.