THE IMPACT OF PREVENTION MEASURES AND ORGANISATIONAL FACTORS ON OCCUPATIONAL INJURIES ·...
37
Documents de Treball THE IMPACT OF PREVENTION MEASURES AND ORGANISATIONAL FACTORS ON OCCUPATIONAL INJURIES Pablo Arocena, Imanol Núñez, Mikel Villanueva Document de Treball núm. 07/3 Departament d'Economia de l'Empresa
Transcript of THE IMPACT OF PREVENTION MEASURES AND ORGANISATIONAL FACTORS ON OCCUPATIONAL INJURIES ·...
Documents de Treball
THE IMPACT OF PREVENTION MEASURES
AND ORGANISATIONAL FACTORS
ON OCCUPATIONAL INJURIES
Pablo Arocena, Imanol Núñez, Mikel Villanueva
Document de Treball núm. 07/3
Departament d'Economia de l'Empresa

© Pablo Arocena, Imanol Núñez, Mikel Villanueva Coordinador / Coordinator Documents de treball:
David Urbano http://selene.uab.es/dep-economia-empresa/recerca/Documents.htme-mail: [email protected] Telèfon / Phone: +34 93 5814298 Fax: +34 93 5812555
Edita / Publisher:
Departament d'Economia de l'Empresa http://selene.uab.es/dep-economia-empresa/Universitat Autònoma de Barcelona Facultat de Ciències Econòmiques i Empresarials Edifici B 08193 Bellaterra (Cerdanyola del Vallès), Spain Tel. 93 5811209 Fax 93 5812555
Gener / January, 2007
Ltilemta Amrethwad
THE IMPACT OF PREVENTION MEASURES
AND ORGANISATIONAL FACTORS
ON OCCUPATIONAL INJURIES
Pablo Arocena, Imanol Núñez, Mikel Villanueva
Document de Treball núm. 07/3
a sèrie Documents de treball d'economia de l'empresa presenta els avanços i resultats d'inves-gacions en curs que han estat presentades i discutides en aquest departament; això no obstant, s opinions són responsabilitat dels autors. El document no pot ser reproduït total ni parcial-ent sense el consentiment de l'autor/a o autors/res. Dirigir els comentaris i suggerències direc-ment a l'autor/a o autors/res, a la direcció que apareix a la pàgina següent.
Working Paper in the Documents de treball d'economia de l'empresa series is intended as a ean whereby a faculty researcher's thoughts and findings may be communicated to interested aders for their comments. Nevertheless, the ideas put forwards are responsibility of the au-or. Accordingly a Working Paper should not be quoted nor the data referred to without the ritten consent of the author. Please, direct your comments and suggestions to the author, which dress shows up in the next page.


The Impact of Prevention Measures and Organisational Factors on
Occupational Injuries
Pablo Arocena a, *Imanol Núñez a, Mikel Villanueva a
aDepartamento de Gestión de Empresas. Universidad Pública de Navarra. Campus de Arrosadia.
31006 Pamplona, Spain.
Abstract This paper analyses the impact of a series of managerial and organisational factors on
occupational injuries. These consist of occupational safety measures, as regards both the
intensity and the orientation of risk prevention in companies, and the adoption of certain
work organisation practices, quality management and the use of flexible production
technologies. We estimate a negative binomial regression based on a sample of 213
Spanish industrial establishments, defining a constant random parameter to take account
of non-observable heterogeneity. Our results show that occupational safety measures,
the intensive use of quality management tools and the empowerment of workers all help
to reduce the number of injuries. We have also confirmed the presence of synergies
between the organisational factors analysed and the development of an occupational
safety strategy featuring participation and the extension of prevention to all levels of the
organisation.
Keywords: Occupational Safety, Prevention Management, Organisational Factors * Corresponding Author Departamento de Gestión de Empresas. Universidad Pública de Navarra. Campus de Arrosadia. 31006 Pamplona, Spain. Tel.: +34 948169684; Fax +34 948169404; e-mail: [email protected]: [email protected]: [email protected]
1. Introduction
The conventional approach to occupational health and safety was largely based on the study
of the chemical, physical and biological risks to which people may be exposed in the
workplace. Meanwhile, other areas, such as psychological and psychosocial risks, gradually
attracted researchers’ attention. However, the real revolution in the field of health and safety
at work was the expansion of the focus from the individual worker to the conditions of the
establishment.
As Hale and Hovden (1998) explain, it was only in the 1980s that the conviction
spread among those with responsibilities in the field of workplace health and safety that the
traditional approach, centered around the relationship between the individual worker and
technology, was not enough. These authors identified three stages in the evolution of
workplace health and safety management. In the first, the sole objective was the search for
technical measures to lower the risk of accidents. In the second, interest shifted to the
individual, focusing on behaviour and ergonomics with the goal of shaping the workplace to
suit the person. The third stage is characterized by the consideration of organisational and
management issues as fundamental factors for safety improvement.
In recent years, the authorities in the developed nations have paid considerable
attention to the business organisation in looking for improving preventive practices.
Nevertheless, the National Institute for Occupational Safety and Health in the USA recently
stressed that research into the relationship between organisational factors and accident rates is
still sparse and incomplete, and sketched the priorities for further study (NIOSH, 2002). The
NIOSH report underlined that organisational change and the new management practices
adopted by firms in recent years have potential implications for safety that have not received
sufficient attention to date. In particular, it affirms that priority should be given to the
following issues: (i) changes in workload and pressure; (ii) the effects of vertical
1

decentralisation of jobs and job enrichment; (iii) appropriate organisation of prevention
services and programmes; (iv) the impact of changes in work organisation on awareness of
workplace risks, as well as the preventive effort of both the employer and the worker; and (v)
the effects that organisational changes have on the work/leisure balance.
Despite its unquestionable importance, the relationship between organisational
parameters, intensity and the type of preventive measures implemented by firms and
industrial accident rates is a line of research that has received comparatively little attention.
Furthermore, the majority of papers in this field are descriptive reports that theorize about the
impact of certain organisational practices on workplace risks. Empirical studies are rare,
however, and are affected by significant methodological and data limitations.
This paper contributes to this literature in several ways. In the first place, we analyse
the effect of various organisational parameters on injury rates. Thus, we consider three
organisational dimensions, namely the technology and the organization of production, the
application of quality management practices, and the empowerment of workers. Further, we
construct a risk prevention index that quantifies the intensity of firm’s preventive effort. The
relationship between these indicators with the accident measures allows us to determine the
nature of their impact on the workplace safety. Secondly, we test whether the combination of
innovative preventive effort with the organisational factors helps to further reduce the number
of injuries. In other words, we ask whether there are any synergies between this type of
prevention and organisational factors. We analyse these issues for a sample of 213 industrial
firms in Spain with over 30 employees by means of a negative binomial regression.
The paper is organised as follows. The following section discusses how prevention
decisions and organisational factors relate with the accident rate, and establishes the
hypotheses we shall test. The third section describes the econometric methodology. In the
fourth section, we present the applied study, the variables employed and the data obtained.
2

The fifth section presents and comments on the results of the econometric analysis, and the
paper closes with our main conclusions.
2. Risk prevention and the role of organisational factors in reducing the accident rate:
some hypotheses
2.1. The intensity and the orientation of risk prevention
Reducing the risk of accidents and occupational disease means undertaking what is generally
known as prevention. For example, article 4 of the Spanish Workplace Risks Prevention Act
(Law 31/November 8th 1995) defines prevention as “all the steps or measures taken or
planned at all stages of work in the enterprise to prevent or reduce occupational risks”. The
Act requires all entrepreneurs to take “all such measures as may be necessary to protect the
health and safety of their employees” (article 14). All of the measures established are by
nature “minimum legal requirements”, which may be developed and enhanced in collective
labour agreements (article 2.2).
If action is effective, we may expect that more intense risk prevention will result in
lower accident rates. Thus, the accident rate in firms that take only the minimum preventive
measures necessary to comply with the law will be significantly higher than rates in those
firms that take a more proactive stance toward the development of a comprehensive
workplace risk prevention system. This is confirmed by the available empirical evidence.
Hunt and Habeck (1993) examined a sample of 220 firms in the US State of Michigan in
order to establish the relationship between certain workplace risk prevention parameters and
indices for the frequency and severity of accidents. These authors stress the need to generate
and process internal information, investigate accidents and incidents fully, foster the
emergence of a “prevention culture” and promote programmes to enhance workplace
ergonomics. Simard and Marchand (1996) relate effective prevention with young businesses
3
in which workplace risks are evaluated and accidents are more fully investigated on the basis
of a sample of 100 industrial firms in Quebec. Chew (1988) analyses differences between safe
and unsafe industries using data drawn from firms in India, Singapore and Thailand, finding
that the most effective preventive measures consist of senior management involvement,
specific training and audits. Simonds and Shafai-Sahrai (1977) obtained similar findings. In
light of the above, we may formally establish the first of our hypotheses as follows:
H1: A more intense effort by the firm in the field of risk prevention is negatively related with
the occupational accident rate. The firm may, of course, adopt a range of approaches or standpoints in the design and
implementation of its occupational safety management system. According to the reports
published by international bodies such as the OSHA and the NIOSH, it is possible to identify
two general types of prevention management systems, namely traditional and innovative
systems. The traditional prevention system involves low levels of integration, hierarchical
structures, the control of risks that are not related with behavioural factors and high levels of
paperwork. Innovative systems, on the other hand, feature high levels of integration,
structures that foster employees’ involvement, special attention to the control of behaviour
related risks, and relatively little paperwork.
We argue below that the innovative orientation in risk prevention is more effective in
reducing occupational risks because reinforces the positive effects of other managerial and
organizational practices.
2.2. Technology: Automation and flexible manufacturing systems.
In response to changes in the market and the need to adapt to ever shorter product
lifecycles, firms acquire new technologies and implement flexible manufaturing systems.
These new assets allow faster adjustment of production systems because they are more easily
adapted to different production sequences, cutting costs at the same time as permitting the
firm to maintain a more varied product range. However, the adoption of new production
4
technologies can have a negative impact on accident rates, basically because they shorten
process times, thereby increasing the pace and intensity of work. This raises risk and stress
levels, leading to the emergence of ergonomic and psychosocial problems (Landsbergis et al,
1999; Harrison and Legendre, 2003).
Furthermore, the labour force must be trained to use complex new technologies. If
effective training and prevention measures are not taken, older workers will make poorer use
of the new than the old technology. In such cases, occupational risks will increase to the
extent that workers fail to adapt to the new skills required and accident rates will suffer. We
believe, however, that innovative prevention can be effective in processing, interpreting and
transmitting information flows between the agents concerned in the different stages of the
production process, and that they help to ensure the exploitation of the safety potential of
automated and coordinated systems. Thus, Cohen (1977) concludes that people-oriented
prevention systems are more effective than technology-oriented approaches. The findings of
Shannon (1996) and Habeck et al (1991) point in the same direction.
In light of the above discussion, we may formulate the following hypotheses:
H2: Automation and the implementation of flexible production technologies are positively
related with accident rates. H3: The combination of flexible production technologies and innovative risk prevention is
negatively associated with accident rates.
2.3. Quality management
The progressive implementation of ideas and techniques related with the total quality
management concept is one of the clearest manifestations of organisational innovation in the
industry in the last decades. From the standpoint of the risk prevention literature, it has been
argued that the joint use of advanced quality management systems and occupational risk
prevention management techniques generates synergies that help reduce accident rates
5

(Rahimi, 1995; Beechner and Kock, 1997). These synergies emerge because both quality and
occupational risk management are based on the principle of prevention rather than corrective
action. Consequently, we may expect that firms employing innovative risk prevention systems
and advanced quality management simultaneously will present lower accident rates. These
arguments form the basis for the following hypotheses:
H4: Intensive use of quality management tools is negatively associated with accident rates. H5: The combination of advanced quality management and innovative risk prevention
measures reduces accident rates.
2.4. Work Organisation and Empowerment
In general terms, the literature distinguishes between two approaches or alternative systems
for the organisation of work. On the one hand, conventional work organisation following the
Taylorist model based on the division of labour, with individual workers assigned to highly
specialised jobs, involving the repetitive performance of just a few tasks, where some people
think while others do, and where supervision is applied extensively within a strongly
hierarchical structure.
In contrast to this approach, the new work organisation developed in recent years aims
to supersede the traditional conception of the mass production worker. The aim is to create
work systems capable of raising the involvement and motivation of workers with moderate
use of supervision as a control instrument and horizontal organisational structures in which
decision making power is displaced downward. These new work organisation systems
generally entail the definition of richer and more varied jobs, the use of autonomous work
teams, and higher levels of worker participation, all of which resulting in greater worker
empowerment (Ichniowsky et al, 1996; Becker and Huselid, 1998).
Job enrichment means that the worker undertakes, controls, plans, organises and
designs the task. In general terms, it is argued in the literature that greater empowerment of
6

workers is a favourable factor in reducing the accident rate. The available empirical evidence
shows that accident rates are negatively related with the delegation of authority, greater
autonomy and involvement of workers and high levels of mutual commitment (Frieling et al,
1997; Kaminski, 2001; Shannon et al, 2001; Roy, 2003; Zacharatos et al, 2005).
Where workers are able to analyse and identify the risks inherent in their activity and
the firm allows them to adapt job designs, the accident rate should fall. Additionally, we may
expect that innovative risk prevention management combined with higher levels of
empowerment will multiply the positive effects of worker responsibility and involvement on
occupational safety. Therefore:
H6: The empowerment of workers is negatively associated with the accident rate. H7: The combination of innovative risk prevention and worker empowerment reduces the
accident rate.
3. Methodology: the negative binomial regression model
The majority of studies exploring the organisational factors related with occupational
accidents and illnesses employ either case studies or liner regressions between the explanatory
factors measured and the dependent variable (i.e. the accident rate). However, the application
of linear regression models in the field of occupational safety presents some problems,
because accidents are discrete events, which is to say they occur in positive, whole numbers,
and not a continuous variable distributed asymptotically with regard to a standard.
Nelder and Wedderburn (1972) developed their Generalized Linear Models
(hereinafter GLM) precisely to overcome these limitations. There are two main differences
between classic linear models and GLM. Firstly, GLM allow room for the dependent variable
to follow any exponential distribution, including the normal distribution. Secondly, they
establish a more flexible relationship between the dependent and the explanatory variable
through the introduction of a link function. In the classic linear model, the estimated mean
7

βμ iii xyE == )( is a linear combination of the explanatory variables. GLM, on the other
hand, relax this assumption, permitting different types of relationship in the form
)( iii xh βμ = , where is the link function (Fahmeir and Tutz, 1994). )(⋅h
Count data variables have traditionally been estimated using the Poisson regression, a
technique that belongs to the GLM family. However, the Poisson regression has the drawback
that the mean and variance of the sample must be equal (absence of overdispersion), but this
is not actually the case with the vast majority of event variables (Breslow, 1984). Cameron
and Trivedi (1999) explain that the overdispersion of count data is normally due to the
presence of non-observable heterogeneity. The most commonly used alternative in cases of
overdispersion is the negative binomial regression. In this model, the parameter that defines a
Poisson process depends on a random variable. The best known negative binomial model
allows the data to follow a Poisson distribution, but assumes that a degree of non-observable
heterogeneity exists, which is distributed according to a Gamma function. Thus, the model in
some way assumes that the real mean is not perfectly observable and the non-observable
heterogeneity is therefore supposed to follow a given distribution.
One of the main problems with cross-section data samples is the possible existence of
non-observable heterogeneity. In the presence of non-observable heterogeneity, differences
between individuals display random variations that are not explained by the independent
variables. The problem is normally associated with panel data sample in which the (t)
observations made for every (i) individuals allow the inclusion of specific variables to control
for the presence of non-observable heterogeneity. However, it is also possible to
accommodate the presence of non-observable heterogeneity in cross-section data using
mixture models. These take numerous different forms and allow the inclusion of a wide range
of assumptions about the nature of the non-observable heterogeneity present in the data.
Greenwood and Yule (1920) algebraically interpret the negative binomial model as a Poisson-
8
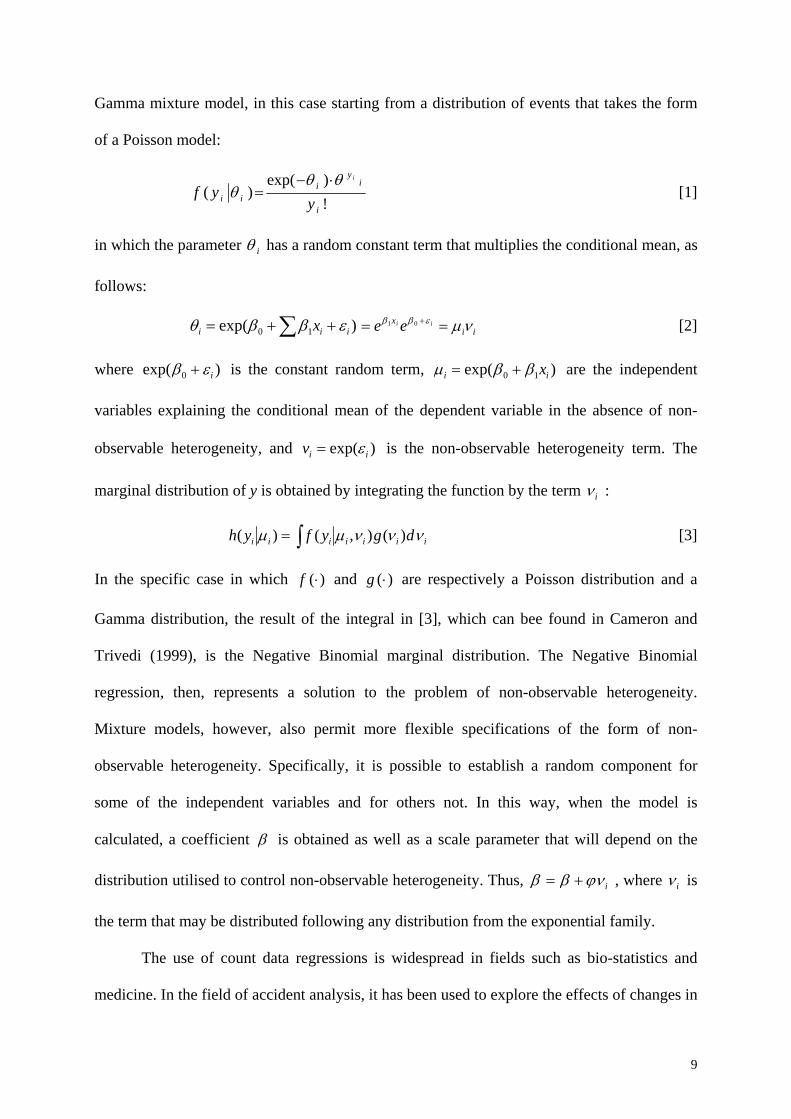
Gamma mixture model, in this case starting from a distribution of events that takes the form
of a Poisson model:
!)exp(
)(i
iy
iii y
yfiθθ
θ⋅−
= [1]
in which the parameter iθ has a random constant term that multiplies the conditional mean, as
follows:
)exp( 10 iii x εββθ ++= ∑ iix ii ee νμεββ == +01 [2]
where )exp( 0 iεβ + is the constant random term, )exp( 10 ii xββμ += are the independent
variables explaining the conditional mean of the dependent variable in the absence of non-
observable heterogeneity, and )exp( iiv ε= is the non-observable heterogeneity term. The
marginal distribution of y is obtained by integrating the function by the term iν :
iiiiiii dgyfyh νννμμ )(),()( ∫= [3]
In the specific case in which and )(⋅f )(⋅g are respectively a Poisson distribution and a
Gamma distribution, the result of the integral in [3], which can bee found in Cameron and
Trivedi (1999), is the Negative Binomial marginal distribution. The Negative Binomial
regression, then, represents a solution to the problem of non-observable heterogeneity.
Mixture models, however, also permit more flexible specifications of the form of non-
observable heterogeneity. Specifically, it is possible to establish a random component for
some of the independent variables and for others not. In this way, when the model is
calculated, a coefficient β is obtained as well as a scale parameter that will depend on the
distribution utilised to control non-observable heterogeneity. Thus, iϕνββ += , where iν is
the term that may be distributed following any distribution from the exponential family.
The use of count data regressions is widespread in fields such as bio-statistics and
medicine. In the field of accident analysis, it has been used to explore the effects of changes in
9

road infrastructure and legislation concerning traffic accidents (Miaou and Lum 1993,
Scuffham et al, 2000), amongst others. In the case of industrial accidents, Filer and Golbe
(2003) use the methodology to calculate the relationship between a firms financial position
and investment in occupational safety, while Lanoie and Tortier (1998) apply it to test the
costs and benefits of mechanising a given production process.
In this study, the proposed models have been calculated utilising the Poisson-Gamma
mixture model, which is to say the Negative Binomial regression. At the same time, we have
considered a random parameter, which is associated with the constant term 0β . In the absence
of any variation in the observable explanatory variables, the number of accidents is
determined by the constant term. This magnitude, then, in some way measures the basic risk
inherent in the activity. In the case of panel data samples, the dichotomous variables
distinguishing each individual or firm are introduced for the purpose of adding or subtracting
a given amount from the constant term, which in turn measures the risk inherent in the
undertaking in question. This solution is not possible in the case of cross section data, because
the calculation cannot be performed with dichotomous variables and it is not possible to
control for individual effects by transforming the sample into the difference. The problem
persists, then, given that the diversity of the activities carried out by the firms in the sample
implies that the inherent risk is not the same in each. It is therefore always possible that some
non-observable heterogeneity will exist in the constant term. This heterogeneity can be
controlled for by introducing a random term. In this study, we have tried three specifications
for each random term of the constant (standard, triangular and uniform distribution) without
encountering substantial differences between the results obtained in each case. In the results
presented, we have opted for the coefficients calculated on the basis that the non-observable
heterogeneity term follows a normal distribution.
10
4. The empirical study
4.1 Data and sample
The data concerning prevention measures and the basic organisational characteristics
of the firms were obtained through a survey of 213 industrial facilities employing over 30
workers. These firms all conduct their operations in Navarre, an autonomous community in
northern Spain. This helps to keep the homogeneity of the sample because safety and health
conditions are largely affected by the general policies on the management of risk prevention
established by the Public Administration of Navarre, which is the competent authority on
matters concerning occupational health and hygiene.
The fieldwork was financed by the Navarre Institute for Occupational Health. The
questionnaire used was based on personal interviews with prevention officers, human
resources officers and plant managers held in May and June 2003. The sample obtained is
representative for industry in Navarre. Table 1 reflects the distribution of the firms comprising
the sample.
[Insert Table 1 about here]
The information obtained is novel in various respects. In the first place, it allows the
identification of internal causes and factors determining the intensity and orientation of risk
prevention measures implemented in different firms. Currently, the only source of
information that is in some way related with the measures taken by firms to prevent industrial
accidents and/or occupational illnesses are the audits performed by the competent authorities.
These audits record breaches and/or non-compliance with the law. Numerous earlier studies
have employed the number of breaches and/or instances of non-compliance as an indicator of
the preventive effort made by a firm (see amongst others, Bartel and Thomas, 1985; Viscusi,
1986; Lanoie, 1992; Weil, 1996; Maré and Papps, 2002). They usually seek to estimate
changes in prevention measures caused by past inspections of the firm. There are, however,
11
two key limitations on estimates of prevention based on the number of contraventions and/or
non-compliance with legislation. The first of these is that the quantified preventive effort is
confined to the measures necessary to comply with occupational health and safety legislation.
Consequently, any preventive effort made by a firm above and beyond the basic legal
requirements will be ignored. This measure, then, fails to differentiate between firms that
merely comply with minimum legal requirements and those that further develop or improve
upon such standards. It is a confirmed fact that many firms in fact do develop and improve
upon the minimum standards required by law, usually as a result of negotiations with trade
unions, implementing enhanced preventive measures. Secondly, using the number of
infringements of the law provides no information about the orientation or nature of the
preventive measures applied by each company.
Another new feature of the database we have prepared is that it relates the internal
organisational characteristics of each firm to the orientation and intensity of the preventive
measures implemented and to the accident rate. On the national level, the data contained in
the National Work Conditions Survey (ENCT) allows a diagnosis of work conditions,
perceptions of risk and the preventive action taken by the worker. The scope of the sample
and the nature of the information mean that the ENCT is one of the most complete and
sophisticated surveys worldwide. However, this data refers only to the results of prevention.
Finally, data on the number of accidents occurring at each facility was provided by the
Navarre Institute for Occupational Health.
4.2 Variables
The dependent variable in the regression model is the number of workplace accidents. We
have included a series of explanatory variables related with the level of risk prevention in the
firm and a number of organisational factors, which we describe below. We also control for the
size of the firm by including the number of workers as a control variable (SIZE).
12

4.2.1 Intensity of preventive activities (PREV)
One of the innovations of this study is the construction of a variable that reflects the
intensity of the firm’s effort in risk prevention. Earlier studies always take some isolated
component of preventive action, which is to say they do not systematize or measure
prevention through a general indicator. The variable reflecting the intensity with which firms
seek to prevent occupational risks is constructed on the basis of the six preventive
dimensions, as follows:
i) Measures and activities designed to eliminate or minimize risks at source. In the
questionnaire, we asked about four complementary practices usually designed to reduce risks
at source in the most hazardous tasks (see Q1 in Table 2). We construct the SOURCE variable
as the sum of the number of practices implemented by each firm and therefore takes a value of
between 0 and 4. Those firms that seek more intensively to prevent risks at source will obtain
a higher score for this variable.
ii) Training, communication and workers participation. To measure the effort made by
the firm in these areas we use the responses to questions Q2, Q3 and Q4 in Table 2, which
have been coded as follows. In the first place, a score of 1 is assigned to all firms making a
higher than average effort in each type of action and a score of 0 to those making less effort.
We then summed the three variables resulting from this coding to obtain the INTEGRA
variable, which identifies firms making an above average effort in each of the three actions on
a scale of 0-3. We consider that firms with training, communication and involvement systems
capable of exploiting the integration of these three measures will obtain higher scores in the
INTEGRA variable.
iii) Risk control. The effort made by firms in activities intended to control risks is
measured using an additive scale, which includes specific scores for four items (see questions
13
Q5 to Q8 in Table 2). In the first place, a score of 1 was assigned to all firms undertaking
periodic reviews with special intensity (Q5). A further point was allocated in the scale to
those firms in which responsibility for the control system is shared between at least one
prevention officer and the officer in charge of the work unit (Q6). This dual responsibility for
reviews is a factor associated with greater intensity and effectiveness in the process. Finally,
we assigned a score of 1 to all firms making an above average effort to control both
psychosocial risks (Q7) as well as in overseeing health and safety (Q8). Hence, the firms with
a higher overall score for the CONTROL variable make a greater effort to control a diverse
range of risks.
• Actions taken in view of foreseeable changes. The survey seeks information about
the number of members in teams charged with analysing the workplace health and safety
repercussions of new facilities and assets. The OPEN measure is defined by the number of
agents concerned in the working group (Q9 in Table 2). More diverse teams (those including
safety and health representatives, workers, supervisors, suppliers and managers) are
characteristic of open and involving risk prevention systems.
• Documentation. The effort made to document prevention activities is measured via
the number of accident/incident indices kept and calculated (Q10 in Table 2). We consider
that the effort made will be greater to the extent that firms keep and calculate a larger number
of accident indices, resulting in a higher score for the DOCU variable.
• Emergency prevention, preparedness and response. Finally, we measure the effort
invested by firms in preventive action aimed at reducing the occupational risk caused by
foreseeable events. Firms responding that they review the functioning of proposed emergency
procedures at least once per year were assigned a score of 1 (Q11 in Table 2). The
EMERGENCY index is the sum of the results for the proposed plans to deal with
emergencies arising from series and imminent risks, first aid measures and/or medical
14
assistance and evacuation drills. Firms that revise these three mechanisms with the proposed
frequency are assigned higher scores in this index.
The preventive intensity index (PREVENTION) is defined as the arithmetic mean of
the scores obtained by the firms in all six dimensions explained above. In terms of internal
reliability, the PREVENTION index displays a Cronbach’s alpha of 0.70.
[Insert Table 2 about here]
4.2.2. The orientation of the preventive action
We have defined the categorical variable INNOV to identify firms that make a more
intensive preventive effort in the more innovative dimensions. For this purpose, we have
created an additive index for the scores obtained in the dimensions: integration of training,
information and involvement (INTEGRA variable), and (ii) the openness of teams set up to
consider foreseeable changes in relation to risk prevention (OPEN). We consider that firms
with a score above the 75 percentile in this index make a more intense preventive effort in the
innovative dimensions. These firms were assigned a score of 1 in the INNOV variable, and
the rest a score of 0.
4.2.3 Quality management
The survey asked whether or not the firm employed any set of quality management
tools. Those responding in the affirmative were then asked about the intensity with which this
technique is applied. The resulting scores were ranked on a scale of 1-10 from low to high
implementation. These tools are defined in the first column of Table 3. Based on this
information, we have constructed an indicator, identified as QUALITY, which is defined as
the arithmetic mean of the responses given to the question concerning the level of application
and implementation of quality management techniques. This indicator varies on a scale from
0 to 10, and it may be interpreted as a measure of the level of development of quality
15

management in the firm concerned. The index has a high level of internal reliability,
displaying a Cronbach’s alpha of 0.87.
[Insert Table 3 about here]
(iii) Technology and production system
As in the preceding case, the questionnaire asked whether or not the firm used a given
set of technologies traditionally associated with manufacturing processes (Ward and Duray,
2000). Those responding in the affirmative were then asked about the intensity with which the
techniques were applied. The resulting scores were ranked on a scale of 1-10 from low to high
implementation.
We have constructed the TECH indicator to encapsulate the level of technology used in
the production process. This new variable is defined as the arithmetic mean of responses to
the question concerning the level of utilisation and implementation of the technologies
defined in the second column of Table 3. Then, this indicator varies on a scale of 0 to 10. In
terms of internal reliability, the index displays a Cronbach’s alpha of 0.85.
(v) Work organisation and workers empowerment
Firms were asked about the level (from zero to ten) at which their workers carry out
each of the activities defined in column 3 of Table 3. We construct an index of worker
empowerment (EMPOW) as the arithmetic mean of these responses. This indicator has a high
internal reliability (Cronbach’s alpha of 0.72).
5. Results of the econometric analysis
In order to estimate the relationship between our explanatory variables and the occupational
safety we define the following model
16

)***
exp(
8765
43210
j
j
SIZEINNQUALINNEMPOWINNTECH
TECHEMPOWQUALPREVa
εββββ
βββββ
+++++
+++++= [4]
where aj is the number of accidents in firm j and ej is the error term. The result of the
estimation of [4] by means of negative binomial regression is shown in Table 4.
[Insert Table 4 about here]
The negative sign and significance of the coefficient associated to the variable PREV
(β1) indicates that prevention activities are inversely related to firms’ accident rates. This
confirms hypothesis H1. That is, prevention effort represents an effective tool for reducing the
firm’s accident rate, whatever its nature and orientation. Further, the sign of the coefficients
associated to the organisational factors (β2,β3,β4), meanwhile, confirm our hypotheses H2, H4
and H6.
Hence, the negative sign of the coefficient associated to QUALITY (β2) implies an
inverse relationship between the implementation of quality management tools and
occupational risk. The preventive foundations underlying quality management practices
permit a simultaneous improvement in process quality and reduction in the accident rate. To
some extent, this may be interpreted as meaning that a fall in the occupational accident rate is
a further manifestation of quality gains. If the aim of achieving quality is to remove deviations
in the production process, it is clear that the occurrence of an accident is an unforeseen and
undesirable situation. Meanwhile, the implementation of quality control mechanisms reduces
failures in the system, including workplace accidents.
Similar conclusions can be derived from the sign of β3, which confirms that the
enhancement of workers empowerment unambiguously contribute to reducing occupational
accident rates. That is, the design of richer and more autonomous jobs requiring higher level
of workers responsibilities are associated with lower number of accidents.
17
By contrast, the positive sign and significance of β4 confirms that firms with more
flexible and automated production technologies are affected by higher accident rates. This
result suggests that the pace and speed of adjustment of such production systems worsen risk
conditions, making it necessary to design effective prevention mechanisms to cushion the
negative impact of new technologies on occupational risk.
The existence of complementarities between the innovative orientation of preventive
action and the organisational variables is captured by the coefficients associated to the
interactive terms. As Table 4 shows, the negative sign of the coefficient β5 indicates that
innovative prevention generates downward movement in the accident rate when it is
combined with advanced manufacturing technology. This confirms hypothesis H3. That is,
firms can improve occupational safety by accompanying the automation and the adoption of
flexible manufacturing technologies with the implementation of suitable preventive activities,
namely openness of prevention system and the integration of occupational risk prevention
with production activities.
The sign and significance of coefficient β6 confirms the existence of a synergy effect
between innovative risk prevention and higher worker empowerment, as established in our
hypothesis H7. This results show that a firm deciding to organise work by expanding the
variety of tasks and increasing workers’ responsibility for them will find that opening up its
prevention system provides an effective mechanism to reduce the accident rate. The
innovative prevention dimensions (openness and integration of preventive actions) provide
the vehicle for obtaining additional gains in the reduction of occupational risks. By contrast,
coefficient β6 does not reveal the existence of any significant effect resulting from the
combination of advanced quality management and the innovative preventive effort. We
cannot then accept hypothesis H5.
18
Finally, the significance of the overdispersion parameter in the proposed model
confirms the inequality of the mean and the sample variance, which justifies the choice of the
negative binomial regression. Further, the significance of the ϕ coefficient confirms the need
to control for non-observable heterogeneity associated with the constant term.
6. Conclusions
In this paper we have analysed the relationship between organisational factors and preventive
measures with the number of occupational injuries. We have calculated a negative binomial
regression based on a sample of 213 industrial firms in Spain, defining a constant random
parameter to take account of non-observable heterogeneity.
In the first place, our results confirm that the intensity of occupational risk prevention
is crucial to reducing the number of accidents. Secondly, we have identified two
organisational factors that contribute clearly to lowering the level of occupational risk. These
are the implementation of quality management tools, and work organisation models featuring
worker empowerment. Thirdly, we have observed that in the absence of innovative preventive
practices, firms with more flexible and automated production technologies are affected by
higher accident rates.
Finally, we have identified a clear synergy between innovative prevention practices
and workers empowerment as well as with flexible manufacturing systems. In both cases,
workers concentrate the benefits of training, information and involvement in the development
of tasks requiring a higher level of responsibility. Our results suggest that a synergy is
obtained by implicating the more skilled labour force in the occupational safety and health
management system.
19
Acknowledgements The authors acknowledge financial support by the Navarre Institute for Occupational Health,
and the Spanish Ministry of Education and Science under the project SEJ2004-07242-C03-02.
References Bartel, A.P, Thomas, L.C., 1987. Predation through Regulation: The wage and profit effects
of the Occupational Safety and Health Administration and Environmental Protection
Agency. Journal of Law and Economics 30: 239-264.
Becker, B.E., Huselid, M.A., 1998. High performace work systems and firm perfomance.
Research and Human Resources Management 16: 53-101.
Beechner, A.B., Kock, J.E., 1997. Integrating ISO 9001 and ISO 14001. Quality Progress 30:
33-36.
Breslow, J.E., 1984. Extra-Poisson variation in log linear models. Applied Statistics 33: 38-
44.
Cameron, C., Trivedi, P.K., 1999. Regression Analysis of Count Data, Cambridge University
Press.
Chew D., 1988. Effective occupational safety activities: findings in three Asian developing
countries. International Labour Review 127: 111-124.
Cohen, A., 1977. Factors in successful occupational safety programs. Journal of Safety
Research 9: 168-178.
Fahmeir, L., Tutz, G., 1994. Multivariate Statistical Modelling Based on Generalized Linear
Models, Springer Series in Statististics. Springer Verlarg.
Filer, R.K., Golbe, D.L, 2003. Debt, Operating Margin, and Investment in Workplace Safety.
The Journal of Industrial Economics 51: 359-381.
Frieling E., Freiboth M., Henniges D., Saager C., 1997. Effects of team work on the working
conditions of short cycled track work: A case study from the European automobile
industry. International Journal of Industrial Ergonomics 20: 371-388.
Greenwood, M., Yule, G.U., 1920. An Inquiry into the Nature of Frequency Distributions of
Multiple Happenings, with Particular Reference to the Ocurrence of Multiple Attacks of
Disease or Repeated Accidents. Journal of the Royal Statistical Society 83: 255-279.
20

Habeck, R. Leahy, M.J, Hunt, H.A, Chan, F., Welch, E.M., 1991. Employer factors related to
workers compensation claims and disability management. Rehabilitation Counselling
Bulletin 34: 210-226.
Hale, A.R., Hovden, J., 1998. Management and Culture: The third age of safety. A review of
approaches to organizational aspects of safety, health and environment. In Feyer, A.M.,
Williamson, A.M. Occupational Injury: Risk, Prevention and Intervention, Taylor and
Francis, London, pp. 129-165.
Harrison, D., Legendre, C., 2003. Technological innovations, organizational change and
workplace accident prevention. Safety Science 41: 319-338.
Hunt, H., Habeck, R.V., 1993. The Michigan Disability Prevention Study: Research
Highlights. Upjohn Institute for Employment Research, Kalamazoo, MI.
Ichniowski, C., Kochan, T.; Levine, D., Olson, C., Strauss, G., 1996. What Works at Work.
Industrial Relations 35: 299-333.
Kaminski, M., 2001. Unintended Consequences: Organizational Practices and Their Impact
on Workplace Safety and Productivity. Journal of Occupational Health Psychology 6:
127-138.
Landsbergis, P. Cahill, J., Schnall, P., 1999. The impact of lean production and related new
systems of work organization on worker health. Journal of Occupational Health
Psycology 4: 108-130.
Lanoie, P., Trottier, L., 1998. Cost and Benefits of Preventing Workplace Accidents: Going
from Mechanical to a Manual Handling System. Journal of Safety Research 29: 65-75.
Lanoie, P., 1992. Safety Regulation and the Risk of Workplace Accidents in Quebec.
Southern Economic Journal 58: 1950-1965.
Maré, D., Papps, K., 2003. The effects of occupational safety and health interventions. Labour
Market Bulletin 2000-2002. Special Issue: 101-131. Department of Labour of New
Zealand.
Miaou, S.P., Lum, H., 1993. Modeling vehicle accidents and highway geometric design
relationship Accident Analysis and Prevention 25: 689-709.
Nelder, J.A., Wedderburn, R.W.M., 1972. Generalized Linear Models. Journal of the Royal
Statistical Society C 19: 92-100.
NIOSH, 2002. The Changing Organization of Work and The Safety and Health of Working
People. Publication No.2002-16. National Institute for Occupational Safety and Health.
Cincinnati, OH.
21

Rahimi, M., 1995. Merging strategic safety, health and environment into total quality
management. International Journal of Industrial Ergonomics 16: 83-94.
Roy, M., 2003. Self-Directed work teams and safety: A winning combination? Safety Science
41: 359-379.
Scuffham, P. Alsop, J. Cryer, C., Langley, J., 2000. Head injuries to bicyclist and the New
Zealand bicycle helmet Law. Accident Analysis and Prevention 32: 565-573.
Shannon, H. Walters, V, Lewchuk W, Richardson J, Moran LA, Verma D., Haines, T., 1996.
Workplace organizational correlates of lost-time accident rates in manufacturing.
American Journal of Industrial Medicine 29: 258-268.
Shannon, H. Robson, L.S., Sale J.M., 2001. Creating safer and healthier workplaces: Role of
organizational factors and job characteristics. American Journal of Industrial Medicine
40: 319-334.
Simard, M., Marchand, A., 1996. Participation des travailleurs à la sécurité et taux d'accidents
du travail. Psychologie du travail et des organisations 2: 34-44.
Simonds, R.H., Shafai-Sahrai, Y., 1977. Factors apparently affecting injury frequency in
eleven matched pairs of companies. Journal of Safety Research 9: 120-127.
Viscusi, W. K., 1986. The impact of Occupational Safety and Health Regulation 1973-1983.
Rand Journal of Economics 17: 567-580.
Ward, P.T., Duray, R. 2000. Manufacturing strategy in context: Environment, competitive
strategy and manufacturing strategy. Journal of Operations Management 18: 123-138.
Weil, D. 1996. If OSHA is so bad, why is compliance so good? Rand Journal of Economics
27: 567-580.
Zacharatos, A., Barling, J., Iverson, R.D.,, 2005. High-Performance Work Systems and
Occupational Safety. Journal of Applied Psychology 90: 77-93.
22
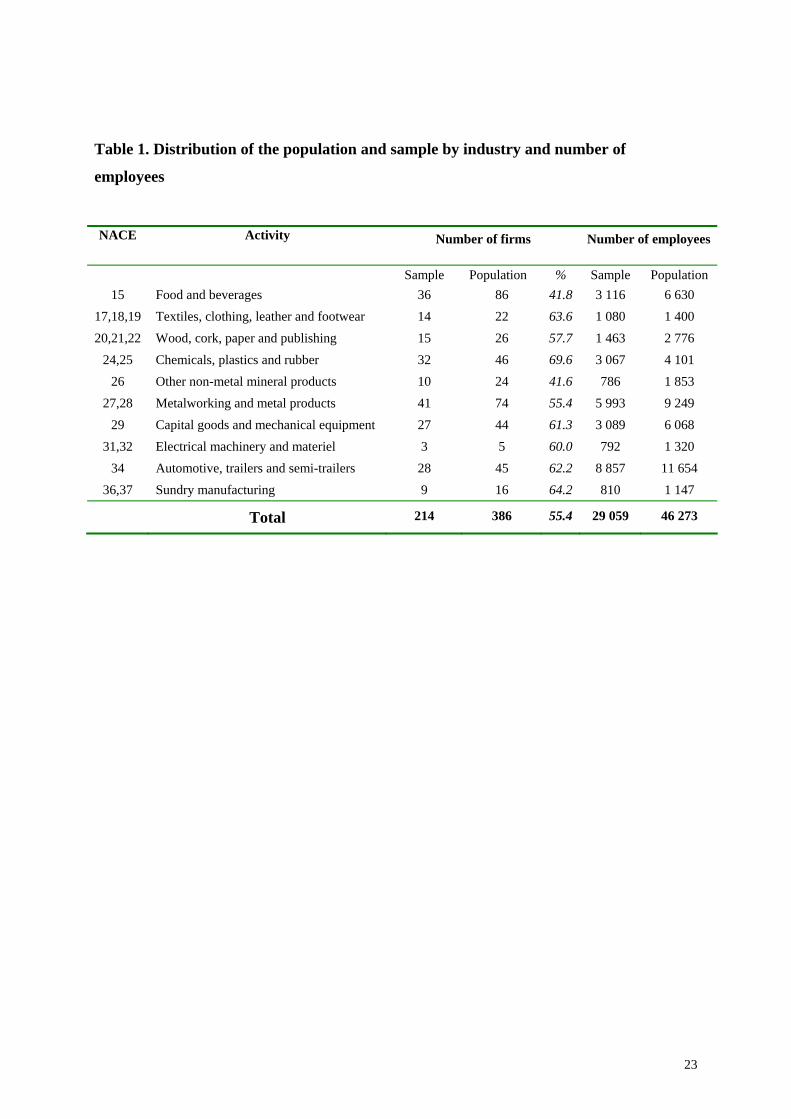
Table 1. Distribution of the population and sample by industry and number of
employees
NACE Activity Number of firms Number of employees
Sample Population % Sample Population 15 Food and beverages 36 86 41.8 3 116 6 630
17,18,19 Textiles, clothing, leather and footwear 14 22 63.6 1 080 1 400 20,21,22 Wood, cork, paper and publishing 15 26 57.7 1 463 2 776
24,25 Chemicals, plastics and rubber 32 46 69.6 3 067 4 101 26 Other non-metal mineral products 10 24 41.6 786 1 853
27,28 Metalworking and metal products 41 74 55.4 5 993 9 249 29 Capital goods and mechanical equipment 27 44 61.3 3 089 6 068
31,32 Electrical machinery and materiel 3 5 60.0 792 1 320 34 Automotive, trailers and semi-trailers 28 45 62.2 8 857 11 654
36,37 Sundry manufacturing 9 16 64.2 810 1 147
Total 214 386 55.4 29 059 46 273
23

Table 2. The assessment of preventive action. Q1. In the performance of the more hazardous tasks:
Control and supervision is intensified 1
A specific task process is designed 2
Specialists are trained/contracted 3
More intensive signage is used 4
There are no especially hazardous tasks 5
Don’t know 9
Q2. At what moment or in what situations does a worker receive information about prevention? (Note: more than one answer may be chosen) Upon joining the firm 1
In his/her work plan (daily or weekly) 2
In each production cycle or period (monthly or quarterly) 3
Upon changing job or task 4
When the technology or organisation of tasks changes 5
Don’t know 9
Q3. What communication channels do employees use to contribute to the evaluation and prevention of occupational risks? (NOTE: Please, answer 0-10 depending on how much the channel is used) Specific groups set up to analyse issues
Suggestions systems incentivizing comments and recommendations
Formal prevention questionnaires and studies
Informal channels via immediate supervisors
Q4. Which group of employees receives specific occupational risk prevention training from the firm? Please, use a scale of 0-10 with 0 indicating no training and 10 the maximum possible level. Workers performing the most hazardous tasks
Officers in charge of units (managers or supervisors)
Employees of subcontracting firms
Self-employed workers
Workers contracted directly by the firm
Q5. What are the objectives of periodic occupational safety reviews? (NOTE: Please, answer from 0-10 depending on the level of priority. 0 indicates minimum and 10 maximum priority) Correct, safe performance of tasks
Ensure technology remains in good condition
Working conditions (tidiness and cleanliness of the workplace)
Worker preparation (health, training, skills, etc.)
Q6. Who is the officer or team responsible for periodic occupational health and safety reviews
A specialist risk prevention officer or team 1
The quality officer or team 2
The maintenance officer or team 3
The work unit supervisor or manager 4
Don’t know 9
24

Table 2 (continued) Q7. Please, score the effort made by your firm to deal with the following from 0-10: Repetitive movements
Bad posture
Handling of heavy loads
Long periods of immobility
Mental fatigue in tasks requiring intense concentration
Boredom and/or routine
Adaptation of rigid shifts to the personal needs of employees
Q8. Please, indicate the specific risks to workers’ health and safety checked in medical examinations arranged by the firm Ergonomics 1
Noise 2
Exposure to hazardous chemicals 3
Screens 4
Manual load handling 5
Psychosocial 6
Other 7
Don’t know 9
Q9. Who is the officer or team responsible for analysing the repercussions of new installations and equipment for occupational health and safety: (NOTE: Please, indicate ALL participants) The supplier 1
The prevention department 2
The officer in charge of the unit making the investment 3
The work unit supervisor or manager 4
The workers concerned 5
Don’t know 9
Q10. What accident indices are kept and calculated?
Incident index (total accidents/average number of people at risk) 1
Frequency index (working days lost/total man-hours worked) 2
Severity index (working days lost/total man-hours worked) 3
Average duration (working days lost / number of accidents) 4
None 5
Don’t know 9
Q11. How often is the functioning of the following eme gency procedures reviewed: r Never Occasion-
ally Once per
year Twice per
year More than twice per
year
Don’t know
Emergency plans for serious, immanent risks (breakage, spillage, electrical problems,…)
1
2
3
4
5
9
First aid measures / medical care 1
2
3
4
5
9
Evacuation drills (fire, serious contamination, flooding…)
1
2
3
4
5
9
25

Table 3. Identification of organisational factors
1. QUALITY MANAGEMENT 2. PRODUCTION TECHNOLOGY AND
ORGANISATION
3. WORK ORGANISATION
Could you tell me which of the following quality management techniques are currently in place at this facility? Please, use a scale of 0 to 10 with 0 indicating no implementation and 10 maximum implementation. Please, indicate if any of the techniques mentioned are not applicable at the plant.
What is the level of implementation of the following technologies in this facility? Please, use a scale of 0 to 10 with 0 indicating no implementation and 10 maximum implementation. Please, indicate if any of the techniques mentioned are not applicable at the plant.
To what extent do direct (not all) workers at your plant perform the following tasks in the course of their normal work? Please, use a scale from 0 to 10 (where 0 means that they never perform the task and 10 that they do so frequently).
Basic statistical techniques (“histograms”, “Pareto”, “cause-effect diagrams”, etc.)
Robots or programmable automata
Preparation of the machinery used
Experiment design (“Taguchi”, “ANOVA”)
Automated systems for the storage of materials (AS/RSs)
Maintenance of equipment
Failure Mode and Effects Analysis (FMEA)
Computer assisted design (CAD) and/or computer assisted engineering (CAE)
Analysis of work data
Error prevention systems (“poka-yoke”)
Computer integrated manufacturing (CIM)
Autonomous planning and organisation of work
Engineering and value analysis MRP Collaboration in training new workers
5S Methodology JIT at plant (kanban) Collaboration in the introduction of new technology
Control of quality costs LAN computer for use at the plant
Participation in job design
QFD (Quality Function Deployment)
Business process management (BPM)
Statistical process control (SPC)
26

Table 4. Estimates of Negative Binomial Regression.
Variable Coefficient1
Constante (β0) -1.553** (.172)
))(( nkϕ .229** (.032)
PREV (β1) -1.137* (.518)
QUAL (β2) -.190** (.035)
EMPOW (β3) -.060* (.034)
TECH (β4) .148** (.039)
TECH*INN (β5) -.150* (.074)
EMPOW*INN (β6) -.162* (.062)
QUAL*INN (β7) .103 (.066)
SIZE (β8) .834** (.038)
Overdispersion parameter 2.843** (.231)
Log Likelihood
Chi Squared
-653.23
651.16
1Standard errors are in parenthesis. **Significant at the 1% level; * Significant at the 5% level
27
Edicions / Issues: 95/1 Productividad del trabajo, eficiencia e hipótesis de convergencia en la industria
textil-confección europea Jordi López Sintas
95/2 El tamaño de la empresa y la remuneración de los máximos directivos
Pedro Ortín Ángel 95/3 Multiple-Sourcing and Specific Investments
Miguel A. García-Cestona 96/1 La estructura interna de puestos y salarios en la jerarquía empresarial
Pedro Ortín Ángel 96/2 Efficient Privatization Under Incomplete Contracts
Miguel A. García-Cestona Vicente Salas-Fumás
96/3 Institutional Imprinting, Global Cultural Models, and Patterns of
OrganizationalLearning: Evidence from Firms in the Middle-Range Countries Mauro F. Guillén (The Wharton School, University of Pennsylvania)
96/4 The relationship between firm size and innovation activity: a double decision
approach Ester Martínez-Ros (Universitat Autònoma de Barcelona) José M. Labeaga (UNED & Universitat Pompeu Fabra)
96/5 An Approach to Asset-Liability Risk Control Through Asset-Liability Securities
Joan Montllor i Serrats María-Antonia Tarrazón Rodón
97/1 Protección de los administradores ante el mercado de capitales: evidencia empírica
en España Rafael Crespí i Cladera
97/2 Determinants of Ownership Structure: A Panel Data Approach to the Spanish Case
Rafael Crespí i Cladera 97/3 The Spanish Law of Suspension of Payments: An Economic Analysis From
Empirical Evidence Esteban van Hemmen Almazor
98/1 Board Turnover and Firm Performance in Spanish Companies
Carles Gispert i Pellicer 98/2 Libre competencia frente a regulación en la distribución de medicamentos:
teoría y evidencia empírica para el caso español Eva Jansson
98/3 Firm’s Current Performance and Innovative Behavior Are the Main Determinants of
Salaries in Small-Medium Enterprises Jordi López Sintas y Ester Martínez Ros
98/4 On The Determinants of Export Internalization: An Empirical
Comparison Between Catalan and Spanish (Non-Catalan) Exporting Firms Alex Rialp i Criado
98/5 Modelo de previsión y análisis del equilibrio financiero en la empresa
Antonio Amorós Mestres 99/1 Avaluació dinàmica de la productivitat dels hospitals i la seva descomposició en
canvi tecnològic i canvi en eficiència tècnica Magda Solà
99/2 Block Transfers: Implications for the Governance of Spanish Corporations
Rafael Crespí, and Carles Gispert 99/3 The Asymmetry of IBEX-35 Returns With TAR Models
M.ª Dolores Márquez, César Villazón 99/4 Sources and Implications of Asymmetric Competition: An Empirical Study
Pilar López Belbeze 99/5 El aprendizaje en los acuerdos de colaboración interempresarial
Josep Rialp i Criado 00/1 The Cost of Ownership in the Governance of Interfirm Collaborations
Josep Rialp i Criado, i Vicente Salas Fumás 00/2 Reasignación de recursos y resolución de contratos en el sistema concursal español
Stefan van Hemmen Alamazor 00/3 A Dynamic Analysis of Intrafirm Diffusion: The ATMs
Lucio Fuentelsaz, Jaime Gómez, Yolanda Polo 00/4 La Elección de los Socios: Razones para Cooperar con Centros de Investigación y
con Proveedores y Clientes Cristina Bayona, Teresa García, Emilio Huerta
00/5 Inefficient Banks or Inefficient Assets?
Emili Tortosa-Ausina 01/1 Collaboration Strategies and Technological Innovation: A Contractual Perspective of
the Relationship Between Firms and Technological Centers Alex Rialp, Josep Rialp, Lluís Santamaria
01/2 Modelo para la Identificación de Grupos Estratégicos Basado en el Análisis
Envolvente de Datos: Aplicación al Sector Bancario Español Diego Prior, Jordi Surroca
01/3 Seniority-Based Pay: Is It Used As a Motivation Device?
Alberto Bayo-Moriones 01/4 Calidad de Servicio en la Enseñanza Universitaria: Desarrollo y Validación de una
Escala de Medida. Joan-Lluís Capelleras, José M.ª Veciana

01/5 Enfoque estructural vs. recursos y capacidades: un estudio empírico de los factores clave de éxito de las agencias de viajes en España. Fabiola López-Marín, José M.ª Veciana
01/6 Opción de Responsabilidad Limitada y Opción de Abandonar: Una Integración para
el Análisis del Coste de Capita. Neus Orgaz
01/7 Un Modelo de Predicción de la Insolvencia Empresarial Aplicado al Sector Textil y
Confección de Barcelona (1994-1997). Antonio Somoza López
01/8 La Gestión del Conocimiento en Pequeñas Empresas de Tecnología de la
Información: Una Investigación Exploratoria. Laura E. Zapata Cantú
01/9 Marco Institucional Formal de Creación de Empresas en Catalunya: Oferta y
Demanda de Servicios de Apoyo David Urbano y José María Veciana.
02/1 Access as a Motivational Device: Implications for Human Resource Management.
Pablo Arocena, Mikel Villanueva 02/2 Efficiency and Quality in Local Government. The Case of Spanish Local Authorities
M.T. Balaguer, D. Prior, J.M. Vela 02/3 Single Period Markowitz Portfolio Selection, Performance Gauging and Duality: A
variation on Luenberger’s Shortage Function Walter Briec, Kristiaan Kerstens, Jean Baptiste Lesourd
02/4 Innovación tecnológica y resultado exportador: un análisis empírico aplicado al
sector textil-confección español Rossano Eusebio, Àlex Rialp Criado
02/5 Caracterización de las empresas que colaboran con centros tecnológicos
Lluís Santamaria, Miguel Ángel García Cestona, Josep Rialp 02/6 Restricción de crédito bancario en economías emergentes: el caso de la PYME en
México Esteban van Hemmen Almazor
02/7 La revelación de información obligatoria y voluntaria (activos intangibles) en las
entidades de crédito. Factores determinantes. Gonzalo Rodríguez Pérez
02/8 Measuring Sustained Superior Performance at the Firm Level
Emili Grifell - Tatjé, Pilar Marquès - Gou 02/9 Governance Mechanisms in Spanish Financial Intermediaries
Rafel Crespi, Miguel A. García-Cestona, Vicente Salas 02/10 Endeudamiento y ciclos políticos presupuestarios: el caso de los ayuntamientos
catalanes Pedro Escudero Fernández, Diego Prior Jiménez

02/11 The phenomenon of international new ventures, global start-ups, and born-globals:what do we know after a decade (1993-2002) of exhaustive scientific inquiry?Àlex Rialp-Criado, Josep Rialp-Criado, Gary A. Knight
03/1 A methodology to measure shareholder value orientation and shareholder value
creation aimed at providing a research basis to investigate the link between both magnitudes Stephan Hecking
03/2 Assessing the structural change of strategic mobility. Determinants under
hypercompetitive environments José Ángel Zúñiga Vicente, José David Vicente Lorente
03/3 Internal promotion versus external recruitment: evidence in industrial plants
Alberto Bayo-Moriones, Pedro Ortín-Ángel 03/4 El empresario digital como determinante del éxito de las empresas puramente
digitales: un estudio empírico Christian Serarols, José M.ª Veciana
03/5 La solvencia financiera del asegurador de vida y su relación con el coste de capital
Jordi Celma Sanz 03/6 Proceso del desarrollo exportador de las empresas industriales españolas que
participan en un consorcio de exportación: un estudio de caso Piedad Cristina Martínez Carazo
03/7 Utilidad de una Medida de la Eficiencia en la Generación de Ventas para la
Predicción del Resultado María Cristina Abad Navarro
03/8 Evaluación de fondos de inversión garantizados por medio de portfolio insurance
Sílvia Bou Ysàs 03/9 Aplicación del DEA en el Análisis de Beneficios en un Sistema Integrado
Verticalmente Hacia Adelante Héctor Ruiz Soria
04/1 Regulación de la Distribución Eléctrica en España: Análisis Económico de una
Década, 1987-1997 Leticia Blázquez Gómez; Emili Grifell-Tatjé
04/2 The Barcelonnettes: an Example of Network-Entrepreneurs in XIX Century Mexico.
An Explanation Based on a Theory of Bounded Rational Choice with Social Embeddedness. Gonzalo Castañeda
04/3 Estructura de propiedad en las grandes sociedades anónimas por acciones.
Evidencia empírica española en el contexto internacional Rabel Crespí; Eva Jansson
05/1 IFRS Adoption in Europe: The Case of Germany.
Soledad Moya, Jordi Perramon, Anselm Constans
05/2 Efficiency and environmental regulation: a ‘complex situation’ Andrés J. Picazo-Tadeo, Diego Prior
05/3 Financial Development, Labor and Market Regulations and Growth Raquel Fonseca, Natalia Utrero 06/1 Entrepreneurship, Management Services and Economic Growth Vicente Salas Fumás, J. Javier Sánchez Asín 06/2 Triple Bottom Line: A business metaphor for a social construct Darrel Brown, Jesse Dillard, R. Scott Marshall 06/3 El Riesgo y las Estrategias en la Evaluación de los Fondos de Inversión de Renta
Variable Sílvia Bou 06/4 Corporate Governance in Banking: The Role of Board of Directors Pablo de Andrés Alonso, Eleuterio Vallelado González 06/5 The Effect of Relationship Lending on Firm Performance Judit Montoriol Garriga 06/6 Demand Elasticity and Market Power in the Spanish Electricity Market Aitor Ciarreta, María Paz Espinosa 06/7 Testing the Entrepreneurial Intention Model on a Two-Country Sample Francisco Liñán, Yi-Wen Chen 07/1 Technological trampolines for new venture creation in Catalonia: the case of the
University of Girona Andrea Bikfalvi, Christian Serarols, David Urbano, Yancy Vaillant 07/2 Public Enterprise Reforms and Efficiency in Regulated Environments: the Case of the
Postal Sector Juan Carlos Morales Piñero, Joaquim Vergés Jaime 07/3 The Impact of Prevention Measures and Organisational Factors on Occupational
Injuries Pablo Arocena, Imanol Núñez, Mikel Villanueva


![TERRORISM PREVENTION AND INVESTIGATION MEASURES IN … · Terrorism Prevention and Investigation Measures [TPIMs] are restrictions imposed on individuals by a TPIM notice. Their primary](https://static.fdocuments.in/doc/165x107/5f0634db7e708231d416d468/terrorism-prevention-and-investigation-measures-in-terrorism-prevention-and-investigation.jpg)